
Coastal adaptation methods to sea level rise
Rising with the tide

2 Universityat2022
of Copenhagen ECTS points of DepartmentScienceofGeosciences Natural Resource Management of Science (Msc) in Landscape Architecture - Urban Design

and
30
Master
Author: Louis Buerms Student nr: cfh125
Faculty
Supervisor:Submitted: Anna Aslaug Lund and Berit Kaae Title: Rising with the tide I Coastal adaptation methods to sea level rise All drawings, photos, maps , and diagrams were made by Louis Buerms unless specifically stated otherwise Master thesis
Abstract Coastlines all over the world are facing rising sea levels, more severe storm surges and flooding due to the changing climate. Rising sea levels pose a significant threat to coastal landscapes and coastal inhabitants. Resilient adaptation to sea level rise is a growing concern for coastal managers, engineers, ecologists, developers and designers. This thesis explores how a coastline can resiliently adapt to rising sea levels, more severe storms, erosion and beach degradation and how this can be articulated in a design. Site-specific analysis of existing coastal protection technologies was carried out, highlighting the advantages and disadvantages. Based on research (academic papers, articles and books ), traditional (hard) coastal defence structures appear outdated when creating resilient coastlines that can adapt to extreme events. There is more of a trend towards nature-based and soft solutions. The design part of the thesis shows how a multifunctional approach to coastal defence can be materialised. Not only technical solutions were sought, but also social, economic and recreatio nal ones. The design is based on thorough research and analysis aimed at adapting the coastline of Strøby Egede. The design intervention integrated traditional and innovative techniques to create a multifunctional protection method that benefits many. Finally, I discuss the intervention’s challenges, opportunities and shortcomings and provide a brief perspective on the future.
Fig. 1 Coastal protection includes protection from stormsurges and large waves. Photograph captured by Talibart, R. (2022). Photographs on cover and backcover of thesis by Waider. J. (2021)
3

4 Index INSIGHTAPPROACHESRESEARCHPROJECTINTRODUCTION06METHODS16ABSTRACT03THECHALLENGE12LOCATION18QUESTION15PROBLEMSTATEMENT40TOCOASTALMANAGEMENT63DESIGNCONCEPT88DISCUSSION114CONCLUSION120BIBLIOGRAPHY122COASTALPROTECTIONMETHODS65UNDERSTANDINGTHELANDSCAPE20INTOLOCALCOASTALPROCESSES30
5
Fig.2 Damage may increase in the future due to more powerful storm surges, which are often the greatest threat to life and property during a coastal storm as additional water is forced along the coastline. Photo taken by Talibart, R. (2022).

6 Coastlines worldwide are confronted with rising sea levels, storm surges and flooding due to the changing climate (IPCC, 2022). This reality and these future per spectives make it necessary to mitigate climate chan ge and adapt coastal landscapes to rising water levels (Riesto et al., 2021). The social and economic importance of the coasts has always been and still is high in Denmark, and the ex pected climate change on the coasts is, therefore, a fundamental social challenge (Rasmussen, 2019). We need to strike a balance that accommodates both the coast’s dynamic ecosystems (fig. 3) and our aspirati ons for developing the coasts and, in particular, the coastal cities. INTRODUCTION
Integration of a dynamic ecosystem, in this case an estuary, and the economic development of oys ter farms in north-western France. Oyster farms have the capacity to absorb wave energy, reducing the impact of the waves on the coastline (Oyster-Tecture, 2019). Photograph captured by Hegen, T. (2021).

Fig. 3
7
Flooded
Denmark has a surface area of about 42,925 km2 and a coastline of 8,750 km, of which almost 1,800 km are protected by dikes or other permanent technical installations (Faragò et al., 2018). The long stretch of coastline is one of the most extended in the world compared to the land’s size. Therefore, Denmark will be significantly affected by climate change in terms of an increase in heavy storm surge events, sea level rise (fig.5) and an increase in heavy rainfalls (Arnb jerg-Nielsen, 2006).
8
Fig.4. Map of flooded areas in Denmark with a sea level rise up to 250 cm

Fig. 5 A lonesome tree swallowed by the rising tides of the ocean. Photograph by Koublis, P. (2022).

9
An analysis carried out by COWI (2017) investigated the areas at risk in Denmark, considering coastal cities with more than 10,000 inhabitants. The results identified that 33% of damages costs would occur in the capital region of Copenhagen if actions were not taken (COWI, 2017). This corresponds to damage costs between 5 and 35 billion dkk. Ten areas with special risk have been identified by the Danish Coastal Authority, including the coastal towns of Juelsminde, Vejle, Fredericia, Aabenraa, Korsør and Nakskov, as well as the wider coastal regions along Randers Fjord, Odense Fjord and Køge Bugt (Faragò et al,. 2018).
In Denmark, an average sea level rise of 0.3 to 0.6 m is expected by 2100 if green house gases remain at low levels throughout the century. However, it is uncertain how much the sea level will rise. There are scenarios (fig.6) in which a sea level rise of 2.5 metres is possible if emissions remain at very high levels throughout the century.

Fig. 6 Possible future sea levels for different greenhouse gas pathways. Graph adapted from Sweet et al. (2017).
Coastal erosion is another phenomenon that significantly impacts the Danish coast. Erosion can be defined as the removal of material from the coast by waves and tides, causing the coast to retreat (Faragò et al.,. 2018). Coastal erosion in Denmark is especially a severe problem on the northwest coast of Jutland (up to 4 m/year) and the north coast of Zealand (Faragò et al., 2018)
The combination of these events could seriously increase the risk of flooding in coastal cities. An example of an urban system affected by this type of event is the town of Vejle. (Faragò et al., 2018).
10
The rising sea level affects the maximum water level during a storm surge. A storm sur ge is an abnormal rise in sea level caused by the combination of tide, air pressu re and the onshore wind of the storm (Rambøll, 2015). Historically, the most seve re storm surge events occurred mainly on the southwest coast of the Jutland peninsula (Rambøll, 2015). However, Denmark has experienced an increase in storm surges in recent years, affecting not only the west coast but also the island of Zealand (Københavns Kommune, 2017). In Denmark, the expected increase in extreme rainfall could also be particularly significant for coastal cities if a combination of storm surges, sea level rise and heavy rainfall coincides (fig7).
Fig. 7 The horizon will become even bluer. The sea will gain on the land, the ques tion is how much ground it will gain. Photograph by Koublis, P. (2022).
11

Why is the sea level rising?
As the oceans warms in respons to climate change, the volume of the water increases and, as a result sea level rises (ESA, 2018).
The average temperature on earth has incre ased by about 1°C over the past 150 years. This is largely due to the greenhouse gases emitted into the atmosphere (ESA, 2018).
Changes in rainfall and evaporation from climate variability, changes in water proper ties or flowpaths of the main ocean currents, changes in the net storage of terrestrial freshwater, tectonic effects of uplift or sub sidence arising from eathquakes (ESA, 2018).
Global
Meltingwarmingoftheice sheets Thermal expansion Other (ESA, 2018)
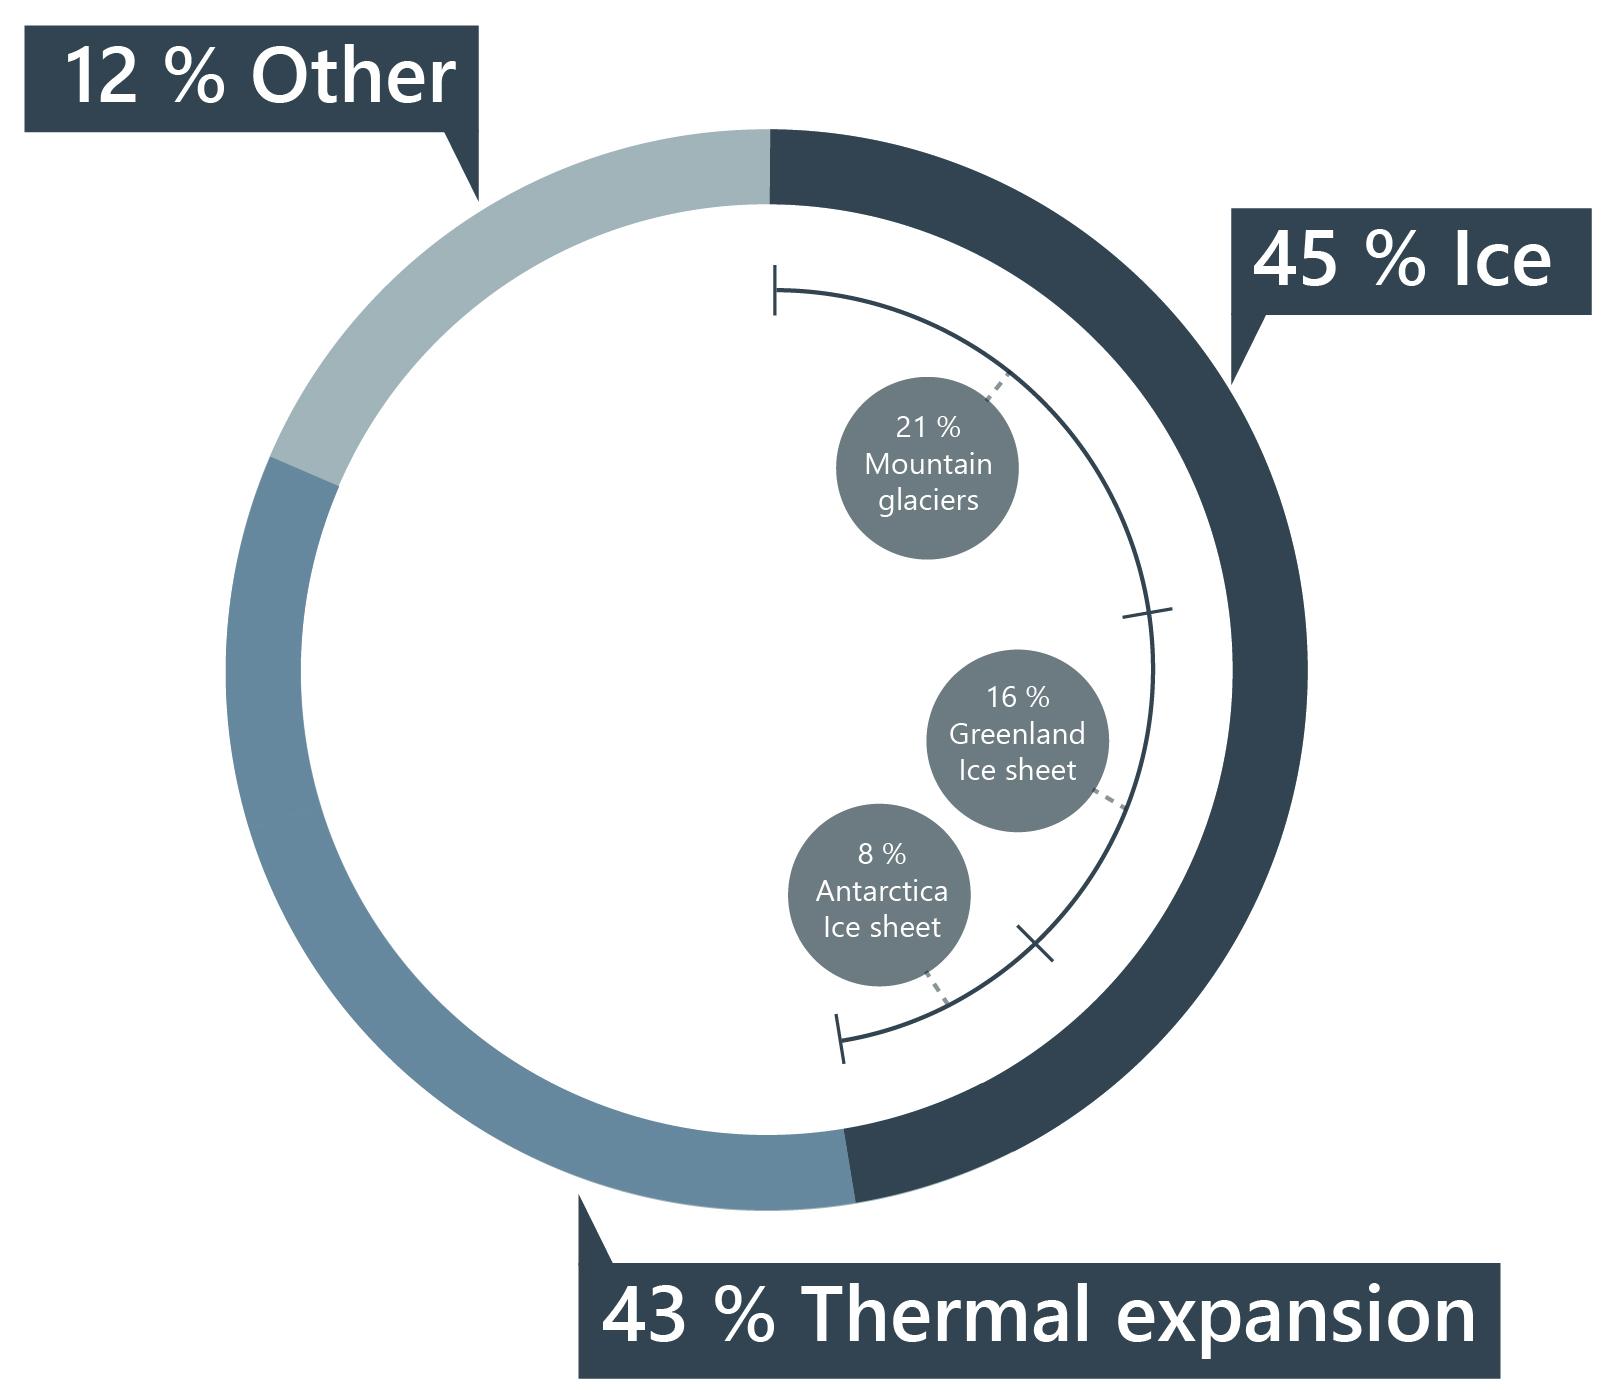
Contributions to sea-level rise (1993-2015)
12
The ice sheets that cover Greenland and An tartica contain about 99% of all the fresh wa ter on earth, and can dramatically raise sea levels if they will melt (ESA, 2018).
THE CHALLENGE
13 Consequences CoastalFloodingerosionSaltwaterintrusion into aquifers Loss of coastal habitats Heavier stormsurges
14
Fig 8. Storms are becoming more potent as global temperatures rise because these storm systems draw their energy from warmer ocean water, which directly results from climate change (IPCC, 2022). This thesis explores how a coastline can be adap ted to rising sea levels and more severe weather conditions. This photo by Talibart, R. (2022) captures this oceanic explosion of energy beautifully.

RESEARCH QUESTIONS What kind of coastal defences already exist, and what is their effect on the coastline and coastal recreation? What is the current view on these various defences? How can we find sustainable ways to adapt our coasts to rising sea levels and heavier storm events while at the same time offering opportunities for recreation, tourism and environmental development? Further more, how is this coastal adaptation method reflected in a concrete design?
15

Photos by various photographers are used to introduce a chapter and evoke a sen timent. The photos are carefully selected for their quality and content.
Photographic conversation Design conversations and sketching Elaboration via various drawing programs
METHODS Academic research/general research
Several site visits were made. Visiting the site helps to better understand the possi bilities and problems. The photography allowed me to revisit the site
This section is mainly about gathering information and getting an overview of what types of coastal adaptation already exist, the current state of affairs regarding sea le vel rise, and how coastal adaptation is shaped in practice. A focused literature review was carried out and the papers concentrated mainly on coastal defence, coastal ecology, climate change, and sea level rise. Multiple sites and a few books were also used as sources. A study of good examples of different coastal solutions was also carried out. An outline of the bibliography can be found at the end of the thesis.
Several programs supported the drawing process of the project. Autocad, QGIS, Adobe Illustrator, Photoshop, and InDesign were used to convert rough ideas and sketches into clear, detailed drawings.
GIS mapping: Coastal and landscape analyses Site visits / photographic analyses
16
In order to understand the local coastal and landscape processes, a GIS analysis was needed. Based on data, various maps were created showing how the landscape is configured and how coastal processes affect the coastline. (Fig.10).
A series of sketches were made in both the analysis and concept phases. By sket ching, spatial concepts are created, and by stacking several sketches on top of each other, a full-fledged design can be developed based on the knowledge obtained about the site.
17 Fig 10. GIS collage I Abstract emphasis on the complexity of understanding anthropogonic and natural processes through mapping


18
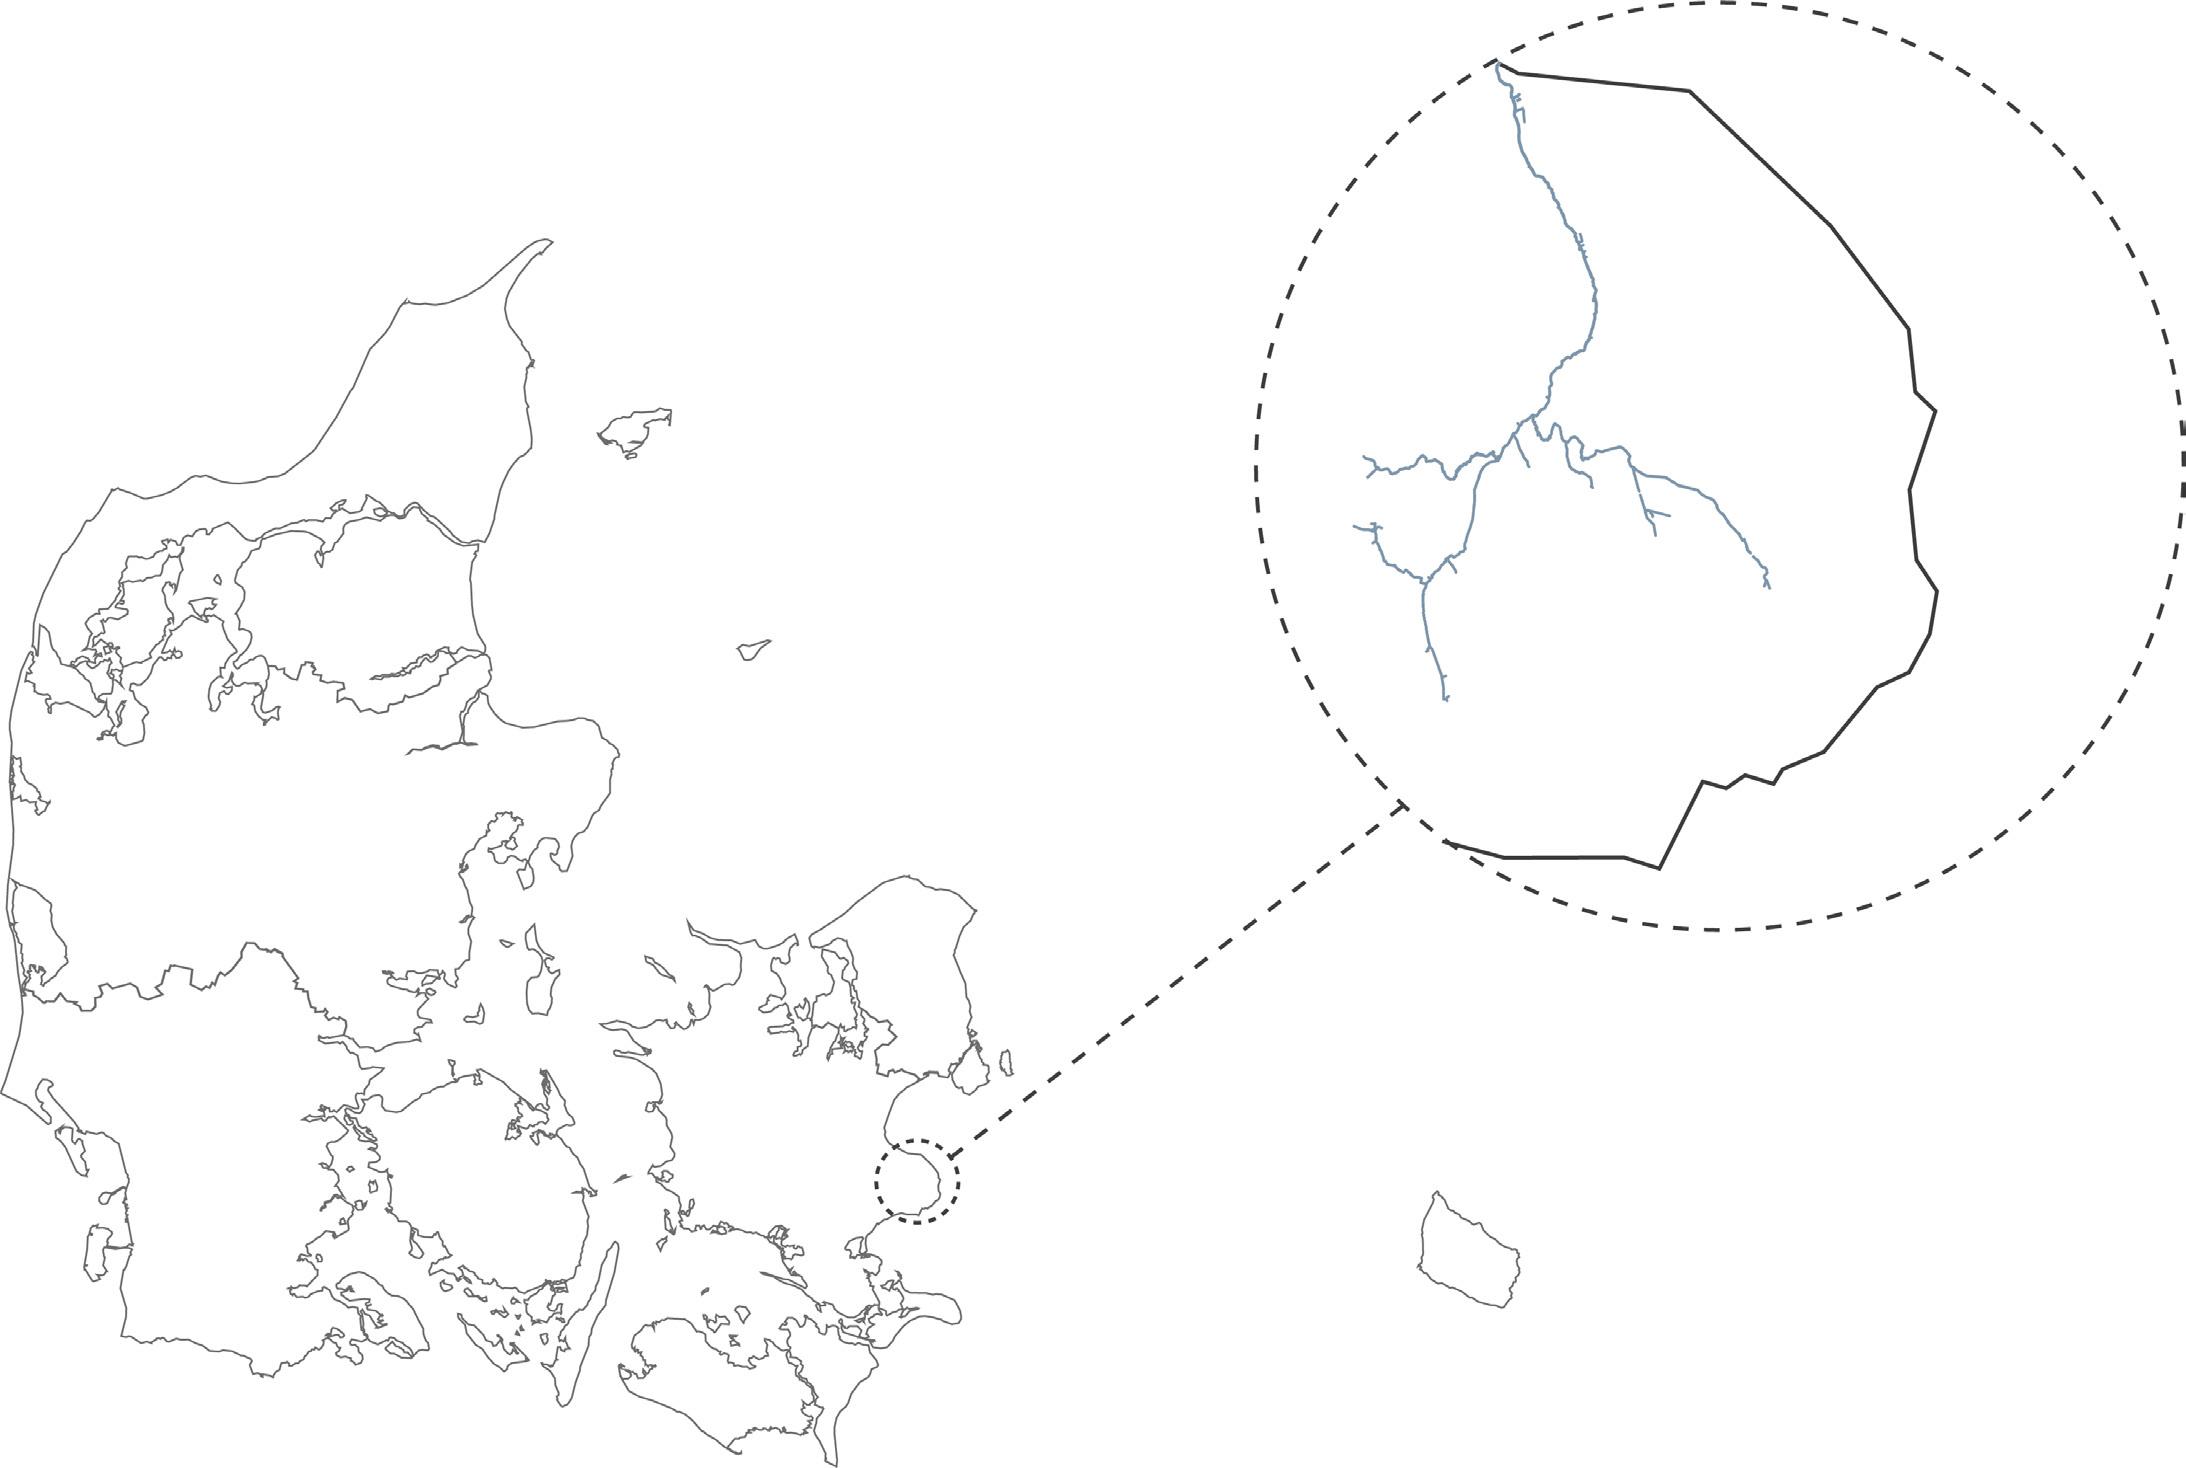
PROJECT LOCATION
Stevn Peninsula / Køge Bay The following chapter examines the landscape and coastal processes, challenges, and potential of the Stevn peninsula. Stevns is located (fig.11) in the eastern part of South Zealand at the Baltic Sea between Køge Bay in the north and Fakse Bay in the south. In earlier times, the Stevn peninsula was almost separated from Zealand. Trygge vælde Å to the north and Fakse Å and Vivede Mølleå to the south have almost made Stevns an island. Moreover, the inhabitants have had a distinct view of themselves as a coherent community. (Stevns Kommune, 2022). The landscape is flat with a slightly undulating surface, almost without hills and one large valley. The landscape rises steadily to the coastal cliffs (Stevns Kommune, 2022).
Fig 11. Map showing the project’s location in Denmark. The project is located in the east of Sjælland on Stevn peninsula
RødvigStore Heddinge
19 Hårlev
StrøbyStrøbyEgede
UNDERSTANDING THE LANDSCAPE
Baltic sea
Strøby Egede Store
20
RødvigHeddinge
Hårlev Strøby
Fig 12. Understanding the landscape through its structure and spatial configuration. This step in the de sign process is essential because design decisions are based on spatial knowledge of the site.

Fig 14. Estuaries filter sediments and pollutants from rivers and streams before they flow into the ocean, creating cleaner water for humans and marine life (Life in an Estuary, 2019). This photograph by Burtynsky (2018). captures an abstract display of the complex network at estuaries

Fig 13. By examining the different time layers of a landscape, you can travel through space and time. Photograph by Burtynsky (2018).
21

HårlevKarisse
Rødvig Store Heddinge sea park
Tryggevælde Å valley I Nature
The two most important landscape features, which are Stevns Klint I Unesco World Heritage Site and Tryggevælde Å valley, form the basis for understanding how the peninsula came to be.
Fig.

I
Stevns Klint Unesco world heritage Strøby Strøby Egede 15
Baltic
Fig.
Fig. 16 Højerup Church on the cliffs of Stevns Klint by Peter Kristen Skovgaard (1842). The eastern part of the church has nowadays fallen into the sea due to coastal erosion 17 Outlet of Tryggevælde Å I Broen over Tryggevælde Å med udsigt til Køge by Johan Dahl (1815)

23

Fig. 18 Soil types Denmark Strøby Egede

Fig. 20 Geomorphology of Stevns peninsula Till ThinValleyplainsystemmoraine layer Beach ridge Terrain strokes Marine plain


Geology and coastal history
24

The Danish landscape is the result of the last Ice Age 20,000 years ago (fig.18 and fig.19). The melting be fore 12,000-15,000 years ago left behind deposits in the form of moraines, i.e. stones, gravel, sand and clay. Stevns belongs to the area of the country that last melted and the landscape is one of the last to be formed. Wherever the glaciers or melt-water ri vers had carved out depressions in the deep surface, the sea penetrated and formed bays, fjords and cliffs (fig.20), (Skov- og Naturstyrelsen, Miljø- og Energi ministeriet, 2001).
The Stevns Peninsula is the result of vertical shifts in the rock bet ween fault lines, which have caused certain parts of the earth’s crust to be elevated in the form of so-cal led horns. The surface of Stevns has been levelled by ice erosion. The re sistance of the high limestone mas ses has led the ice north and sou th around the peninsula and is the cause of the bay formations at Køge and Fakse. They have hardly come as far inland as they do today. Also Stevns Klint has lost, and continues to lose, large areas due to sea erosi on (Skov- og Naturstyrelsen, Miljøog Energiministeriet, 2001).
Fig. 19 Ice cover during last ice age


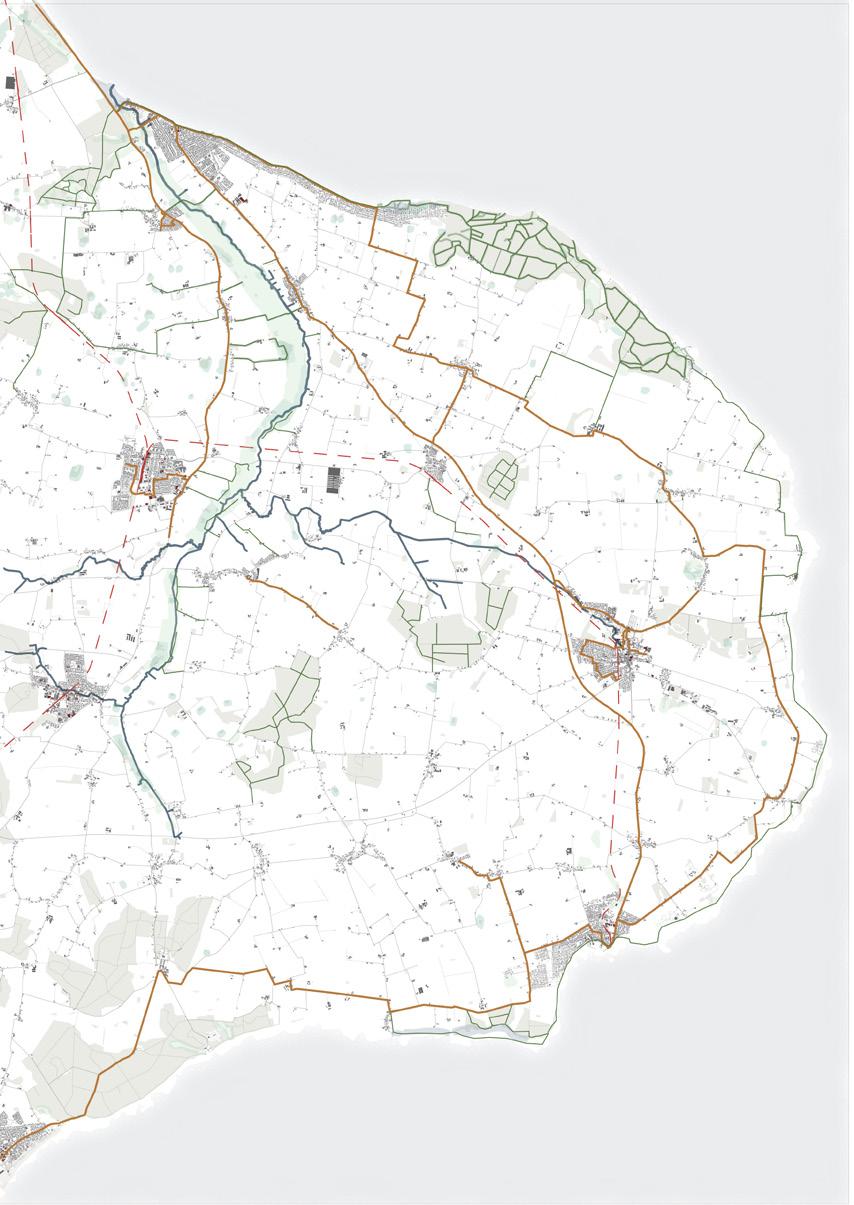
Hydrological system
Strøby Egede Dike Sluice Baltic sea Tryggevælde Å valley I Nature park
Fig. 21 A simplified version of the hydrological system on the Stevn peninsula. Most of the rainwater collects in the Tryggevælde Å valley, which then floods into Køge bay.

25
The area is a geological fault zone with fissures in the limestone and underlying bedrock. During the melting at the end of the Ice Age, the soil was easily eroded by ice and melt water, which created the basis for the Tryggevælde river valley. In the Stone Age, however, the water rose so that the area emerged as a fjord during this period. But as parts of the land under and around the fjord rose over time, due to the melting ice cap, the fjord was transformed first into a bog and later into the vein valley that forms the largest freshwater area on Stevns today (Stevns Kommune, 2022). The entire Tryggevælde Å is an approxi mately 35 km long watercourse that drains 300 km2 of eastern Zealand. The river has 19 major tributaries. Tryggevælde å runs the last 13.5 km in a very large and wide river valley. To prevent the valley from becoming a fjord again, a sluice was installed in 1912 (fig.21). However, in view of rising sea levels and stronger storm tides, the sluice will not be able to cope with these changes. A new sluice or some other adaptation method will have to be implemented to prevent flooding of the urban infrastructure and valuable nature in and around the valley. The surrounding dikes in the nature park are also in poor condition and are already flooded at 1.85m (Stevns Kommune, 2022).
26

The Stevn peninsula is home to a range of nature reserves, from unique Natura 2000 areas to saltwater wetlands, fenmeadows, forests and woodland wetlands (fig 22). The valley is designated as a NATURA 2000 and the unique habitat of the venmeadows can be seen along the river and many rare species of birds benefit from the occasionally flooded areas of the river valley. (Stevns Kommune, 2022).
Saltwater wetlandNatura 2000 Forest Ven meadow Forest wetland Strøby Egede Tryggevælde Å valley I Nature park
Natura 2000 I Reef
Natural typologies


Another important natura 2000 area lies beneath the sea level. The reef, to the east of Stevn Klint consists of hard limestone often with deep fissures in the limestone and stones from 2-50 cm. Sandy soils are very scattered. The area contains a rich algal flora dominated by red algae, but both green and brown algae occur. Blue mussels are the dominant faunal element (Natura 2000-Standard form, 2022).
Fig .22 Map showing the different natural typologies in Stevn peninsula


Higly valuableValuableValuable- intermediateIntermediate Not significant
27
The Stevn peninsula is home to a variety of valuable habitats, the Tryggevælde Ådal being the most important. Climate change and the resulting rise in sea le vel will cause this low-lying area, with its valuable nature, to be flooded. Strøby Egede also lies in between 2 very valuable natural areas, which could have the potential to be connected. Natural potential score Strøby Egede Tryggevælde Å valley I Nature park Fig. 23 Visualizing the value (uniqueness) of different nature areas

In recent years, the prices of summer cottages have risen and very few cottages are reported to be for sale. This indicates that the area has a strong buying power. Besides that, a lot of (summer) houses are being built in Strøby Ege de (Stevns Kommune, 2022).
Coastal and nature tourism is the largest business area in Danish tourism in terms of turnover and number of vi sitor overnight stays. Coastal and nature tourists travel to Denmark because of the coastal life, nature and the many experiences and activities (Rasmussen, 2019)

Stevns Klint I Unesco world heritage Fig. 24 Copenhagen’s fingerplan I Strøby Egede at the edge of the capital’s urban development Fig. 25 The main touristic features are the valley and Stevn Klint

Stevns Municipality wants to strengthen both the over all tourism product and the framework conditions within which the tourism industry and other stakeholders ope rate. The need for recreational development and general attractiveness of the infrastructure is an important feature in the development over the next years coming (Stevns Kommune, 2022).
Its close geographical location to the capital, makes it an obvious destination for weekend visits and business tourism. It is still the com bination of world heritage, beautiful nature, cultural history and outdoor recreation that is Stevn’s favourite offer and on which the deve lopment of Stevn’s muncipality is focusing on (fig 24).
Stevns Klint world heritage and the soon the be nature park Tryggevælde Å valley will incre asingly see tourists over time (fig 25). The area is partly dependent on the jobs and experiences that tourism creates, but is at the same time under pressure if tourism develop ment does not take account of this. Good and sustainable tourism depends on all partner ships working with tourism.
Tryggevælde Å valley Strøby Egede Strøby Egede
The total tourism turnover in Stevns Municipality in 2017 was DKK 386.3 million, which was divided into DKK 141.8 million. (overnight tourists) and 244.5 million DKK. (oneday visitors). They came from the following countries: - Denmark (66%) - Germany (18%) - Norway/Sweden (3%) - Others (13%) (Stevns Kommune, 2022).
Urban development and tourism
Walking pathsCycling pathsTrain tracks cycle,


train and pedestrian routes on Stevn peninsula
Fig.Roads26 Car,


29 Stevns peninsula is generally well accessible by public transport and car (fig.26). There are also several important cycle paths on the peninsula, like the Berlin-Co penhagen route. In some parts, however, pedestrian access is not good. Especially in Strøby Egede, accessibility is below standard, with almost no walking or cycling paths (Stevns Kommune, 2022). Accesability Strøby Egede

30
INSIGHT INTO LOCAL COASTAL PROCESSES
The forces that shape our coastlines are driven by the atmosphere and ocean energy. Coastal pro cesses are driven by wind, waves, ocean currents and the highly predictable tides that move water and sediments daily. These processes are respon sible for the landscape changes we see along our coasts (fig. 27, fig. 28). They will also play a more significant role in the face of a changing climate,. Before considering intervening, we need a thorough understanding of the natural forces that shape our coasts and landscapes. Only when we thoroughly un derstand the local natural processes can we justify an intervention (WXY et al., 2021).
Fig. 27 Spring in the North Sea is often ac companied by the outflow of sediments from rivers, the upwelling of sediments from the seabed, and the blooming of floa ting, plant-like phytoplankton that thrives on the inflow of nutrients and fresh water. The photograph was taken by the Interna tional space station (2022a).

31
Fig. 28 Satelite image of Celestún, Mexico. The ebb and flow of ocean currents suspends and resuspends sediments here, giving the shal low, brackish estuaries hues of orange, red and brown. The photograph was taken by the Inter national space station (2022b).

Nearshore bathymetry


Køge Bay is a very shallow bay with a maximum depth of approximately 22 metres (fig. 29). Even 500 metres seaward of Strøby Egede, the maximum depth is only about 2-3 metres. Soft coastal protection extending seaward will require a relatively small amount of fill to be effective (DHV Group, 2003).
32
Stevns Sweden Copenhagen Køge Bay Strøby Egede 1500-----450-----150-----50-----10-----0-----Depth in meters Fig. 29 Bathymetry of Køge Bay
During the Quaternary period, the whole of Denmark was covered in ice, and the first landforms of Køge Bay were formed during the last phase of the ice age. The bay can be characterised as a central depression reflecting a large glacial gorge, which advanced in a northwesterly direction during the last phase of the Pleistocene. When the ice melted, a smooth plain remained that sloped gradually towards the central part of the bay (DHV Group, 2003).
Waves are generated by the wind blowing over the surface of the sea. The stronger the wind, the greater the waves’ height and length (period). Wave height and length also increase with the ocean’s distance over which the wind blows (Rasmussen, 2019). The higher the wave, the stronger the wave motion. If the wave is big enough and the water depth small enough, the sediment on the bottom will be stirred up. If there is no other movement, such as currents, the accumulated sand will settle on the bottom in the same place where it was swept up when the waves stopped moving (Rasmussen, 2019). Waves hugely influence the formation of our coastline, and as the climate changes, we are seeing increasingly violent weather patterns altering our coastlines even further. Storm surges can cause erosion and damage coastal infrastructure. Køge Bay is a very shallow bay that does not receive any pro longed swell, so the Stevn peninsula is only moderately exposed to storms. On average, coastal waves can reach a height of 3-4 metres (fig. 30) (Rasmus sen, 2019). StrøbyStevnsEgede 3-4m
Dominant wave direction and height
Fig. 30
33
Dominant wave direction towards Køge Bay

Wind, water density and tides drive ocean currents. Coastal and seabed currents influence their location, movement and speed. The Earth’s rotation results in the Coriolis effect, which also has effects on ocean currents (Ras mussen, 2019)

Dominant sea currents and sediment flows Køge Bay
34
The timing of high and low tides within a relatively large bay can be delay ed as much as three hours past the time of the ocean’s highs and lows. In such a bay, the magnitude of the tides is considerably less than in the open ocean. Therefore, the astronomic tide is below 0.1 m in Køge Bay. The tidal influence is therefore considered to be negligible (Rasmussen, 2019)
Dominant sea currents and tides
Strøby StevnsEgede 31
Fig.
Køge bay consists largely of sandy plains with the occasional plains of Muddy sand, till and gravel. The large reserves of sand could be a valuable source of sand for dredging (DHV Group, 2003).
Till Sand Muddy sand Gravel and coarse sand

35 Seabed/ Morphology
Strøby EgedeStevns
Fig. 32 Seabed sediment map around Stevn peninsula

36

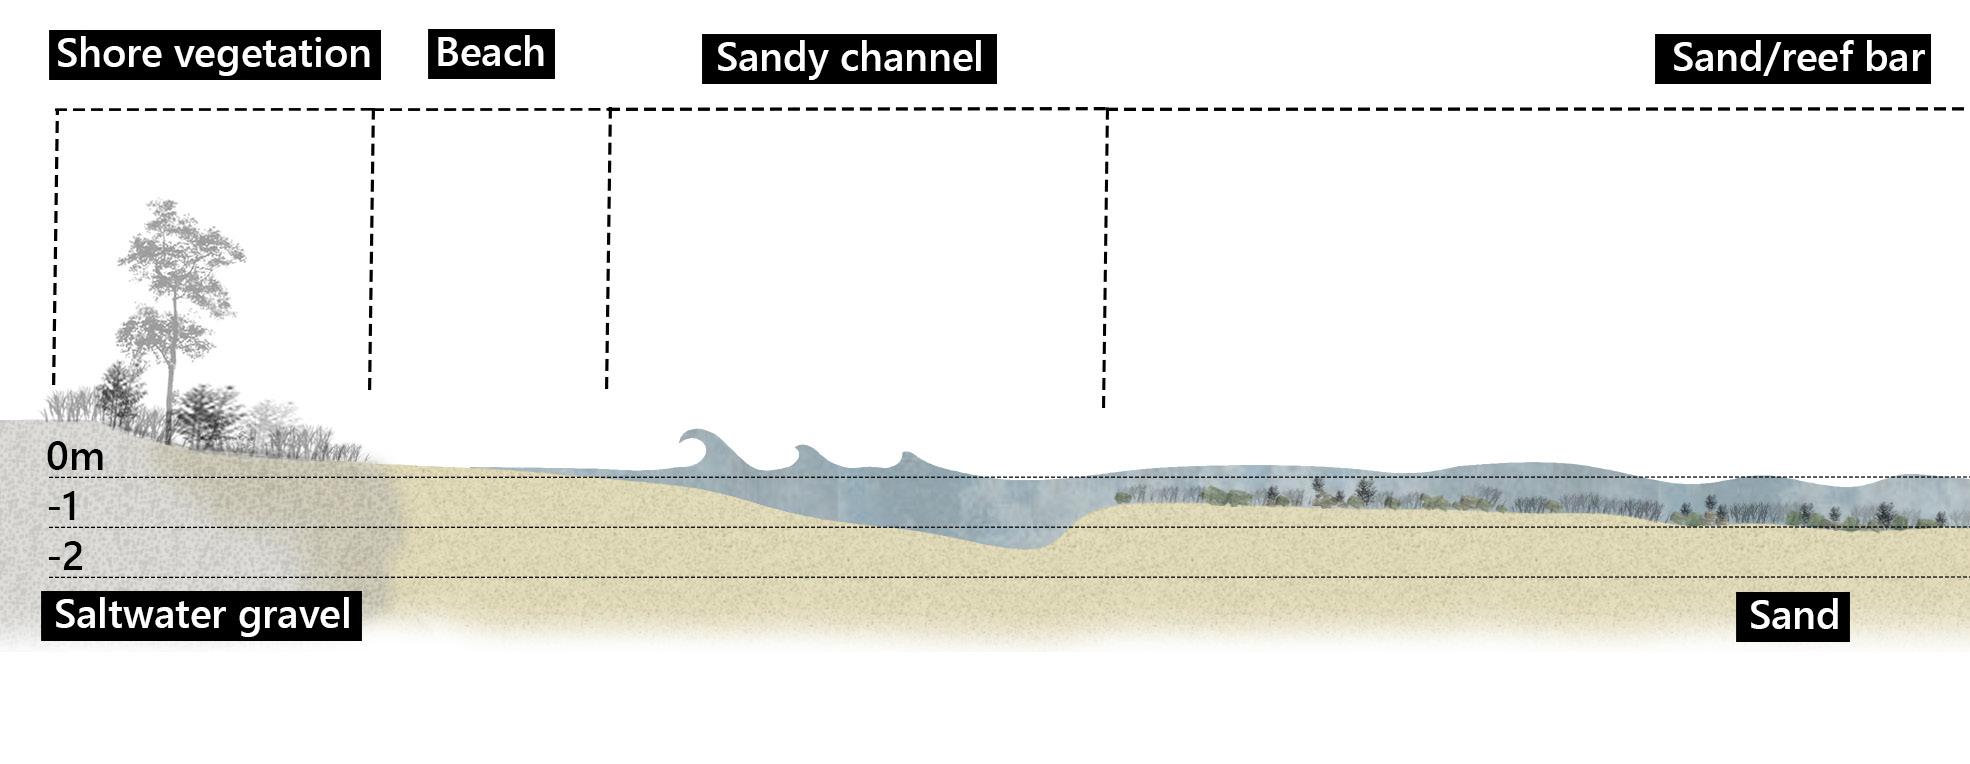
The coastal profile of Strøby Egede is so gently sloping that waves and cur rents deposit material. Looking at the profile across (fig. 36), you will find one or more sand or reef bars at a distance of 10-100 m from the shore (Rasmus sen, 2019). They are located where the waves break under onshore winds, and they are rarely drained. The depressions between the reefs are called troughs or sandy channels.
According to Rasmussen (2019), the sandy beachside coast is Denmark’s most widespread coast type. It has at least one elongated ridge or embankment, made of sand, gravel or stones, built parallel to the shoreline (fig.36).
Closer to shore, one or two more sand or reef bars may be encountered in shallower water. They are also called beach reefs. Here, under normal wave conditions, sediment transport is directed towards land, as can be seen from the very asymmetrical cross-section of the reefs with the steep side facing the sea (Rasmussen, 2019).

Coastal profile Strøby Egede
At the boundary between water and land, the upwelling and downwelling of the waves shape the coastal profile. During calm periods, a low but often long and wide sand ridge can develop here, the seaside of the ridge slopes towards the sea. In the case of this coastal profile, the beach is only affected by the sea during big storms or exceptionally high tides. If the ridge is kept high up on the backshore during high tide and free wind situations, as is the case on east-facing coasts during a westerly storm, it is likely to be preserved (Rasmussen, 2019).
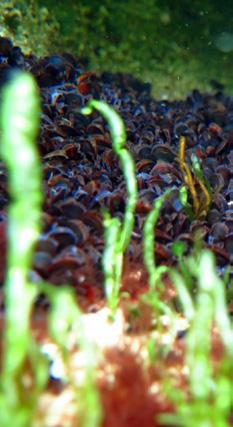
Fig. 33 Marine Fig. 36 Section of the coastal profile in Strøby Egede, the location of the section can be found at (Fig. 34).
37 Marine life on reefs in Køge Bay. Photograph by (Hansen, n.d.). Fig. 35 Seagrass on sandbars Køge Bay. Photo by (Govers, 2017). Strøby Egede Fig. 34 Location of section


38
the sand banks and sand
and
Evolution stability of channels


Fig. 37 Chronological analysis of the evolution and stability of sandbanks and channels in front of the town of Strøby Egede. See Fig. 38 for the location of the analysis. Fig. 39 depicts these diagrams in a photo taken in April 2022
Sand channel 2016 Sand channels 2010 Sand channels 2001 Sand channels 2021
Sand/reef bar
Sand/reef bar Sandy Channel Sandy Channel Egede 38 Area of the analysis
Fig. 39 Picture taken at Strøby Egede. From the shoreline, the difference between the channels and sand/reef bars are clear

Fig.
39
Strøby
This analysis shows that the sand channels and sandbanks off the coast have remained relatively constant over the years. The sedimentation flow seems to have changed little in 2 decades. This consistency is a good starting point for applying any coastal defence methods. Building on the existing coastal morphology and processes is the most responsible way of applying coastal defence, regardless of whether hard or soft defence methods are used (DHV Group, 2003).

PROBLEM STATEMENT STEVNS PENINSULA
40
Fig. 40 The enormous force of a wave hitting a sea wall in the UK during storm Eunice. Photograph by Denford (2022).

Strøby Egede Stevns
Sea level rise and coastal flooding
+ 140cm
41
Fig. 41 Map of flooded areas on the Stevn peninsula with a 140 cm sea level rise.

Sea level rise and coastal flooding 42 Map showing the flooded areas on Stevn peninsula with a 250 cm sea level rises.

+ 250cm Fig.
42
43
Fig. 43 The elaboration of the design project will focus on the coastline of Strøby Egede
Zone of elaboration Focus on the coastline Strøby Egede

Fig. 44 Landscape structures, patterns, and bathymetry of Strøby Egede. The city is nestled between the valley and the Baltic Sea

Zone of elaboration: Strøby Egede Egede
Strøby
45 1/7500 0 1 km0.5 km

Fig. 45 This section highlights the problems identified at Strøby Egede. The current coastal defence method (groynes) is outdated and aesthetically unattractive. The beach is generally unappealing, with little or no beach infrastructure (se ating areas, bathing opportunities, pathways). The connection from the town to the beach is poor as there is no access for pedestrians or cyclists. See Fig. 46 for the location of the section.
Problem identification Strøby Egede

47 Fig. 46 Location of section illustrated at fig. 45


Sea level rise + 140 cm Fig. 46 This section shows the consequences of a 140 cm sea level rise. In addition to the local problems shown in Fig. 45, Strøby Egede will also have to deal with the consequences of the rising sea level and the impact of more powerful storm surges in the future. If no measures are taken, the road connecting Køge with Strøby Egede will be flooded or eroded. Fig. 47 indicates where the section was taken.
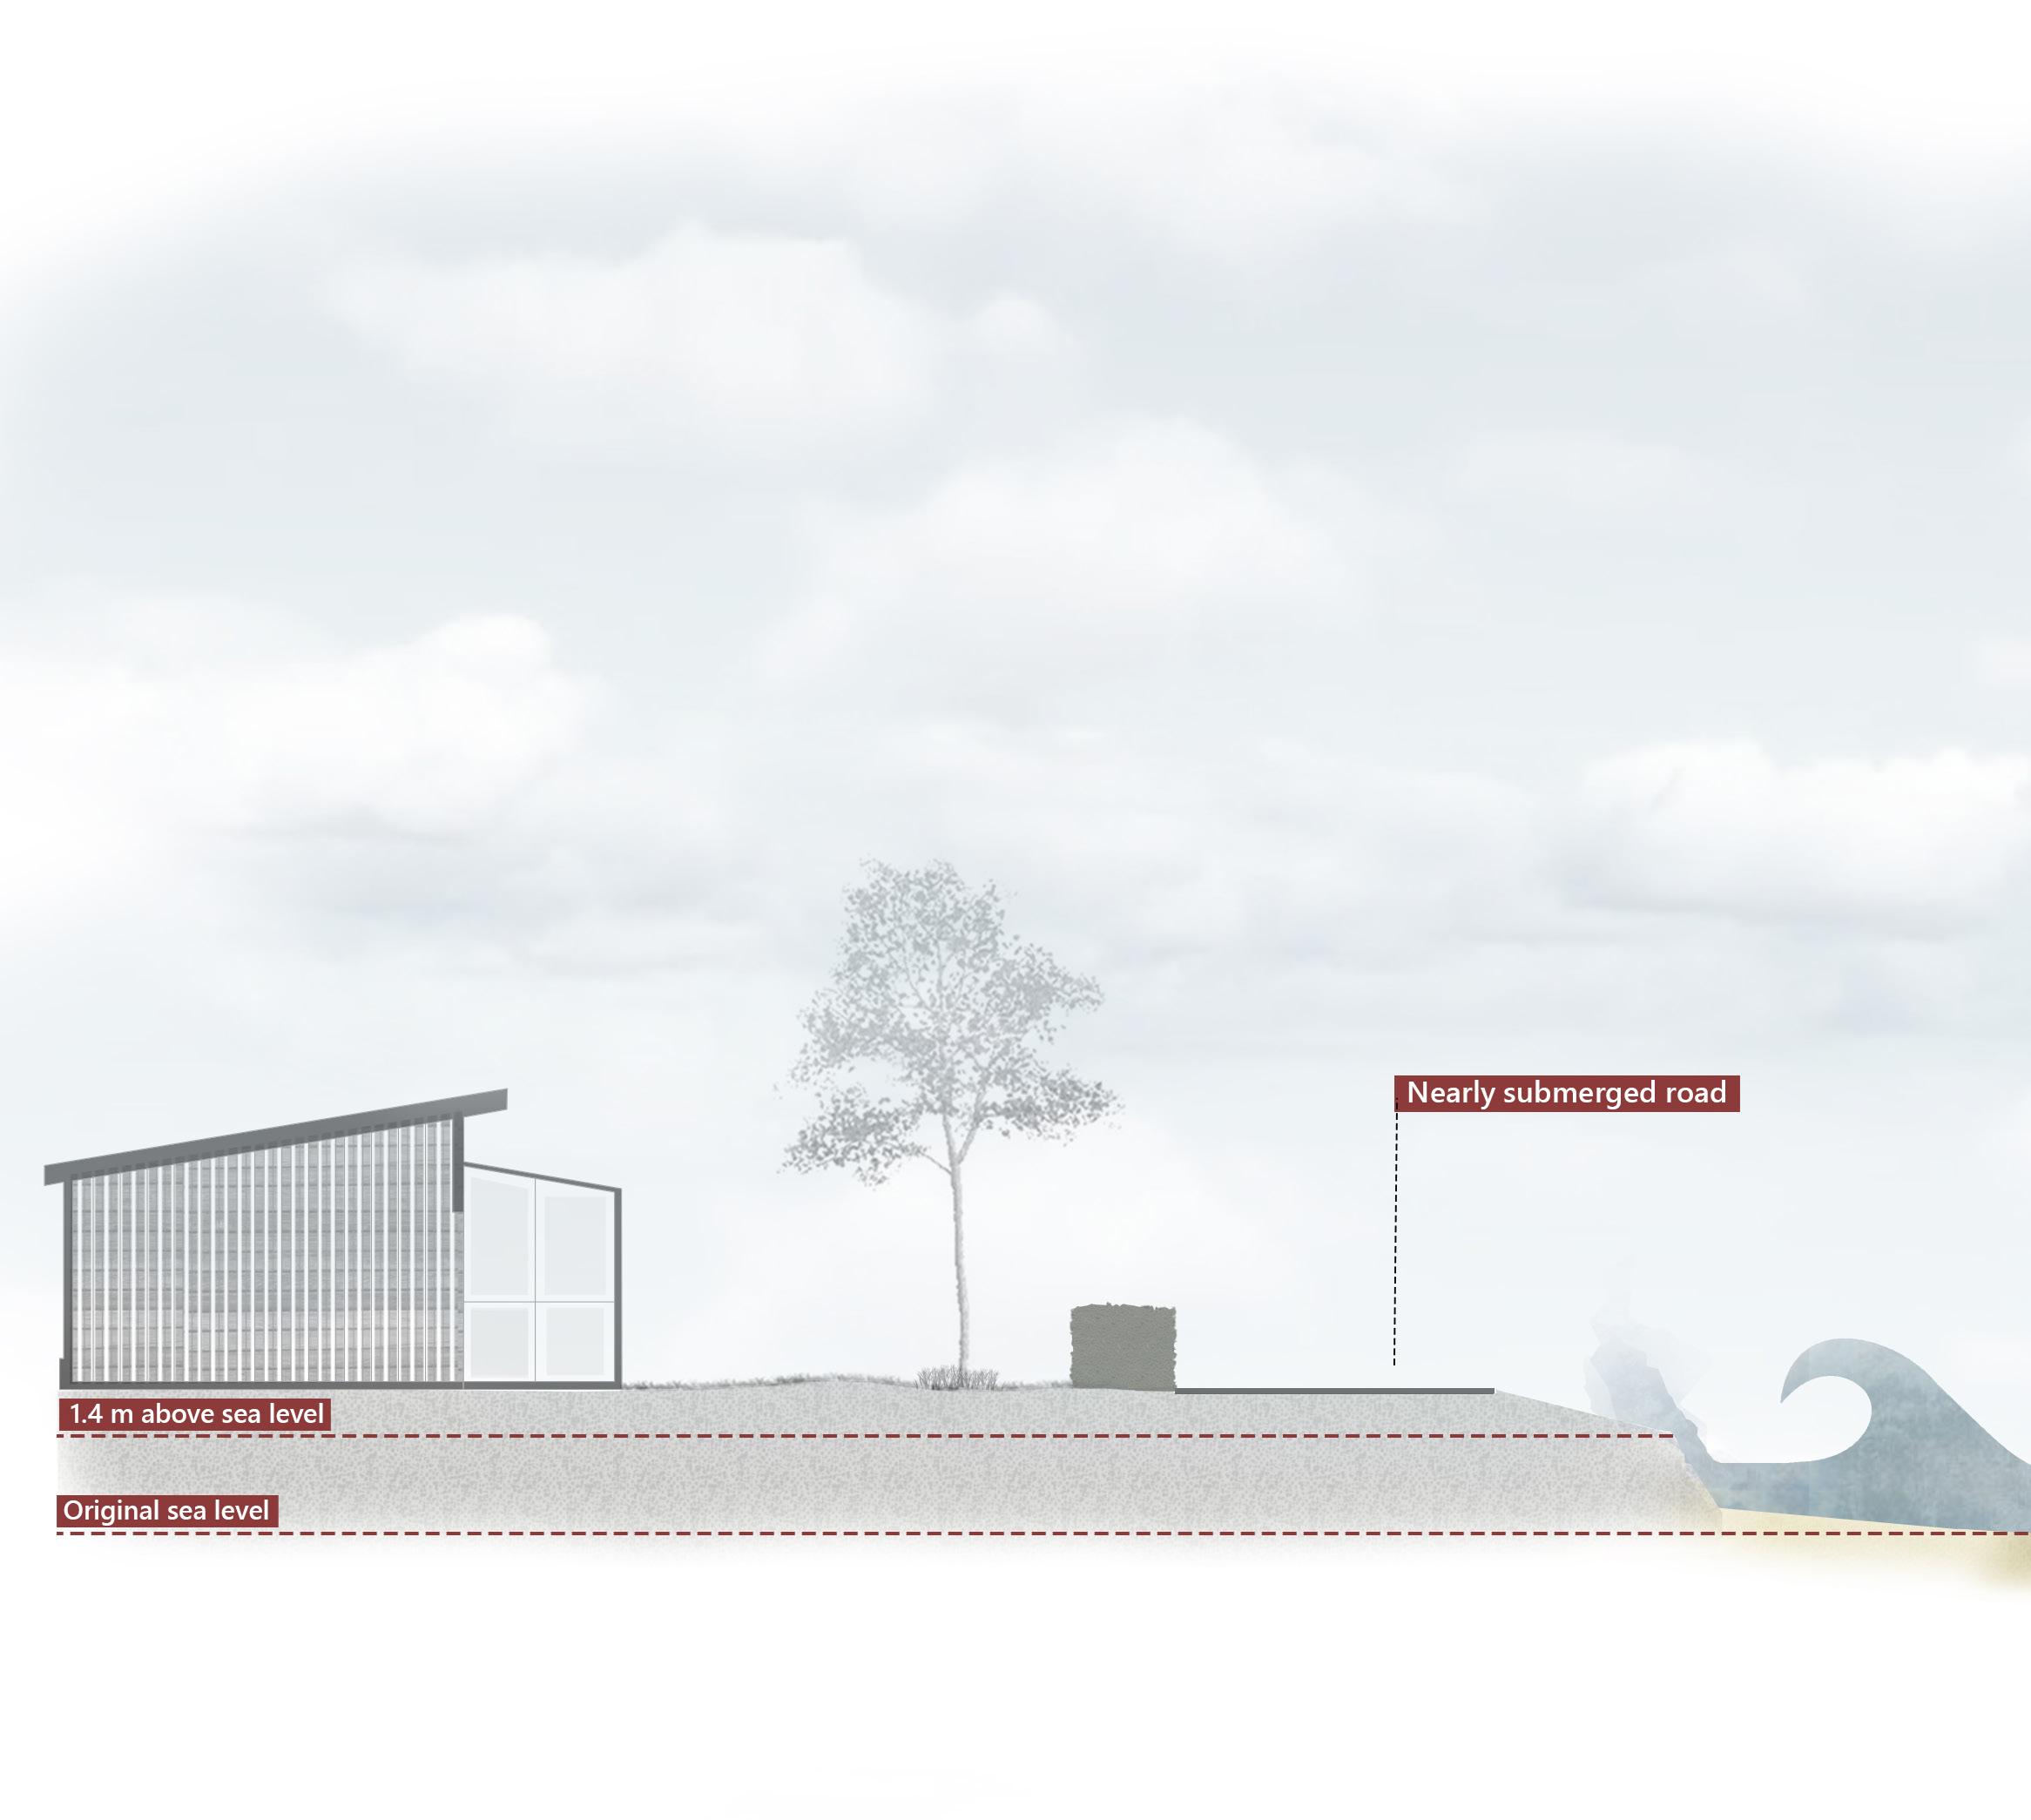
Flooded areas +1.4m sea level rise Fig. 47 Map shows how Strøby Egede will be affected when sea level rises 140 centimeters


Sea level rise + 2.5m Fig. 48 This section shows the consequences of a 250cm sea level rise. If no action is taken, people will be forced to relocate their homes on the front line. For the most part, the coastline will be unrecognizable. Fig. 49 indicates where the section was taken.

Flooded areas +2.5 m sea level rise Fig. 49 Map shows how Strøby Egede will be affected when sea level rises 250 centimeters.


Fig. 50 The photo was taken during a visit to the Strøby Egede ‘beach’. In general, the beach looks very unappealing. The beach is littered with scrap metal, boulders, remnants of hard coastal defences and old infrastructure. It is remarkable how rundown the beach looks.

Fig. 51 In desperation, groynes have been built on top of groynes until the beach is no longer visible. The beach will become a stone wall if no other measures are taken. It is an excellent exam ple that we may have to look for other solutions regarding coastal defence. Bongarts Lebbe et al. (2021) explain that hard protective structures do not provide a reliable, long-term response to coastal hazards. And according to Foti et al. (2020), in the context of integrated coastal ma nagement, the simple upgrading of existing coastal defences must be integrated with resilient interventions, especially if the coastal defences are to withstand the effects of climate change (p.5).

Fig. 53 Concrete boat ramp cutting off the beach.

Fig. 52 Old benches, on the verge of falling apart.

Fig. 54 Old footbridge leading into the sea. Sharp-edged steel on the beach.
55

Coastal erosion is a natural process that creates, alters and destroys coastal landforms through coupled erosion, transport and deposition (Eurosion, 2004). Sea level rise and storms do not automatically lead to the disappea rance of beaches. In most cases, the ability of a beach to respond to pe riodic disturbances or long-term changes has been the key to its survival over several millennia. However, infrastructure within the zone of dynamic coastal variability is a looming problem for beaches, as it impairs their abili ty to adapt to changed conditions. The most appreciated manifestations of this phenomenon are often referred to as “coastal squeeze” when a coast line is obstructed in its landward migration by sea walls. Ultimately, this can lead to the complete disappearance of a beach (Cooper & Mckenna, 2008).
56
Erosion
According to a European report on coastal erosion (Eurosion, 2004), coastal erosion leads to three different types of consequences: loss of land with economic, social or ecological value; destruction of natural seawalls (usually dunes) as a result of a single storm event, which in turn leads to flooding of the hinterland; and finally, undermining of artificial seawalls, which can also lead to flooding”. (Cooper & Mckenna, 2008). Fig. 56 to Fig. 59 show the pro blems caused by erosion in Strøby Egede.
Fig. 55 Erosion in Strøby Egede is an ongoing problem. In this case, it leads to loss of land with economic, recreational and ecological value. Stevns Kommune (2022) estimates a DKK 6.2 million annual damage risk in Strøby Egede.

57
Fig. 56 Lawn in a small pocket park eroding at Strøby Egede.

58 Fig. 57 Soil, plants and debris eroding

Fig. 59 This picture shows how big the impact on the coast is. The drop is more than 1.5 meters, creating an unsafe environment.
Fig. 58 Erosion exposes old infrastructure and creates significant height differences.

59

Fig. 60 Conceptual scheme emphasising accessibility and the connection between the town and the sea

60
Accessibility to the sea Access to the sea from the town is almost non-existent. The town is physical ly cut off from the sea by a busy road with no footpaths or cycle tracks, and the street where pedestrians are supposed to walk is dangerous and narrow. The re is no real visual or material connection to the sea. There is a lot of scrap me tal and old concrete structures, making it difficult to reach the sea. Once the sea is reached, you have to navigate around the hundreds of groynes on the beach. Fig. 61 to Fig. 64 show the lack of connectivity between the city, the road and the sea.
Fig. 62 a challenge to get to the sea


Fig. 61 The thin green strip between the busy road and the sea.
61
Quite
64
Fig. 63 No pedestrian path, no cycle path. Poor access to the sea


62
Fig. Many plots near the sea have also been privatised, making it even more difficult to get to the beach.
Accommodation refers to the continued use of land in flood-prone areas, adapted to the changing conditions, for example, by raising the floor level of houses, installing evacuation measures or switching from agriculture to aquaculture, floating infrastructure. (Moosavi, 2017).
A widely used framework for coastal zone management is based on four main principles (fig.65) described in Moosavi (2017): protection, advance ment, accommodation and managed retreat (p.2).
Managed retreat refers to the (planned and gradual) abandonment of areas prone to erosion and flooding and the avoidance of new develop ment in flood-prone areas (Moosavi, 2017).
63
APPROACHES TO COASTAL MANAGEMENT
Protection includes hard structures such as dykes, sea walls and flood gates, soft structures such as dunes, revegetation and sand replenish ment or a combination of these options. The main objective is to protect existing and future developments and assets from coastal erosion and flooding and to minimize the impact costs due to storm surges, sea level rise and coastal erosion by investing in protective measures. Protective measures are usually placed on or close to the coastline with the aim of “holding the line”, but they can also be moved “seaward” when new struc tures are placed offshore; in this case, it is called advancement (Moosavi, 2017).
64 ManagedAccomodationProtectionretreatAdvance Fig. 65 The 4 different principles of coastal magament approach


Fig. 66 Construction of harbour arm. Photo by (Burtynsky, 2018) Fig. 67 Sand nourishment. Photo by (Burtynsky, 2018)

Fig. 68 We have reached an exceptional moment in planetary history. Humans affect the Earth and its processes more than all other natural forces combined. Photo by (Burtynsky, 2018)


COASTAL PROTECTION METHODS
65
There is a very complex relationship between the forces of nature on the coast and their effects on coastal development over time. Predominantly stable coastal areas can look unchanged over a very long period, even though the active coastal profile may involve a sizeable cyclical redistribution of ma terial. On highly exposed coasts, ongoing erosion will usually occur, if left undisturbed, it will lead to a gradual coastal retreat. The natural coastal retreat along the west coast of Denmark is about 3.0 m per year, and along the inner coast, about 1.0 m per year (Rasmussen, 2019).
According to Rasmussen (2019), the source of the material transported as longshore transport along the coasts of Denmark consists mainly of sand eroded from the coastal profile. However, coasts with a natural sand deficit are usually characterized by more intricate geological formations (moraine cliffs, hard limestone layers, etc.). Man-made structures and constructions on the coast (fig. 66 to fig. 69) interfere with the forces of nature with varying strength and consistency. In general, the more the natural forces at the coast are disturbed by, e.g. coastal protection infrastructure, the more compensatory measures in the form of coastal resotration of, e.g. dunes or coastal slopes, beaches, reefs will be required to prevent a down wards trend (Rasmussen, 2019).
Dune establishment, sand nourishment, terps, barrier islands, artificial reef Hard solutions Soft Non-struHybridsolutionssolutionscturalsolutionsNaturebasedsolutions
Mobile barriers, sand tubes, water tubes, managed retreat
Dikes , seawalls, groynes, breakwaters, rock walls, sluices, elevated buildings, retaining walls, roads, storm por t, piers Combination of the above, beach park
Wetland restoration, tidal marshes, mangroves, green nourishment
66
Classification of coastal protection technologies.
67
Toolbox coastal protection technologies. In the following 18 pages, a site-specific overview of 8 coastal protection technologies will be conceptually applied to the site and examined. To gether with the site analysis, the overview will form the basis for assessing which coastal protection method would be most appropriate for Strøby Egede. The protection technologies include hard, soft, nature-based and non-structural solutions.
Fig. 69 Collage of the 8 protection technologies that will be discussed

68
Sea walls can exacerbate erosion, erode the seabed and neighbouring coasts, and reduce the capacity of the coastline to respond naturally to altering con ditions (Bongarts Lebbe et al., 2021). Hard protective measures include dykes and static sea walls that stabilise the coastline. However, they can cause erosion and destabilise the beach. Groynes and artificial headlands effectively build up the beach on the shoreline but can cause erosion on the downward shoreline. Free-standing breakwaters and artificial reefs reduce wave activity and wave energy along the shoreline and are effective in building up the beach but can also cause erosion on the downward drift (Bongarts Lebbe et al., 2021).
According to Rasmussen (2019), both hard and “advance” responses can chan ge the overall functioning of coastal ecosystems, affect the quality of ecosys tem services and lead to habitat loss or reduced species richness (p.31). These constructions contribute to “ocean sprawl” with large-scale ecological impacts on local and surrounding ecosystems, for example, by influencing connectivity patterns (i.e. the movement of organisms), displacing species due to the en vironmental changes they cause, and facilitating the establishment of non-na tive invasive species. Finally, despite their effectiveness, these responses remain expensive or even unaffordable (Rasmussen, 2019). Although the technology exists to build enormously tall seawalls, economic constraints, social acceptabi lity, and aesthetics will preclude their viability (Bongarts Lebbe et al., 2021).
Hard coastal protection Hard protective structures, or “grey infrastructure”, are common and mainly concentrated in Northwest Europe and East Asia or densely populated areas, such as coastal cities (IPCC, 2022). Although there is no technological limit to the maximum height of a sea wall, hard protection structures do not provide a reliable, long-term solution to coastal hazards (Bongarts Lebbe et al., 2021).
In the IPCC typology (2022), a new response has emerged: the “advance res ponse”. Advancement responses refer to the creation of artificial land above the sea and have a lengthy history in densely populated areas to create new buildable areas. The main advantage is the easy accessibility of new land, both by sea and land, which is an asset for ports and residential and recreational development (Bongarts Lebbe et al., 2021). Coastal municipalities can develop their waterfront or benefit from infrastructure with direct access to the ocean by building offshore and protecting themselves from the sea behind seawalls and dykes (Bongarts Lebbe et al., 2021).
1/22:000 0 1 km0.5 km Breakwalls Fig. 70 Conceptual implementation of offshore breakwalls in Strøby Egede

A disadvantage is that, over time, a narrow sand deposit (a “tom bolo”) will form between the breakwater and the coast (fig.71). This requires natural sand transport along the entire length of the coast. The construction of breakwaters must compensate for the loss of sand downstream. Combining the construction and maintenance of breakwaters with coastal replenishment will protect the coast more effectively and prevent increased erosion of downstream shorelines (Rasmussen, 2019).
69 Breakwaters are constructed parallel to the coast (fig.70) as elon gated armoured stone “islands”. The purpose of breakwaters is to reduce the wave energy that hits the coast itself and to for ce the waves to break further into the coastal profile, thus coun teracting coastal erosion and coastal erosion (Rasmussen, 2019).
70 Fig. 71 3D representation of a breakwater + the advantages and disadvantages of the protection technology

71
Mound A mound is an artificial structure that holds sand on the coast (fig. 73 and fig. 72). Combined with a design that allows easy and safe access to the water, it can have recreational benefits. A mound is usually used to hold sand in place and reduce the force of waves. It can prevent beach erosion on a local scale, but there is eviden ce that erosion downstream can be enhanced by disrupting the sedimentation process (Linham & Nicholls, 2012). implementation mounds in Strøby Egede
of
1/22:000 0 1 km0.5 kmFig. 72 Conceptual

72 Fig. 73 3D representation of a mound + the advantages and disadvantages of the protection technology

While hard coastal defences effectively combat wave energy, soft and nature-based coastal defen ces aim to dissipate this energy using natural coastal processes (Cooper & Mckenna, 2008). In this way, coastal defence works with, rather than against, the natural erosion processes, sediment stora ge and transport. This results in a coastal system that requires relatively little maintenance and can respond to external forcing factors such as storms and rising sea levels. Wide beaches, dunes and tidal flats dissipate wave energy, as do coastal wetlands, so that their construction can effectively protect the coast from erosion and flooding without the need for large concrete sea walls (Cooper & Mckenna, 2008) In some cases, working with natural processes has proven to be the most sustainable approach. In other cases, this means undoing past mistakes, removing hard defences and allowing the coast to regenerate naturally (Cooper & Mckenna, 2008). However, even if “soft” engineering is a more sustainable approach, any form of engineering can cause additional problems by disrupting natural processes. Sediment delivery and transport along the coast could be altered (Cooper & Mckenna, Numerous2008).
cases of soft and nature-based protection were investigated and studied. In particular: Køge Bay Beach Park, Amager beach park, de Zandmotor, Hondsbossche Dunes, Marker Wadden, Jamaica Bay, and the Blue Dunes - Manhattan.

The most inspirational case study was the beach park in Køge Bay, south of Copenhagen, because its development proved that coastal protection measures and touristic development could be com bined. The beach park can be seen as an excellent example of the combination of flood protection and touristic infrastructure development. It can also be seen as a successful example of how it can work together with natural processes. To create a stable and low-maintenance coastal infrastructure, but also one that serves two purposes - both as flood protection and as a recreational area for a metropolitan area (DHV Group 2003). According to DHV Group (2003), an essential explanation for the success of this large-scale coastal disturbance is because the design is based on the character of the original morphology. Fig. 74 Artificial islands are constructed from sand, clay and silt to provide shelter for a variety of plants, birds and marine animals. Photo by Markermeer Waddeneilanden (2020).
73
Soft and nature based protections
Beach park - Lagoon implementation of a beach park/lagoon in Strøby Egede
74 A beach park (fig. 75 and fig. 76) consists of a foreshore, usually made of concrete and covered with sand. The beach park is laid out parallel to the coast (protruding or as a spur of the coast) and can be compared to a comprehensive ‘natural’ breakwater, which is fully accessible (Rasmussen, 2019). The Amager beach park is another example, in addition to the Køge Bay beach park case.
1/22:000 0 1 km0.5 kmFig. 75 Conceptual

75 Fig. 76 3D representation of a beach park/lagoon the advantages and disadvantages of the protection technology

The benefit of sand nourishment comes from wave energy dissipation; when waves hit a beach and break, they lose energy. Different shapes of beach profiles and gradients affect waves to varying degrees. The shape of the cross-section of a beach, therefore, influences its ability to dissipate wave energy. A “disappearing” beach - a beach that absorbs a lot of wave energy - is wide and shallow, whereas a “reflecting” beach - a beach that reflects inco ming wave energy seaward - is steep and narrow and absorbs little wave energy. The logic behind sand nourishment is to change an eroding, reflective beach into a more expansive, dissipative beach, thereby increasing wave energy attenuation (Linham & Nicholls, 2012).
76 Dune establishment and sand nourishment 1/22:000 0 1 km0.5 km
Fig. 77 Conceptual implementation of a dune estbalishment and sand nourishment Strøby Egede Sand nourishment is an adaptation technology used primarily in response to coastal erosi on, although it can also have flood reduction benefits. It is a soft engineering approach to coastal protection that involves adding sediment of suitable quality to a beach area with a sediment deficit. The description of this technology comes from (Linham & Nicholls, 2012). Adding beach material allows the beach to be rebuilt and maintained at a width that offers protection against storm events. This approach is primarily used on sandy beaches, but the term can also refer to replenishment with gravel, stones or even boulders. However, the purpose should be to ensure that the replenishment material is compatible with the existing natural (or indigenous) beach material. The replenishment is often used in combination with artificial dune formation. (Linham & Nicholls, 2012)

potential.Fig.78 3D representation of a dune estbalishment and sand nourishment + the advantages and disadvantages of the protection technology

It is important to note that sand nourishment does not stop erosion but only provides sediment from an external source on which erosion forces will continue to act. In this sense, the sand nourishments form a sa crificial layer rather than a fixed barrier against coastal erosion. Persistent erosion forces will likely return the beach to a state where renourishment is required (UNEP DTU Partnership, 2016).
Besides helping to dissipate incoming wave energy, sand nourishment addresses a sediment shortage: the underlying cause of erosion. This is achieved by adding large quantities of beach material to the coastal sedi ment budget from an external sediment source. The term “sediment budget” is used to describe the careful balance that exists between incoming and outgoing sediment. Similar to a bank account, when more material is deposited than removed, a build-up takes place, and the coast expands seaward; conversely, erosion occurs when more material is removed than deposited. Beach nourishment addresses a lack of sediment - the cause of erosion - by adding large quantities of beach material to the coastal system. This, in turn, can cause the coast to expand seaward (Linham & Nicholls, 2012).
Beach nourishment can be combined with the (re) establishment of dunes. Natural dunes are wind-blown sand deposits forming a sediment storage area inland from normal high tides. Artificial dunes are artificial structures created to mimic the action of natural dunes. (Linham & Nicholls, 2012). At its simplest, artificial dune construction involves placing sediment from dredged wells on the beach. These deposits are then trans formed into dunes by bulldozers or other means (Linham & Nicholls, 2012). Dunes can have great recreational and ecological
Fig. 79 Conceptual implementation of a andy barrier island Strøby Egede

Barrier islands create a physical barrier between the land and the ocean that prevents storm surges from moving upstream (Fig. 79 and Fig. 80). Consequently, water upstream remains low and coastal flooding minimises. Barrier islands can have gre at ecological benefits as they act as refuges for many bird spe cies, seals and other animals (Linham & Nicholls, 2012). Howe ver, boat traffic could be significantly hindered by these islands. Inspiration for this conceptual proposal was “The blue dunes”, a proposal by (WXY et al. (2021) to create an offshore barrier island in New York to deflect storm-induced tidal waves.
78 Sandy barrier islands 1/22:000 0 1 km0.5 km
79 Fig. 80 3D representation of a sandy barrier island + the advantages and disadvantages of the protection technology

Submerged reef
There are rocky reefs of natural origin in Danish waters. However, years of fishing for rocks from the seabed have resulted in a great shortage of such habitats for marine life, especially in Køge Bay, whe re an estimated 70,000 tonnes of rocks have been removed over time. (Rasmussen, 2019) 1/22:000 0 1 km0.5 kmFig. 81 Conceptual implementation of submerged reefs at Strøby Egede

80
A rocky reef is a structure of underwater rocks that acts as a reinforce ment medium for underwater plants that need a solid surface to grow on, as they cannot grow in soft mud or sandy bottoms. Reefs can significantly reduce wave height and protect the coast from heavy storms (fig. 81 and fig. 82). They can also reduce coastal erosion but offer little protection against the damage caused by rising sea levels (Rasmussen, 2019).
Depending on the materialisation of the infrastructure, a reef can provide spawning, shelter, stocking and growth opportunities for many different life forms - both stationary and captive organisms such as seaweed, algae and mussels, and mobile and free-swim ming species such as fish, shrimps and molluscs (Rasmussen, 2019).
81 Fig. 82 3D representation of submerged reefs + the advantages and disadvantages of the protection technology

82
The Sand Motor was a ‘mega nourishment’ pilot project in the Netherlands in 2011. It is one of the most recent innovations in the field of coastline maintenance and distinguishes itself from other coastal defence works by being both cost-efficient and ecologically sustainable (De Zandmotor, 2022). Sand can be supplied in various ways, one of the most common by ship. A similar but somewhat more straightforward approach is to pump up larger quantities and deposit it at selected locations, from where the sand is spread naturally by the currents along the coast over time. The sand motor model is a relatively new method used in the Netherlands, which is estimated to be slightly cheaper than the traditional supply of sand. The sandbank will undergo a constant, natural morphological development controlled by the current, wind and waves. This makes it quite unpredictable (Rasmussen, 2019).
1/22:000 0 1 km0.5 km Fig. 83 Conceptual implementation of the sandmotor at Strøby Egede
Sand motor

83 Fig. 84 3D representation of the sandmotor + the advantages and disadvantages of the protection technology

Managed retreat
The advantage of creating intertidal habitats is that they effectively at tenuate wave energy. This helps to reduce offshore sediment transport and, thus, erosion. Intertidal habitats also form dense root mats that increase the stability of intertidal sediments and help reduce erosion (Linham & Nicholls, 2012). Conceptual implementation of a managed retreat at Strøby Egede
1/22:000 0 1 km0.5 km Fig. 85
84
According to Linham & Nicholls (2012), a managed retreat can reduce flooding and coastal erosion. It is the deliberate process of modifying flood defences to allow flooding of a currently defended area. It gene rally involves retreating the line of the current defences to a new line, inland from the original or, preferably, to rising ground. This should promote the creation of intertidal habitats between the old and the new line of defence.

Fig. 3D representation of managed retreat+ the advantages and disadvantages of the protection technology

85
86
Fig. 87
Summary
Summary overview of the 8 assessed coastal technologies. The summary should not be read as a scoring system, but each individual feature is assessed separately for each coastal technology. Sources for content from : Linham & Nicholls (2012), Rasmussen (2019), de Zandmotor (2022), UNEP DTU Partnership (2016), Cooper & Mckenna (2008) and Bongarts Lebbe et al. (2021).

According to Foti et al. (2020), restoring or enhancing the capacity of the coast to adapt to changing conditions due to the effects of global warming while preserving its functions in the longer term is an excellent way to proceed with coastal protection. According to Foti et al. (2020), it is more sustainable to use nature-based solutions, such as mega beach replenishments, which are based on the transport capacity of wind, waves and currents. The reconstruc tion of dune vegetation, living coastlines and the use of algae and plant acts as coastal protection. Integrating traditional and innovative techniques for designing coastal defence structures can also contribute to creating resilient systems (e.g. Staten Island Living Breakwaters Project) (Foti et al., 2020).
The overview of the reviewed coastal technologies (fig. 87) gives a direction on where we want to go at Strøby Egede. The design solution is explained in the next chapter through drawings, sections, visualizations and diagrams.
Furthermore, combining integrated solutions (a dynamic, multidisciplinary and innovative process to promote sustainable management of coastal zo nes) to reduce coastal risks may lead to creating a resilient system capable of improving its condition after an extreme event. For example, restoring natural ecosystems that were previously destroyed would increase the resilience of the system (Foti et al., 2020).
87
88
Thesafely.third main objective is to restore the coastline to an attractive and dynamic landscape. In addition, coastal fauna and flora will be improved, and beach degradation will be reversed.
Fig. 88 and fig. 89 These undersea oyster farms in Bretagne, France exhibit sublime abstract design features. Photograph captured by Hegen, T. (2021).
The overarching goal of this project is to adapt the coast line of Strøby Egede to rising sea levels, erosion and storm surges by applying natural coastal protection methods that respond to the dynamics of the local coastal processes.
The secondary objective is to create multifunctional and accessible spaces that offer comfort to residents and vi sitors. The aim is to promote tourism, recreation and natu ral growth. The concept envisages a better connection bet ween the coast and the town by providing an efficient path system and recreational infrastructure that allows visitors and residents to enjoy the coastline and its surroundings
DESIGN CONCEPT

89
Fig. 89 A man-made landscape that is the result of the unique and complex relationships between human development and the natural environment. Photograph captured by He gen, T. (2021).

90
Sea level rise ConceptprotectionI
Conceptual diagram:
Mound Beach nourishment Recreational harbour Dunes Reinforced path

Fig.
The coastal defence method used at Strøby Egede involves the construction of dunes in combination with beach nourishments, resulting in a dynamic, natural coastal defence method that will go hand in hand with the natural processes. Three mounds and a recreational harbour will be constructed to hold the de posited sand. A mix of hard, soft and natural coastal defences address the pro blems identified at Strøby Egede. The decision to carry out these replenishments was also made because of dama ge to hard defences, such as sea walls and groynes. These protective measures had only limited success in retaining beach material. Beach and dune replenis hments were chosen to address these problems because they are multi-functi onal. 90 sea level rise protection. 1/22:000 0 1 km0.5 km
Linear park I connecting natura 2000 areas
Fig. 91 Conceptual diagram: linear park I connecting natura 2000 areas 1/22:000 0 1 km0.5 km Lineair coastal park Natura 2000 Natura 2000

91
Concept II The beach nourishment and dune construction offer the opportunity to create a linear park along the coast while protecting the land from sea le vel rise and storm surges. The construction of dynamic dunes will provide ecological benefits and connect two crucial natural hotspots along the coast. This, in turn, can promote tourism and its associated development benefits. The intention is to position the vegetation as naturally as possi ble so that it looks like the new landscape has always been there.
Concept III Reconnectino coast and town Pathways

The design envisages a coastal landscape park that, with its dunes and coastal nature, forms a natural passage from the beach to the town, invi ting users to explore and offering various spaces for recreational activities. The area around the coastline is not accessible, and people cannot walk from their houses directly to the beach. In general, people have difficulty reaching the coast. Therefore, the design provides a circulati on system through the area and reconnects the town with the coastli ne. A network of paths has been built along the dunes to connect the town with the beach. The design highlights a wide dune crossing to the sea, serving as a meeting place and other recreational facilities.
92 Accesability and reconnection with the coast line 1/22:000 0 1 km0.5 kmFig. 92 Conceptual diagram: accesability and reconnection with the coast line
93
Fig. 92 Natural design along the Icelandic coast. Photograph by Waider. J (2021).

Masterplan Strøby Egede Fig. 93 Masterplan Strøby Egede. The black square on the plan indicates where the zoom in of fig. 96 is taken. Strøby Egede Tryggevælde Å valley I Nature park

The design intervention (fig.93) appeals to local forces and involves them in creating a new resilient coastline. The pro ject focuses on the interaction between fluid and solid, sta tionary and moving. In addition to coastal protection, the project offers touristic and recreational development op portunities, increases coastal biodiversity and illustrates an alternative way of designing by working with natural pro cesses rather than against them. The overall design method results in an innovative design solution, which guarantees naturally integrated and resilient coastal protection and optimal coastal


1/11safety.000Mound
Dunes and beachScrubland and Pathstrees

Recreational harbourExisting forest 0 N 0.5 km0.25


Recreational activities The refurbished coastline of Strøby Egede has a range of new attractions. The design offers a more attractive and accessible beach and sa fer places for swimming and sunbathing. Play grounds, seating, and picnic areas have been de signated throughout the linear park. Along the 4-kilometre-long coastal paths, the dunes form a playful landscape that invites exploration. In the centre of the design, a recreational har bour has been constructed to prevent the proli feration of boat ramps and the privatisation of the beach. Before the design, the boat ramps were scattered along the coastline, often in poor condition. Since it is vital that recreational and commercial boating remains possible, the new well-organised port will centralise boating traffic and Accessmooring.willbe possible on the mounds as it will offer a beautiful view of the bay and the beach area. Moreover, it will be an excellent place for anglers to catch fish.
Fig. 94 Trails and recreational activities along the coastal Mound Dunes
96
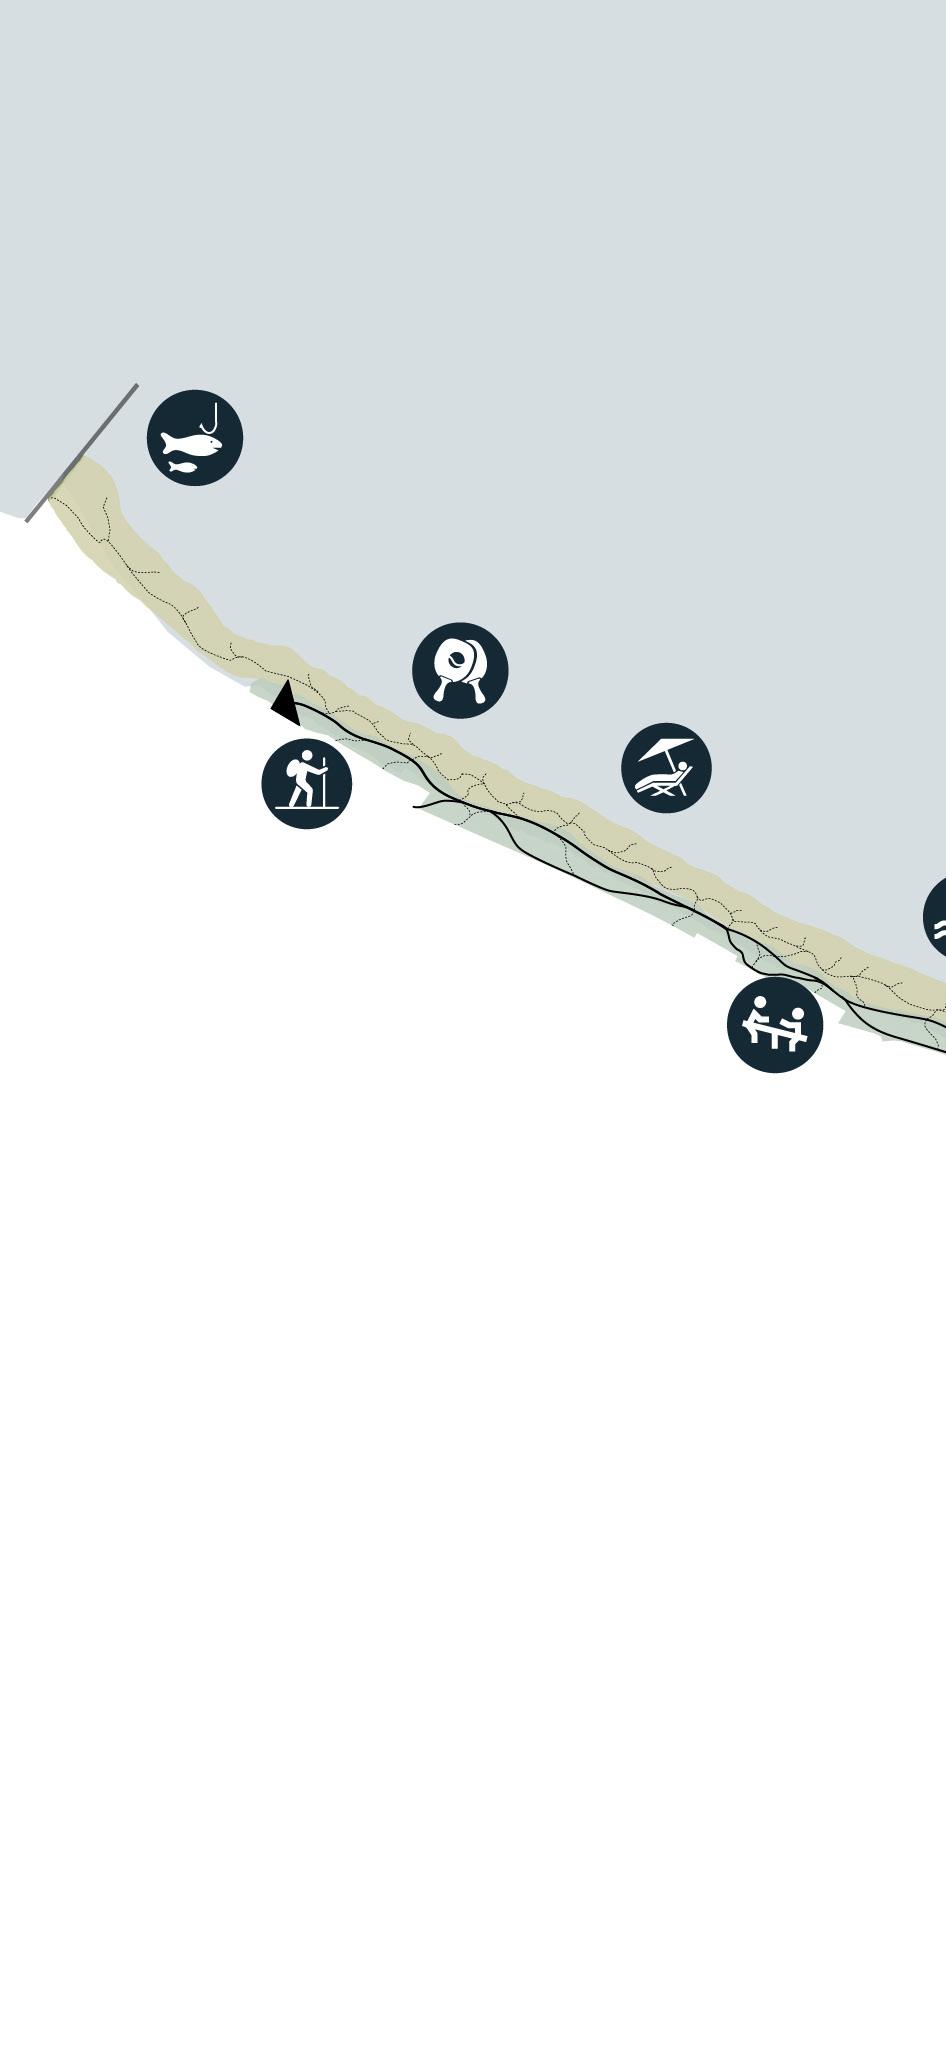
97 coastal landscape park. The icons represent the activities 1/14:000 0 1 km0.5 km Recreational harbour

Zoom in of masterplan


Sea Scrubland Grassland and trees Concrete tiles 200x150 cm Public shower Informal pathays KustvejenShrubs TreesPirateN playground Dunes 1/6000m 5 10 Fig. 95 Area on the masterplan where


The zoom-in gives an impression of how the spatial concepts ma terialize on a small scale. It provides an insight into the details of this landscape. The concrete tiles imprinted with sea shells form the link between the town, the beach and the sea. New pedestrian crossings will en sure a safe crossing to and from the park. Along the park, there will be space for natural paths to develop over time. However, certain areas will be fenced off to allow nature to establish itself. Facilities like the public showers, pirate playground, and multiple seating areas provide recreational infrastructure. the zoom in

is taken + 2.10 Msl Legend:


Fig. 96 Zoom in of masterplan (fig.93) 0 Msl +3mMsl lsMm3+

Existing seabed Finer
The vegetation consists exclusively of indigenous vegetation that is common to Køge bay. The intention is to position the vegetation as naturally as possible so that it looks like the new lands cape has always been there. Layering a diversity of plant species creates a lively and colourful foreground that filters the view from the street. It also increases the structural complexity of the landscape, which in turn increases biodiversity and species richness. A large part of the vegetation in the fore dune (fig.97) consists of Ammophila arenaria. Further, towards the rear dune, you would find more Carex arenaria, with only a few spots of Hippophae Rhamnoides and Rosa pimpinelifolia. The scrubland consists mainly of Hippophae rhamnoides, Rosa pimpinelifolia, Rosa canina, Ammophila arenaria and carex arenaria. The scrubland forms the densest part of the vegetation. The area closest to the road hosts a mixture of coastal scrubs, some trees and grasses. The grassland and trees have a more luminous appearance, with Festuca rubra as ground cover, creating a flowing transition between the park and the town.
Zoning I Vegetation
Fig. 97 Section AA’ illustrates the spatial configuration of the design and the textures and colours of the native plants. The different natural zones become clear, and the different sand layers are highlighted. For more clarity on the sand layers, see fig. 103. marine sand Clay mixture

AA’ 1:400 Fig. 98 Location of section AA’ on the masterplan (fig. 93.) Marine sand


Fig. 100 The concrete path serves as the backbone of the defence. Embedded in a foundation of gravel and fine marine sand (fig.103), it stabilises the landfill and forms a structural barrier between the dunes and the scrubland.
Fig. 99 First line of defence: the beach and dunes, the dunes gradually rising up to 3 metres in height.


0 Msl + 2.10 Msl 0m0m1/35001/3500NN551010
102 3+mMsl Coastal defence of Strøby Egede broken down
Fig. mounds are the only form of “hard” engineering structures. They hold the deposited sand in place and provide additional protection during storms.


103 +3mMsl
+ 2.10 Msl 1/35001/500NN0m 0m 52.5 5 10
Fig. 101 The scrubland is the most densely vegetated part. The roots of the plants provide greater stability in the soil and are more resistant to erosion
102 The
supplementation

For sand nourishment, two types of sand are used (fig.102). Finer marine sand is placed on top of the exi sting seabed and used to create a foundation that sta bilises the entire landfill. On top of this, ordinary mari ne sand is used to create the desired landscape (DHV Group, 2003). Where plants are planted that require more minerals, a clay mix will be added to the first 50 cm of soil. The sand is dredged from the bay (fig.103), where these sediment types are abundant. The distance is very small, which reduces the cost considerably. (UNEP DTU Part nership, 2016).


Once the sediments have been transported to the tar get beach, they must be deposited appropriately. Once sufficient sand has been deposited, the sediment is transformed into a flat beach. Artificial dunes are cre ated on the beach’s landward part using bulldozers or other means.
Fig. 103 Overview section of the deposited sand.
Fig. 104 Location of dredged sand

Finer marine sand Marine coarse sand Strøby Egede Køge bay Sand I Dredging
Supply of replenishment material by dredging (fig.104 and fig.105) at sea is often preferred because this way, large quantities of material can be obtained from an area where the removal and transport ashore do not cause any disturbance to coastal communities. During dredging, sediment is removed from the seafloor and large quantities of water. (Linham & Nicholls, 2012).
105 1:400 Fig. 105 Dredging the sand from Køge bay Fig. 106 Depositing the dredged sand onto the existing seabed


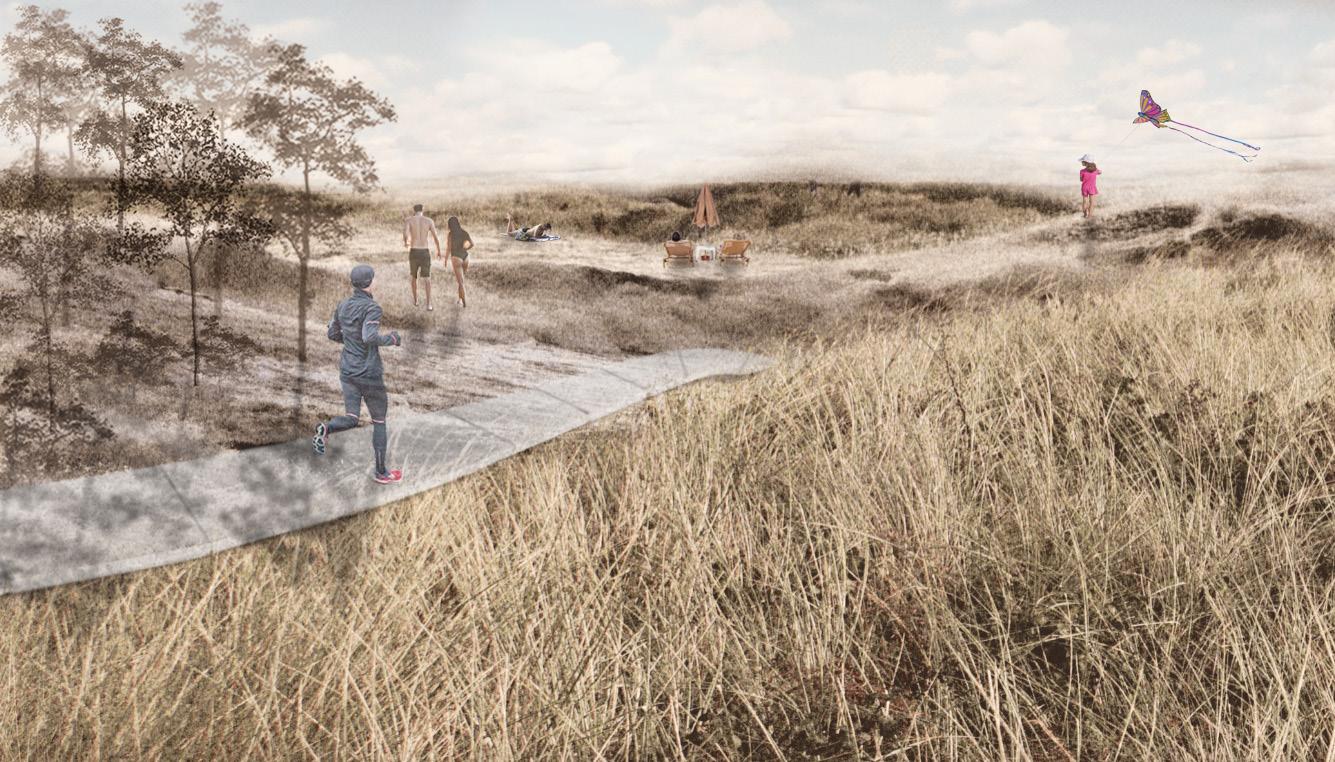
Fig. 107 Visualization I. A runner crosses the rear dunes to the front dune towards the sea. Traversing the layered vege tation creates an intimate atmosphere, reflecting a natural coastal landscape. The dunes offer a range of cosy nooks and crannies to explore.

107

Fig. 108 Visualization II. On the beach in front of the dunes. The dune structure separates the beach area from the park area. The accessible mounds are recognisable landmarks with both technical and recreational functions.


Fig. 109 Visualisation III shows a future heavy storm event testing the new coastal defences. The new coastal defence can withstand a 3-metre rise in sea level and can cope with storms to a certain extent.


112 Fig. 110 A journey through the newly developed beach park.

113


114
Benefits beach nourishment
It is also possible to provide ecological advantages through coastal sand nourish ment. It has provided better nesting sites for birds, invertebrates and other animals. This, in turn, can promote “ecotourism” with associated development benefits (Lin ham & Nicholls, 2012).
The redistribution of the deposited material along the coast will occur through a process known as ‘longshore drift, influenced by waves, tides and wind. Longshore drift is caused by swells approaching the coast at a certain angle, carrying sediment from the beach. Due to the redistribution of sediment by movement along the coast, beach nourishment is likely to positively affect adjacent areas that were not directly nourished (Linham & Nicholls, 2012). This may have more comprehensive benefits, such as reduced beach and cliff erosion for the entire coastal zone within which sediment movement occurs in isolation (UNEP DTU Partnership, 2016). This is hig hly desirable in the case study area, as the sedimentation flow and the currents are predominantly directed to the northwest (Fig. 31), towards a zone prone to coastal flooding and storm damage.
Beach replenishment is a flexible coastal management solution because it is rever sible. This is very beneficial as it can pass on the broadest possible range of coastal management options to the next generation (Linham & Nicholls, 2012).
Disadvantages of beach nourishment
The benefits of beach nourishment are numerous and varied. Most importantly, they reduce the adverse effects of coastal erosion by providing additional sediment to compensate for the forces of erosion. Coastal erosion will continue, but the broa dened and deepened beach will provide a buffer to protect coastal infrastructure and other assets from the impacts of coastal erosion and storm events (Linham & Nicholls, 2012).
Sand nourishment can complement hard protective measures such as seawalls and dikes, which can continue to be used as a final line of defence. The dike or seawall can also be integrated into a natural setting like in fig. 96. A broad sandy beach in front of such structures greatly diminishes the wave energy reaching them, providing additional protection (Linham & Nicholls, 2012).
The addition of sediment that resembles the original beach material helps preserve the beach’s natural landscape and, at the same time, increases its capacity to cope with coastal erosion and flooding. The natural look of nourishment projects also means that these schemes are aesthetically pleasing (UNEP DTU Partnership, 2016).
Nourishment is not a permanent solution to coastal erosion. To maintain the effec tiveness of the system, periodic supplementation is required. This requires regular reinvestment but can be seen as a maintenance cost, like that of hard engineering structures (Linham & Nicholls, 2012).DISCUSSION
Coastal tourism is highly dependent on the accessibility and attractiveness of the beach. As a result, beach replenishment has the potential to promote recreation and tourism through beach widening (UNEP DTU Partnership, 2016). This may serve to strengthen already existing tourism or may serve to attract tourists to the area, the reby stimulating development.
As with any type of coastal protection system, reducing the risk of flooding and ero sion of the coast will result in a greater sense of security. To a certain degree, this is desirable. However, even with protective structures in place, the coastal zone remains vulnerable to flooding and coastal erosion and remains exposed to natural hazards.
- Project size: Case study is a large site. 4 kilometres long and , on average 125 meters wide.
- Estimated material losses : Unknown - Availability (and size) of dredging vessels : Unknown - Degree of site exposure, tidal range - large tidal ranges create time constraints on when dredgers can approach close enough to the shore to dump material : Tidal ranges are negligable.
According to Linham & Nicholls (2012), depositing sediments on beaches can ge nerate several harmful environmental impacts, including the direct burial of animals and organisms residing on the beach. Lethal or harmful doses of water turbidity - turbidity caused by sediment stirring - and altered sediment compositions can im pact the animals in the area (Linham & Nicholls, 2012). Therefore, projects should be designed with a deep understanding and consideration of the potential negative environmental impacts. Particular attention should be given to impacts on important or rare species living along the coastal zones (Linham & Nicholls, 2012).
Financial requirements and costs
115
If protective measures are not carefully designed, they may promote unwise deve lopment in these high-risk areas as a consequence of the increased sense of security (UNEP DTU Partnership, 2016)
There is a significant variation in costs between and within countries. This results from the numerous factors described below -reflected on the design intervention starting on page 88- and formulated by UNEP DTU Partnership (2016). :
Linham et al. (2012) researched the unit costs of sand replenishment. The primary determinant of the cost of nourishment appears to be the transport distance of the beach material. Which in the case study is very low, see fig. 104.
According to Lindham & Nicholls (2012), the use of sand nourishment is expected to increase in the future, and as a consequence, there may be greater demand for high-quality sediment. Limited availability of large contractors, coupled with incre ased demand for replenishment, has already led to cost increases for replenishment in the Netherlands, where it is widely used. This trend is likely to occur elsewhere in the future.
- Distance between dredging and target sites: Very small distance and ther is an abundance of the required sediments - Number of trips required between dredging site and replenishment area: Unknown - Shape of the seabed at the borrow site : Flat and shallow seabed
Public awareness of how sand replenishment works can also be a barrier. This is par ticularly the case when coastal replenishment or underwater (invisible) sediment de position is used, which is not the case in my case study. In these other techniques, the benefits of nourishment are not immediately apparent. If the public does not know how the system works, there may be doubts about the benefits of replenishment and oppose such projects. Linham & Nicholls (2012) also note that the public must also be aware that sand replenishment is not a permanent solution and that it will be necessary to replenish the beach. If this is not communicated, there is a risk that the public will think that the project has failed and will oppose further expenditure on replenishment. This is especially the case when replenishment costs are covered by public funds (Linham & Nicholls,Implementation2012). options
Sand replenishment can be a cost-effective disposal option for maintenance dred ging in ports and navigation channels ( Køge bay. harbour, Recreational port Strødby Egede). The dredged material also counteracts the possible lack of suitable sediment offshore. However, caution should be exercised when using dredged material as port dredged material may contain high concentrations of contaminants that should be carefully monitored (UNEP DTU Partnership, 2016).
Sand nourishment can also be used with other adaptation technologies. It can help address the drawbacks of these hard technologies, such as beach erosion and sedi ment loss on the downstream coast (Linham & Nicholls, 2012).
Large-scale sand replenishments usually require comprehensive technical studies and specialised knowledge and equipment. Continuous monitoring of the beach af ter nourishment is carried out is needed to evaluate the success of nourishment and determine when additional nourishments are required. With the proper training and equipment, monitoring at the local/community level should be possible. However, replenishment schemes need to be evaluated as a whole, which may require the participation of multiple stakeholders and communities if the replenishments are implemented on a large scale (UNEP DTU Partnership, 2016).
116 This, in turn, can affect the time required to complete a project; payment to contrac tors is usually based on the volume of sediment delivered. This normally requires surveys of the visible and submerged portions of the beach to be carried out both before and after replenishment.Institutional and organisational requirements
Barriers to implementation Beach nourishment requires highly specialised equipment and knowledge, including dredging vessels and pipelines that have to be hired from a specialised contractor. Linham & Nicholls (2012) noted that the number of available large contractors is limited and pointed to the associated cost increase due to high demand. The charac teristics of the local site will also influence the type and size of the dredge that can be used (Linham & Nicholls, 2012).
Costs and financial requirements
- Availability and proximity of suitable construction material from onshore or offsho re locations : Large availability of suitable construction material, (see fig. 104)
Many sandy beaches had natural dune complexes before the coastal development; therefore, constructing artificial dunes may restore a specific natural character to the area. Dunes also form a valuable coastal habitat for many highly specialised plants and animals. (UNEP DTU Partnership, 2016). As such, dunes can be considered ecolo gically as well as recreationally important.
Benefits of artificial sand dunes and dune restoration
117
Dunes have proven to dissipate wave energy. However, sandy beaches constantly change as they react to the waves and sea level. Therefore, the amount of sand re tained on a beach is constantly fluctuating. During periods of low beach volume, the shoreline is susceptible to erosion. At these times, dunes can be particularly valuable as a storage area for sediment that can be used to compensate for the erosive forces. This balances out the sand removed from a beach and help maintain wide sandy be aches that continue to absorb incoming wave energy (UNEP DTU Partnership, 2016).
Since the most specific dune construction projects simply consist of dumping dred ged material on land, followed by shaping with bulldozers, the cost of constructing dunes is not expected to differ from the cost of sand suppletion. However, additional costs may arise due to the required planting of dune grass and fencing. In the case of the project, large parts are planted, while other parts will host spontaneous vege tation over time (Linham & Nicholls, 2012).
With careful management, dunes can also provide a high degree of protection against flooding and erosion. Since dunes provide physical and tangible protection, they can promote sustainable development in the coastal zone. Dunes are natural features, and provided that the construction of artificial dunes is done appropriately, they do not spoil the local landscape (UNEP DTU Partnership, 2016).
- Frequency with which the dune must be artificially replenished or the structure ac cumulates sand naturally : Unknown - Project size and consequent economies of scale : The case study is a large site. 4 kilometres long and, on average 125 meters wide.
Other factors that affect the unit cost of dunes -reflected on the design intervention starting on page 88- described by (UNEP DTU Partnership, 2016) include :
- Requirement to fence newly constructed dunes to prevent erosion, requirement to plant new dunes with vegetation: large parts are planted, while other parts will host spantaneaous vegetation over time. Some parts will be fenced off in the intial stages.
Disadvantages of artificial dunes and dune restoration
In many cases, dunes were removed due to development, and communities have be come used to the direct view of the sea. The reconstruction of dunes can meet with local encounter opposition if these factors are affected (Linham & Nicholls, 2012).
118
Dunes are a dynamic form of coastal protection that responds to coastal processes such as wave and wind climate. For example, dunes can grow in the summer months by accumulating sediment. In contrast, during winter storms, the sediment stored in the dunes can be transported by the beach to counteract erosion. Many communities are only familiar with static defences that do not react to local conditions (Linham & Nicholls, 2012). The drastically different way dunes respond to storms can lead com munities to oppose their use, especially in communities where coastal stabilisation has been the long-term goal (UNEP DTU Partnership, 2016).
Possibilities for implementation
Previous experience with projects for the construction of artificial dunes has shown that a significant barrier is persuading the public and municipal officials of the need for dune construction or heightening (UNEP DTU Partnership, 2016). Conflicts of in terest may also arise, mainly if the dune construction occurs in an area primarily used for residential or touristic purposes, where local landowners may be worried about preserving sea views. In these circumstances, it may be possible to keep the new dunes relatively low and linear, as in this project. However, this may have implications for the level of protection offered. If the merits of coastal dunes are fully communica ted, the opposition can be kept to a minimum (Linham & Nicholls, 2012).
Dune protection fulfils multiple management objectives, such as habitat protection, public access to environmental and recreational resources and risk reduction. Becau se of these advantages and the fact that they are less costly and more aesthetically pleasing than some engineered solutions, dunes will likely enjoy broader public sup port in the future (Linham & Nicholls, 2012).
Dune rehabilitation can be much more than mitigation or recovery because it can lead to a greater understanding and appreciation of an endangered ecosystem. Restoration programmes can be linked to environmental education initiatives to restore appreciation for naturally functioning coastal landscapes. This may increase the likelihood that similar programmes will be elsewhere. As a result of factors such as urbanisation, development, trampling and conversion, dunes are becoming more damaged and in disrepair (UNEP DTU Partnership, 2016).
Barriers to implementation
With a better understanding of the role of dunes in coastal defence and a greater awareness of the ecological importance of dunes for coastal species, dune construc tion and dune restoration are likely to become more popular. This will benefit coastal defence and nature (Linham & Nicholls, 2012).
This map (Fig. 111), showing the new coastlines when all the world’s ice has melted, puts contemporary adaptation to rising sea levels into perspective. How can we plan or adapt to rising sea levels if this scenario is inevitable? Forty per cent of the world’s population lives within 100 km of the coast, while 250 million people live less than 5 m above sea level (Villazon, 2020). In that case, do we continue to fight against the forces of nature, or do we let nature take its course? Do we organise a gradual mass retreat, displacing a majority of the world’s population, or will we be able to assess the extent of sea level rise much better in the near future and adapt our technologies to these scenarios? Will floating cities or countries become a necessity? It puts the project and other coastal defence projects into perspective. The first un certainty that must become a certainty is the exact sea level rise we expect; when that becomes clear, cost-effective, sustainable measures can be taken for each case.

Future perspective
119
Fig. 111 This is a speculative series of maps about a sea level of 80 m, possibly in the worst case of anthropogenic global warming where all the ice caps have melted. Illustration by (Bretz, 2018)
A site-specific overview was made of the existing coastal protection technologies.
The design part of the thesis shows how a multifunctional approach to coastal de fence can be materialised. Not only technical solutions were sought, but also social, economic and recreational ones. The design is based on thorough research and analyses with the goal of adapting the coastline of Strøby Egede to rising sea levels and more severe weather events. The design intervention integrated traditional and innovative techniques to create a multifunctional protection method that benefits Themany.main shortcoming of the project is the lack of accurate marine modelling of the se complex operations. This includes in-depth technical feasibility studies, sediment availability studies, local environmental impact modelling, morphological modelling of the development of the deposited sand and dunes, an overview of the ecological and archaeological values of the seabed, insight into the contaminated areas, insight into the degraded area (surface, depth after extraction, change in the composition of the seabed), an overview of the construction techniques, with a clear insight into the conditions (water depths, wave height, conditions of the subsurface), a summary of the inflow and outflow of water after sand nourishment, an overview of the deve lopment of the beach and the development of the dunes, a survey of the inflow and outflow of water after sand suppletion, an overview of the sediment budgets (in the new and old situation).
Research shows that traditional (hard) coastal defence structures have become out dated when it comes to creating resilient coastlines that can adapt to extreme events.
In other words, large-scale multidisciplinary cooperation is required to complete such projects successfully.
Traditional technologies can change the overall functioning of coastal ecosystems, affect the quality of ecosystem services and lead to habitat loss or reduced species richness. These responses contribute to “ocean sprawl” with large-scale ecological impacts on local and surrounding ecosystems. Hard protective structures seem not to provide a reliable, long-term response to coastal hazards. However, integrating traditional and innovative techniques for designing coastal defence structures can also contribute to creating resilient systems.
As the implementation of coastal defence is largely site-specific, there is no one so lution for every case. Therefore, thoroughly analysing coastal and landscape proces ses is the key to implementing adequate coastal defence. Knowledge of the options and possible solutions of coastal technologies combined with a thorough under standing of the area increases the chances of successfully implementing sustainable, resilient coastal defences.
This thesis mainly investigates how to adapt a coastline to rising sea levels, more severe storms, erosion, and beach degradation, while at the same time offering a range of benefits for people and nature.
120
CONCLUSION Global warming produces an increase in sea levels and an intensification of extreme events in terms of severity and frequency (IPCC, 2022). It, therefore, imposes the necessity of an innovative approach for coastal defence design in unstable climatic conditions (Foti et al., 2020).
121
ACKNOWLEDGMENT
Fig. 112 Rocks forming a barrier to powerful waves. Photograph by Ron Jude (2021)
I want to thank Anna Aslaug Lund and Berit Kaae for their supervision and guidance throughout the process.

AcademicBooks: papers
Cooper, J. A. G., & Mckenna, J. (2008). Working with natural processes: the challen ge for coastal protection strategies. Geographical Journal, 174(4), 315–331. https:// doi.org/10.1111/j.1475-4959.2008.00302.x
122 BIBLIOGRAPHY
Lund, A. A., Jørgensen, G., & Fryd, O. (2022). Layered Landscapes of Welfare Values – Revisi ting Køge Bay Beach Park in Denmark. Architecture and Culture, 10(1), 117–138. htt ps://doi.org/10.1080/20507828.2021.2019975
de Schipper, M. A., Ludka, B. C., Raubenheimer, B., Luijendijk, A. P., & Schlacher, T. A. (2020). Beach nourishment has complex implications for the future of sandy shores. Nature Reviews Earth & Environment, 2(1), 70–84. https://doi.org/10.1038/s43017-02000109-9 Faragò, M., Rasmussen, E.S., Fryd., O., Rønde Nielsen, E., and Arnbjerg-Nielsen, K. (2018). Coastal protection technologies in a Danish context. Vand i Byer – Innovationsnet værk for klimatilpasning, Taastrup, Denmark. Foti, E., Musumeci, R. E., & Stagnitti, M. (2020a). Coastal defence techniques and climate change: a review. Rendiconti Lincei. Scienze Fisiche e Naturali, 31(1), 123–138. https:// doi.org/10.1007/s12210-020-00877-y
Taleb, N. N. (2012). Antifragile: Things That Gain from Disorder (Incerto) (First Edition). Random House. Rasmussen, E. (2019). Kystsikring og kystudvikling i Danmark. NATOUR Climate, Research, Development & Design. Arnbjerg-Nielsen, K. (2006). Significant climate change of extreme rainfall in Denmark. Water Science and Technology, 54(6–7), 1–8. https://doi.org/10.2166/wst.2006.572 (Arnbjerg-Nielsen, 2006) Bongarts Lebbe, T., Rey-Valette, H., Chaumillon, R., Camus, G., Almar, R., Cazenave, A., Claudet, J., Rocle, N., Meur-Férec, C., Viard, F., Mercier, D., Dupuy, C., Ménard, F., Rossel, B. A., Mullineaux, L., Sicre, M. A., Zivian, A., Gaill, F., & Euzen, A. (2021). Desig ning Coastal Adaptation Strategies to Tackle Sea Level Rise. Frontiers in Marine Science, 8. Buurman,https://doi.org/10.3389/fmars.2021.740602J.,&Babovic,V.(2016).AdaptationPathways and Real Options Analysis: An ap proach to deep uncertainty in climate change adaptation policies. Policy and Society, 35(2), 137–150. https://doi.org/10.1016/j.polsoc.2016.05.002
Linham, M. M., & Nicholls, R. J. (2012). Adaptation technologies for coastal erosion and flooding: a review. Proceedings of the Institution of Civil Engineers - Maritime Enginee ring, 165(3), 95–112. https://doi.org/10.1680/maen.2011.29
Moosavi, S. (2017). Ecological Coastal Protection: Pathways to Living Shorelines. Procedia Engineering, 196, 930–938. https://doi.org/10.1016/j.proeng.2017.08.027
Untitled [Photograph]. Sohn Fine Art. https://www.sohnfineart.com/rachael-tali bart-sirens Waider, J. (2021). Landscape In Motion [Photograph]. Behance. https://www.behance.net/galle ry/145170207/Landscape-In-Motion-Chapter-2-WAVES?tracking_source=search_pro jects%7CPowerful%20waves%20
Antropocene [Photograph]. Edwardburtynsky. https://www.edwardburtynsky. Denford,com/contact/copyrightC.(2022).
De Zandmotor. (2022, January 18). Zandmotor. https://dezandmotor.nl/
Zeegras [Photograph]. Waddenmozaik. https://www.waddenmozaiek.nl/bescherm Hansen,de-gebieden/M.(n.d.).
Køge Bugt ved Stevns [Photograph]. Koegebugtstenrev. https://koegebugtstenrev. dk/galleri/ Hegen, T. (2021). The oyster farm series [Photograph]. Behance. https://www.behance.net/galle Internationalry/116446189/The-Oyster-Farm-Series?locale=nl_NLspacestation.(2022,May8).
Online Reports/ Websites
Storm Eunice [Photograph]. Craig Denford Photography. https://www.craigden Govers,fordphotography.co.uk/L.(2017).
Bretz, C. (2018). 80m Sea Level Rise [Illustration]. Behance. https://www.behance.net/galle Burtynsky,ry/66546943/80m-Sea-Level-RiseE.(2018).
Karst and colors on the yucatan peninsula [Photograph]. Earth Observatory. Internationalthe-yucatan-peninsulahttps://earthobservatory.nasa.gov/images/149809/karst-and-colors-on-spacestation.(2022a,March17).
123
Churning Channel [Photograph]. Earth Observatory. Koublis,https://earthobservatory.nasa.gov/images/149660/churning-channelP.(2022). Silentia [Photograph]. http://petroskoublis.com/silentia/txt.html
Photography / image credits Riesto, S., Egberts, L., Lund, A. A., & Jørgensen, G. (2021). Plans for Uncertain Futures: Heritage and Climate Imaginaries in Coastal Climate Adaptation. International Journal of Heritage Studies, 28(3), 358–375. https://doi.org/10.1080/13527258.2021.2009538
Markermeer waddeneilanden. (2020, May 21). [Photograph]. Natuurmonumenten. https:// Talibart,www.natuurmonumenten.nl/projecten/marker-waddenR.(2022).
COWI, 2017. Byernes udfordringer med havvandsstigning og stormflod. Realdania, København. [WWW Document]. URL https://realdania.dk/DHV Group. (2003, November). Case study KØGE BAY (DENMARK). Eurosion. http://copranet.projects. eucc-d.de/files/000110_EUROSION_Koge_bay.pdf
Life in an estuary. (2019, February 1). National Oceanic and Atmospheric Administration. https:// ries%20filter%20out%20sediments%20and,for%20humans%20and%20marine%20life.www.noaa.gov/education/resource-collections/marine-life/life-in-estuary#:%7E:text=Estua
UNEP DTU Partnership. (2016, August 11). Beach nourishment | Climate Technology Centre & Network. Ctc-n. https://www.ctc-n.org/technologies/beach-nourishment
NATURA 2000 - STANDARD DATA FORM. (2022, July 2). Natura 2000. https://natura2000.eea.euro pa.eu/Natura2000/SDF.aspx?site=DK00VA305#3 Oyster-tecture. (2019, January 16). SCAPE. https://www.scapestudio.com/projects/oyster-tecture/ Rambøll. (2015). Udredning Om Tilpasning Til Havvandsstigninger (Rapport). https://realdania.dk/-/ media/Realdaniadk/S%C3%A5dan-St%C3%B8tter-vi/Filantropiske-programmer/Samlet-projektliste/ Havvandsudredning/Rapport_udredning-om-klimatilpasning-til-havvandsstigninger_VER2.pdf Skov- og Naturstyrelsen, Miljø- og Energiministeriet. (2001). Forundersøgelsen I Kommuneatlas Stevns [WWW Document]. https://stevns.viewer.dkplan.niras.dk/media/240697/Forundersoe gelsen.pdf
Stevns Kommune. (2022, March 21). Projekt Strøby Egede og vandet [Onlinemøde informationsmøde]. Projekt Strøby Egede og Vandet Onlinemøde informationsmøde, Strøby Egede, Stevns, Danmark. https:// 21mar2022%20Str%C3%B8by%20Egede%20og%20Vandet.pdfstevns.dk/Media/637835559458804311/Pr%C3%A6sentation%20onlinem%C3%B8de%20
124 ESA. (2018, September). Spotlight on sea-level rise. https://www.esa.int/Applications/Observing_the_ Earth/Spotlight_on_sea-level_rise
Villazon, L. (2020, 20 april). What would happen if the sea level rose by two metres? BBC Science Focus Ma gazine. Geraadpleegd op 30 augustus 2022, van https://www.sciencefocus.com/planet-earth/whatwould-happen-if-the-sea-level-rose-by-two-metres/
IPCC. (2022). Climate Change 2022: Impacts, Adaptation, and Vulnerability. Contribution of Working Group II to the Sixth Assessment Report of the Intergovernmental Panel on Climate Change [H.-O. Pörtner, D.C. Roberts, M. Tignor, E.S. Poloczanska, K. Mintenbeck, A. Alegría, M. Craig, S. Langsdorf, S. Lösch ke, V. Möller, A. Okem, B. Rama (eds.)]. Cambridge University Press. https://www.ipcc.ch/srccl/down Københavnsload/ Kommune. (2017). Stormflodsplan for København 2017 [WWW Document]. kk.dk/sites/default/files/edoc/7932be34-6e51-450a-bc4ffa2c2b00c1b3/c72e0cf7-3b8f-461a-bf35-https://www. 536e7e239267/Attachments/18135652-234733701.PDF.
WXY / West8 / Stevens Institute of Technology / AIR Worldwide / Arcadis. (2021, December). The Blue Dunes Report. https://rebuildbydesign.org/wp-content/uploads/2021/12/669.pdf
EU OURCOAST-Project. (2015, December). Land reclamation for coastal defence and tourism development, Køge Bay - DK. Eurosion.COAST_039_DK_Case_LandReclamationKoegeBay.pdfhttps://discomap.eea.europa.eu/map/Data/Milieu/OURCOAST_039_DK/OUR(2004,May).
Living with coastal erosion in Europe: Sediment and Space for Sustainability http://www.eurosion.org/reports-online/part1.pdf
125
Fig. 113 Sedimentation processes along the Icelandic coast. Photograph by Waider. J (2021).

