
Points of Eruption Providing Habitats and Refuge for Threatened Grassland Flora on the Victorian Volcanic Plains
Introduction
The Victorian Volcanic Plains (VVP) is home to the critically endangered Native Grasslands ecosystem, which, severely affected by agriculture, urbanization, and introduced species in the past 200 years, presently sees less than 1% of its pre-settlement extent remain, existing as roadside remnants and other small patch habitats (Department of Sustainability and Environment, 2020) (Stuwe, 1986) In 2010, a plan was laid out by the Government of Victoria for the purchasing of some 15000ha of land west of Werribee, in the establishment of a Native Grasslands Reserve to offset clearing for new suburbs However, by 2020, only 1568ha were purchased (Victorian AuditorGeneral's Office, 2020), highlighting the need for new measures of conservation.
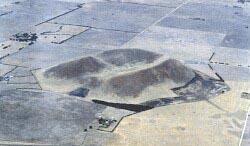
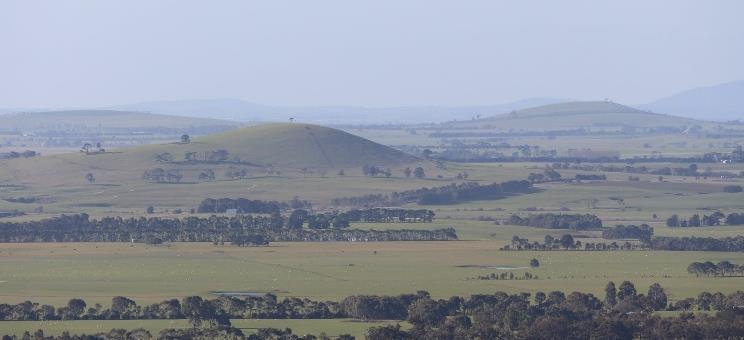
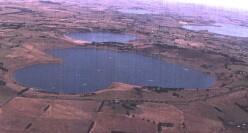
Out of several species from the Native Grasslands ecosystem that are known to be particularly at risk (table 1) (DCCEEW, 2022), a categorical difference that subdivides these were found to be their propensities for either well drained, stony soils, or for poorly drained, at times saline soils in lowland areas (RBGV, 2023). These edaphic factors are heavily affected by topography (Langebein, 1947) An examination of the topography of the VVP then brings its many volcanic eruption points to the forefront. These eruption points, some simple, others compound, number in the hundreds. They exist as domes, shields, craters, or maar crater lakes (Agriculture Victoria, 2011). Generally, topographic elevation, or in the case of multiple eruptions at a single site, complexities, result in a mixture of free-draining and poorly drained sites (Douglas & Ferguson, 2003). It is also postulated here that historically, their difficult terrain likely experienced less disturbance from cropping, trampling, browsing, and grazing than their surrounding plains (VDSE, 1999).
This report therefore sets out to investigate these points of volcanic eruption. The hypothesis put forth is that they, through topographical complexity and associated differential drainage and disturbance, provide habitats and refuge for threatened flora. Spatial analysis aims to capture any correlation between these points of eruption and density of spatial records of threatened flora, either preferring dryland or wetlandadjacent habitats, in their immediate surrounding areas. If correlation is found, the intention of the report is to give grounds to the marking of these eruption sites as potential conservation/restoration sites for threatened flora in the VVP bioregion. This might come in the form of individual conservation sites, or by informing landscape-scale frameworks of conservation and restoration in the region.
Methods
Study area
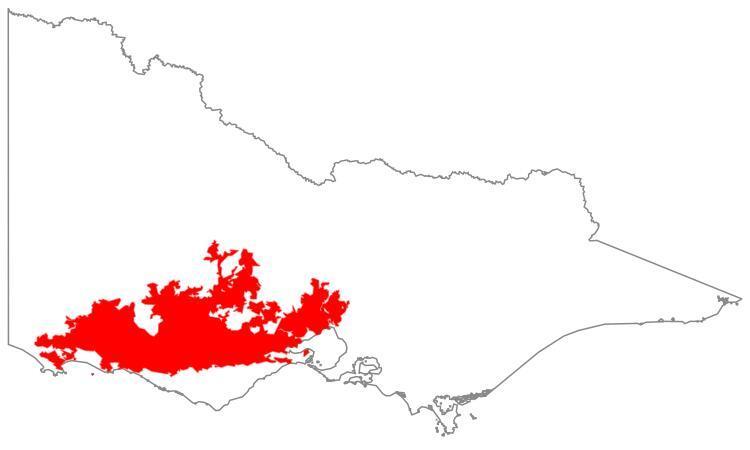
The study area is set by the 1:100000 boundary of the Victorian Volcanic Plains (VVP) Bioregion (figure 4). Although volcanic eruptions occur outside of this boundary, the boundary contains most eruption points and offers ease of computation for the establishment of control areas and sourcing of other data.
Occurrences of Threatened Flora
The list of threatened flora is derived from the DCCEEW species profile and threats database for Natural Temperate Grasslands and Grassy Eucalypt Woodlands of the Victorian Grassy Plains. Species have been further researched and listed below. They are separated into two categories of wetland-adjacent and dryland, per their commonly found habitats (Vic Flora).
Table 1: List of threatened flora Wetland-adjacent species Carex tasmanica Curly Sedge Vulnerable Dodonaea procumbens Trailing Hop-bush Vulnerable
Lachnagrostis adamsonii Adamson’s Blowngrass Endangered
Lachnagrostis deflexa Deflexed Blown-grass Endangered
Lachnagrostis robusta Tall Blown-grass Endangered
Lepidium aschersonii Spiny Pepper-cress Vulnerable
Lepidium hyssopifolium Basalt Pepper-cress
Endangered
Prasophyllum diversiflorum Gorae Leek-orchid Endangered
Prasophyllum suavoles Fragrant Leek-orchid Endangered
Senecio macrocarpus Large-fruit Groundsel Vulnerable
Senecio psilocarpus Swamp Fireweed Vulnerable
Xerochrysum palustre Swamp everlasting Vulnerable
Dryland species
Dianella amoena Matted Flax-lily Endangered Diuris fragrantissima Sunshine Diuris Endangered
Diuris basaltica Small Golden Moths Orchid
Endangered
Diuris behrii Golden Cowslips Endangered Diuris gregaria Clumping Golden Moths Critically Endangered
Glycine latrobeana Clover Glycine Vulnerable
Leucochrysum albicans subsp. tricolor Hoary Sunray Endangered
Pimelea spinescens subsp. spinescens Plains Rice-flower Critically Endangered
Pterostylis basaltica Basalt Greenhood Endangered
Rutidosis leptorhychoides Button Wrinklewort Endangered
Geospatial records of these species were sourced from the Australasian Virtual Herbarium. These records comprise of research data (VBA) as well as public records (ALA) and exist as presence-only data.
The data is filtered such that only species distribution modelling (SDM) profiles were included (i.e., specimen and observation data). Spatially suspect, environmental outlier, duplicate, and pre-2000 records were filtered and excluded. This returned a total of 2026 records for wetland-adjacent species, and 5693 records for dryland species, making a total of 7719 records. The data was received in .csv format and were introduced into QGIS.
Areas of Eruptive Affect (AEA)
Although volcanoes differ in size and type across the region, no spatial record could be found which documented their size nor type. Only a set of eruption points, created by Julie Boyce of Monash University, could be sourced. Notably, the eruption points were at times closely clustered, as many eruptions have formed what is a single visually conspicuous dome/crater (e.g., Mt Napier, Red Rock). Nevertheless, all points were clipped to the extent of the VVP bioregion in QGIS. Several steps were required to quantify the topographic influence of eruptions on the landscape - i.e., to convert them from points to area. First, uniform buffer
polygons, set to 1500m in radius, were created around all eruption points, and resultant overlapping polygons were dissolved into single polygons. These polygons contain the topographically discernable shapes of the domes/mounds/maar craters, as well as their surrounding flat, basal areas, and will be referred to as Eruption Structure (ES) polygons.
A2100x2100m grid of square polygons was established covering the VVP bioregion. The dimensions of 2100x2100m were chosen to allow the complete covering a single grid by a buffer polygon.
Grids which intersect with buffer polygons are extracted. They represent areas of eruptive affect (AEA), which is defined as the area of differential edaphic conditions (free draining slopes and poorly draining base of hills) owing of sites of eruption.
Drainage Gradient
Of the AEA, the % area of a grid that falls under the ES polygon serves as an indicator of drainage. The greater the percentage (i.e., more of the grid is comprised of slopes), the better the expected drainage, the lesser the percentage (i.e., more of the grid is comprised of hill-bases), the worse the expected drainage. A drainage gradient score between 0 (worse drainage) to 1 (better drainage) was calculated for each grid of AEA. This is done by first rasterizing the ES polygons (displayed in black) and converting the resulting RGB raster to two colour PCT. At this stage the ES areas are grey, taking on a value of 0, while surround white areas take on values of 1. Zonal statistics is then used to calculate the mean values in each gird ofAEA. The inverse of the mean, i.e., 1-minus-mean, gives the aforementioned drainage gradient score between 0 and 1.
Reserve Influenced (RI) Areas
In some areas ofAEA, there exists overlaps with or the containment of national/state parks and reserves. As these areas are protected from agricultural or other human modifications of habitat, that which otherwise give premise the value of eruption points,AEAs which intersect with these parks and reserves are earmarked as reserve influenced (RI). For simplicity, this influence has not been quantified, but rather treated as qualifying/not qualifying (i.e., reserve influenced/not reserve influenced (NRI)).
Data Derivation and Graphing
Wetland-adjacent, dryland, and all occurrences of threatened flora in each grid ofAEAare counted with the count points in polygon command. At this interval, each grid possesses a drainage gradient score, is qualified as either reserve influenced/not
reserve influenced, and possesses three occurrence counts (wetland-adjacent, dryland, total). The data is exported from QGIS in .csv format and transferred into Excel.
The number of threatened flora occurrences (wetlandadjacent, dryland, total) in AEA is recorded.
Column graphs showing cumulative no. of occurrences of wetland-adjacent, dryland and total species, at drainage gradient scores (aligned to intervals of 0.025), are created. Counts in RI AEA and NRI AEA are differentiated in light grey and black.
A histogram of the drainage gradient score is created to illustrate inherent area distribution inequities of each 0.025 interval, against which the recorded occurrences should be interpreted.
Control
A set of random points are created in areas outside of AEA. They receive the same manipulations as eruption points and serve as control areas. Species occurrence counts are made from these areas in the same way they are made in AEA. Here, they reflect the levels of stochasticity in relation to species occurrence in the landscape where points of eruption are not a factor.
Visual aids
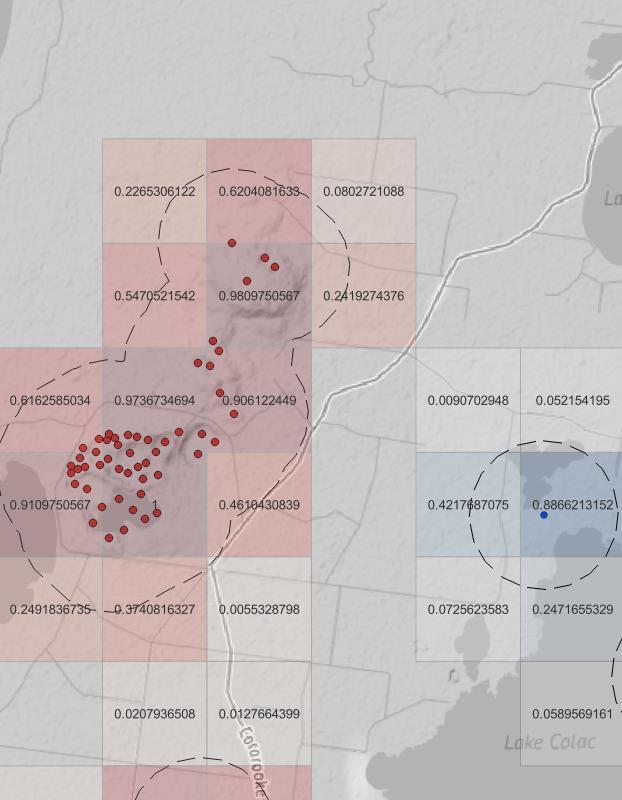
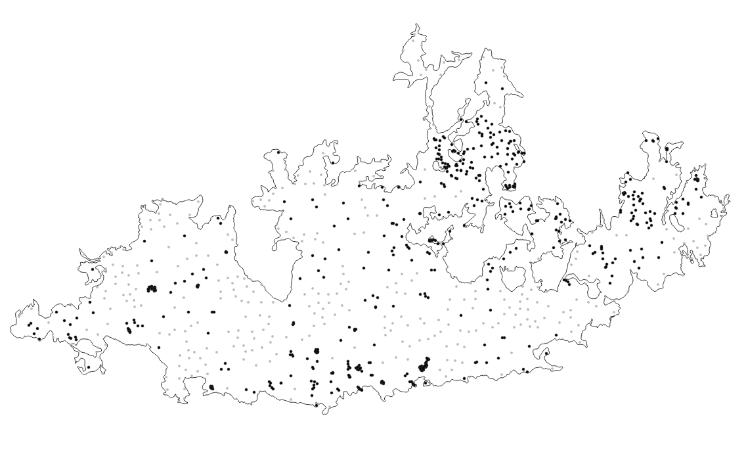
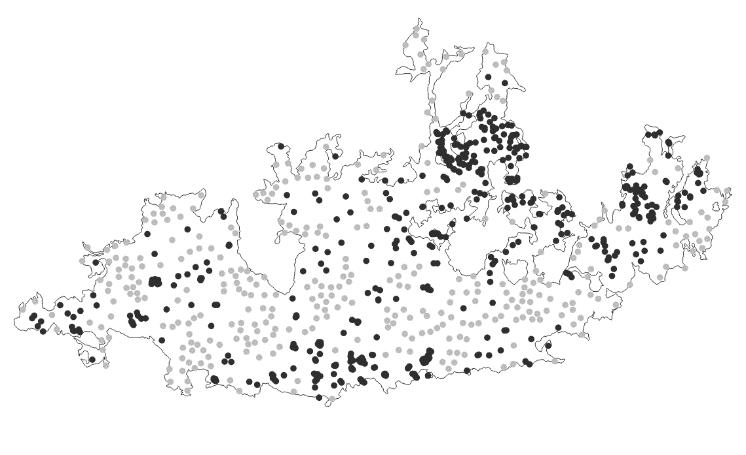
Figure 10: AEA - occurrences of
Figure 11: AEA - occurrences of wetland-adjacent species
Figure 15: Control - occurrences of wetland-adjacent species
12: AEA - occurrences of dryland species
16: Control - occurrences of dryland species
Table 2: Total number of occurrences
Wetland-adjacent NIR IR
AEA 157 41
Control 90 78
AEA Total: 198
Control Total: 168
Dryland NIR IR
AEA 342 128
Control 384 165
AEA Total: 470
Control Total: 549
Combined NIR IR
AEA 499 169
Control 474 243
AEA Total: 668
Control Total: 717
Number of grids NIR IR
AEA 1179 236
Control 1371 238
AEA Total: 1415
Control Total: 1609
Table 3: Adjusted total number of occurrences
Wetland-adjacent NIR IR
AEA 157 41
Control 77 77
AEA Total: 198
Control Total: 154
Dryland NIR IR
AEA 342 128
Control 330 164
AEA Total: 470
Control Total: 494
Combined NIR IR
AEA 499 167
Control 407 241
AEA Total: 668
Control Total: 648
Total Number of Occurrences
After adjusting for the differential area counted under Areas of Eruptive Affect (AEA) and control areas (Table 2, Number of Grids), the number of threatened flora records counted within AEA not influenced by reserves (NIR) were higher than that of NIR control areas (Table 3). Wetland-adjacent species were recorded 157 times in NIR AEA, compared to 77 in NIR control areas. Dryland species were recorded 342 times in NIR AEA, compared to 330 times in NRI control areas. Both habits combined were then recorded 499 times in NIR AEA, to 407 times in NIR control areas.
The adjusted combined counts NIR and IR for AEA and control areas were without marked differences. This is because higher NIR counts recorded by AEA are diluted by higher IR counts recorded in control areas (Table 3, IR values).
Occurrences vs Drainage Gradient
Firstly, analysis of the histograms shows that in both AEA and control areas, a greater cumulative number of grids, i.e., greater areas, fell under low drainage scores, decreasing sharply as drainage scores increased (figure 12, 17). The two histograms differed where the AEA histogram showed a sharper fall in area than the Control histogram between drainage scores of 0 and 0.1, as well as towards the tail end - where a larger portion of overall area fell between the 0.950-1 range in the AEA histogram compared to the control histogram. These trends of differential distributions of areas of drainage gradients are expected, as circular buffer polygons overlaid with grid naturally produce greater areas of low drainage scores than high drainage scores (figure 5), and eruption points are more clustered than the randomly generated control points (figure 6). These trends are the base expected values carried forth when analyzing occurrences vs drainage gradient, as area is strongly correlated with occurrences.
The correlation of area with occurrences is largely corroborated by the control - occurrences vs drainage gradient graphs (figures 14, 15 & 16). Here, where drainage gradient score is a faux variable and should not show any trends, higher cumulative counts are observed at higher drainage gradient scores decreasing as drainage gradient scores increases, per the histogram. Deviations to the histogram trend can here be considered as an indication of stochasticity.
The examination of combined occurrences under AEA vs drainage gradient yielded three anomalous intervals of the drainage gradients, indicating high occurrence counts, each at 0.125-0.175, 0.625, and 0.950 (figure 10). The first anomaly, at 0.125-0.175, be attributed to wetland-adjacent species (figure 11). The second anomaly, at 0.625 can be attributed to dryland species (figure 12), while the third anomaly, at 0.950, can be attributed almost equally to both species.
Interpretation
Interpretation
Total number of occurrences
From the observed total numbers of occurrences, areas adjacent to eruption points recorded higher counts of threatened species of flora than non-adjacent areas. The difference can mainly be attributed to wetland
adjacent species, which recorded more than double the number of occurrences under AEA than control areas. Dryland species, instead, were not shown to occur significantly more frequently in AEA. In this sense, the notion that areas adjacent to eruption point on the VVP can be seen to be a source of refuge for threatened grassland species is supported for wetland-adjacent species, but is neither supported nor disproved for dryland species.
Occurrences vs Drainage Gradient
Anomalies observed in AEA vs drainage gradient score graphs the indicate that wetland-adjacent species were more frequently found in areas of poorer drainage (low-lying areas adjacent to eruption structures) (0.125-0.150), while dryland species were more likely found at areas of better drainage (sloped areas, closer to eruption points) (0.625). This corresponds well to expectations, as the differential habits of these species should, and indeed do, find habitat and refuge in the differential drainage conditions surrounding eruption points. The higher counts in areas with an aligned drainage gradient of 0.950 also saw a slight increase in the number of occurrences for both wetland-adjacent and dryland species. Here, the drainage gradient score is better interpreted in its primitive form, that is an indicator of closeness to eruption point. This might then be explained by the fact that while some eruption structures are shields and cones, which see high rates of drainage at their peaks and thereby support dryland species (Hickson, et al., 2022), others are craters, which are often inundated close to their points of eruption (Hickson, et al., 2022), and likely see wetland species. Overall, the notion that volcanic eruption points are a source of suitable habitats for threatened grassland species can be said to be supported.
Discussion
Records of Threatened Flora
Flora surveys data in the counts are of the presenceonly type, and largely comprised of incidental observation data. This presents a distribution of the species in question that is far from perfect, as the likelihood of observing a species in an area is affected by a range of factors, such as the area's accessibility, remoteness, population (i.e., determining the number of observers), etc. (Valavi, et al., 2021). These effects can be seen can be seen in figure 9, where although nevertheless informed by the species real distribution, records occur in higher densities to the east, next to the major population centre of Melbourne, while other records frequently surround roads and paths, forming linear lines
Inaccuracies of distribution may also be particularly affective in eruption adjacent areas, in that eruption structures, as likely as they are postulated to receive reduced disturbances from land-use factors, are as unlikely to be the subject of thorough surveys. This leads to a sparsity of occurrence records around eruption structures and increases the likelihood that recorded spikes of occurrences (e.g., figure 11 & 12) are contributed by incidental incursions of, for example, roadside remnants.
Eruption Structures and Drainage Gradients
The drawing of eruption structures as circular polygons 1500m in diameter surrounding points of eruption, and the subsequent derivation of the drainage gradient by the overlapping of grids, together consists in a crude approximation of actual the actual eruption structures. The differences between eruption structures among the eruption points on the volcanic plains, and drainage patterns, are each multivariate and specific (Agriculture Victoria, 2011). The buffer distance of 1500m was chosen on the precautionary principle to cover even the most prominent volcanic eruption structures - even then drastically simplifying their topography - but grossly overestimates the topographic change surrounding smaller eruption points. These factors suggest that the drainage gradient is at best a rough approximation of drainage conditions at site. In defense of its use, however, is the fact that even with better approximations of eruption structures and finer scale derivations of drainage gradients, little may be gained owing to the sparsity of species records for eruption adjacent areas.
Conclusion
The report supports notions stating eruptions points on the VVP present as structures of refuge for wetlandadjacent species, as well as poorly/well drained habitats for both wetland-adjacent and dryland threatened grassland plant species. However, more research is needed to better capture correlations between eruption points and threatened grassland flora, and to preclude other factors that may have shaped the results of this report. A thorough survey of the eruption-affected and control areas which yield presence/absence data for the threatened species in question, combined with refined analysis discerning of specific drainage characteristics of eruption structures, is required to this end.
References
Agriculture Victoria, 2011. VRO: 6.1.1 Eruption points; maars, scoria cones and lava shields, including associated ash and scoria deposits. [Online]
Available at:
https://vro.agriculture.vic.gov.au/dpi/vro/vrosite.nsf/pa ges/landform_geomorphological_framework_6.1.1 [Accessed 13 6 2023].
DCCEEW, 2022. Natural Temperate Grassland of the Victorian Volcanic Plain, Species Profile and Threats Database. [Online]
Available at: http://www.environment.gov.au/cgibin/sprat/public/publicshowcommunity.pl?id=46 [Accessed 13 6 2023].
Department of Sustainability and Environment, 2020. EVC/ Bioregion benchmark for vegetation quality assessment, Melbourne: Department of Sustainability and Environment.
Douglas, J. G. & Ferguson, J.A., 2003. Geology of Victoria. 3 ed. Melbourne: Victoria Division Geological Society ofAustralia.
Hickson, C. J., Tilling, R. I. & Morison, C.A. G., 2022. Factors influencing the morphology of volcanic deposits and landforms. Treatise on Geomorphology, Volume 9, pp. 675-714.
Langebein, W. B., 1947. Topographic characteristics of drainage basins, Washington: United States Government Printing Office.
RBGV, 2023. Carex tasmanica, VicFlora; Dianella amoena, VicFlora; Lepidium aschersonii, VicFlora, etc. [Online]
Available at: https://vicflora.rbg.vic.gov.au/flora/taxon/0ea7d0373a1a-4736-bcd3-49c30ad13139 [Accessed 11 6 2023].
Stuwe, J., 1986. An assessment of the conservation status of native grasslands on the western plains, Victoria and sites of botanical signficance, Bundoora: Department of Botany, La Trobe University.
Valavi, R., Guillera-Arroita, G., Lahoz-Monfort, J. & Elith, J., 2021. Predictive performance of presenceonly species distribution models: a benchmark study with reproducible code. Ecological Monographs, 92(1).
VDSE, 1999. Approved Conservation Advice for the Grassy Eucalypt Woodland of the Victorian Volcanic Plain. Melbourne, VDSE.
VictorianAuditor-General's Office, 2020. Protecting Critically Endangered Grasslands, Melbourne: VictorianAuditor-General's Office.