


LuxuryRealEstateSalesbyFlorinPopescuGroupisconstantlymonitoringthelocalreal estatemarket.ThisreportincludesfiguresontheGreaterAtlantaAreabypricepoint. Itismyhopethatwhetheryouareabuyer,seller,oracurioushomeowner,thisinformation providesvaluableinsightsintothecurrentstateofthelocalrealestatemarketandmore specifically,themarketinGreaterAtlanta.Irecommendusingthisinformationasaguide,then reachouttomewithanyquestionsthatyoumayhave.Alsoincludedaresomeinformative articlesonthelatestHomeandKitchendesigntrendsand10Renovationideasforyourhome! TheFlorinPopescuGrouphasalongandsuccessfulhistory,over29years,helpingbuyersand sellersineverypricepointtoreachtheirrealestategoals.Ipridemyselfonhavingtheright toolsandknowledgetohelpyounavigatetherealestatemarket.Ifyouhaveanyquestionsas youworkthroughthisdocument,feelfreetocontactme. FlorinPopescu KellerWilliamsLuxury whereluxurylives@gmail.com (770)891 2045 *This information within is deemed reliable, but is not guaranteed. All figures reflect single family homes in Greater Atlanta. Source FMLS


YEAR IN REVIEW TOTAL SALES AND STATISTICS FOR EACH PRICE POINT BY COUNTY HERE'S A QUICK GLANCE AT GREATER ATLANTA'S MARKET SALES FOR THE PAST FOUR YEARS, 2019 THROUGH 2022 THIS INFORMATION IS COLLECTED AS OF JUNE 30, 2022 $ 0 ~ $ 500,000 : Forsyth NUMBER OF SALES MEDIAN SALES PRICE AVERAGE SALES PRICE 3,576 2019 3,557 2020 2,526 2021 731 2022 $337,945 2019 $350,000 2020 $390,000 2021 $417,500 2022 $336,248 2019 $349,532 2020 $379,473 2021 $397,140 2022 AVERAGE SALES TO LIST PRICE AVERAGE DAYS ON MARKET 98.1% 2019 98.6% 2020 101.6% 2021 102.9% 2022 55 2019 42 2020 16 2021 16 2022
97.3% 2019 98% 2020 101.6% 2021 63 2019 53 2020 21 2021 $500,000 ~ $ 1,000,000 : Forsyth NUMBER OF SALES MEDIAN SALES PRICE AVERAGE SALES PRICE 836 2019 1,099 2020 1,822 2021 1477 2022 $590,000 2019 $589,900 2020 $614,278 2021 $641,000 2022 $623,898 2019 $628,246 2020 $645,076 2021 $667,741 2022 AVERAGE SALES TO LIST PRICE AVERAGE DAYS ON MARKET 104.84% 2022 12 2022
95.2% 2019 96.6% 2020 99.7% 2021 81 2019 64 2020 25 2021 $1,000,000 ~ $ 1,500,000 : Forsyth NUMBER OF SALES MEDIAN SALES PRICE AVERAGE SALES PRICE 38 2019 61 2020 144 2021 131 2022 $1,177,500 2019 $1,170,000 2020 $1,182,500 2021 $1,175,000 2022 $1,192,470 2019 $1,190,048 2020 $1,186,115 2021 $1,198,183 2022 AVERAGE SALES TO LIST PRICE AVERAGE DAYS ON MARKET 102.95% 2022 14 2022
94.8% 2019 94.8% 2020 98.7% 2021 47 2019 89 2020 50 2021 $1,500,000 and Up : Forsyth NUMBER OF SALES MEDIAN SALES PRICE AVERAGE SALES PRICE 7 2019 13 2020 33 2021 33 2022 $1,595,000 2019 $1,775,000 2020 $1,750,000 2021 $1,699,000 2022 $1,631,571 2019 $1,871,619 2020 $1,975,180 2021 $2,000,876 2022 AVERAGE SALES TO LIST PRICE AVERAGE DAYS ON MARKET 99.14% 2022 31 2022
98.4% 2019 98.5% 2020 101.3% 2021 60 2019 62 2020 18 2021 $0 ~ $500,000 : Gwinnett NUMBER OF SALES MEDIAN SALES PRICE AVERAGE SALES PRICE 5,000+ 2019 5,000+ 2020 5,000+ 2021 4,770 2022 $264,000 2019 $279,065 2020 $320,000 2021 $386,275 2022 $278,817 2019 $289,455 2020 $326,599 2021 $384,261 2022 AVERAGE SALES TO LIST PRICE AVERAGE DAYS ON MARKET 102.2% 2022 17 2022
97.2% 2019 97.8% 2020 101.0% 2021 70 2019 60 2020 23 2021 $500,000 ~ $1,000,000 : Gwinnett NUMBER OF SALES MEDIAN SALES PRICE AVERAGE SALES PRICE 559 2019 807 2020 1882 2021 1742 2022 $575,000 2019 $585,800 2020 $580,000 2021 $590,000 2022 $617,041 2019 $625,424 2020 $618,514 2021 $625,404 2022 AVERAGE SALES TO LIST PRICE AVERAGE DAYS ON MARKET 103.0% 2022 16 2022
92.6% 2019 94% 2020 97.7% 2021 145 2019 112 2020 41 2021 $1,000,000 ~ $1,500,000 : Gwinnett NUMBER OF SALES MEDIAN SALES PRICE AVERAGE SALES PRICE 57 2019 76 2020 117 2021 87 2022 $1,250,000 2019 $1,150,000 2020 $1,250,000 2021 $1,199,999 2022 $1,227,726 2019 $1,182,875 2020 $1,239,984 2021 $1,205,191 2022 AVERAGE SALES TO LIST PRICE AVERAGE DAYS ON MARKET 101.54% 2022 22 2022
91.4% 2019 94.5% 2020 95.9% 2021 254 2019 135 2020 101 2021 $1,500,000 and Up : Gwinnett NUMBER OF SALES MEDIAN SALES PRICE AVERAGE SALES PRICE 16 2019 24 2020 82 2021 54 2022 $1,862,500 2019 $1,869,400 2020 $1,812,500 2021 $1,899,500 2022 $1,939,092 2019 $1,911,946 2020 $2,019,914 2021 $2,123,894 2022 AVERAGE SALES TO LIST PRICE AVERAGE DAYS ON MARKET 97.1% 2022 45 2022

97.9% 2019 98.5% 2020 101.1% 2021 41 2019 36 2020 16 2021 $0 ~ $500,000 : North Fulton NUMBER OF SALES MEDIAN SALES PRICE AVERAGE SALES PRICE 2,127 2019 2,132 2020 1,852 2021 546 2022 $374,900 2019 $385,000 2020 $420,000 2021 $442,000 2022 $372,839 2019 $378,808 2020 $409,910 2021 $429,156 2022 AVERAGE SALES TO LIST PRICE AVERAGE DAYS ON MARKET 102.60% 2022 20 2022
97.8% 2019 98.3% 2020 101.5% 2021 60 2019 47 2020 20 2021 $500,000 ~ $1,000,000 : North Fulton NUMBER OF SALES MEDIAN SALES PRICE AVERAGE SALES PRICE 2,199 2019 2,585 2020 3,711 2021 1896 2022 $627,250 2019 $638,000 2020 $650,000 2021 $700,000 2022 $657,835 2019 $670,004 2020 $679,555 2021 $709,818 2022 AVERAGE SALES TO LIST PRICE AVERAGE DAYS ON MARKET 104.5% 2022 12 2022
96.1% 2019 96.5% 2020 98.7% 2021 79 2019 73 2020 33 2021 $1,000,000 ~ $1,500,000 : North Fulton NUMBER OF SALES MEDIAN SALES PRICE AVERAGE SALES PRICE 236 2019 304 2020 511 2021 394 2022 $1,175,000 2019 $1,175,000 2020 $1,210,000 2021 $1,200,000 2022 $1,202,816 2019 $1,198,376 2020 $1,221,627 2021 $1,213,102 2022 AVERAGE SALES TO LIST PRICE AVERAGE DAYS ON MARKET 104.73% 2022 16 2022
95% 2019 95.5% 2020 97% 2021 103 2019 88 2020 53 2021 $1,500,000 and Up : North Fulton NUMBER OF SALES MEDIAN SALES PRICE AVERAGE SALES PRICE 61 2019 72 2020 255 2021 197 2022 $1,784,359 2019 $1,797,000 2020 $1,850,000 2021 $1,925,000 2022 $2,001,606 2019 $2,007,521 2020 $2,039,154 2021 $2,118,864 2022 AVERAGE SALES TO LIST PRICE AVERAGE DAYS ON MARKET 99.2% 2022 29 2022
We have had an amazing experience with Florin! We used him on both the selling and buying sides and have nothing but wonderful things to say. He provided us with a tremendous amount of information about comps and fair market pricing when it was time to list. We were under contract within one day! He made it so easy for us on the selling end and his experience in negotiating the contract was invaluable. Our challenge was on the buying end trying to find the right home He was very patient and pointed out important details about each home that we would not have noticed. Florin is a wealth of knowledge and always provided unbiased information. He also was always able to accommodate our schedule and made the most of our time when we were searching. We would absolutely utilize Florin again in the future regardless of the circumstances and would highly recommend him! Who You Work With Matters in Greater Atlanta! Why Work With Florin? Our Sellers net an average of 2% more and sell 33 days faster. Here's what our clients are saying Stacey P. Over 29 Years of Experience Working for YOU!! Google Client Rating: 5 Gold Stars!


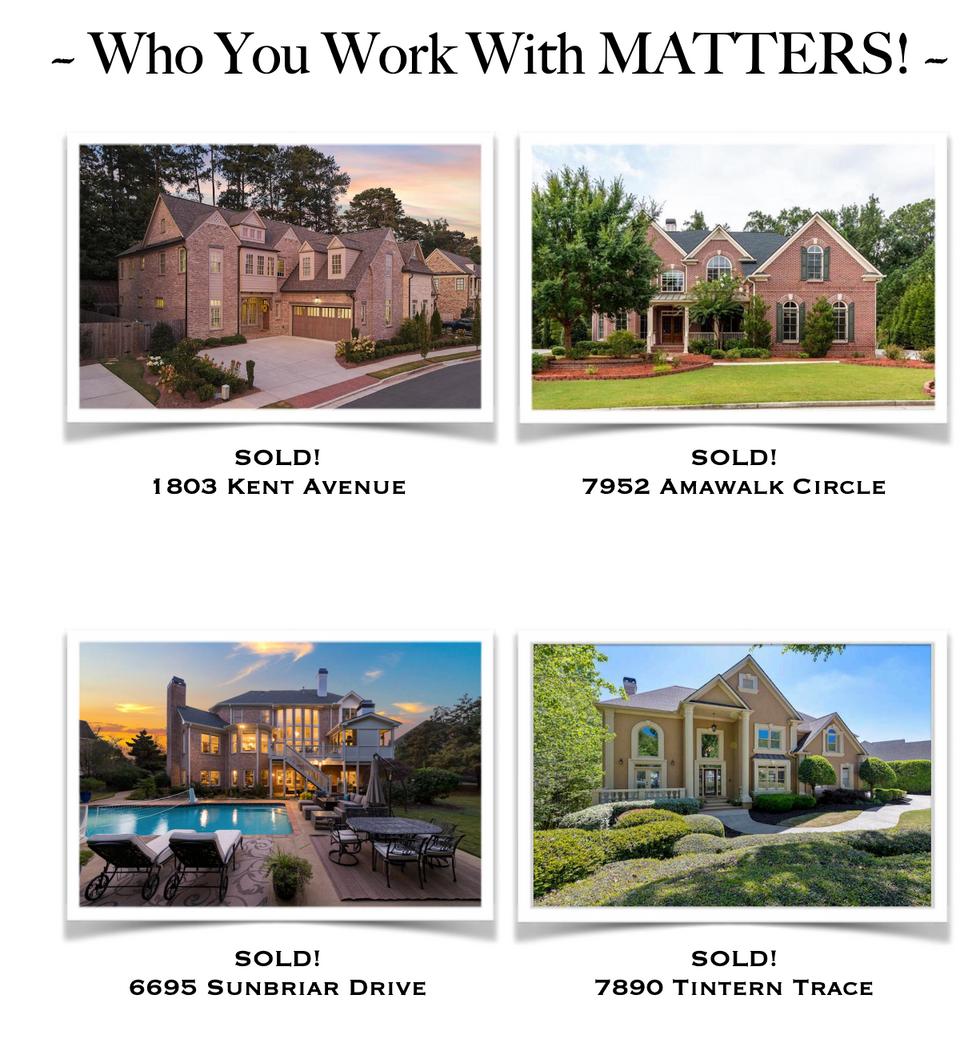
~ Who You With MATTERS! ~

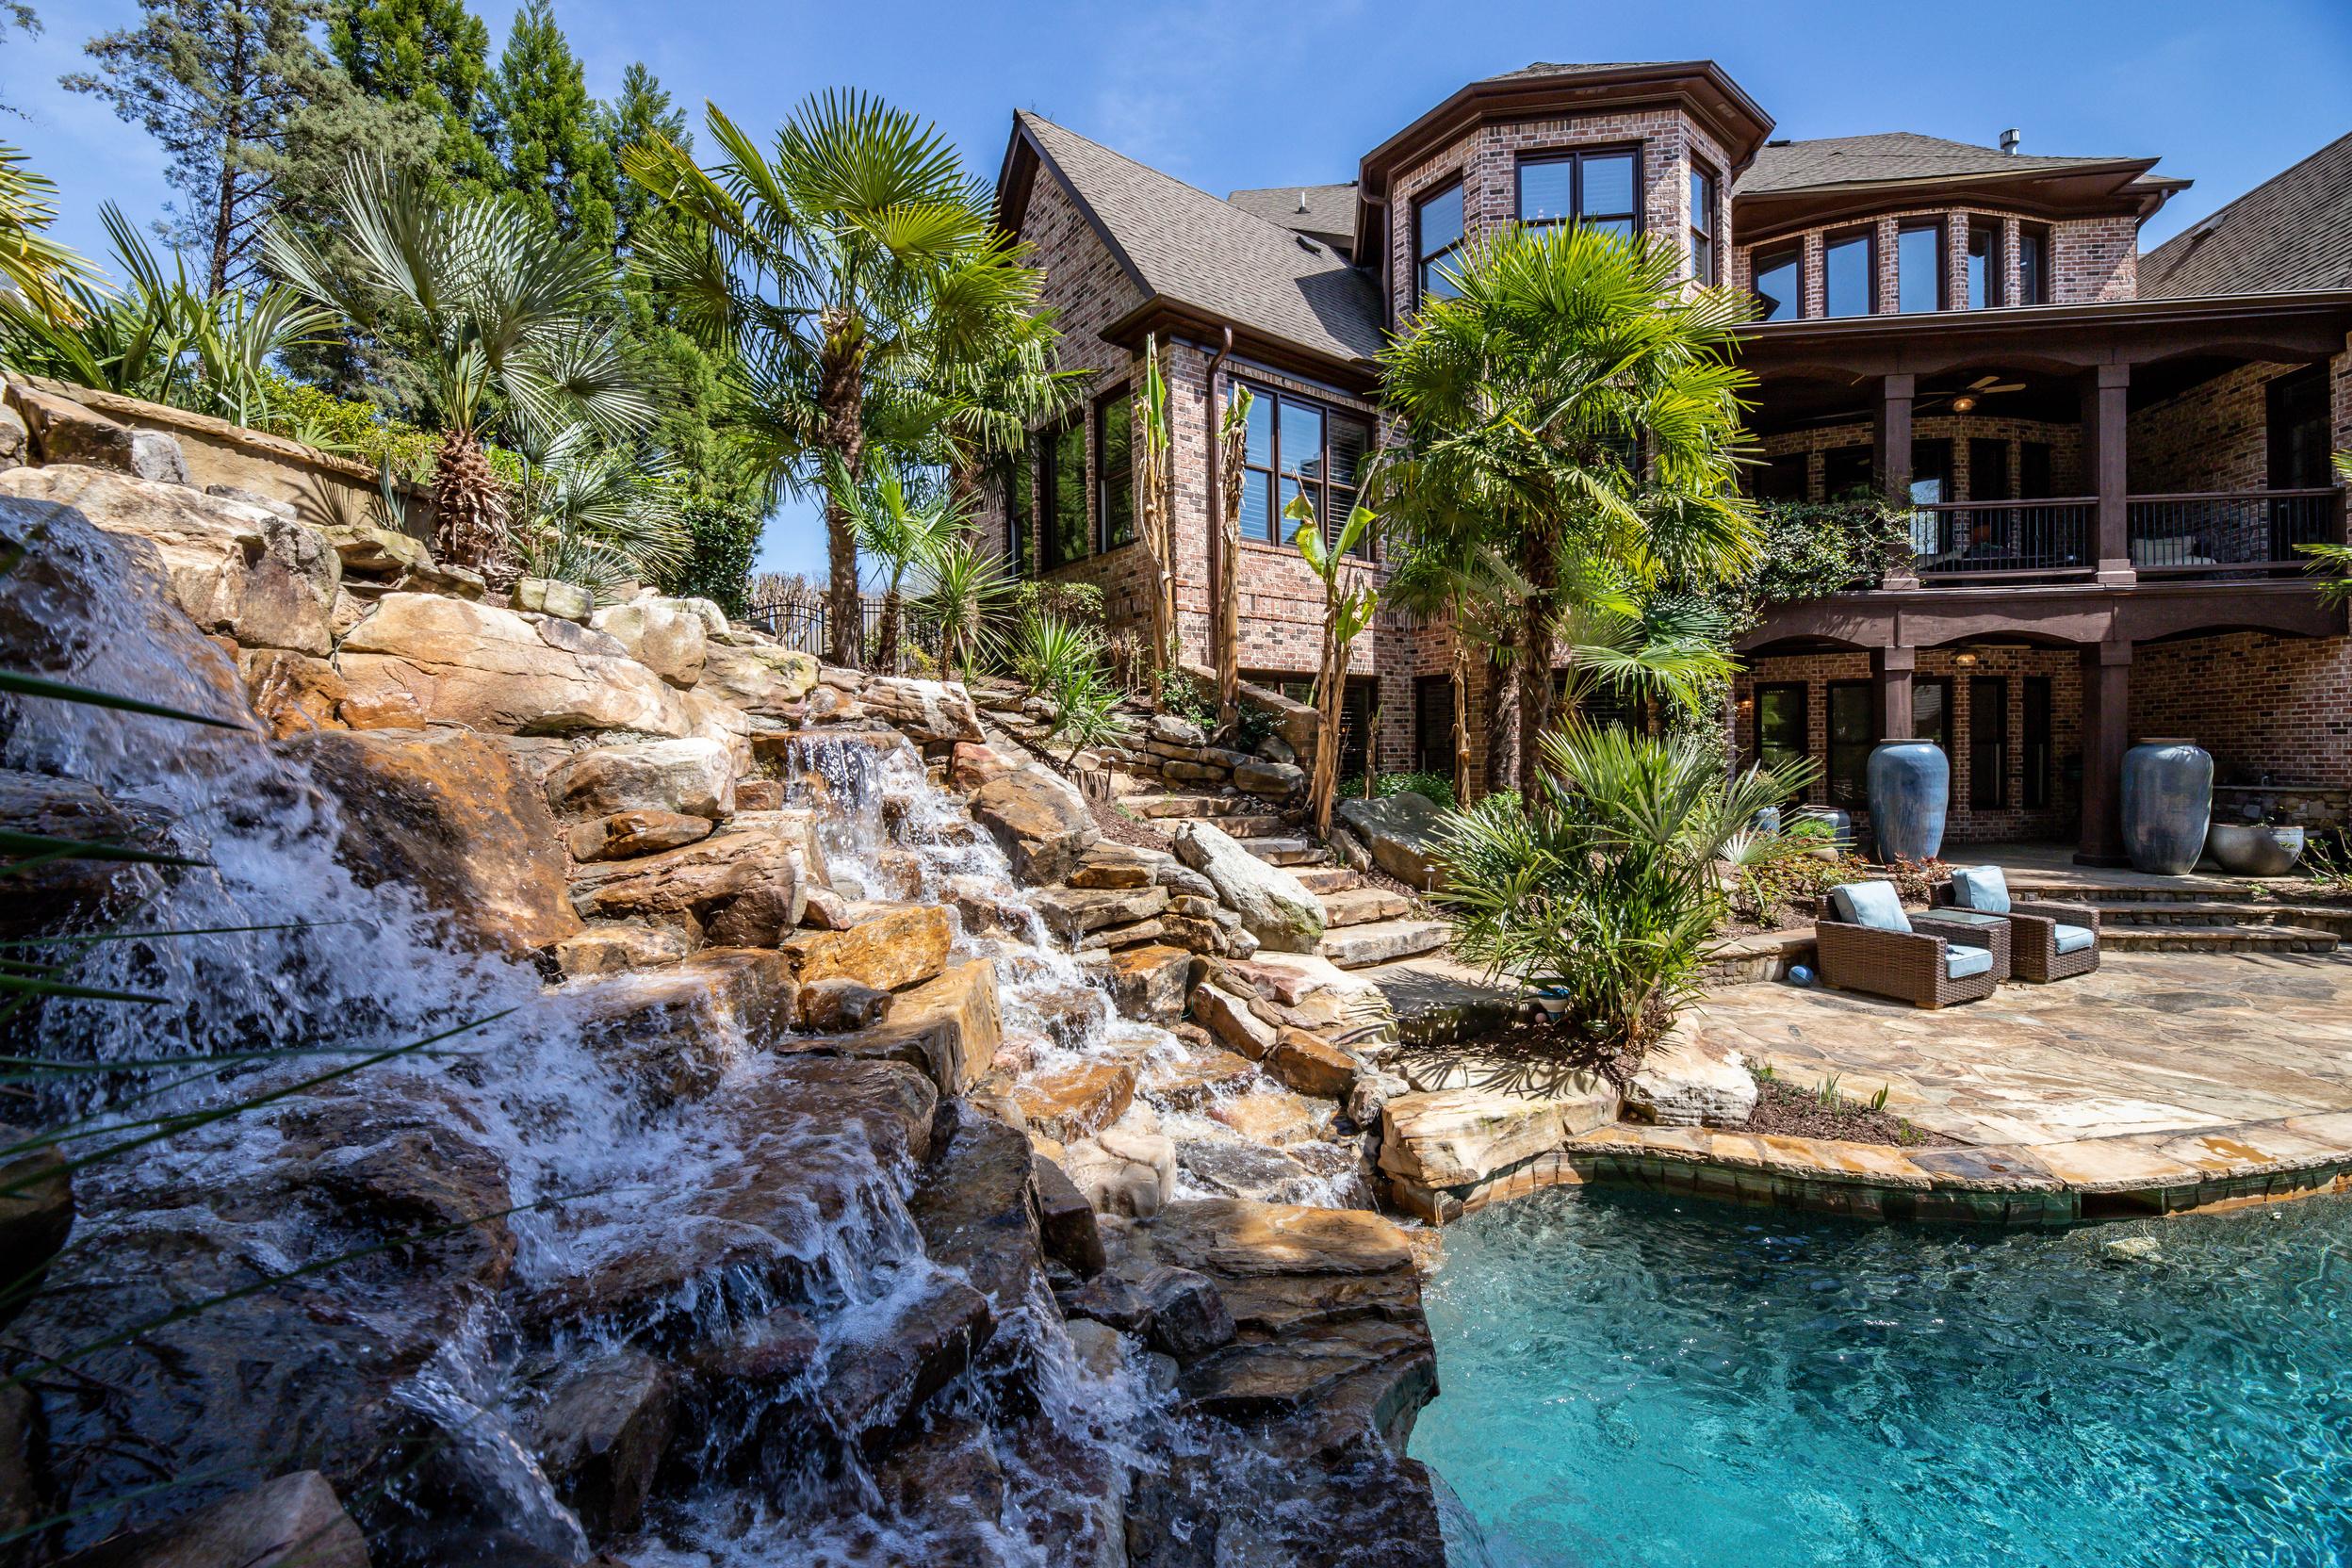
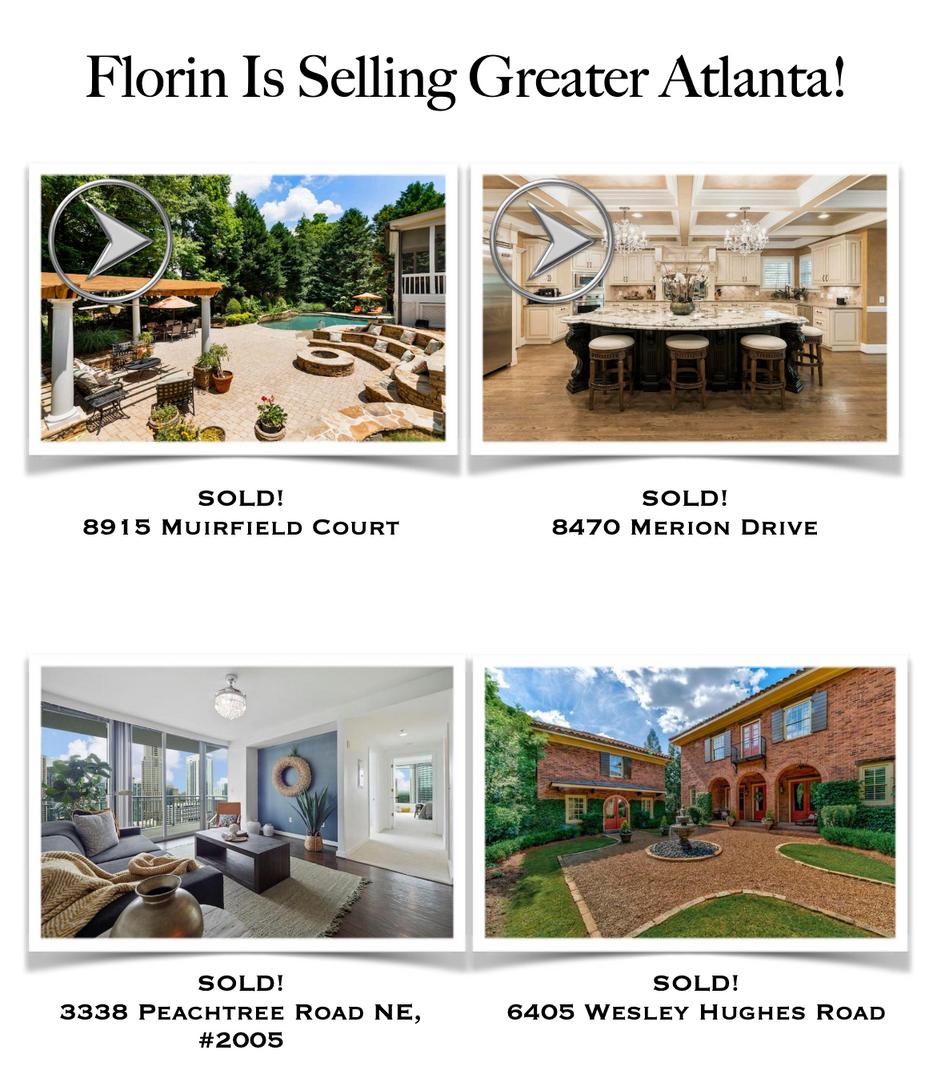
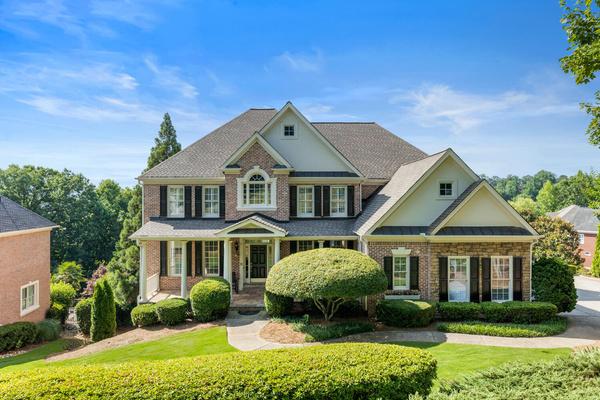
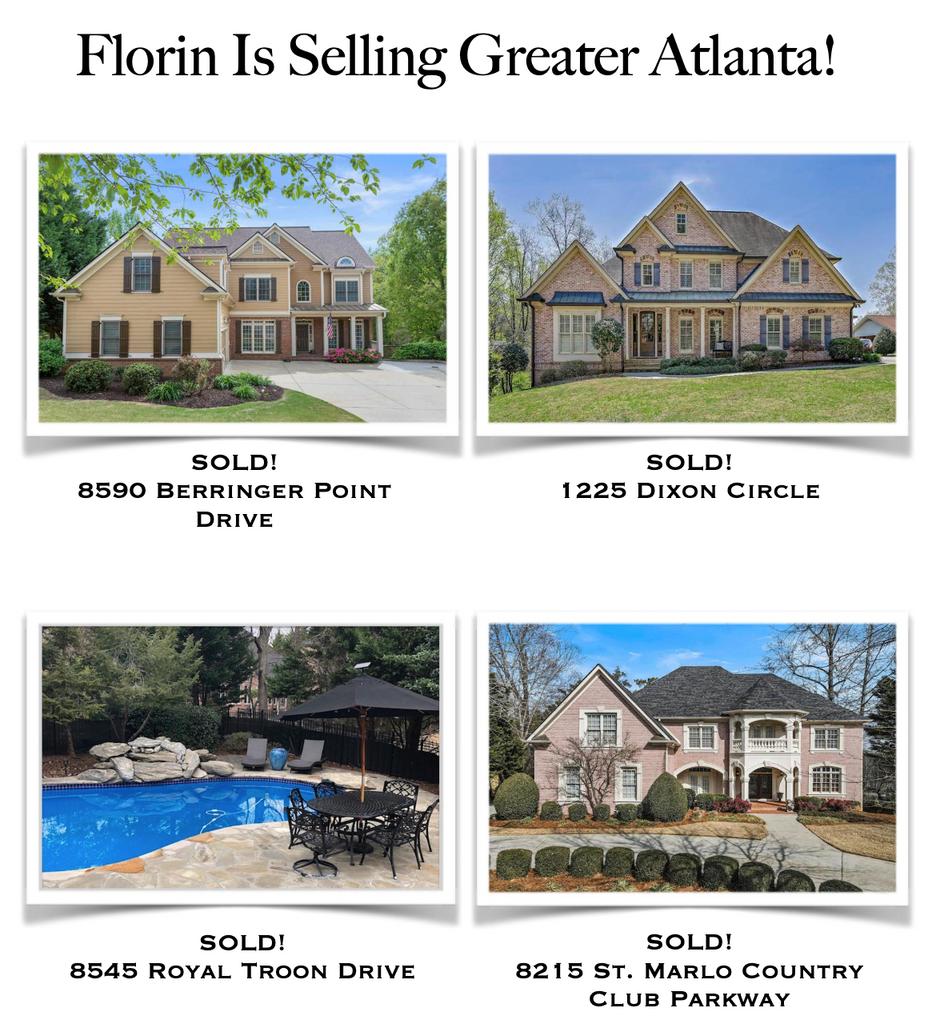
SOLD! 8350 Kenningston Way ~ Florin Is Selling Greater Atlanta! ~
~ Who You With MATTERS! ~
Home Design Trends to Expect in HERE
“After over a year of disruption, many aspects of our daily life have returned,” said Tania Richardson, co-founder and CEO of Tomas Pearce, a design firm in Toronto. “But our ‘normal’ is unlikely to ever look the same, and this is especially true for how we perceive and design our spaces. ”
Functionality, bold colors and fabulous kitchens will carry us through next year Just as our lifestyles have required adjustments during Covid, so have the interior spaces we inhabit. The past year plus has been one of realignment and living a new normal in pandemic times, but 2022 will hopefully spur a return to familiarity alongside a flurry of fresh ideas.
2022
Looking Ahead: Home Design Trends to Expect in 2022

As much as we willed 2021 to be a return to “normal”—or at least a departure from 2020 the year was still an uphill battle full of uncertainty. Some of us slowly returned to an office, which we inhabited only part time. New commutes began from pandemic acquired country homes or suburban houses. We tested the waters of in person hangouts, parties, and vacations. Ultimately, we still spent a lot of time at home. So, what will 2022 bring? It’s hard to say. But to get those dream lists and projects ideating, we tapped 16 experts from an array of interiors backgrounds to tell us their home renovation predictions for the new year. Let’s keep on renovating in 2022!
10 Renovation Trends You’ll be Seeing a Lot of in 2022
SEE TRENDS HERE!!

Kitchen appliances account for a large chunk of a remodeling budget. Many design professionals recommend setting aside about 12% of your overall remodeling budget to spend on appliances. And with half of homeowners choosing to replace all of their appliances during a kitchen update, according to the latest Houzz research, that’s a big expense that warrants careful consideration.
See the Latest Kitchen Appliance Trends for 2022 HERE