
4 minute read
M4D Business Journal 117 - The Value of Benchmarking in Architecture, Engineering, and Design

How does your business stack up? How does your current performance compare to previous performance? How about other businesses in your industry? What does the future look like for you, your competitors, or your industry as a whole?
The answer to these questions lies in benchmarking—but what value does benchmarking actually provide in architecture, engineering, and design businesses, and how can it be used to give your business an edge?
Advertisement
Benchmarking is a radar for change; in and of itself, benchmarking is only a means to an end—and it’s worthless if not accompanied by a call to change.
The value is not in the benchmarking, but in the decisions you make, as leaders, to create change that will enhance your performance. Benchmarking leads us to focus on change and provides a clear direction for the change process.
There are two components to benchmarking performance:
1. Comparing your business with your own historical and expected performance
2. Comparing yourself to the industry and other businesses
By benchmarking in these areas, there will always be a call to action, a call to change.
Benchmarking can be effective in driving performance and initiating change.
For instance, for a business that’s operating in the top quartile, benchmarking could highlight areas where they are doing well and should provide a focus for how to maintain their advantage, as well as presenting an opportunity to raise their standards.
Alternatively, for business in the bottom quartile, benchmarking identifies areas of opportunity where they can make improvements such as:
1. Reviewing fees
2. The work they are taking on
3. How they're producing it
4. Employment costs
Case study
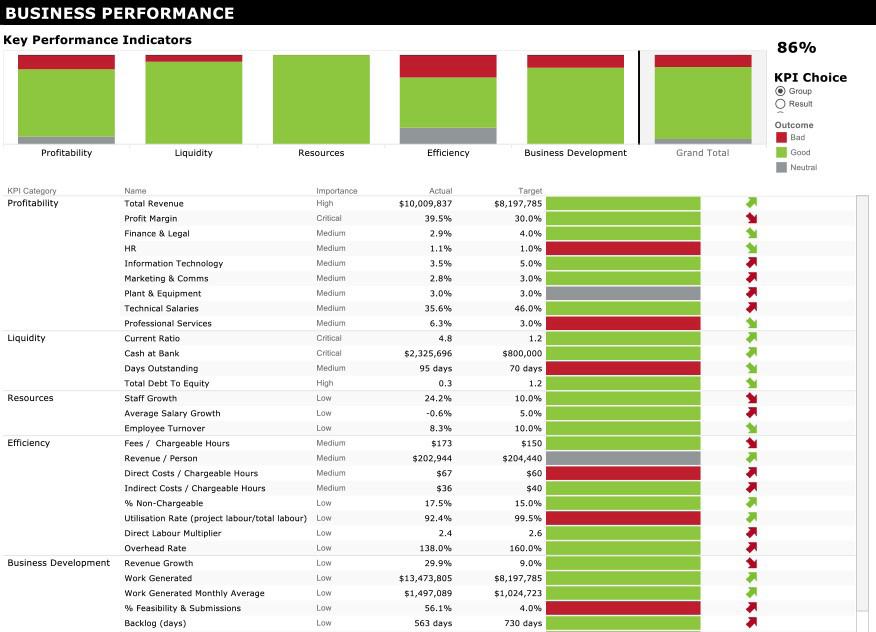
In the chart on the previous page, we have a snapshot of a monthly management report for a Management for Design client.
Their total income is approximately $10m, with a profit margin of 40%. According to industry benchmarks, they’re at the top of their game, in the top quartile of their industry, and are exemplifying superior performance.
But are they really at the top of their game? Their total income sure is, and so is their profit margin. However, when we drill down further, we find that their total employment costs to total income are running at 35%—less than their historical averages, and over 20 points below the industry average.
How does that show up in the operations? The principals are buried in projects, with little to no opportunity to work on areas that could potentially improve, or to focus on where the company needs to head.
By comprehensively measuring across all areas of the business, they have the numbers to know that billable time is high, income per employee is high, average hours worked is high, but work coming in from new clients is low in comparison to previous years. Therefore, the current position for this business is not sustainable.
Armed with this information, they can now focus their attention and make the necessary decisions to see them well into the future.
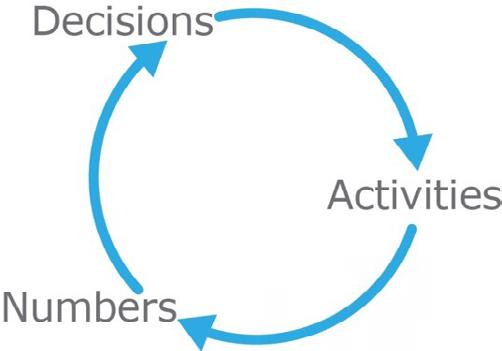
Decision making
Typically business leaders are regularly pressed to make decisions. These decisions are then converted into activities. Accountants then convert these activities to numbers and produce a report card, which will be in the form of an income statement, a balance sheet, and most importantly a cash flow statement. Business leaders usually then turn to their CFO’s to decipher the numbers, who then describe back the activities that caused the numbers in the first place.
The numbers are always a reflection of the decisions that were or were not made.
Doesn’t it stand to reason that if businesses want to change the numbers, they simply need to change the activities that caused the numbers in the first place?
It’s not just financials that need to be measured; reputation, brand, quality of work, client satisfaction, and staff morale are equally as important. These metrics should be measured, year in, year out.
In another example, a new Management for Design client was previously relying on quarterly management reports to keep them on track—that’s only four shots a year to identify issues and make improvements.
By implementing monthly reporting, we were able to provide them with a lot more data and more opportunities to change course and fix problems.
In the 12 months following the business started monthly measuring and reporting. This resulted in their best year yet—they produced a profit margin of 25%, paid off their debts in the next year and were paying out dividends from cash flow in 2.5 years.
You need to compare to how you are tracking yearly as well as comparing your results with those of appropriate peers, that is, businesses that are similar in size and business model to your own. Chances are that benchmarking will reveal many areas of your business that can be strengthened.
For example, your results relative to your peers may present opportunities to:
1. Raise your standards
2. Focus on growing revenue
3. Reducing your labour
4. Increase your use of productivity-enhancing technologies
5. Or take numerous other actions.
Conclusion
Measure. Assess. Create change. Ultimately, if you want to run a successful business you need to know what’s going on in your business, so you need to be measuring as you go. Monitor your progress from year to year. And then compare yourself to your peers. n

Management For Design adds certainty to business decisions by combining your vision and hard data. We uncover the fundamentals of your business, identify areas for improvement and enable sound, evidence-based decisions, to move your business and projects forward confidently with fewer surprises. For more information, contact Gordana Milosevska on gmilosevska@m4d.com.au.
