Low Stress Multimodal Mobility Master Plan
Public Meeting #2


Multimodal Mobility Transportation Master Plan
aka Broward MMMP
Vision

To create an inclusive low-stress multimodal transportation network for all ages and abilities in Broward County.


Foundational Principles

Project Webpage
Scope Overview
1. Project Management
2. Public Engagement & Outreach
3. Existing Conditions
4. Needs Assessment
5. Feasibility Analysis
6. Design Manual
7. Final Report
Purpose/Goal
Enhancing accessibility and mobility through educational, economic, and social opportunities.


Low-Stress Networks


Level of Traffic Stress
Bicycle
Level of Traffic Stress

Pedestrian Level of Traffic Stress
 Source: (Left: FHWA) (Right: FDOT)


How would you classify yourself?


ⓘ Start presenting to display the poll results on this slide.
Key Findings for Broward County
Less than 5% of the county population travel to work by walking, biking or transit (ACS, 2017).
Almost 30% of county residents are not physically active (County Health Rankings, 2020).
Residents are cost burden, the average resident spends 66% of their income on housing and transportation (Broward County Affordable Housing Needs Assessment, 2022).
Broward ranks 14th nationally as the most dangerous metropolitan area in the nation and is one of the top 3 counties in Florida leading the state in serious injuries and death for people walking and biking (Dangerous by Design, 2022 & Florida Pedestrian & Bicycle Strategic Safety Plan, 2021).
Over 60% of bike/ped crashes occurred on roadways with a speed limit of 40 + MPH (Bicycle & Pedestrian Safety Action Plan, 2018).
The transportation network is not designed for people walking and biking, rather it was designed to accommodate vehicular peak hour conditions (Bicycle & Pedestrian Safety Action Plan, 2018).


Fort Lauderdale, Plantation, Hollywood, and Pompano had the most people killed or seriously injured while walking or biking over a 5-year period (Signal Four Analytics, 2018 - 2022)
Existing Conditions:
Disadvantaged Communities & Crashes
Nationally, Native Americans and Black or African Americans are 3 to 4x more likely to be killed while walking (Dangerous By Design, 2022). Communities identified as disadvantaged are being disproportionately affected by bicycle and pedestrian crashes.


Disadvantaged communities: defines a community as either: (1) Geographic: a group of individuals living in geographic proximity (such as census tract), or (2) Common condition: a geographically dispersed set of individuals (such as migrant workers or Native Americans), where either type of group experiences common conditions. Justice 40 Initiative (Source: U.S. DOT & Signal 4 Analytics)
Pedestrian Level of Traffic Stress
Pedestrian Criteria for Analysis:
1. Sidewalk Coverage (one or both sides)
2. Sidewalk Separation
3. Posted Speed Limit
4. Number of Traffic Lanes
5. Average Annual Daily Traffic (AADT)
Source: FDOT 2023 Multimodal Quality/Level of Service Handbook


Bicycle Level of Traffic Stress
Bicycle Criteria for Analysis:
1. Type of Facility Present
2. Posted Speed Limit
3. Number of Traffic Lanes
4. Average Annual Daily Traffic (AADT)
Source: FDOT 2023 Multimodal Quality/Level of Service Handbook


Accessibility
Analysis & LTS
• Low BLTS/PLTS and High Access
• Many destinations, route is comfortable (LTS 1 or 2)
• High BLTS/PLTS and High Access
• Many destinations, route is uncomfortable (LTS 3 or 4)
• Low BLTS/PLTS and Low Access
• Not many destinations, route is comfortable (LTS 1 or 2)
• High BLTS/PLTS and Low Access
• Not many destinations, route is uncomfortable (LTS 3 or 4)


Existing Network
Data Inputs:
• Existing and Planned Bicycle Network
• Posted Speed Limit
• Number of Travel Lanes
• High Injury Network (HIN)
• Canals without Trail features
• Florida Power & Light (FPL) right-of-way
Legend
• Red – Buffered Bike Lane
• Blue – Marked Bike Lane
• Orange – Shared Lane Marking


Gap Analysis Web Map
Broward MPO Bicycle Network
Planned Projects
ADDITIONAL DATA INPUTS:
• Roadways with a Posted Speed Limit greater than 35 miles per hour and LTS of 3 or 4
• Planned roadway improvements, including Surtax, TIP and FDOT projects
• Super Connector Designation
• Connections between communities that have been identified by the Broward MPO as having a high demand for walking and bicycling, trips.
• These corridors serve as important connections between different communities to expand access to jobs, employment, healthcare and education.


Gap Analysis Web Map
Funded Bike/Ped Projects
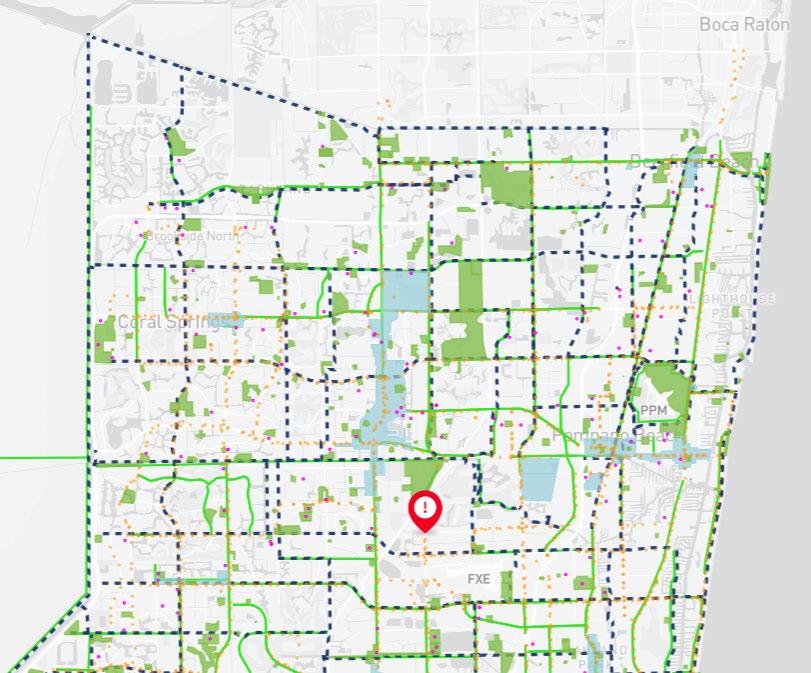
Gaps & Opportunities
Proposed Base Low Stress Network
Legend
• Purple – Existing Trails
• Green – Easy to Implement
• Orange – Moderate to Implement
• Red – Difficult to Implement/On High Injury Network
• Blue – Canal Opportunities
• Yellow – Under Construction


Low Stress Network Design Manual


Have you taken the survey?


ⓘ Start presenting to display the poll results on this slide.

Spine Network
Proposed


 Crowdsource Map
Feedback Map


• For more information, click on the i
• For detailed instructions, click on the ?


Feedback Map


If you feel more comfortable responding in a different language, there are built-in translations.


Feedback Map


You can turn on and off data layers by clicking on the “layer” icon.

Feedback Map


If you have a favorite base map, you can change it by clicking on the “map” icon.

Feedback Map


If you want to share with your network so more people can provide feedback, click on the share icon.

Feedback Map


To provide feedback, scroll around and zoom in/out to find places you would like to make a comment about, or enter in an address.
Three marker choices:
● Bike/Ped Friendly
● Improvements Needed
● Suggestions

Feedback Map


What does a safe, comfortable, convenient, inclusive multimodal transportation system look like for you?


ⓘ Start presenting to display the poll results on this slide.

Breakout Session


 Crowdsource Map


