

UNIVERSITY OF PENNSYLVANIA, WEITZMAN SCHOOL OF DESIGN
Masters of City Planning / Masters of Landscape Architecture, Class of 2025
NORTHEASTERN UNIVERSITY
Bachelor of Science in Architecture, 2018
Minor in Urban Studies
Second-year dual degree Landscape Architecture/City Planning graduate student, with more than four years of work experience. Interested in coastal preservation and restoration, just adaptation to climate change, and integrating indigenous ecology within the urban context. Currently focusing my studies on environmental policy and data analysis and visualization.
GPA 3.95
Land Use and Environmental Planning Concentration
Contributing author to Panorama, Weitzman School’s Department of City Planning student journal
GPA 3.89
Summa Cum Laude, Honors Program University Scholars Program, full-tuition scholarship College of Arts, Media, and Design’s Scholarly and Creative Achievement Award Recipient, 2018 Alpha Rho Chi Medal and Northeastern University Huntington 100 Award Recipient, 2018
RESEARCH ASSISTANT 2021The McHarg Center University of Pennsylvania
SUMMER FELLOW Summer 2022
Climate and Community Project Philadelphia, PA
DESIGN ASSOCIATE 2018 - 21
Mikyoung Kim Design, Boston, USA
TEACHING ASSISTANT Spring 2018
Northeastern University, Boston, USA
DESIGN LEAD 2017 - 21
Global Design Initiative for Refugee Children, Boston Society of Architects
Boston, USA
INTERN Jan - July 2017
Ann Beha Architects, Boston, USA
UNDERGRAD RESEARCHER
2013 - 18
The Playground Project: INDIGO, Northeastern University, Boston, USA
INTERN Jan - July 2016
Peters und Wormuth Architekten
Berlin, Germany
SUMMER FELLOW
Summer 2016
Scholars Independent Research Grant Northeastern University, Boston, USA
GRAPHIC DESIGNER / PROJECT
MANAGER Summer 2014 / 2015
Daily Bread Project, Ottawa, Canada
Creating a curriculum for a superstudio across four East Coast univeristies focused on adaptation to climate change and coastal flooding. This superstudio is a component of the NSF-funded Megapolitan Coastal Adaptation Hub (MACH); writing a briefing document, researching relevant case studies, building an online resource library.
Wrote a scoping document for a long-term climate adaptation initiative within the framework of the Green New Deal; Conducted a literature review and individually interviewed key academics, activists, and practitioners; Edited copy and generated maps using Excel, ArcGIS and Adobe Creative Cloud.
Directed and contributed to projects from Schematic Design through Construction Administration; worked on public space projects in the healthcare, education, and arts & culture sectors, including the Harvard Medical School Countway Library project and the Detroit Institute of Art’s Midtown Cultural Connections Competition.
Supported an advanced graphic representation course; led Rhino and Adobe suite software tutorials.
Collaborated with an interdisciplinary group of designers to create play spaces in temporary encampments for refugee families and provided project design support for local community organizations; assisted in the production of a publication that documents the construction process of a playground in an encampment in the Bekaa Valley, Lebanon. 2020 AIA Collaborative Achievement Award Recipient.
Prepared a collections, workspace, and public amenities master plan for the Smithsonian National Museum of American History.
Advocated for the value of inclusive design in Boston’s playgrounds; designed a playground scorecard with an interdisciplinary group of Northeastern students to rate the quality and inclusivity of play spaces; surveyed all of Boston’s playgrounds and used ArcGIS and Adobe Create Cloud to visualize our findings.
Contributed to a number of residential projects, including micro apartments and single-family housing, from Schematic Design through Construction Documentation; created existing conditions documents from on-site measurements.
Surveyed playgrounds across the East Coast with my Playground Project: INDIGO teammates to understand “The State of Inclusive Play” in major US cities and test our playground scorecard; compiled and cleaned data; mapped findings using ArcGIS.
Coordinated an elementary school nutrition program for The Daily Bread Project, a local NGO; focused on branding and material accessibility; designed the program’s curriculum guide through a combination of research and synthesizing information from the nutritionists and teachers at the program’s sites; generated content for their website.
DESIGN Acrobat, AfterEffects, AutoCAD, Grasshoper, Illustrator, InDesign, Laser cutting, Model making, Photoshop, Premiere, Revit, Rhinoceros 3D, V-Ray, Website design
DATA ANALYSIS
LANGUAGES
MISCELLANEOUS
ArcGIS, Excel, R Studio, Net Logo, Arduino
English (Fluent), Russian (Fluent), French (Intermediate), German (Intermediate)
SDI Scuba Diving Certificate, Textile dyeing
pg. 4
pg. 6
pg. 8
pg. 10
pg. 14
pg. 16
pg. 18
pg. 20
pg. 22
STREET TREE HEALTH MONITORING
professional / 2019 / MYKD / Detroit Midtown Cultural Connections competition
WATER FEATURES & GRADING
professional / 2019-2021 / MYKD / Texas Medical Center 100% CDs
RESTORING PUBLIC CIRCULATION
professional / 2019-2021 / MYKD / HMS Countway Library
GARDEN OF DISRUPTED EXPECTATIONS
academic / 2022 / garden design in Philly’s Wissahickon park
LANDSCAPE AS CATALYST FOR COMMUNITY BUILDING
professional / 2019 / MYKD / Detroit Midtown Cultural Connections competition
STREET TREE HEALTH MONITORING
academic - group / 2021 / sensing installation prototype
FORECASTING FLOOD INUNDATION
academic - group / 2022 / predictive modeling
PLAYGROUND QUALITY ASSESSMENT
research / 2013-2018 / The Playground Project: INDIGO
CREATING INTERGENERATIONAL SPACE
volunteering / 2017 - 2018 / Global Design Initiative for Refugee Children (GDIRC) / Unity Park, Boston, MA
pg. 24
EMBEDDING ENVIRONMENTAL PERFORMANCE
academic - partner / 2018 / community resource center
pg. 30
BUILDING AS SCAFFOLDING FOR HABITAT
academic / 2016 / East Boston master plan
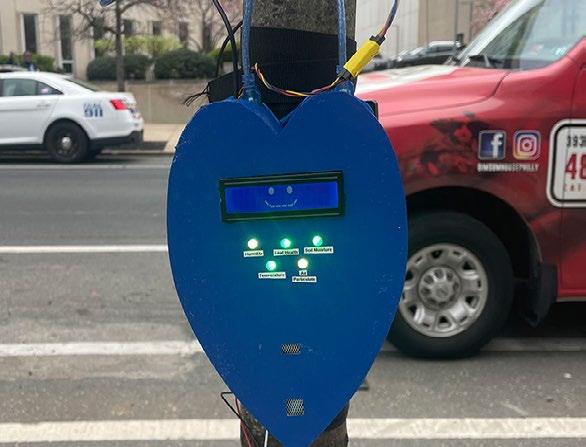
academic - group / 2021 / sensing installation prototype

programs used: Arduino microcontroller, Illustrator
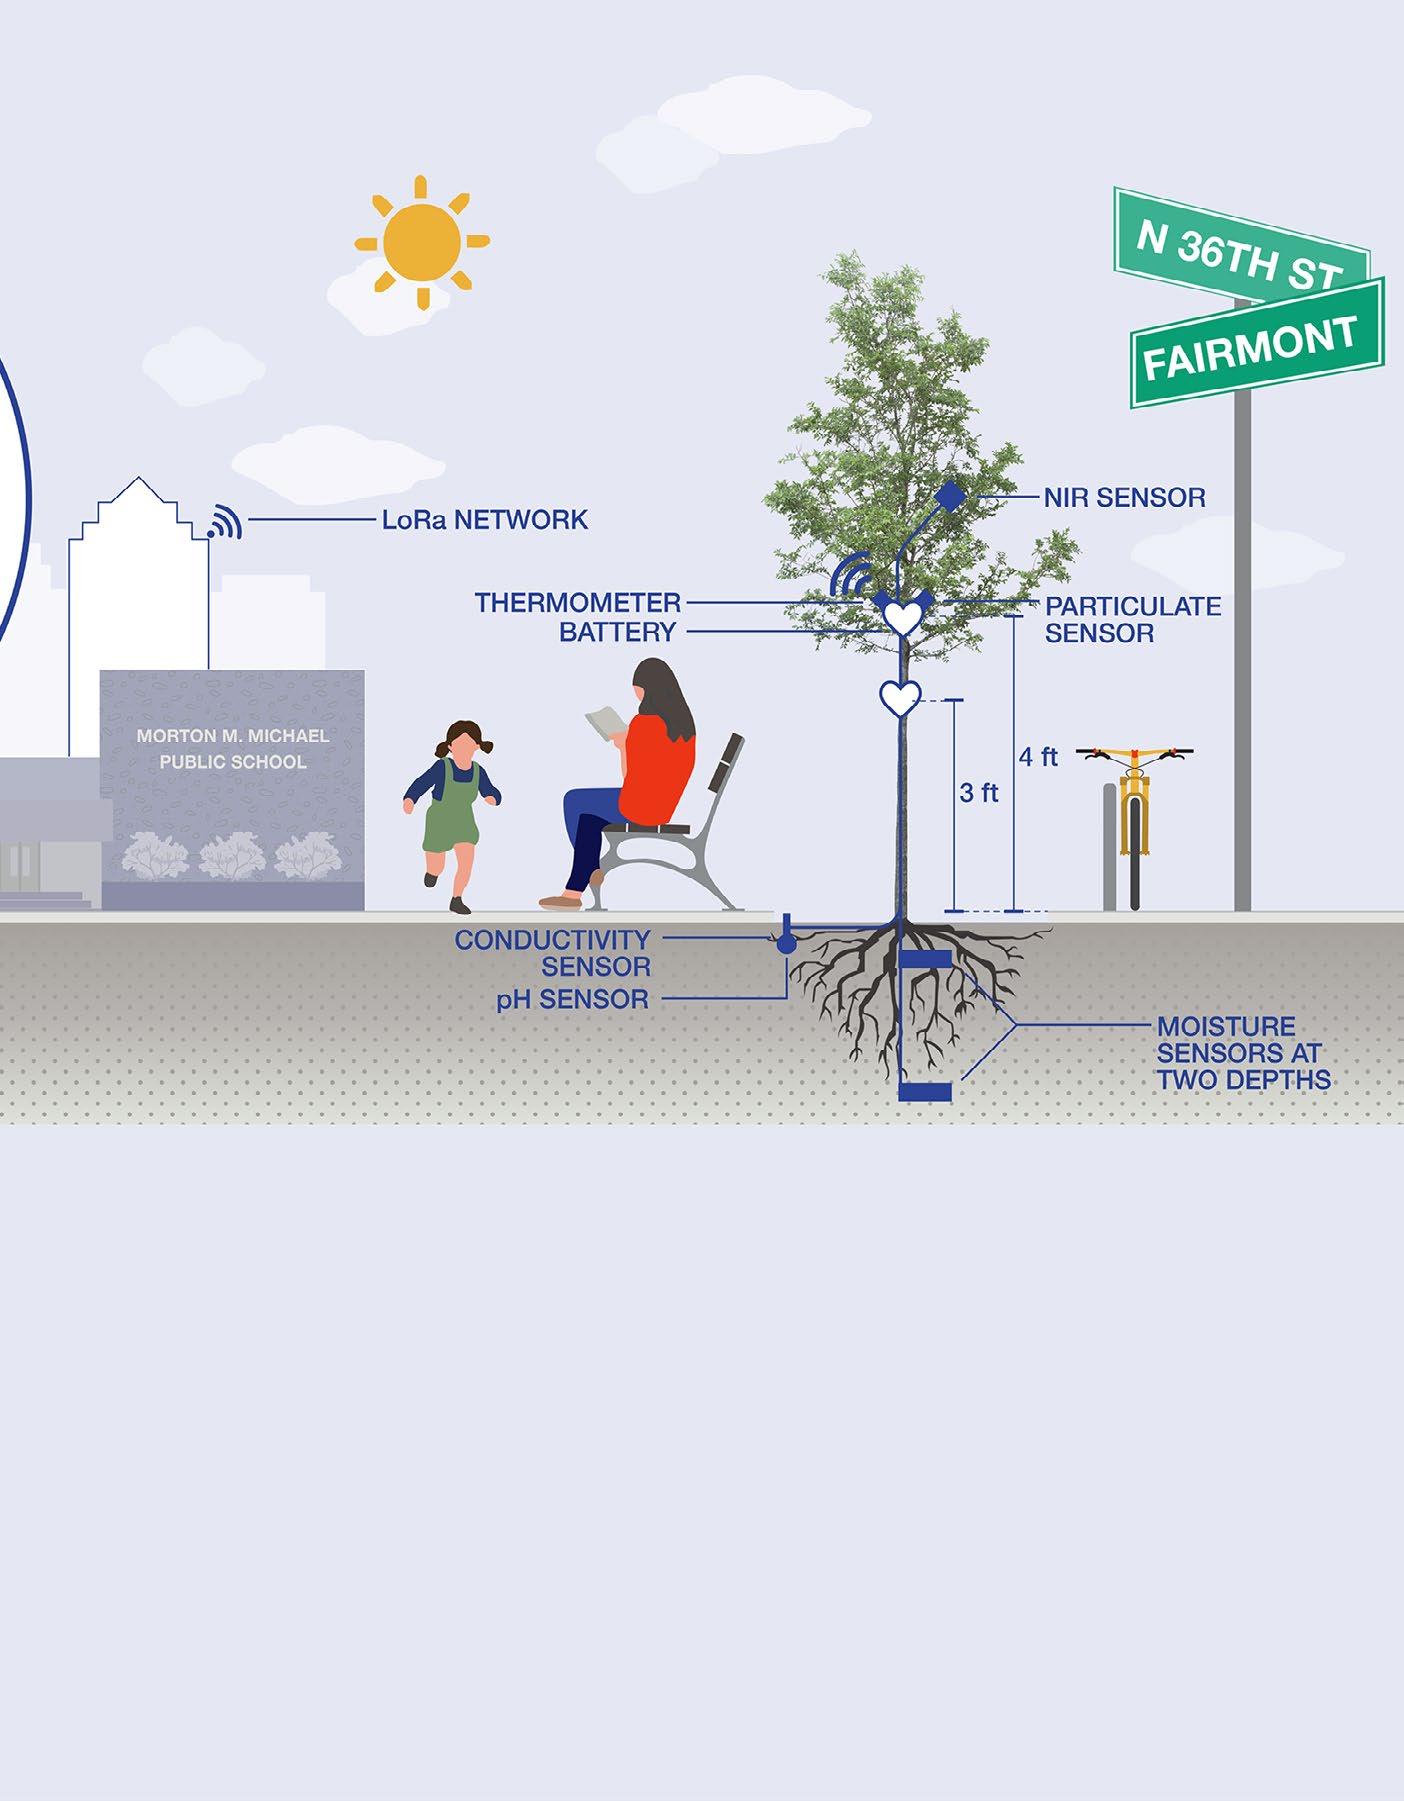
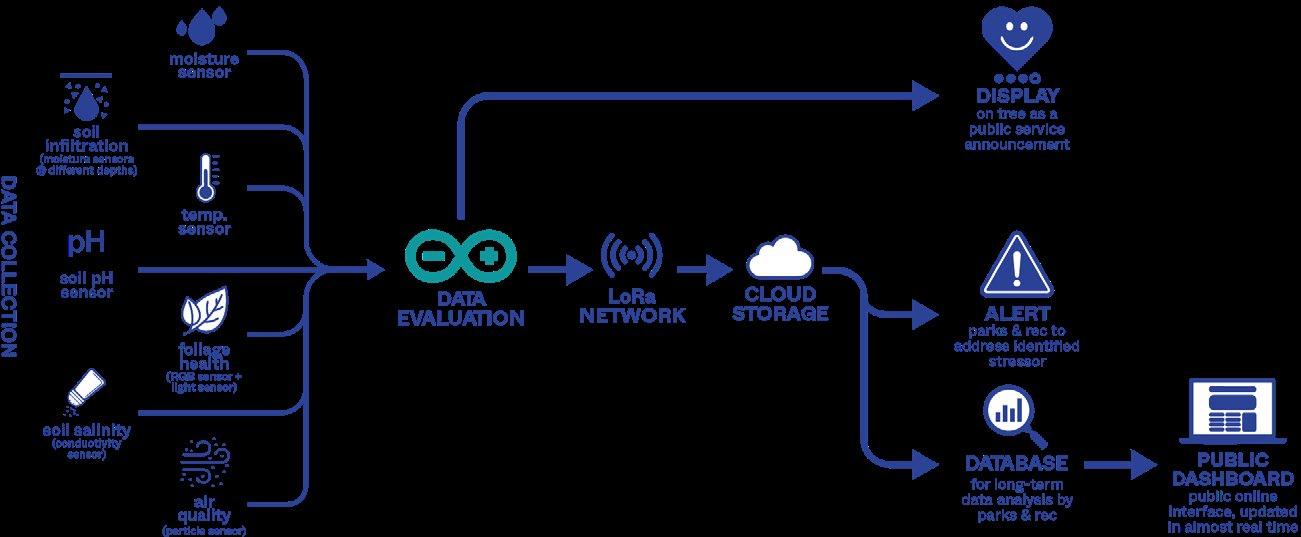
Improving street tree health often requires addressing systemic largescale problems and so it maybe futile to attempt to better a tree’s conditin on a tree-by-tree basis. Yet, public awareness is an important component of catalyzing systemic change and data collection is necessary to making a strong case. The Vitalitree Street Tree Health Monitor works towards this end. For the prototype, We used an Arduino microcontroller and a number of sensors to measure four of the seven common factors that impact tree health, including heat stress and PM 2.5 particle build up. The collected data was then aggregated into a weighted score, sent to a database via a LoRA network, and presented on the face of the monitor to describe the tree’s condition. I was responsible for assessing the tree’s foliage health. I used a near infrared sensor and applied the NDVI formula to assess weather the leaves are within a healthy range. I also created the monitor’s design and the project graphics.

To learn more about the project and see a video of the sensor in operation, click here. To follow a tutorial of how to use a near infrared sensor to determine foliage health, click here
void loop() { sensor.takeMeasurements(); if (sensor.getVersion() == SENSORTYPE_AS7263) { NDVI_est = NDVI_eq(sensor.getCalibratedV(), sensor.getCalibratedS()); //run NDVI equation function with S (680 nm) & V (810 nm) wavelength readings
if (( NDVI_est > 0.2) && (NDVI_est < 0.8)) { Serial.println(“HEALTHY”);
digitalWrite(GREEN, HIGH); //turn on green LED } else { Serial.println(“UNHEALTHY”);
digitalWrite(RED, HIGH); //turn on red LED
}
float NDVI_eq(float a, float b) { //create function for NDVI equation float result; result = (a-b)/(a+b); return result; }
academic - group / 2022 / predictive modeling
programs used: ArcGIS, R Studio
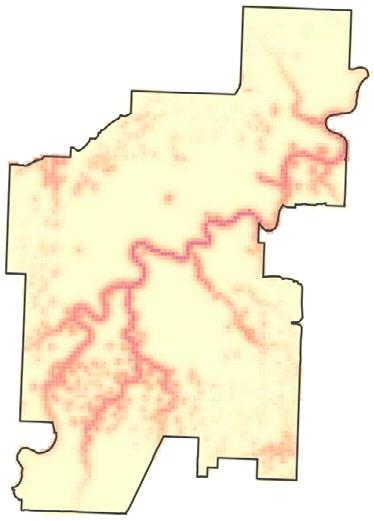
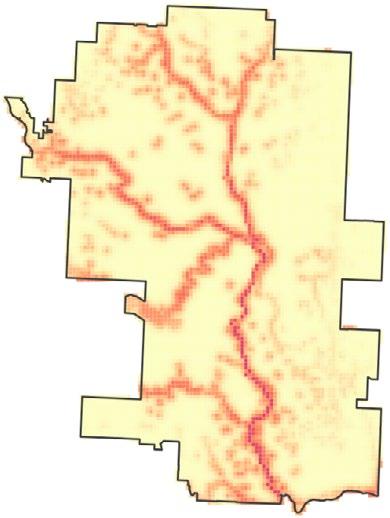
The worsening effects of climate change mean that the average 100year floodplain in Canadian river cities is projected to expand by 45% by the year 2100. In 2013, Calgary experienced its worst flood since 1932 mainly due to heavy rainfall. For this project we created a binomial logistic regression model based on data from the 2013 flood in Calgary to predict inundation in other comparable river cities and used Edmonton to test the model’s efficacy.
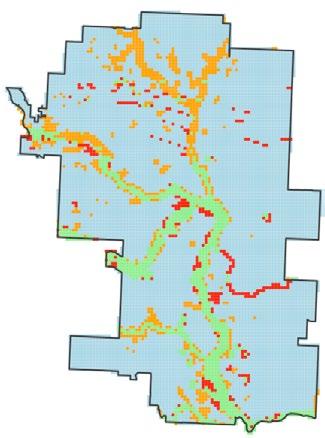
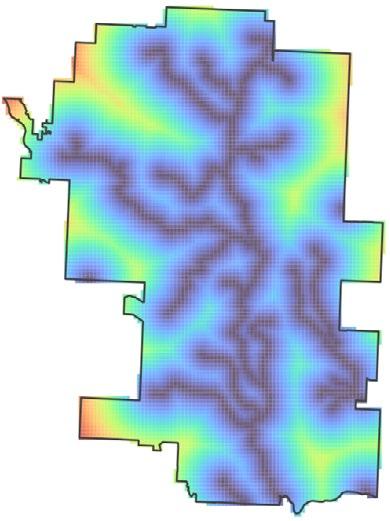
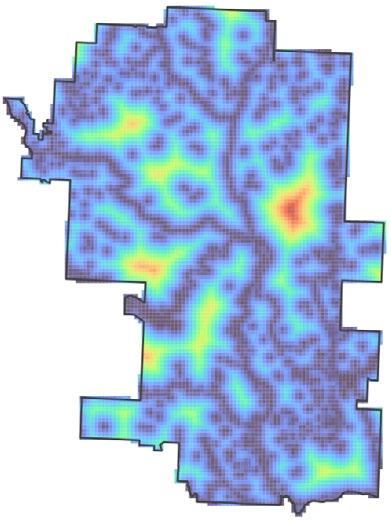
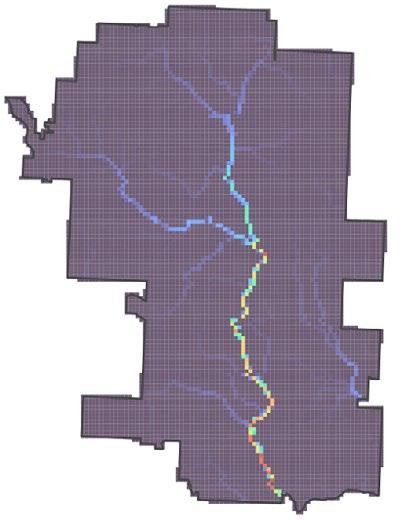
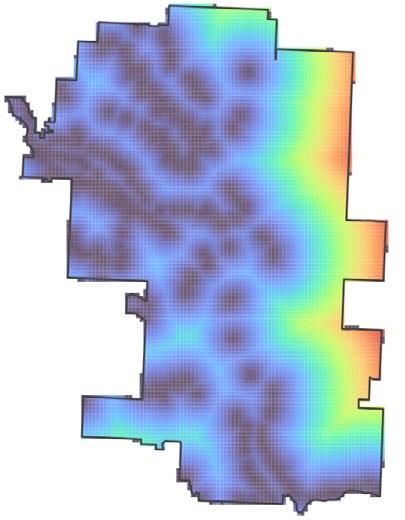
To build the inundation model, we first used ArcGIS to transform raster data into fishnet grid cell features. We included six features: 1) distance to all water bodies, (2) distance to stream network, (3) flow accumulation sum for each cell, (4) distance to steep slopes. (5) slope categorization – flat to very steep, and (6) percent of cells that are impervious. To the right, are the four features that proved to be the most statistically significant.
We then turned to R to train our model and compare the cells our model predicted as inundated/not inundated with the cells that were actually flooded in 2013. Our regression model presented us with an ROC curve that had an area of almost one and the distribution of predictions clustered around 0.9. This means our model performs well. To see our code, follow this link to my GitHub page.
Calgary training set results
# Building the Innundation Model
calgary <calgary %>% select(-geometry) %>% mutate(slope_cat = as.factor(slope_cat))
set.seed(3456) #random set of numbers to replicate sample trainIndex <- createDataPartition(calgary$slope_cat, p = .70, list = FALSE, times = 1) #include all categorical variables as first arguments calgaryTrain <- calgary[ trainIndex,] calgaryTest <- calgary[-trainIndex,]
calgaryModel <- glm(inundation ~ ., family=“binomial”(link=“logit”), data = calgaryTrain %>% as.data.frame() %>% select(-geometry))
# Testing the Model classProbs <- predict(calgaryModel, calgaryTest, type=”response”) testProbs <- data.frame(obs = as.numeric(calgaryTest$inundation), pred = classProbs)
testProbs$predClass = ifelse(testProbs$pred > .25,1,0) caret::confusionMatrix(reference = as.factor(testProbs$obs), data = as.factor(testProbs$predClass), positive = “1”)
# Training the Model
auc(testProbs$obs, testProbs$pred)
ctrl <- trainControl(method = “cv”, number = 100, savePredictions = TRUE) cvFit <- train(as.factor(inundation) ~ ., data = calgary %>% as.data.frame() %>% select(-geometry, -slope_cat), #remove categorical variables method=”glm”, family=”binomial”, trControl = ctrl)
cvFit
allPredictions <predict(cvFit, calgary, type=”prob”)[,2] calgary <cbind(calgary,allPredictions) %>% mutate(allPredictions = round(allPredictions * 100))
inundation prediction from trained data set
#Plot Map with Inundation Predictions for Calgary calgary %>% ggplot()+ geom_sf(aes(fill = allPredictions), color = “transparent”, apha = 0.75)+
geom_sf(data=calgary_boundary, fill = “transparent”, color = “#474747”, size = 0.5)+ scale_fill_viridis(alpha = 1,begin = 1, end = 0.6,direction = 1, discrete = FALSE, option = “A”) + labs(title=“Inundation Prediction for Calgary”, fill = “flooding\n probability (%)”)+ mapTheme,
# code adapted from “CPLN675: Spatial Predictive Modeling for Classification” by Ken Steif & Michael Fichman.
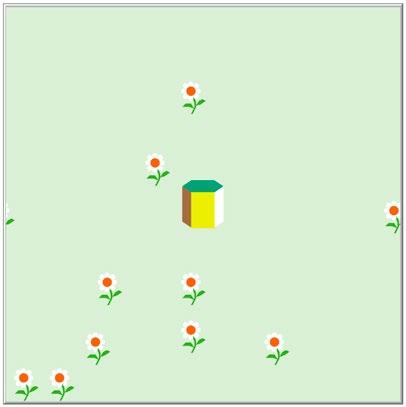
The Pollination Simulation was my first time experimenting with agent-based modeling and useing NetLogo. For the simulation, I created a simplified model to describe how the number of bees dictates the number of plants (in this case flowers) will grow from season to
breed [bees bee]
breed [flowers flower]
breed [hives hive]
flowers-own [polinated age]
season. The number of bees is set up at the beginning and remains constant for the entirety of the model’s run. The model runs until the entire field is filled. To run this model, click here and then click on “Run in NetLogo Web.”
to setup clear-all ask patches [ set pcolor 59 ;set patch color
]
set-default-shape turtles “flower”
end to go if count flowers >= 900 [stop]
;simulation ends when all patches are occupied with a flower if ticks > 400 [stop]
;simulation ends when tick count reaches greater than 400 bees-travel ;bees move around randomly until they locate flower bees-moveaway
;bees move away from flower when it’s polinanted flowers-reproduce
;flower reproduces if polinated
tick end
to bees-travel ;bees move around ask bees [
ifelse count flowers in-radius 3 > 0 [
face one-of flowers in-radius 3
fd 1
if count flowers-here = 1 [
ask flowers-here [
;if there is a flower in proximity to the bee
;face the flower
;go forward 1 unit in its direction
;if bee lands on flower
;flower is polinated & set color 139
set polinated TRUE]
;color changes to pink
;set flower as polinated
;patch changes color for ease of later code ] ] [wiggle]
set pcolor 58
;otherwise if there are no flowers move in a random direction ] end
to flowers-reproduce
;polinated flowers to reporduce if ticks > 0 and ticks mod 30 = 0 [
let flower-count count flowers with [polinated = TRUE]
create-flowers 2 * flower-count [
;reproduce every 30 ticks
;count polinated flowers
;create two new flowers for each polinated flower move-to one-of patches with [count flowers-here = 0
and count hives-here = 0]
;move to a random patch where there is no flower & no hive set color white set size 3 ]
ask flowers [
;preset pollination for the next cycle set polinated FALSE set color white ] ] end
follow this link and click on “Run in NetLogo Web” to run the simulatin
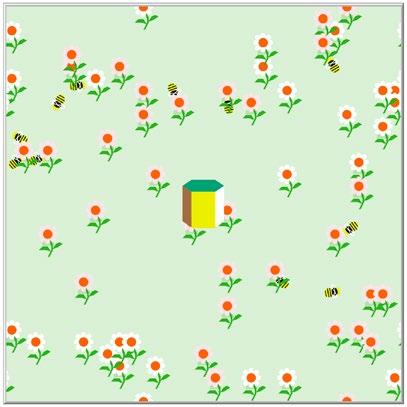
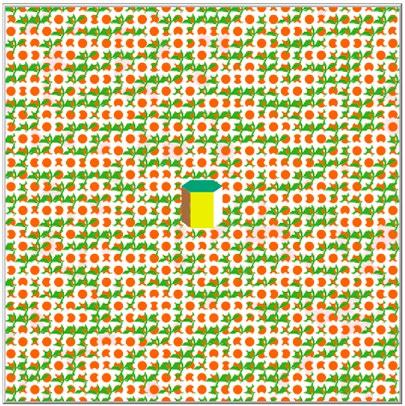
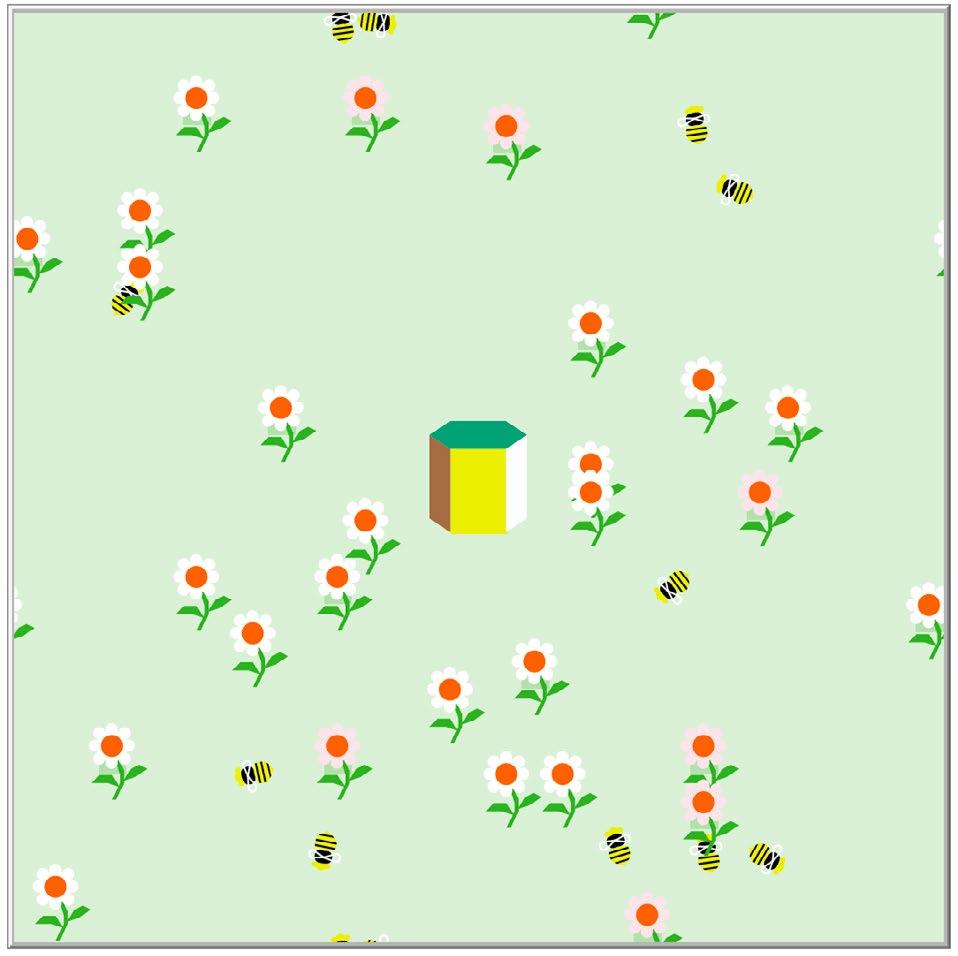
screen captures of model in action
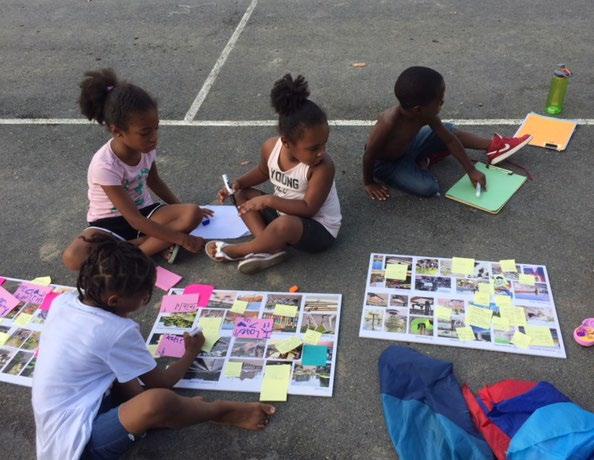
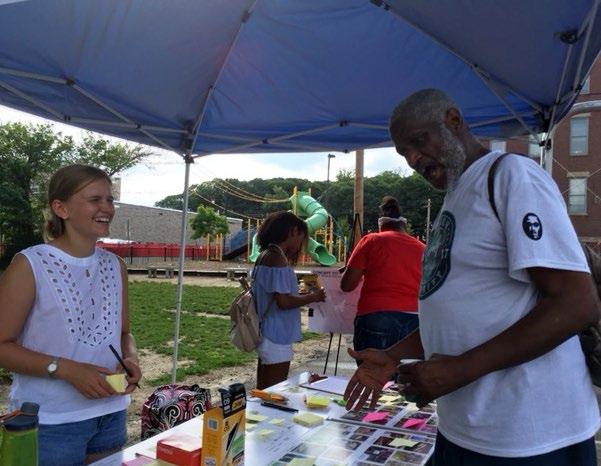
volunteering / 2017 - 2018 / Global Design Initiative for Refugee Children (GDIRC) / Unity Park, Boston, MA
programs used: Illustrator, Photoshop
GDIRC’s goal is to develop a flexible framework for constructing public places that involves community members as co-builders and results in the construction of child-focused spaces that meet the needs of children and their care-takers. These community gathering spaces are not only necessary for childhood development and physical health but to the well-being of the whole community.
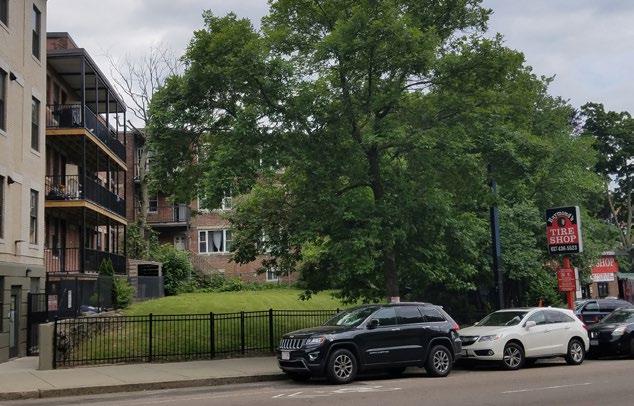
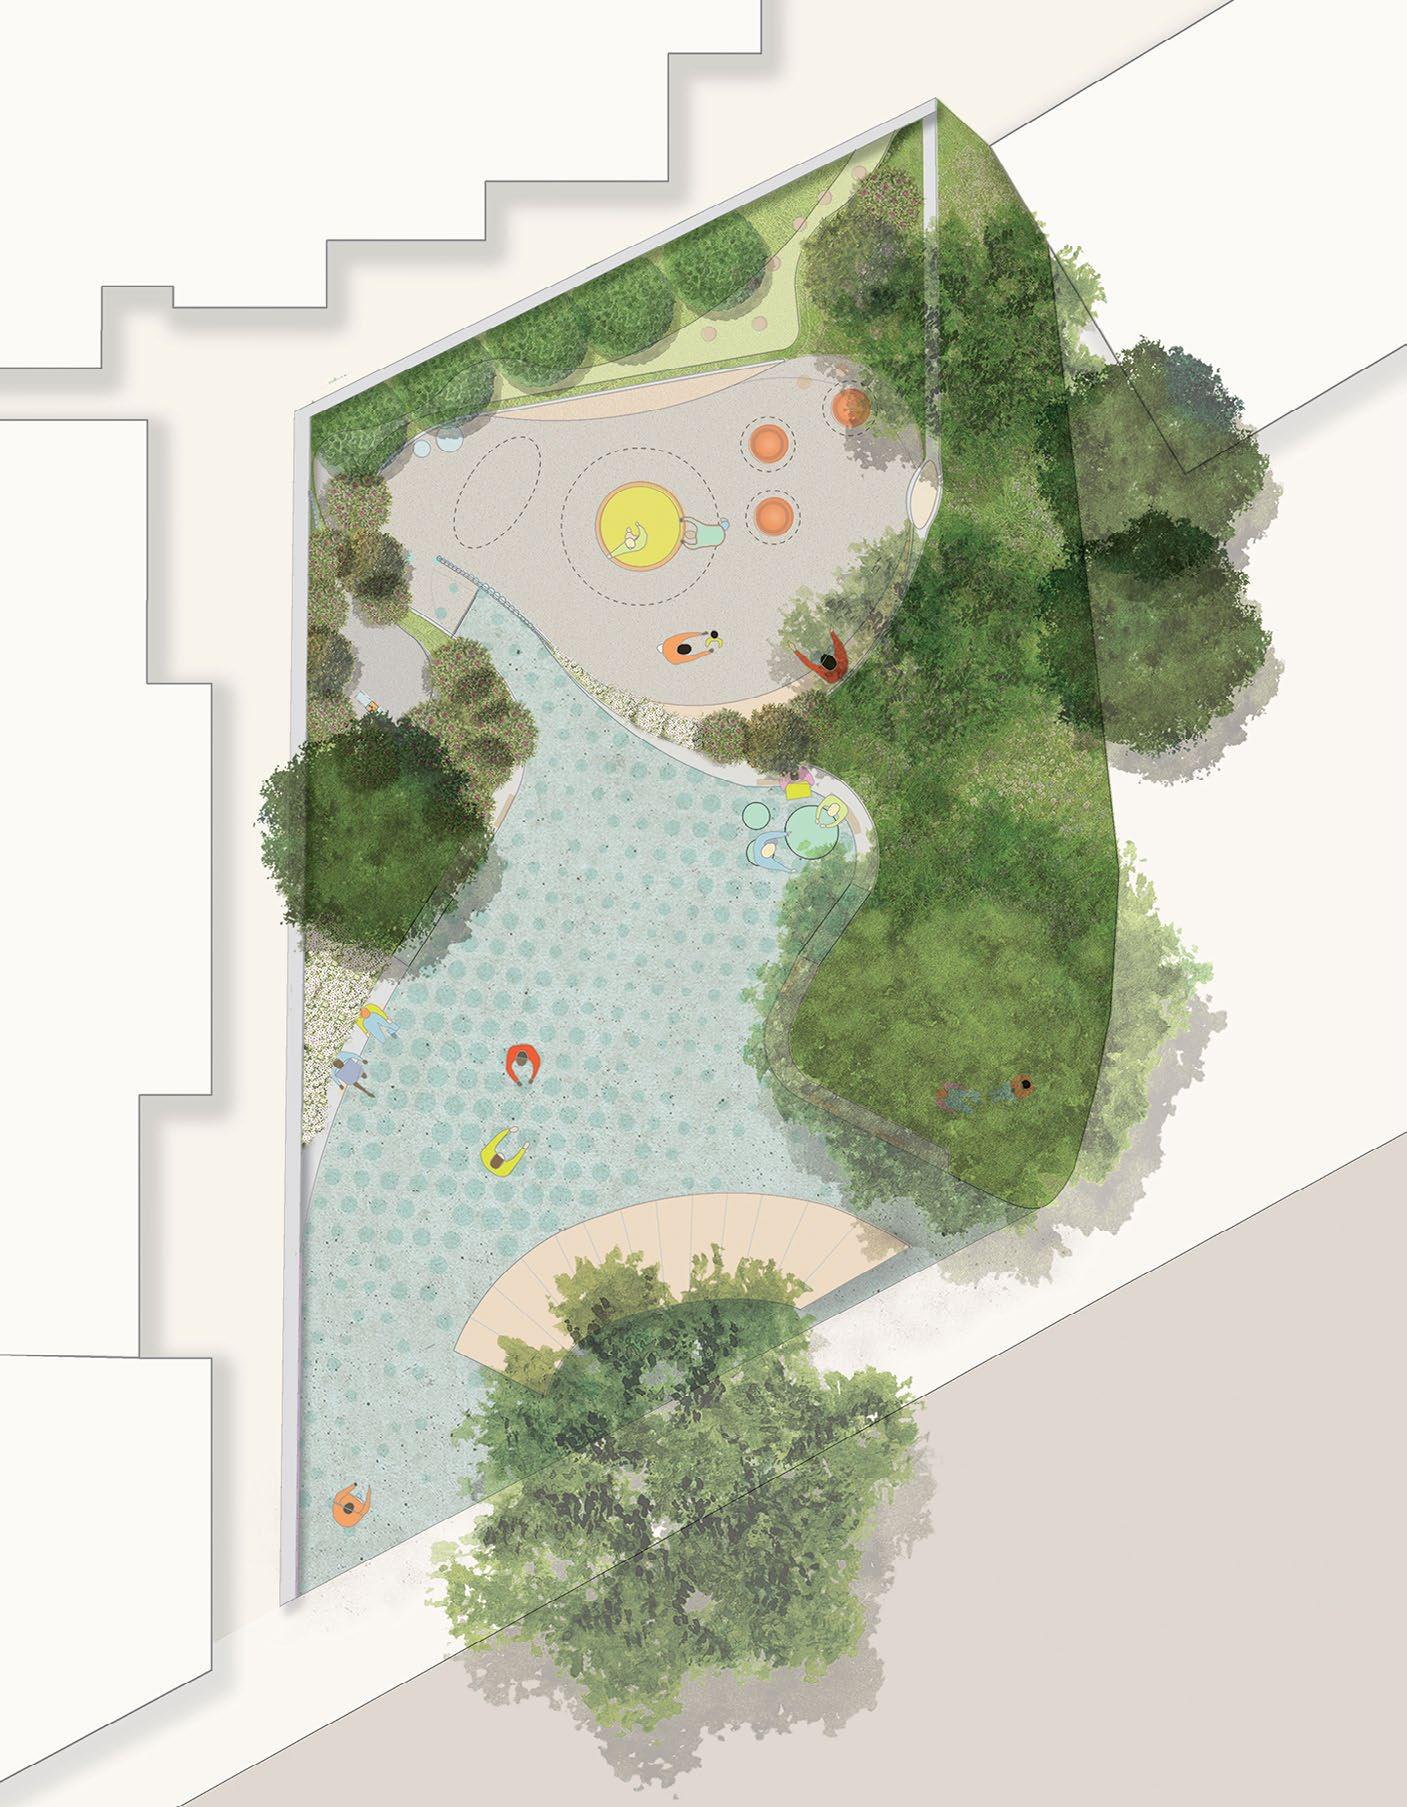
GDIRC assisted Lena Park CDC, a community organization in Boston’s Dorchester neighborhood, with the preparation of an application for the city’s Community Preservation Act Grant. Lena Park was awarded the grant in March 2019, the project is currently under construction.
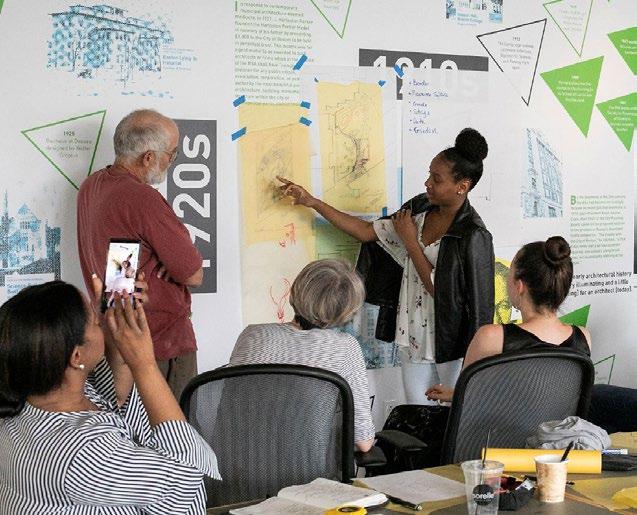

Grant application put together by many members of the Dorchester, GDIRC, and Boston’s design communities; final site plan completed independently.

research / 2013-2018 / The Playground Project: INDIGO programs used: Google Forms, Excel, ArcGIS, Illustrator
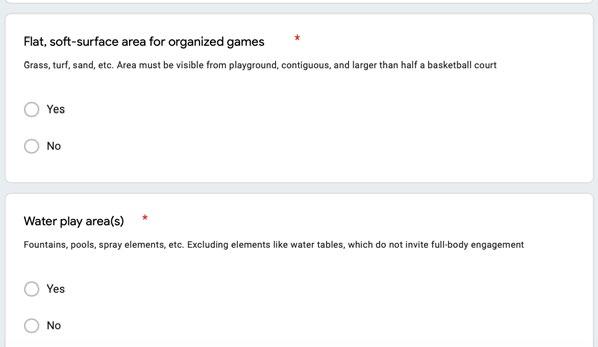

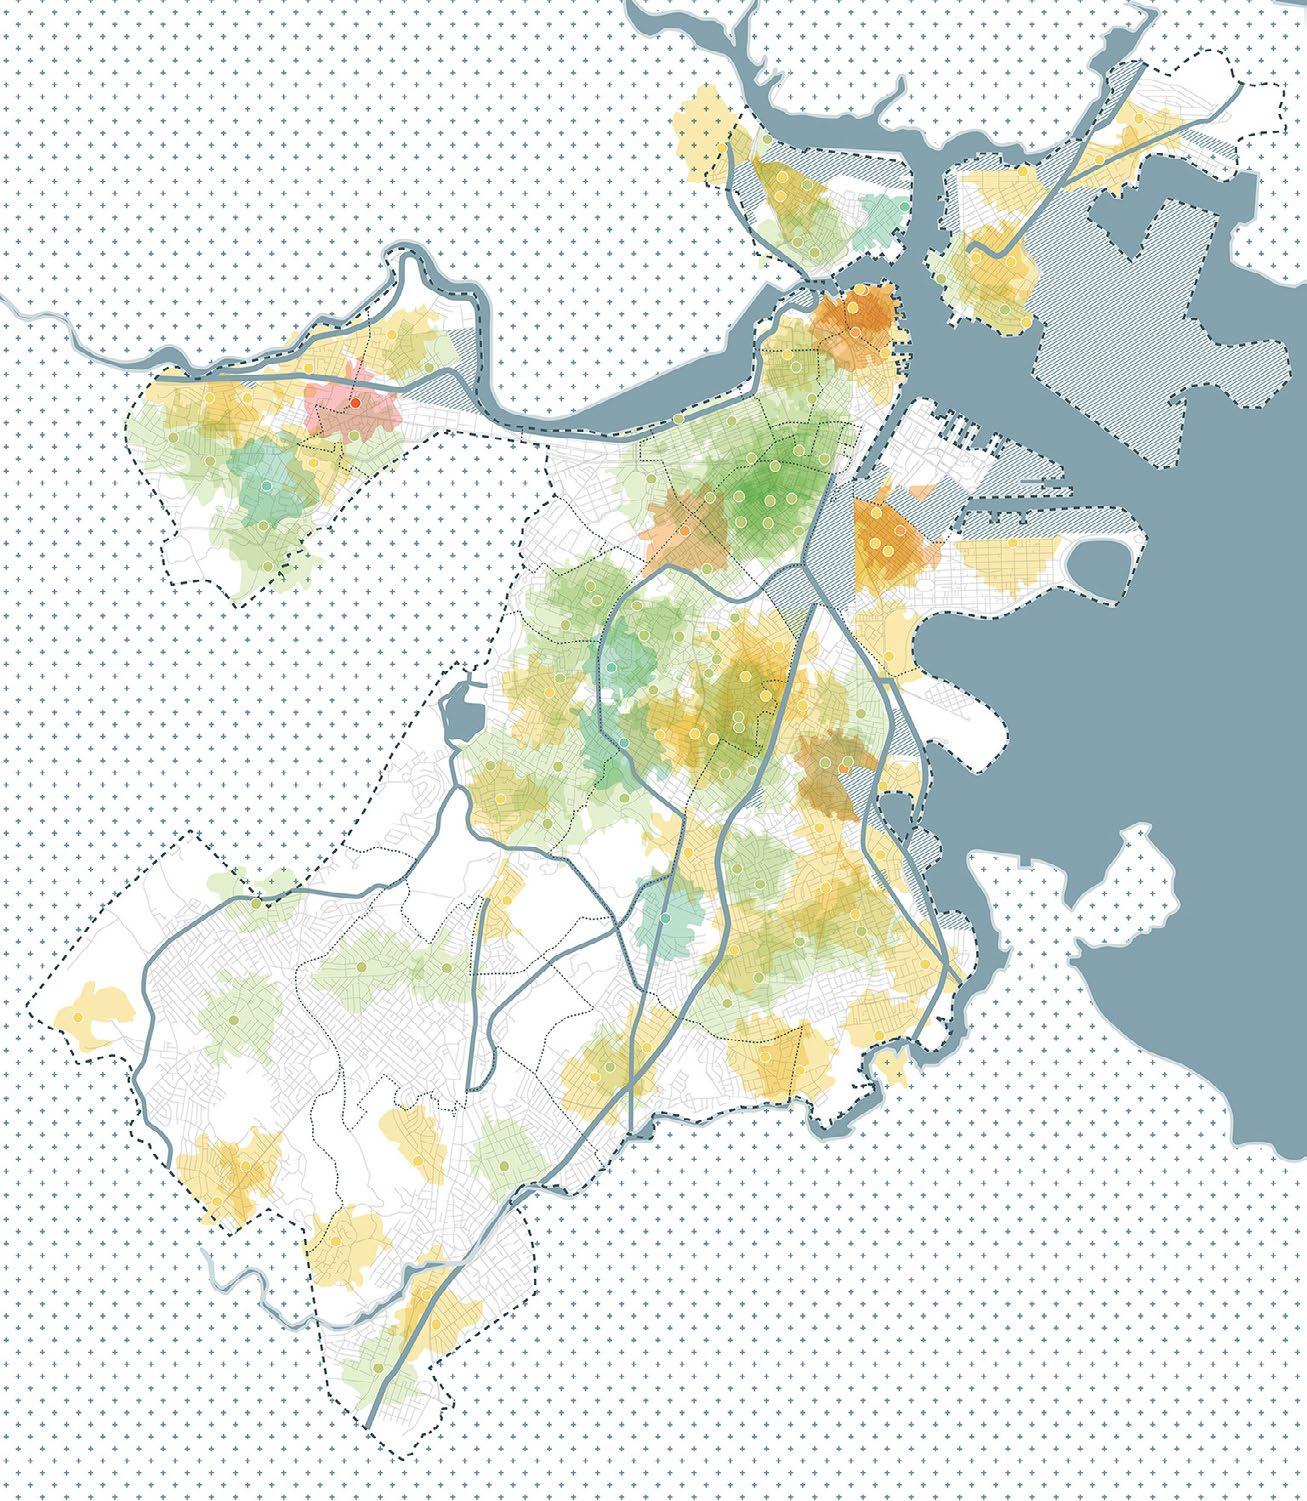
Our research aimed to develop a tool that can be used by any member of the public to evaluate their community’s play space infrastructure and to use the findings to constructively advocate for improvements. The scorecard emphasizes the importance of designing play spaces for users of all abilities. We used Boston as our case study to test this tool and to understand our context.
score


1 5
10 min travel time radius 1 5
city boundary
neighbourhood boundary
impediment - linear
impediment - industry
impediment - other
professional / 2019 / MYKD / Detroit Midtown Cultural Connections competition programs used: Rhino, Illustrator, Photoshop, After Effects, InDesign
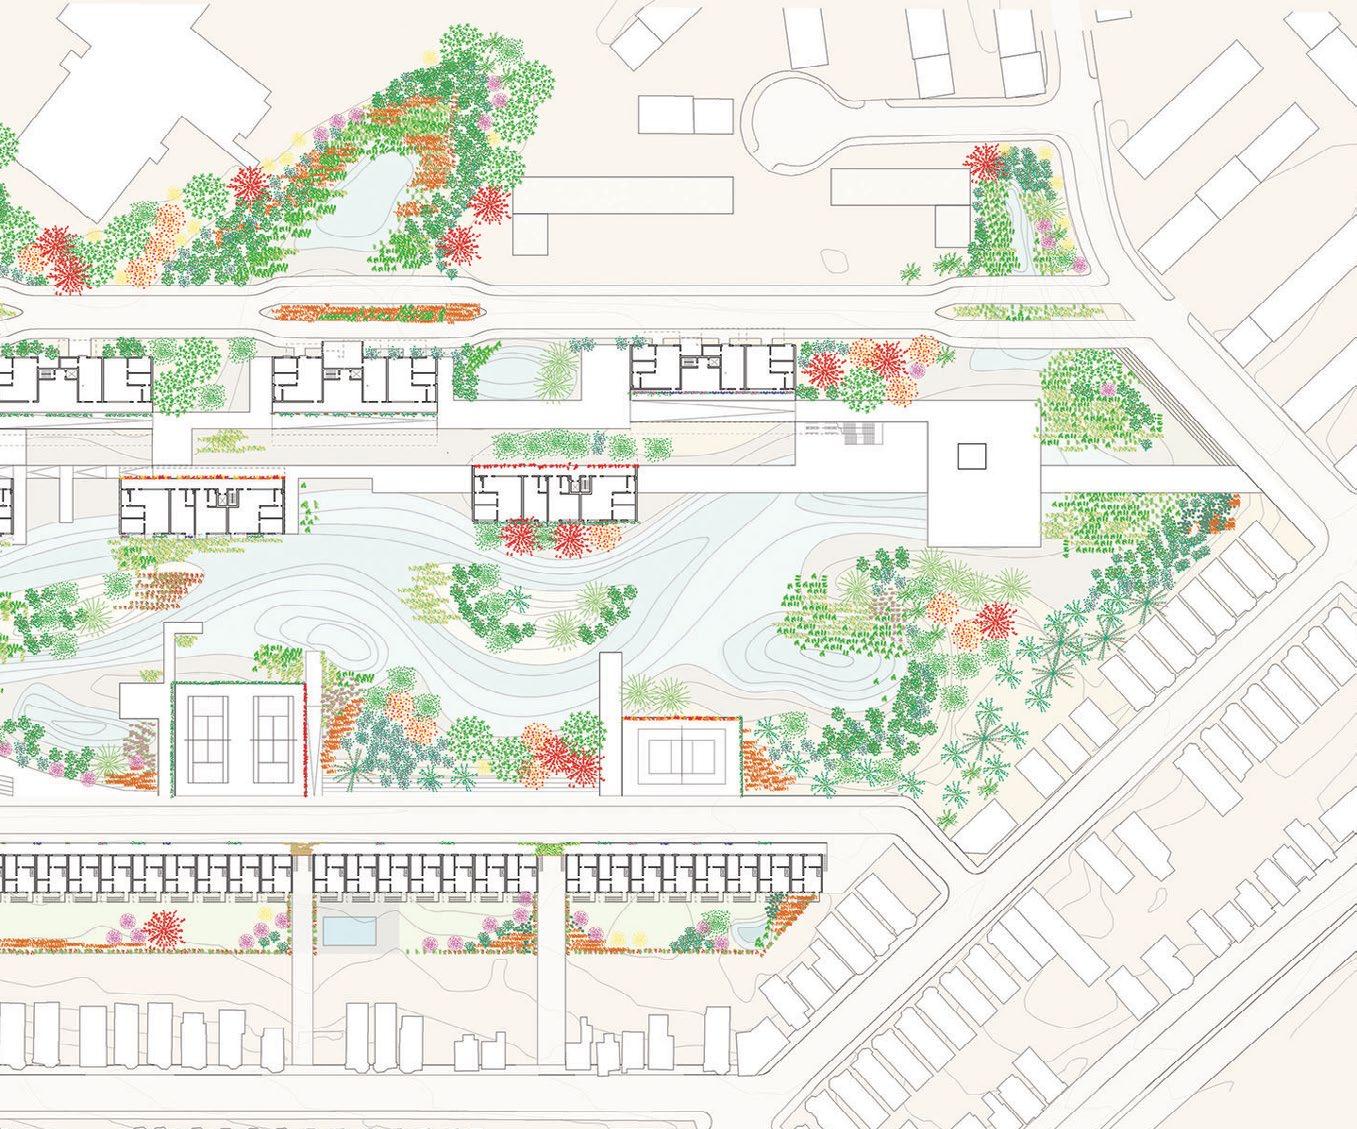
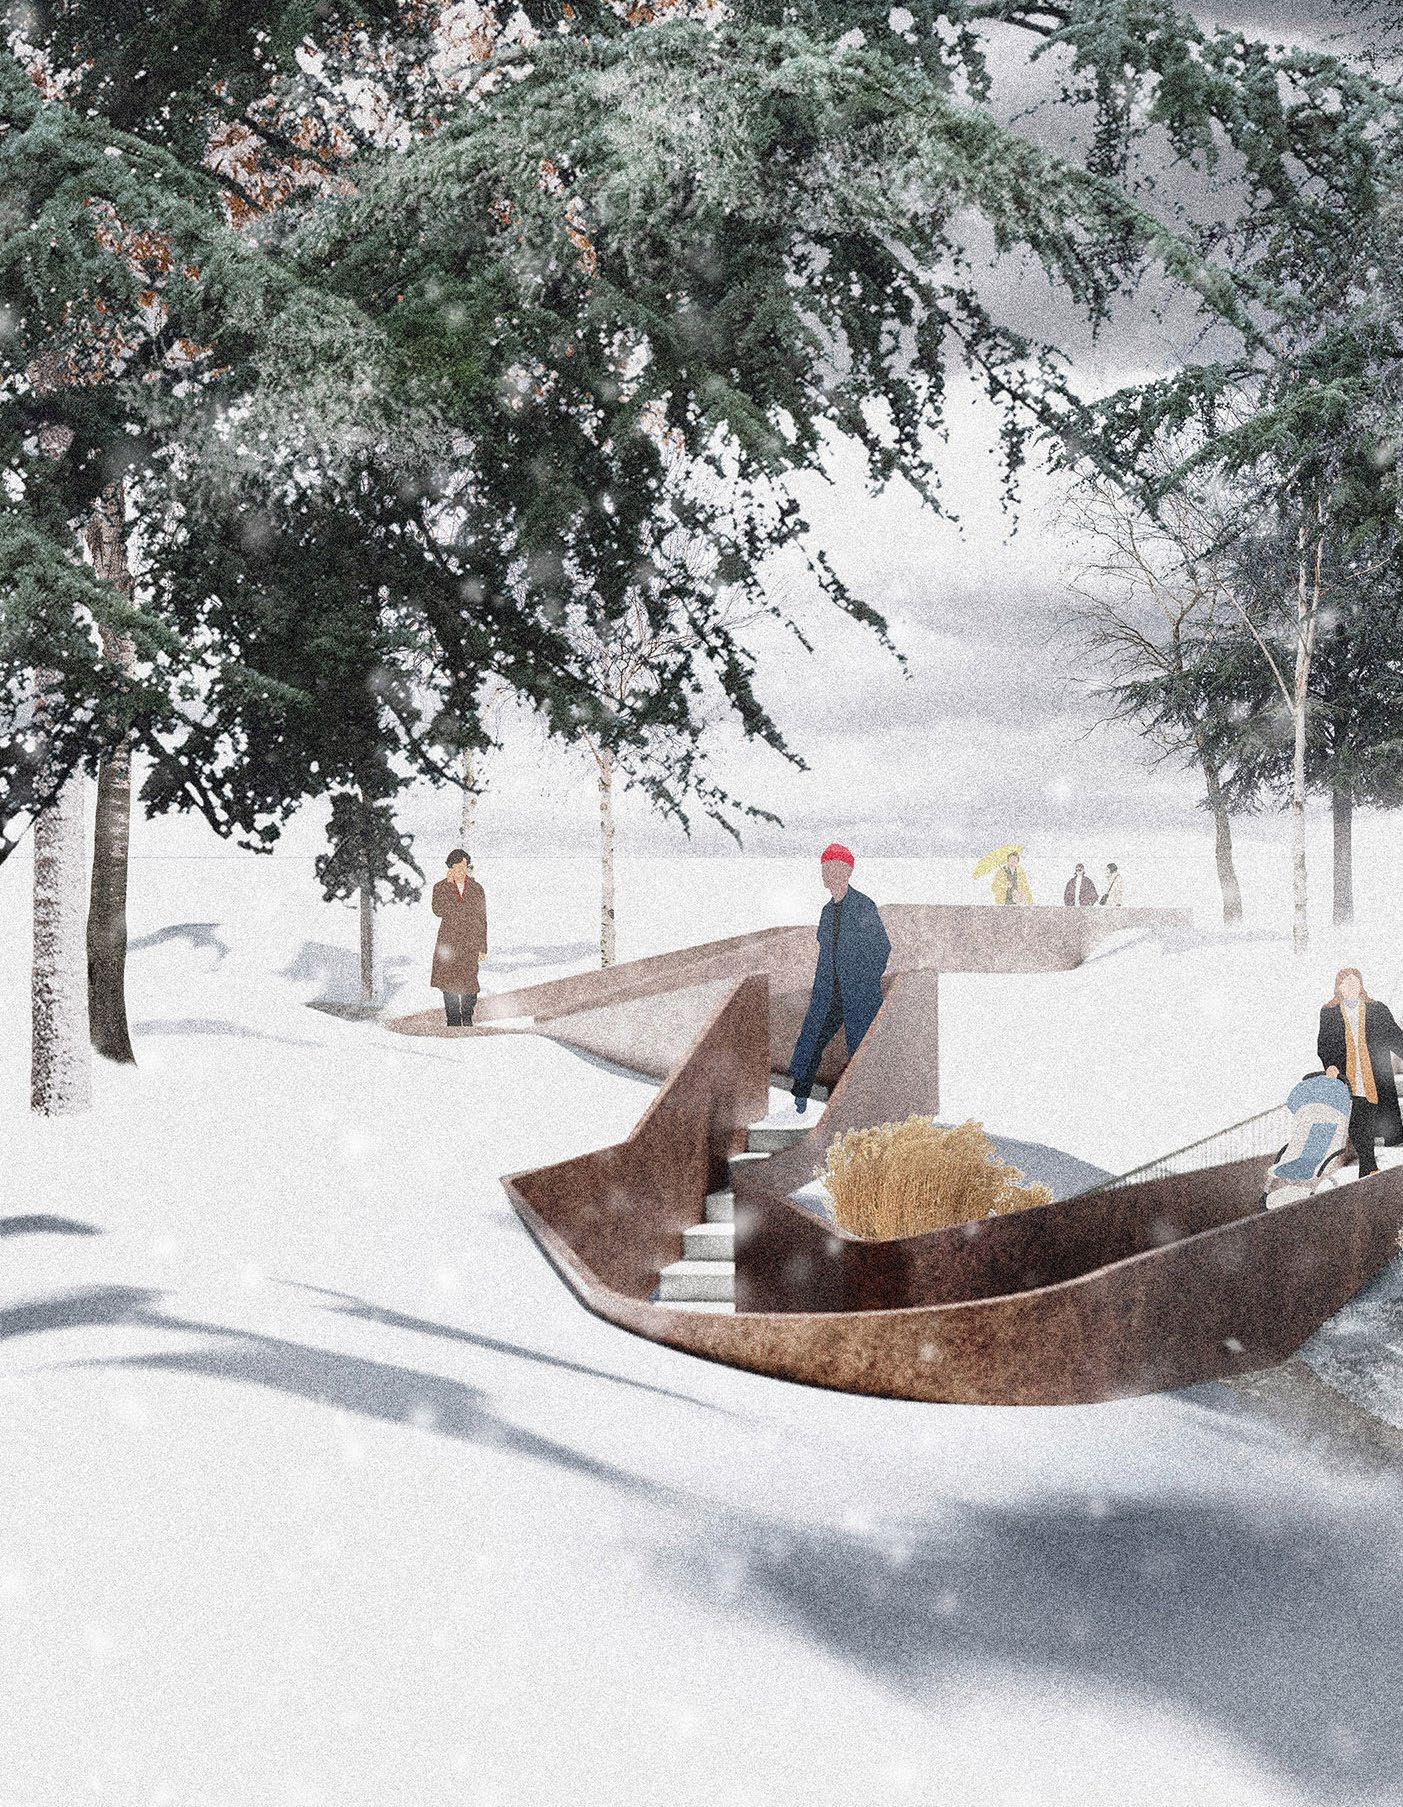
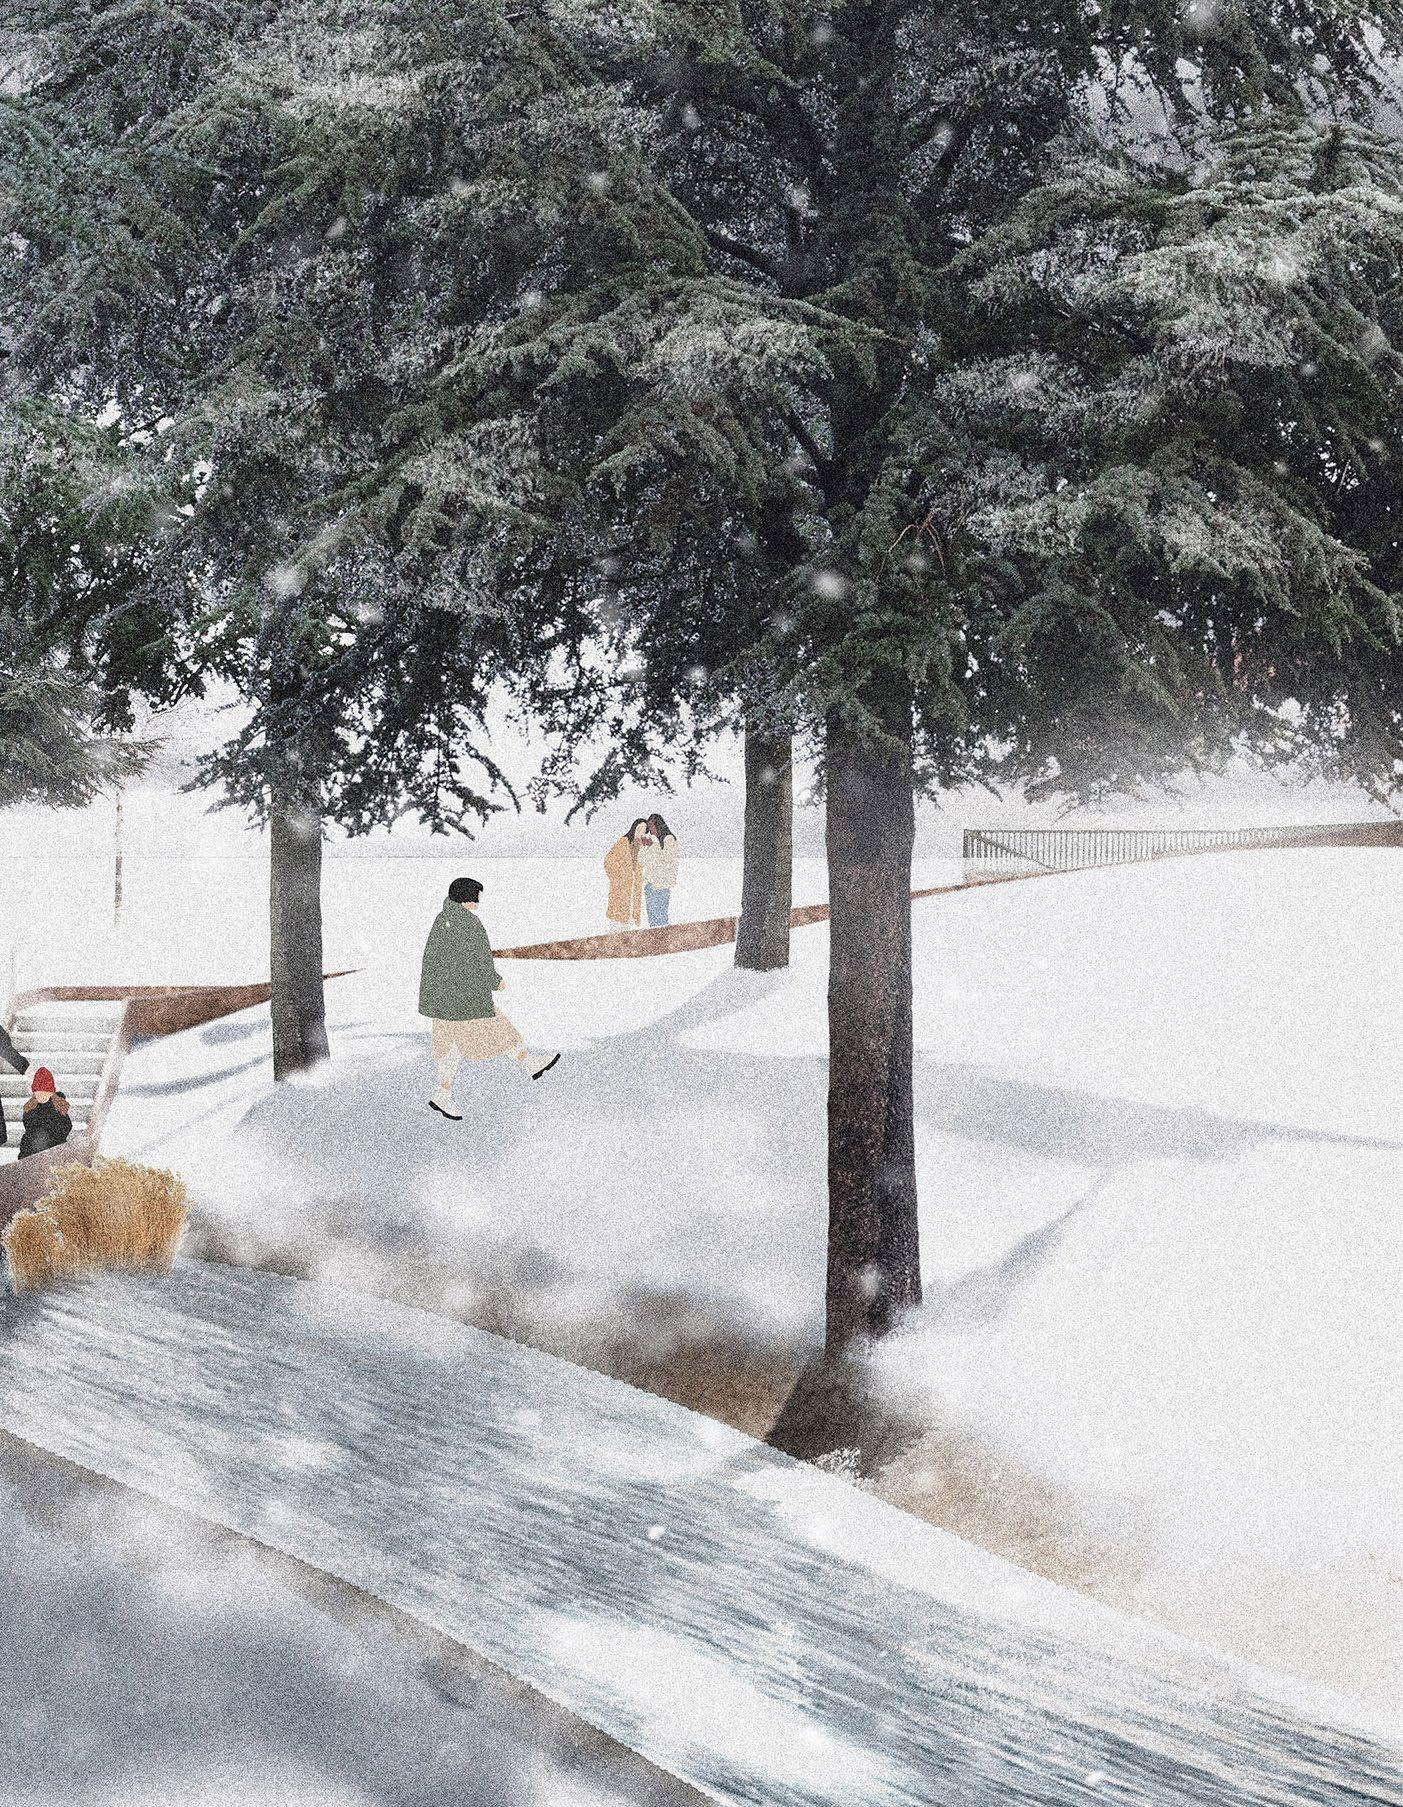
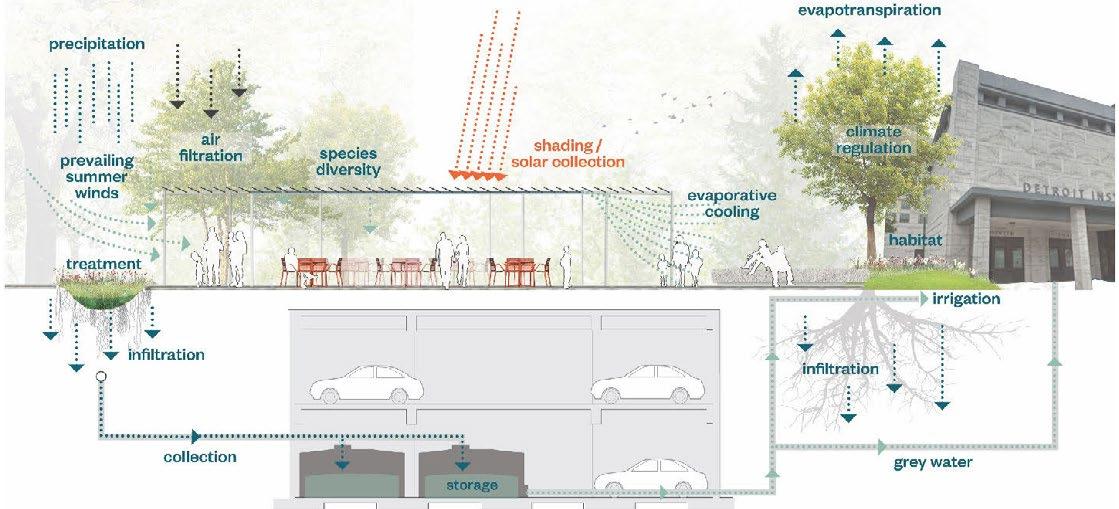
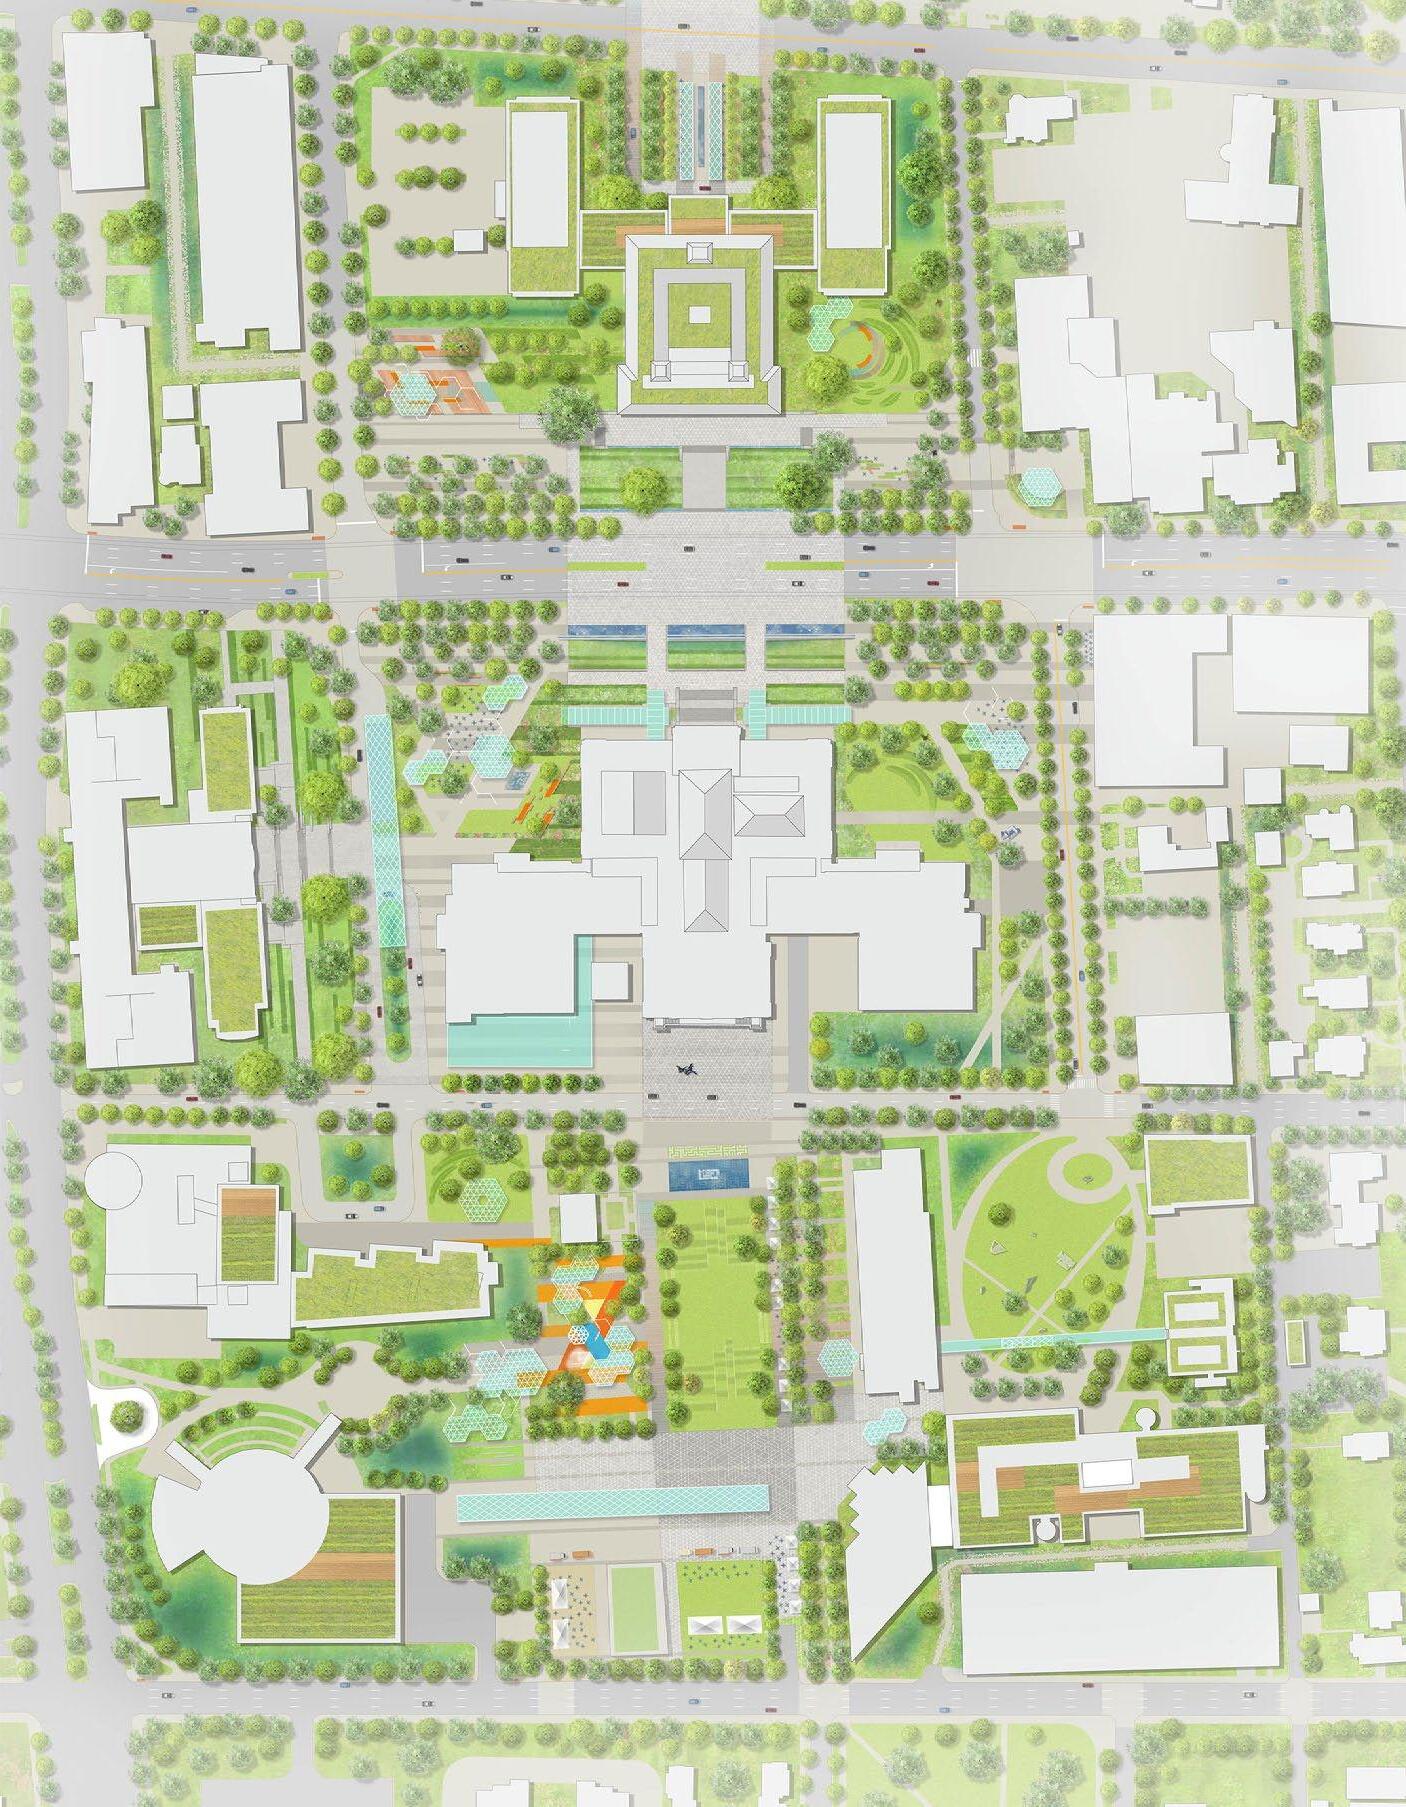
This competition entry re-imagines Detroit’s cultural district as a pedestrian oriented space that unifies the district’s numerous institutions, helping to define Detroit’s post-motor city identity. The proposal incorporates design elements that increase human comfort and allow the outdoor spaces to be used during a broader range of weather conditions. The site plan also creates spaces of various scale to accommodate varied activities and group sizes. These spaces are stitched together into a patchwork tapestry creating an equitable, sustainable district that fosters civic life.
For this competition, I held the roles of project coordinator and designer. I was responsible for developing the proposal strategy and coordinating between different team members, within and outside the office. I also played an active role in developing the design and generating the final presentation deliverables, including drawings and the presentation model.
with Eunjee Kim, David Huang, Bryan Chou & Sam Partington
summer - mitigating urban heat island effect

winter - extending the shoulder seasons
improving human comfort
academic / 2022 / garden design in Philly’s Wissahickon park

programs used: Rhino, Illustrator, Photoshop, hand drawing
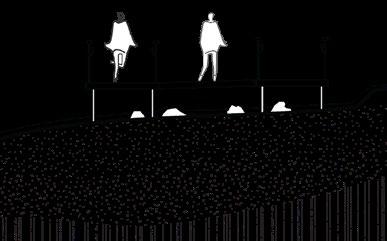
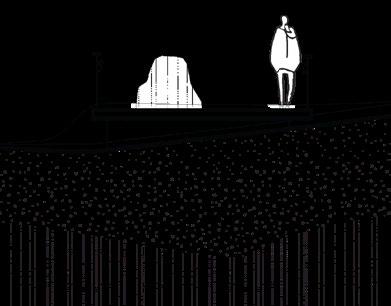
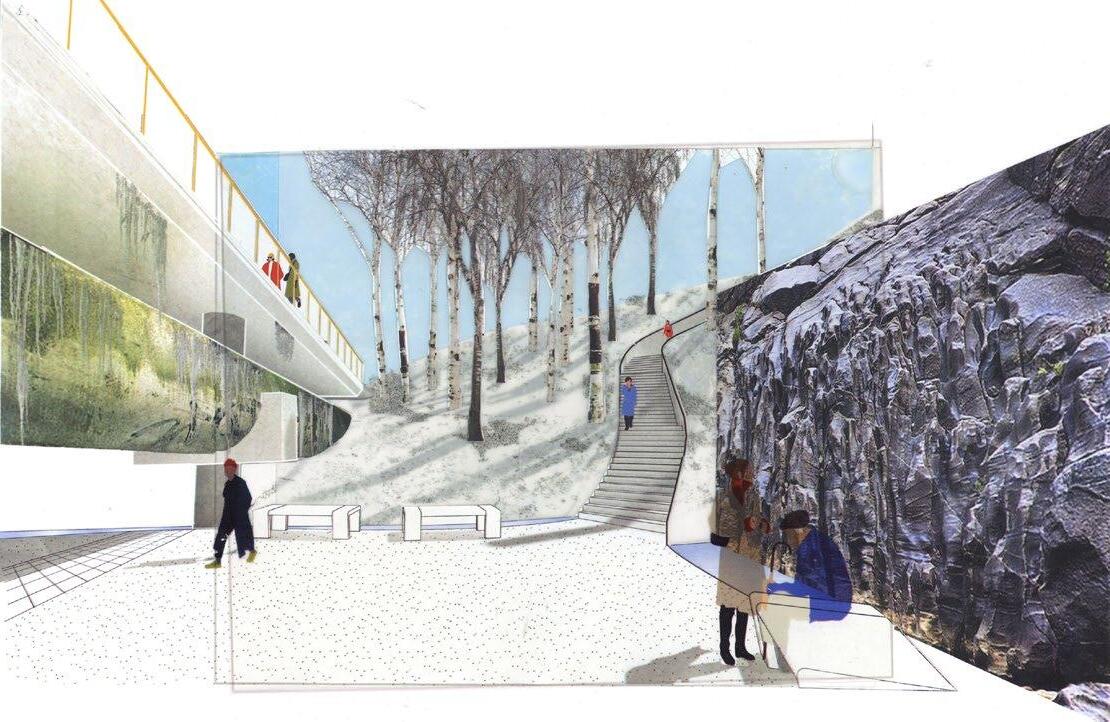
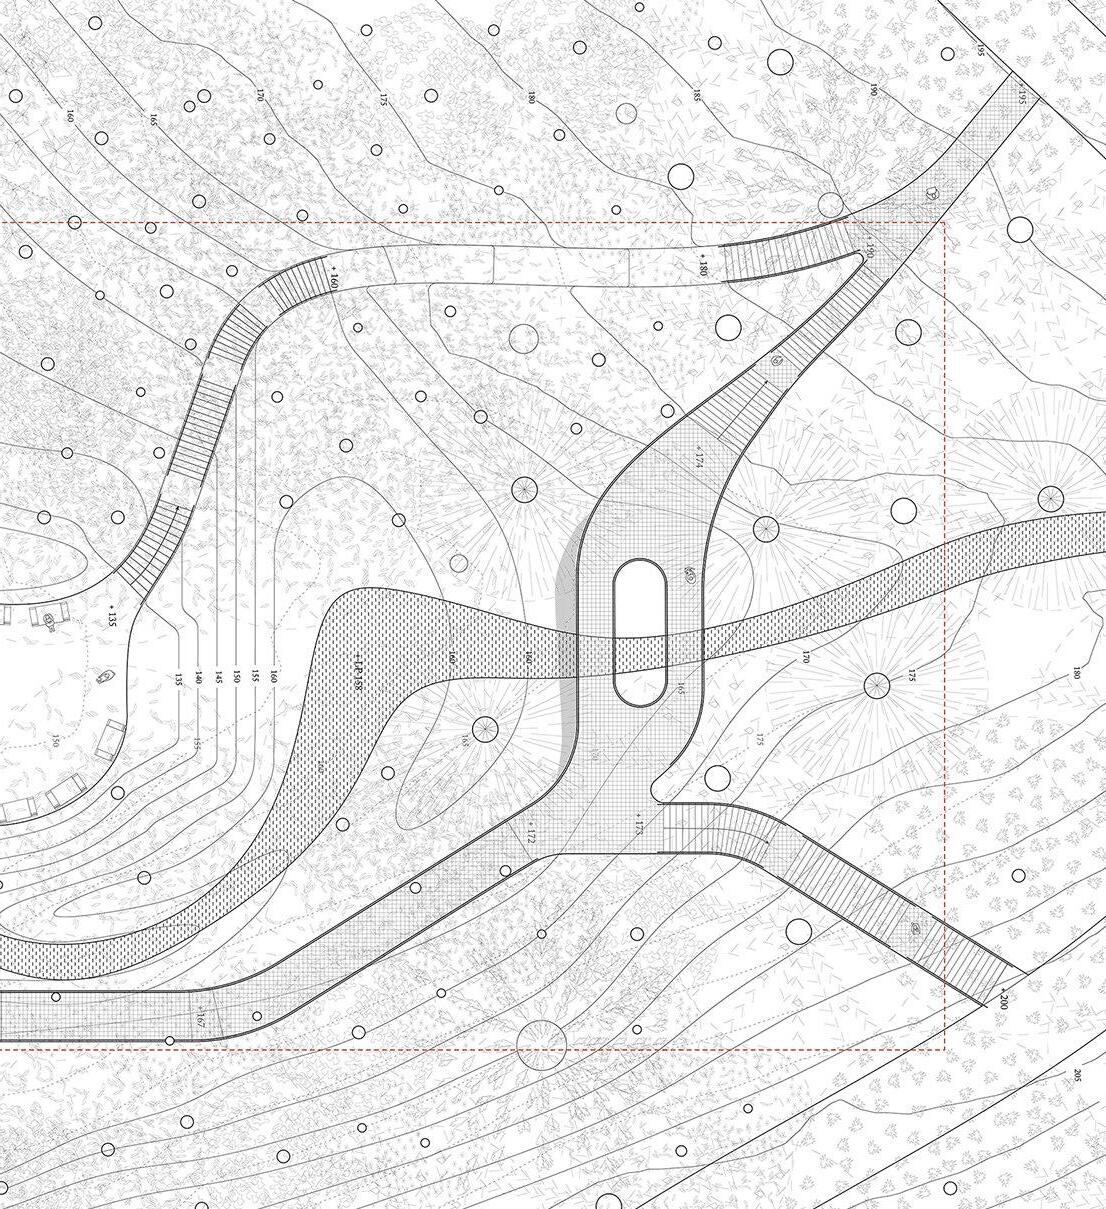
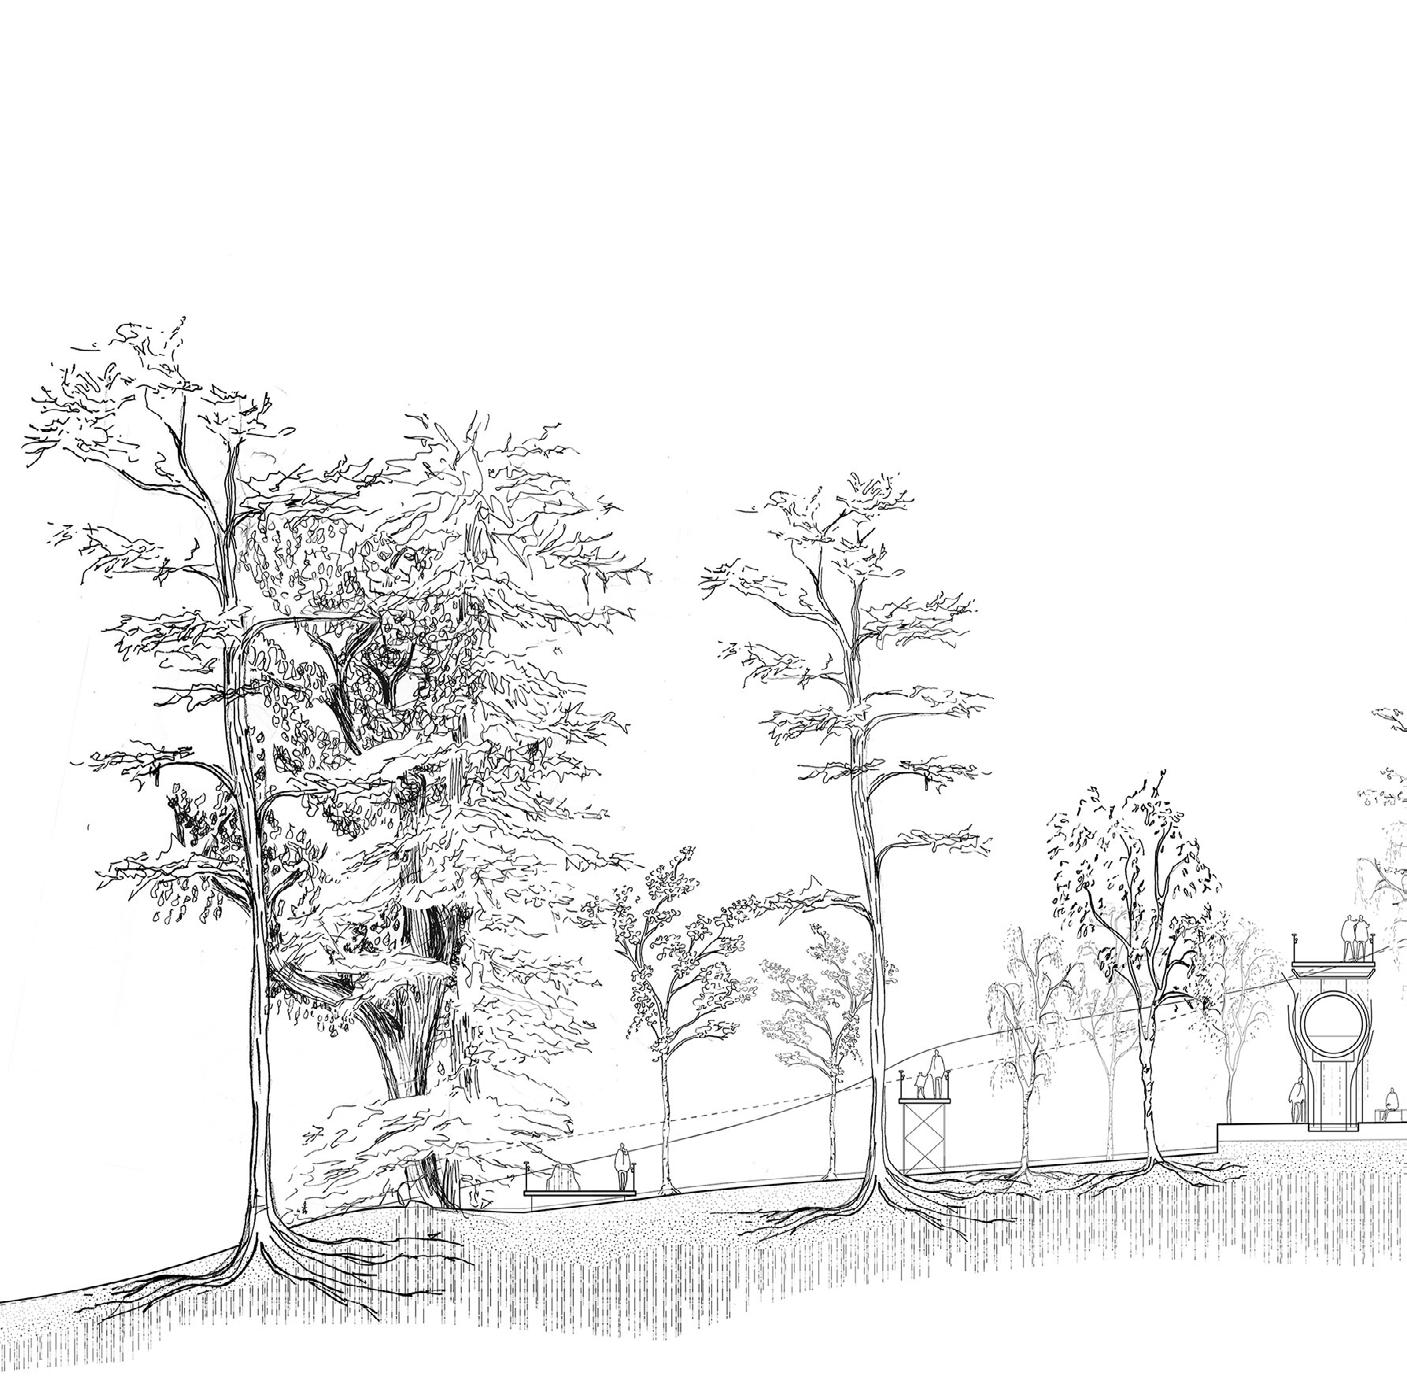
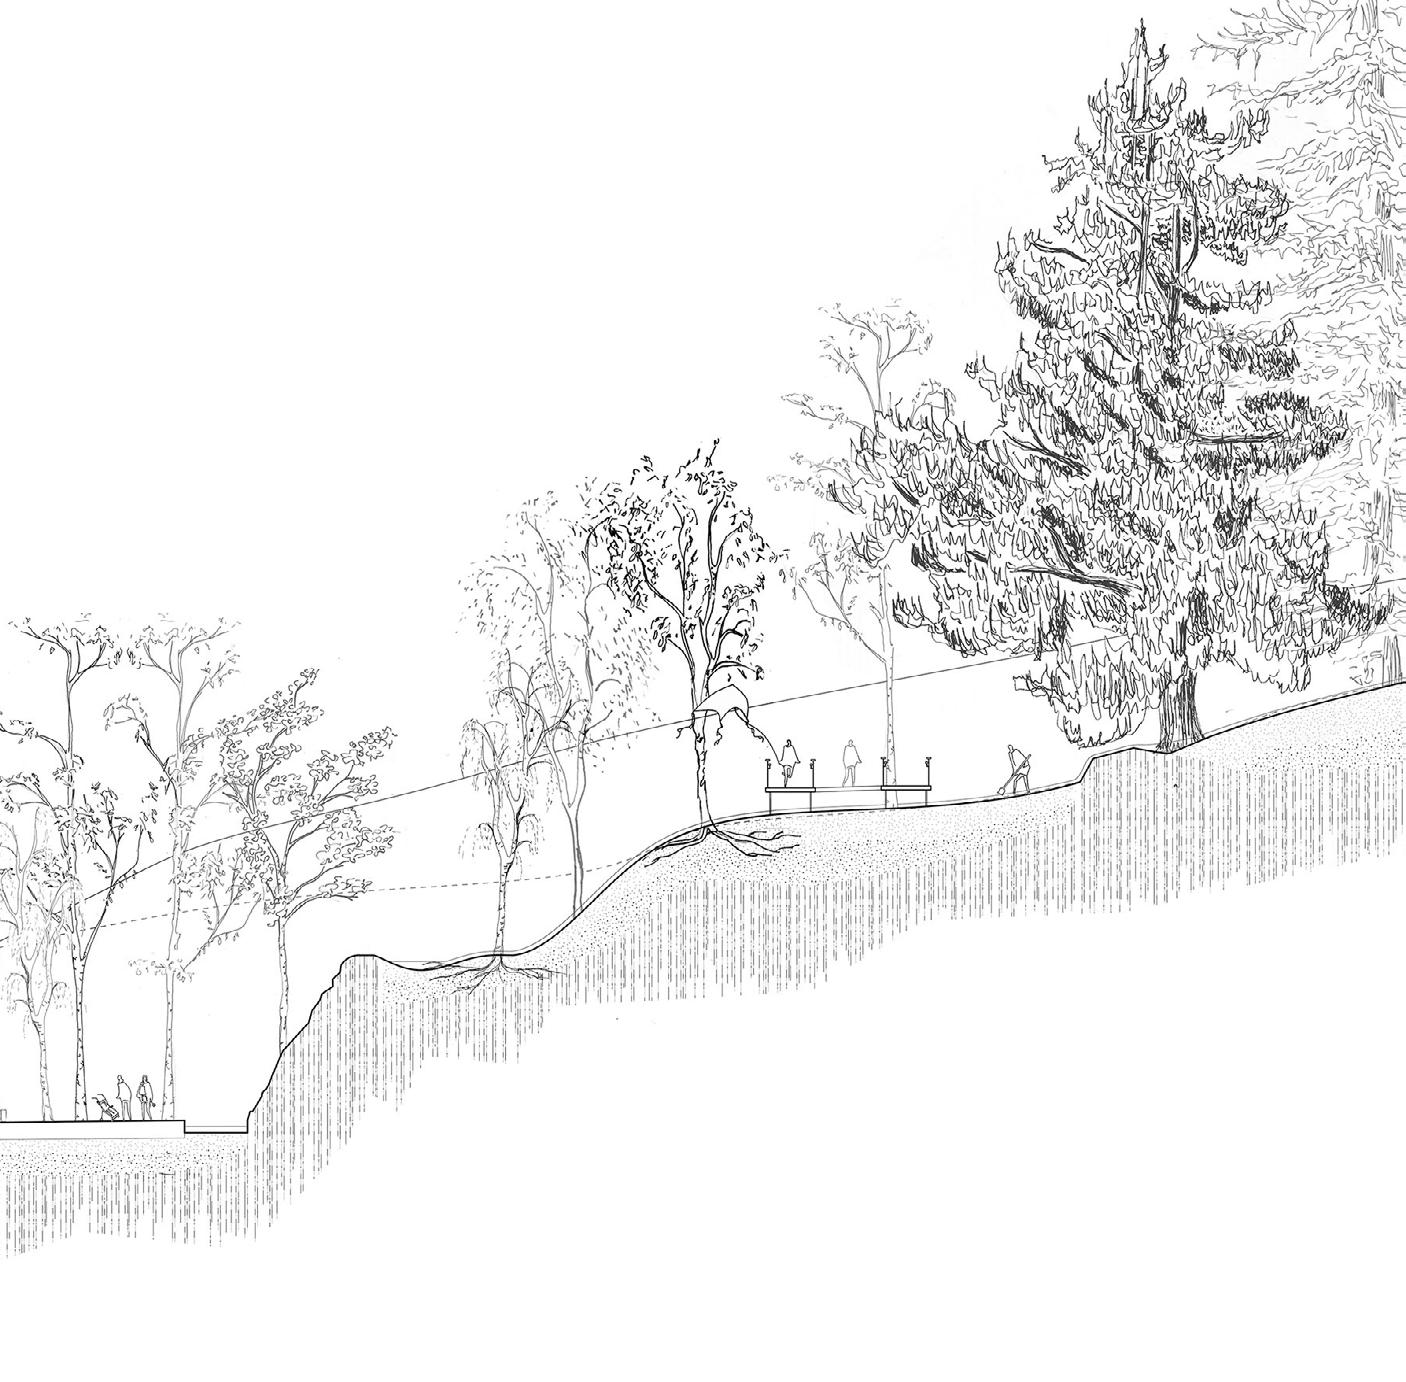
Located in the depths of the Wissahickon park, between a central thoroughfare and a trail, the garden of disrupted expectations aims to challenge our conceptions and preconceived notions of what nonhuman nature is and what it looks like. The garden does so by exposing the manmade infrastructure that underlies the site and by introducing industrial materials to the garden’s palette – both things that one does not expect to find in “nature.” The proposed design also disrupts the environmental processes that occur on the site by redirecting the flow of water and interrupting the growth trajectory of tree saplings – taking cue from the existing site conditions. The contrast between dense planting at the edges and white-trunked birches at the center further amplifies the experience of the sublime within the new landscape.
parti diagram 3. spot to look below
schist boulder placed asymmetrically to force circulation along the platform’s garden side
water runs over stone slab; porous sandstone to maintain damp surface
steel bridge with water trough below
divets to divert water from circulation path
existing sewage pipe tulip poplar saplings growing around pipe water veil
grate with water channel below
boulders to create turbulence
falling water creates mist
grate boardwalk

garden site plan
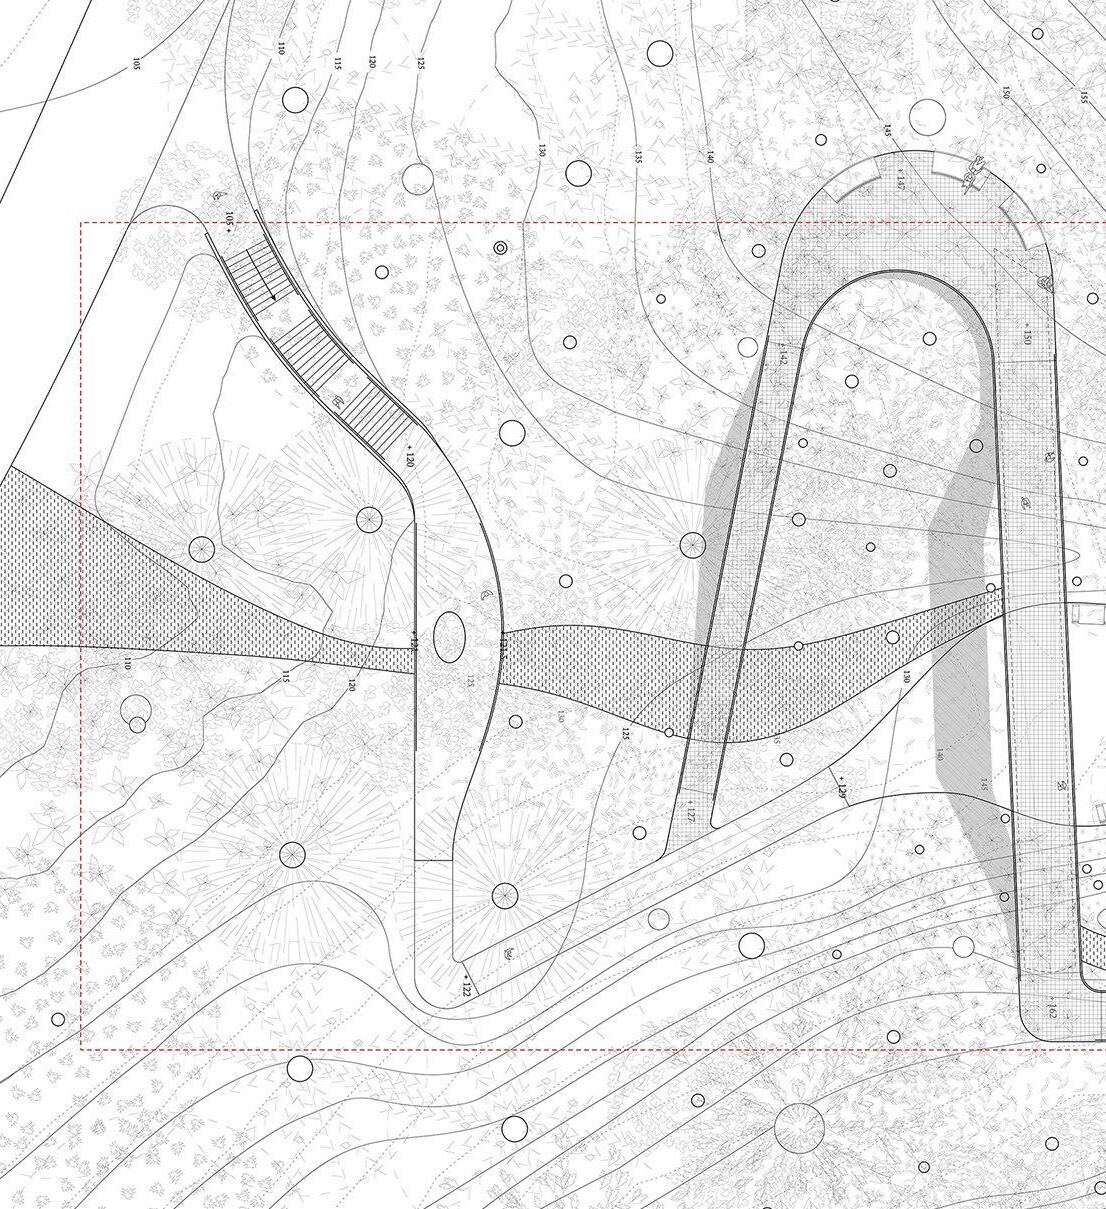
depression to hold water
3 CENTRAL GARDEN SPACE
2
SPOT TO LOOK BELOW pool at
@ grade path open to below YellowTrail
digging into the hillside (A-A)
trees with dense canopies
existing topography proposed topography steel bridge
trees with dense canopies
programs used: Rhino, Illustrator, Photoshop, AutoCAD
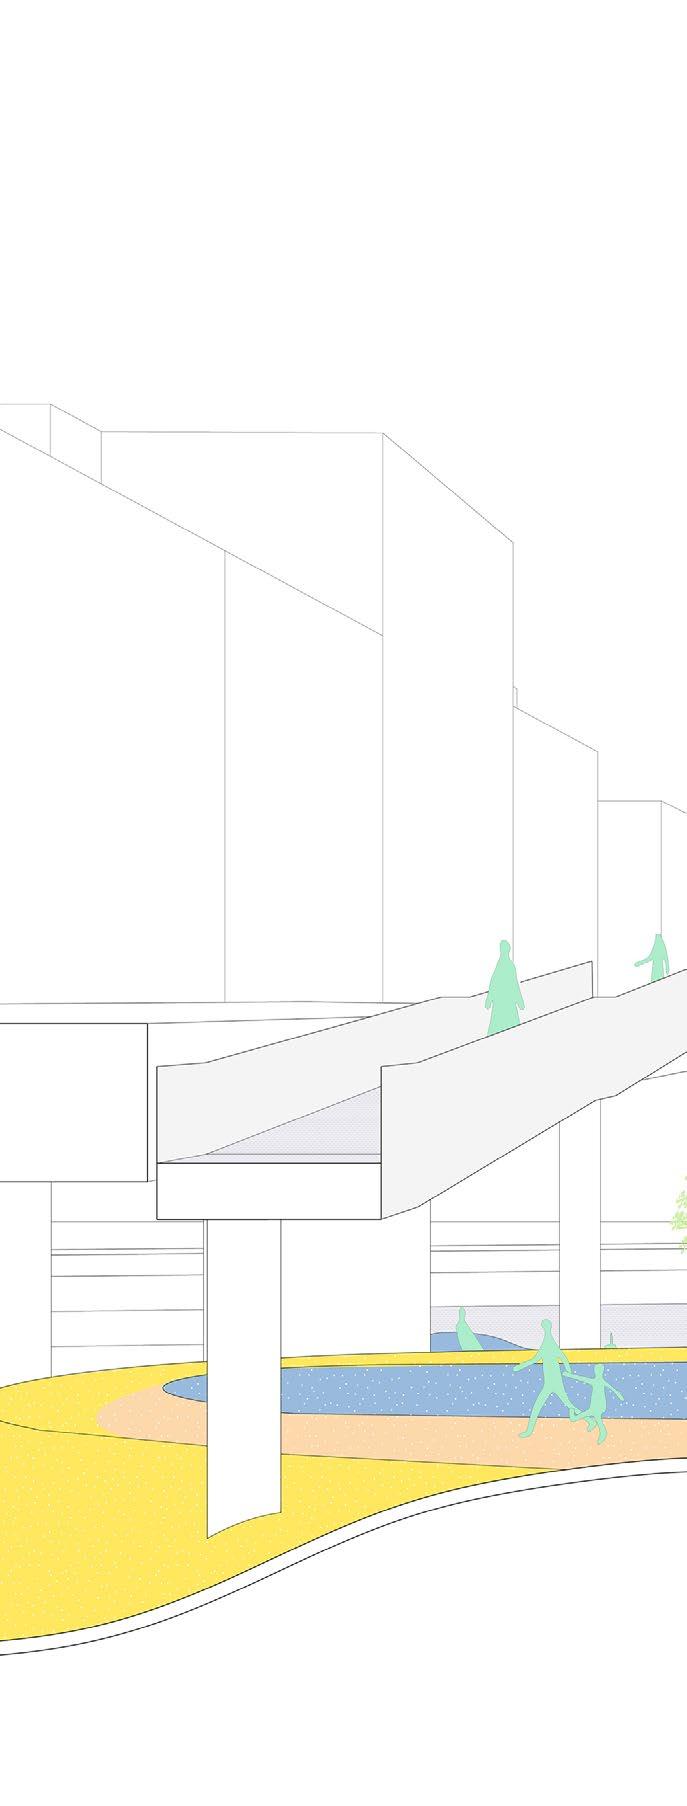
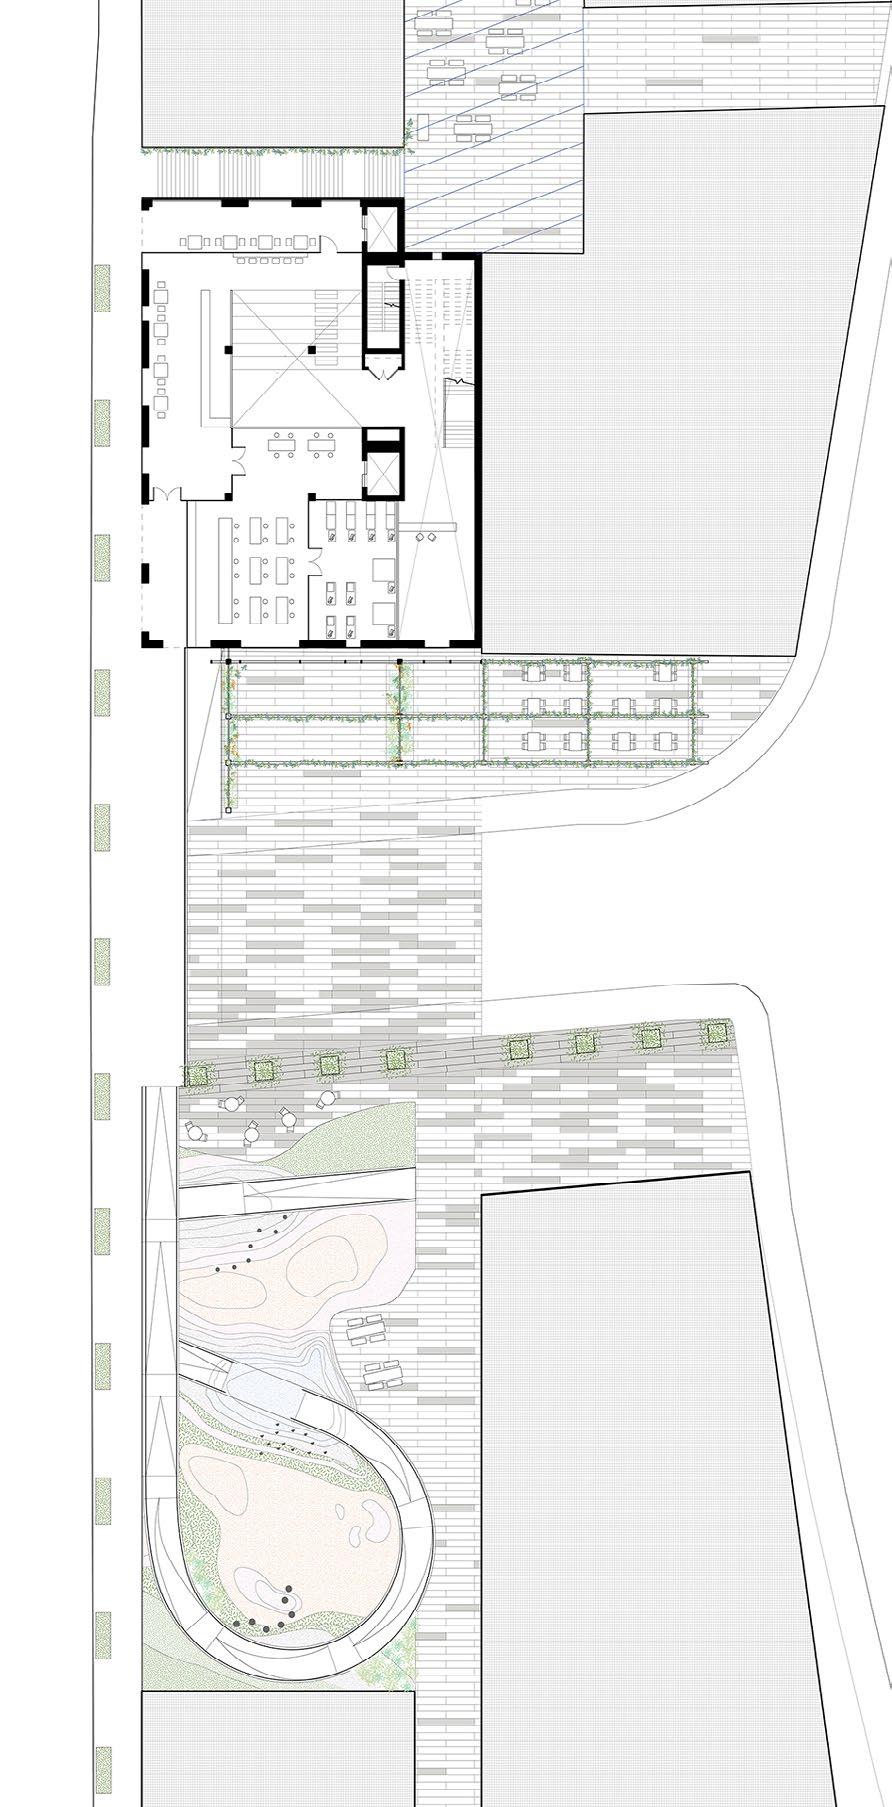
This site straddles the boundary between a lively and active commercial zone and a sea of parking in Boston’s Fort Point neighborhood. The project explores the many facets of environmental performance, including stormwater management and addressing the neighborhood’s connectivity issues. It integrates a purposeful pedestrian path to and across the site and through community spaces that the neighborhood currently lacks.
with Katie Reilly, all design development and drawing production responsibilities were shared equally
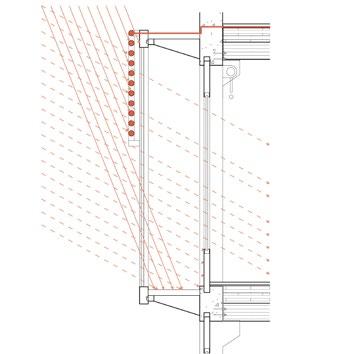
Evacuated tubing acts as shading and supplies domestic hot water.
strategies to retain water on site
In the winter, the thermal wall supplies heat to the interior. In the summer, a honeycomb panel in the glass shades the thermal wall to avoid overheating.
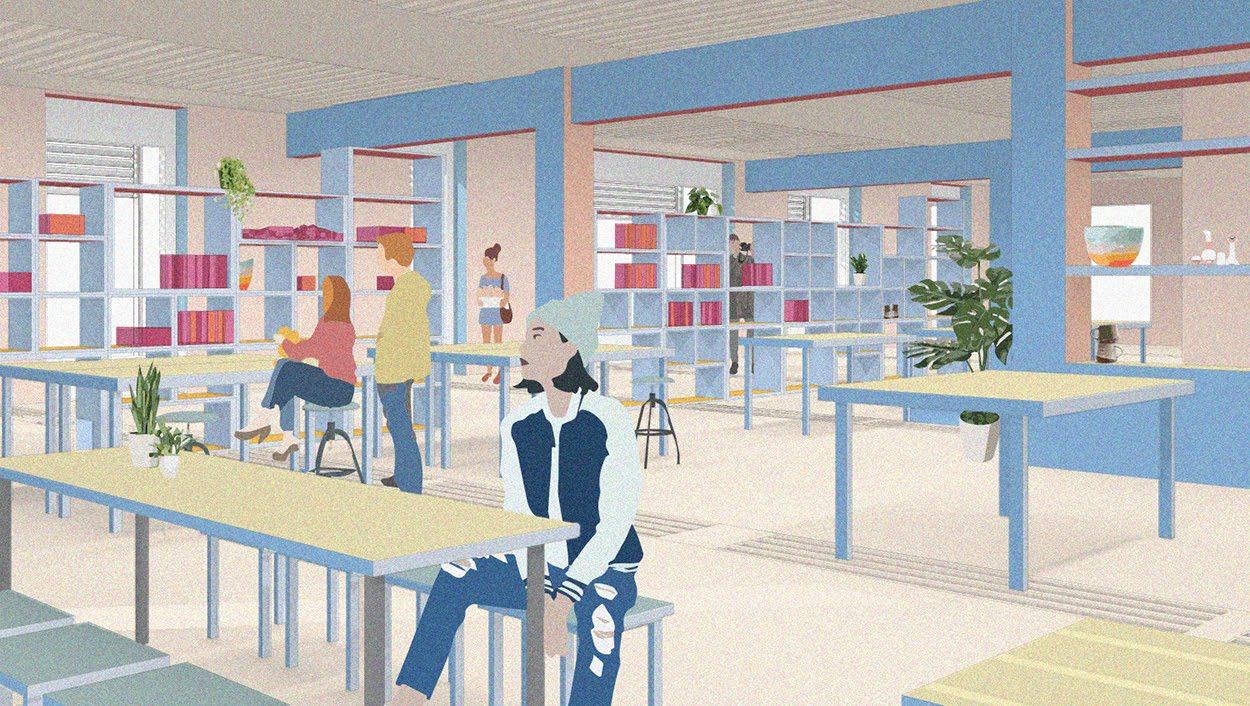
Concrete beams support the ground level, the beam material changes to glulam for the upper floors.

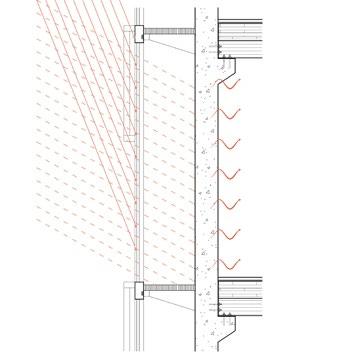
site section, not to a scale (A - A)
evacuate tubing
double skin & thermal wall
concrete pedestal

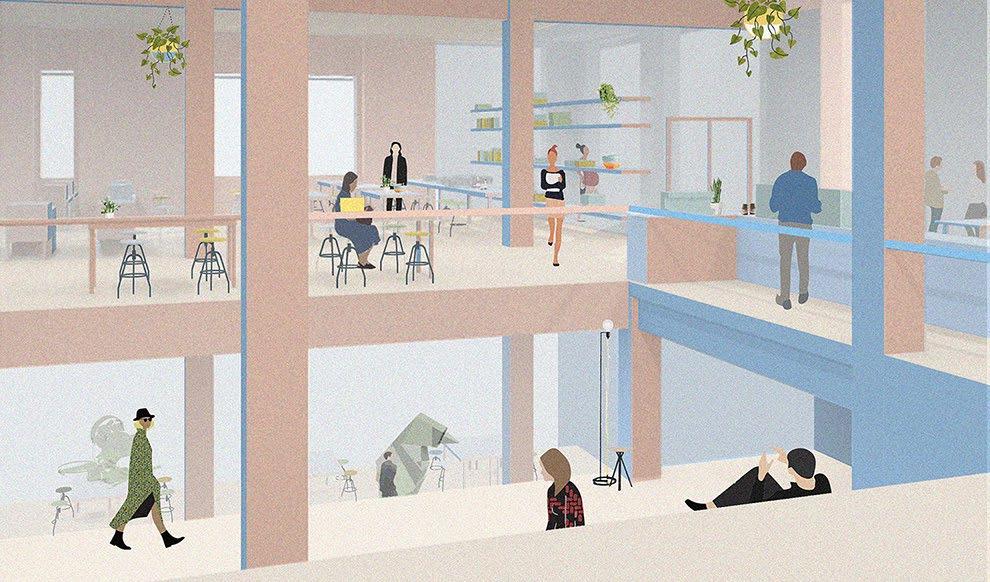
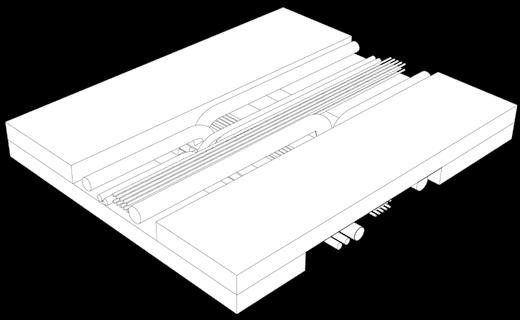
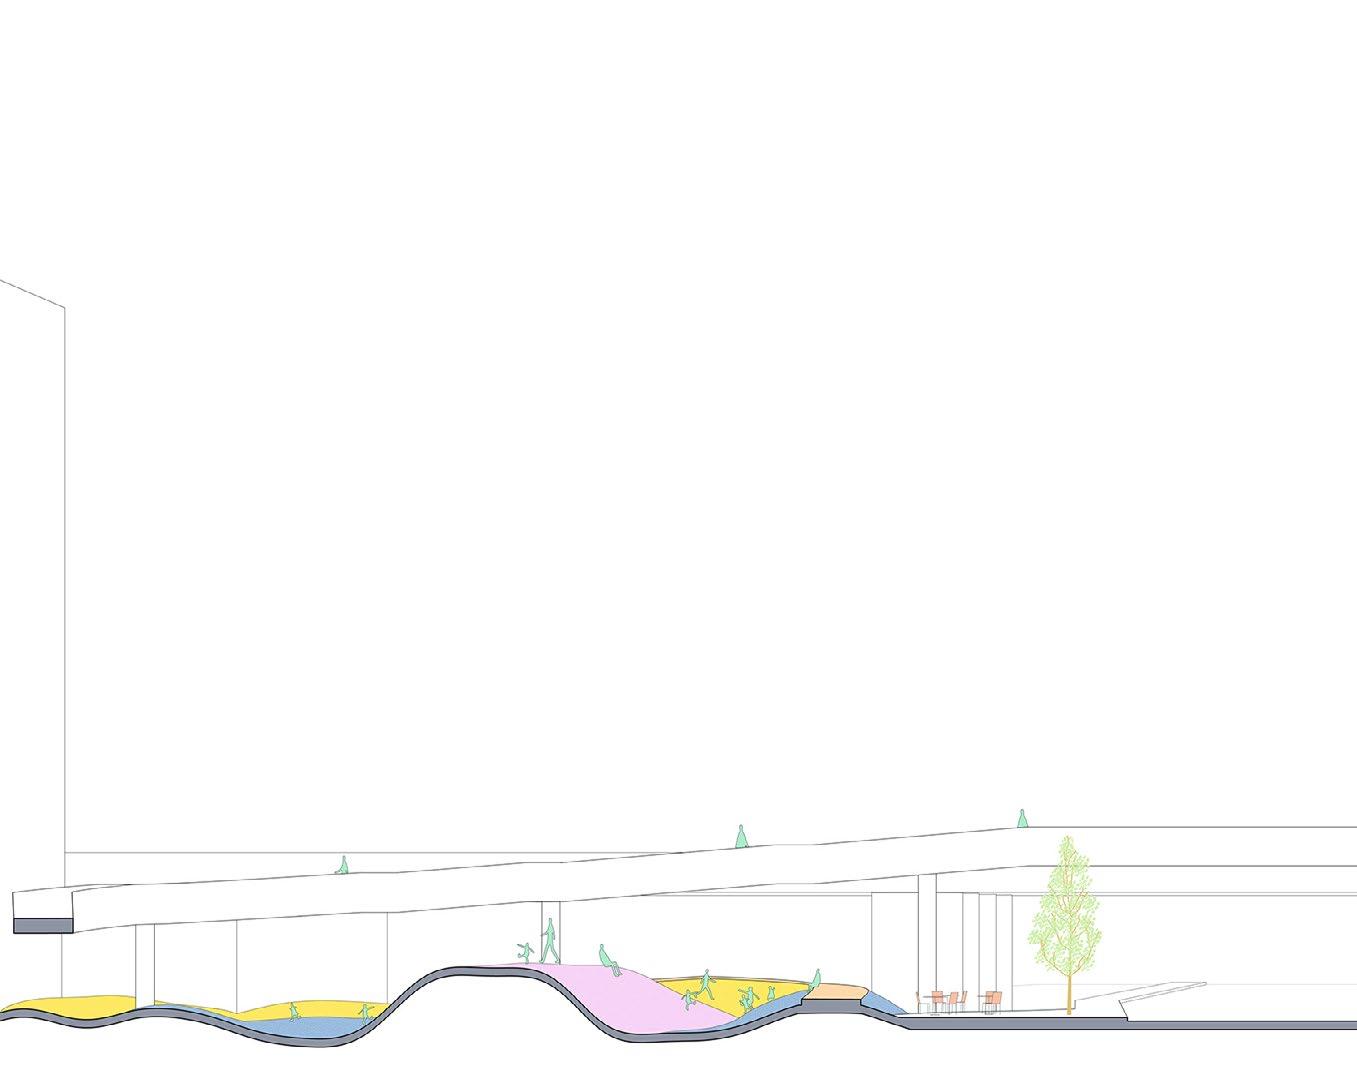
The project provides multiple points of connection between the elevated Summer St. and the at-grade Boston Wharf Rd. and Congress St. – through the interior and exterior of the building, improving circulation and the neighborhood’s connectivity.
The building’s structural and comfort systems are organized to allow the interior of the building to adapt to the neighborhood’s changing needs. The regular grid structure, large spans, and high load capacity can accommodate a wide variety of spatial configurations and many different programs, including a ceramics studio.

The project embeds energy harnessing functions into the building and site. The facade employs a number of passive heating and cooling strategies to reduce the building’s mechanical heating/cooling loads, while the chosen construction system enables the skin and guts of the building to be modified as the building use changes. Further, the project highlights the building’s passive energy harnessing capacity by foregrounding these systems on the building’s exterior.

The site and building strategy aims to resolve the water management issues that arise from the dominance of impervious surfaces in the neighbourhood by integrating stormwater detention and retention techniques into the neighbourhood amenities.
building & site system integration (B-B)
green roof - gray water collection & passive cooling
concrete thermal wall
evacuated tubing
CLT plank horizontal structure
convection cycle
double skin facade
rain garden
connection to Summer St.
public connection between street levels through the building
geothermal heating/cooling


academic / 2016 / East Boston master plan programs used: Rhino, Illustrator, Photoshop, AutoCAD
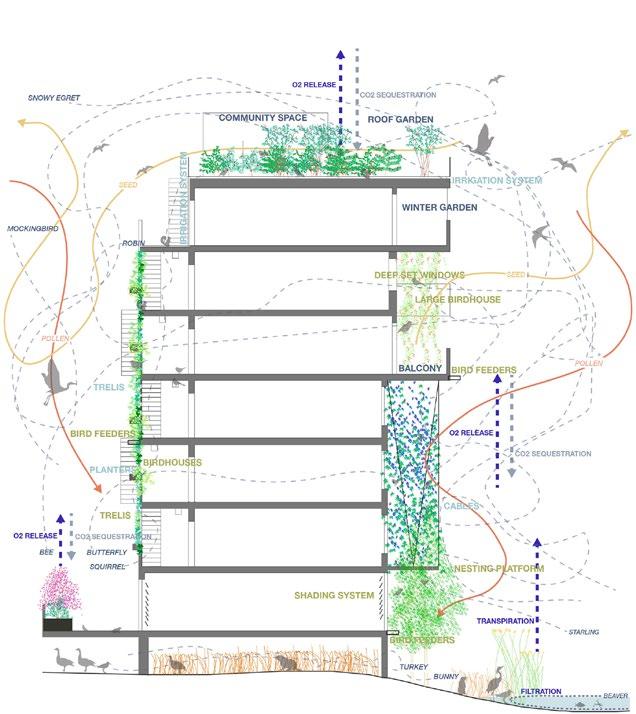
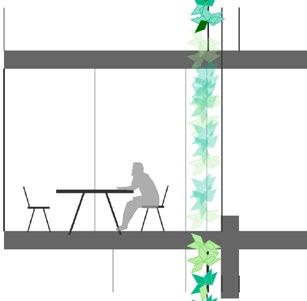
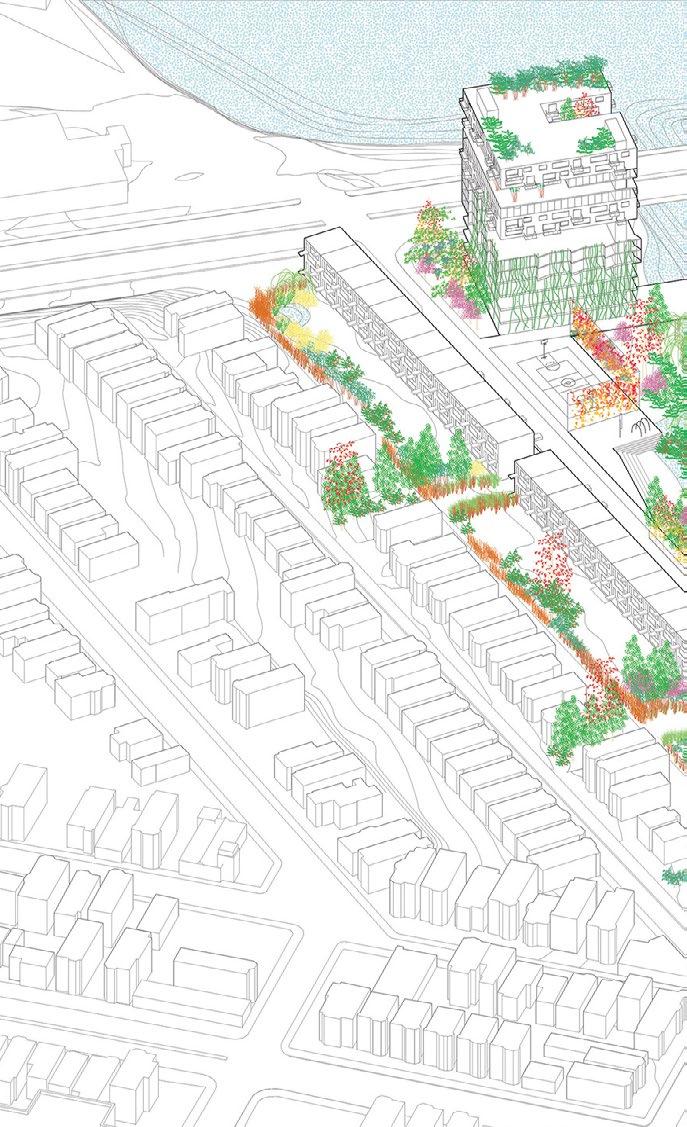
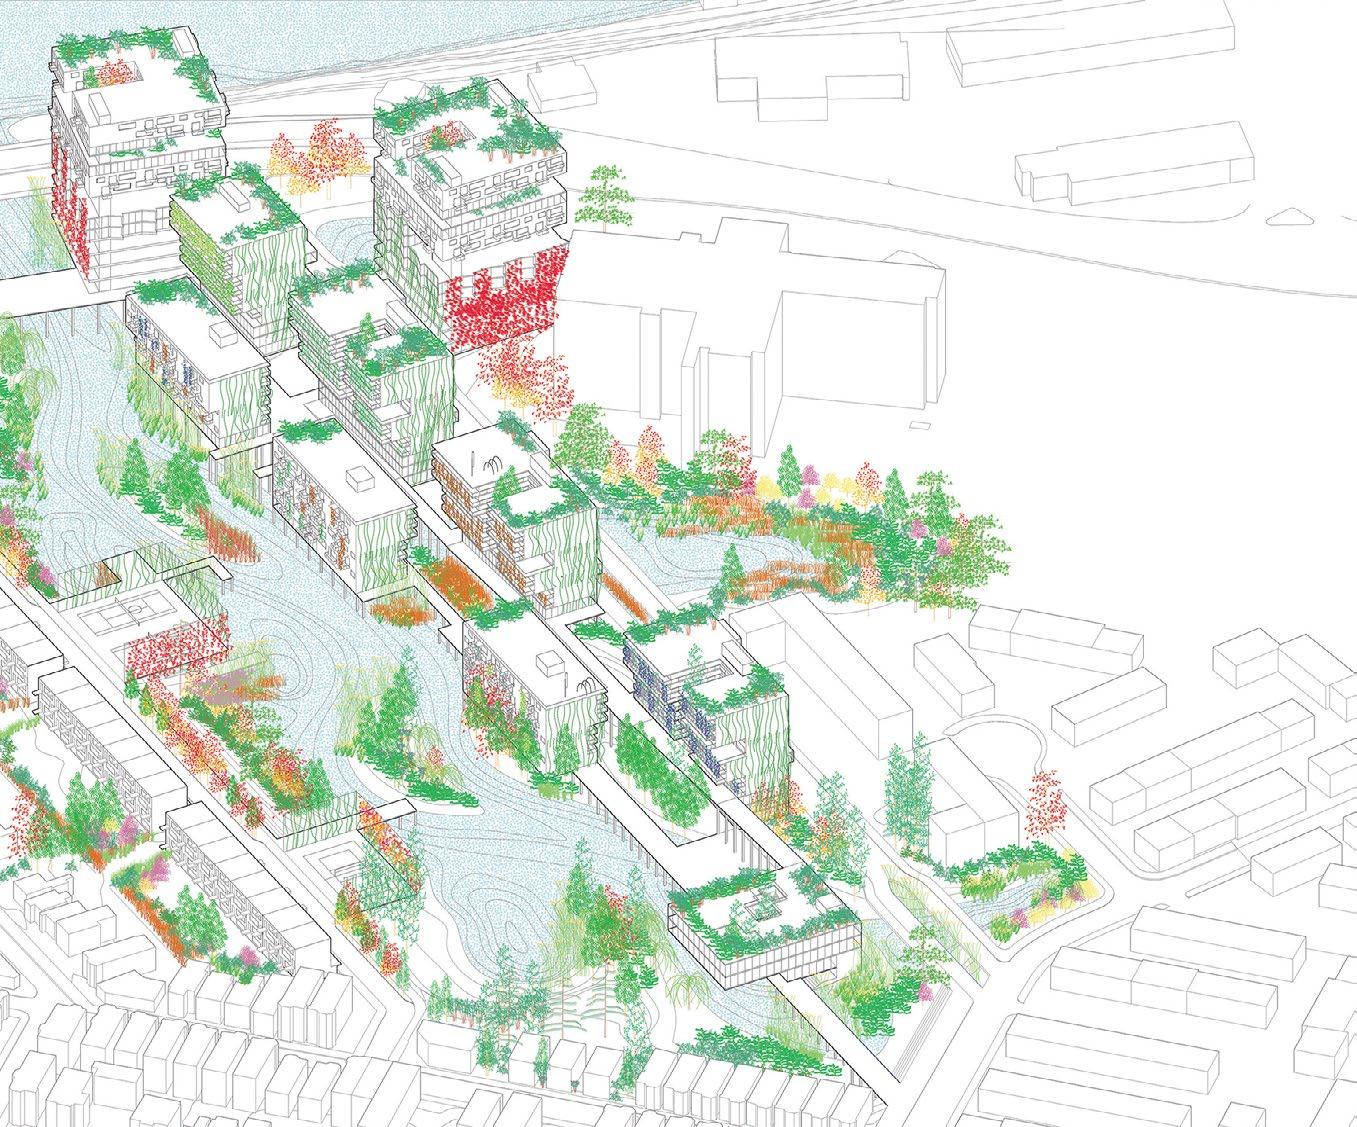
Designers and ecologists often refer to ecosystem services when describing the many and varied benefits provided by the natural environment to humans. This project proposed to re-interpret the relationship between ecology and the urban realm -- instead looking to explore how building architecture can be used to support animal habitats, illustrating the architectural services the built environment can provide to ecological systems.
Chelsea River
noise pollution buffer
neighbourhood amenity terrace
saltwater marsh planting
habitat sanctuary
architectural services diagram
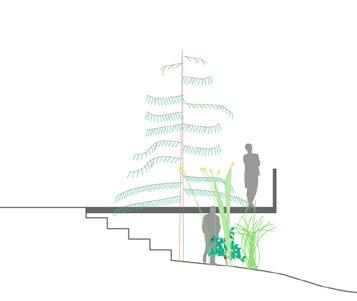
platform within the landscape
viewing platform above the landscape
architectural services deployed across the site, not to a scale
occupiable pop out french balcony above vs. within landscape
landscape-human interactions
high-rise building carved to extend the marsh habitat up and through the buildings
roof garden
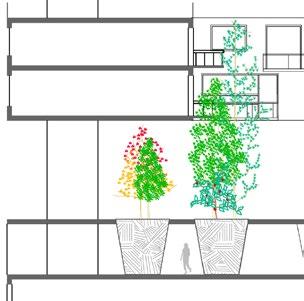
riparian planting
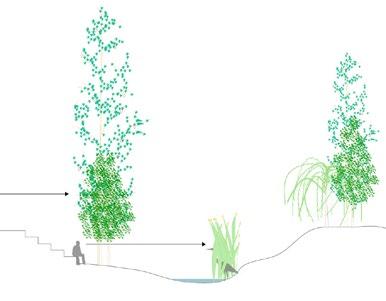
buildings step back to allow sunlight to penetrate to the ground
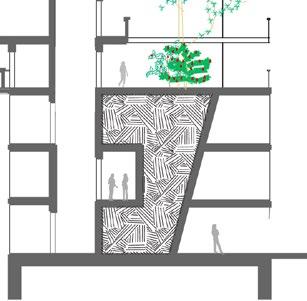
stepping into the landscape
in between thickness within thickness at level vs. below canopy
Previously an asphalt parking lot in the East Boston neighbourhood, this 25 acre site is transformed into a tidal saltwater marsh with buildings and neighbourhood amenities standing on stilts, allowing the surrounding marsh habitat to mature and evolve without impediment and to avoid flood damage, in anticipation of major storm events.

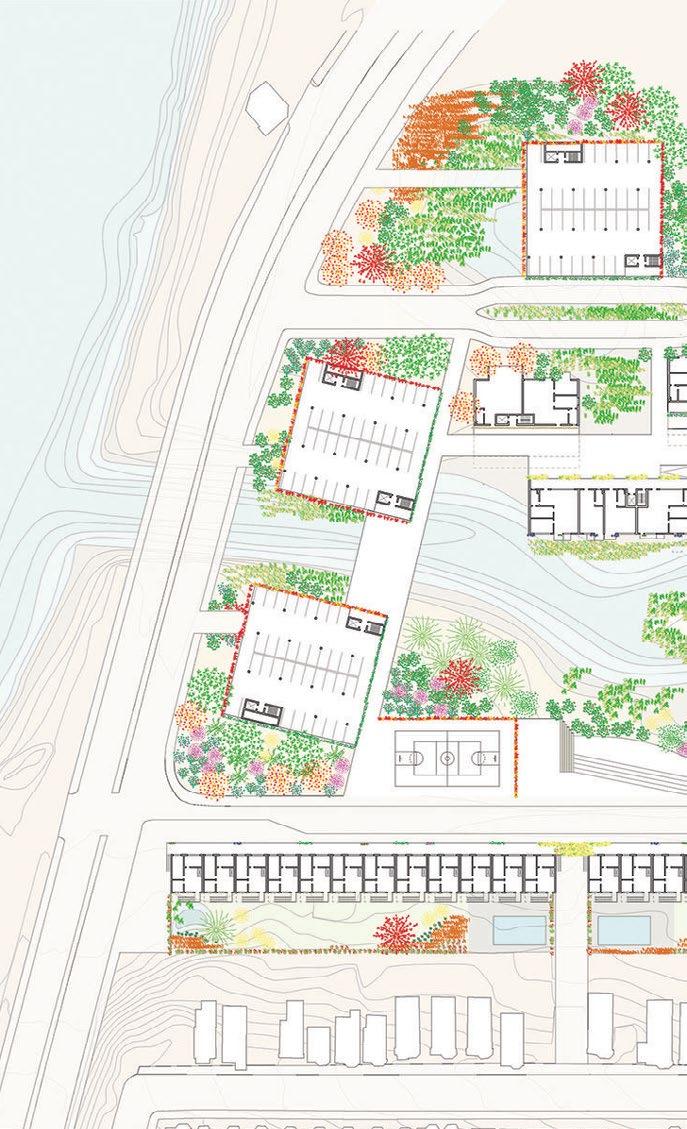
ground plane relationships A-A


