Livestock Production in New Zealand


 EDITED
 BY NATALIA MARTÍN AND NICHOLAS SNEDDON


 EDITED
 BY NATALIA MARTÍN AND NICHOLAS SNEDDON
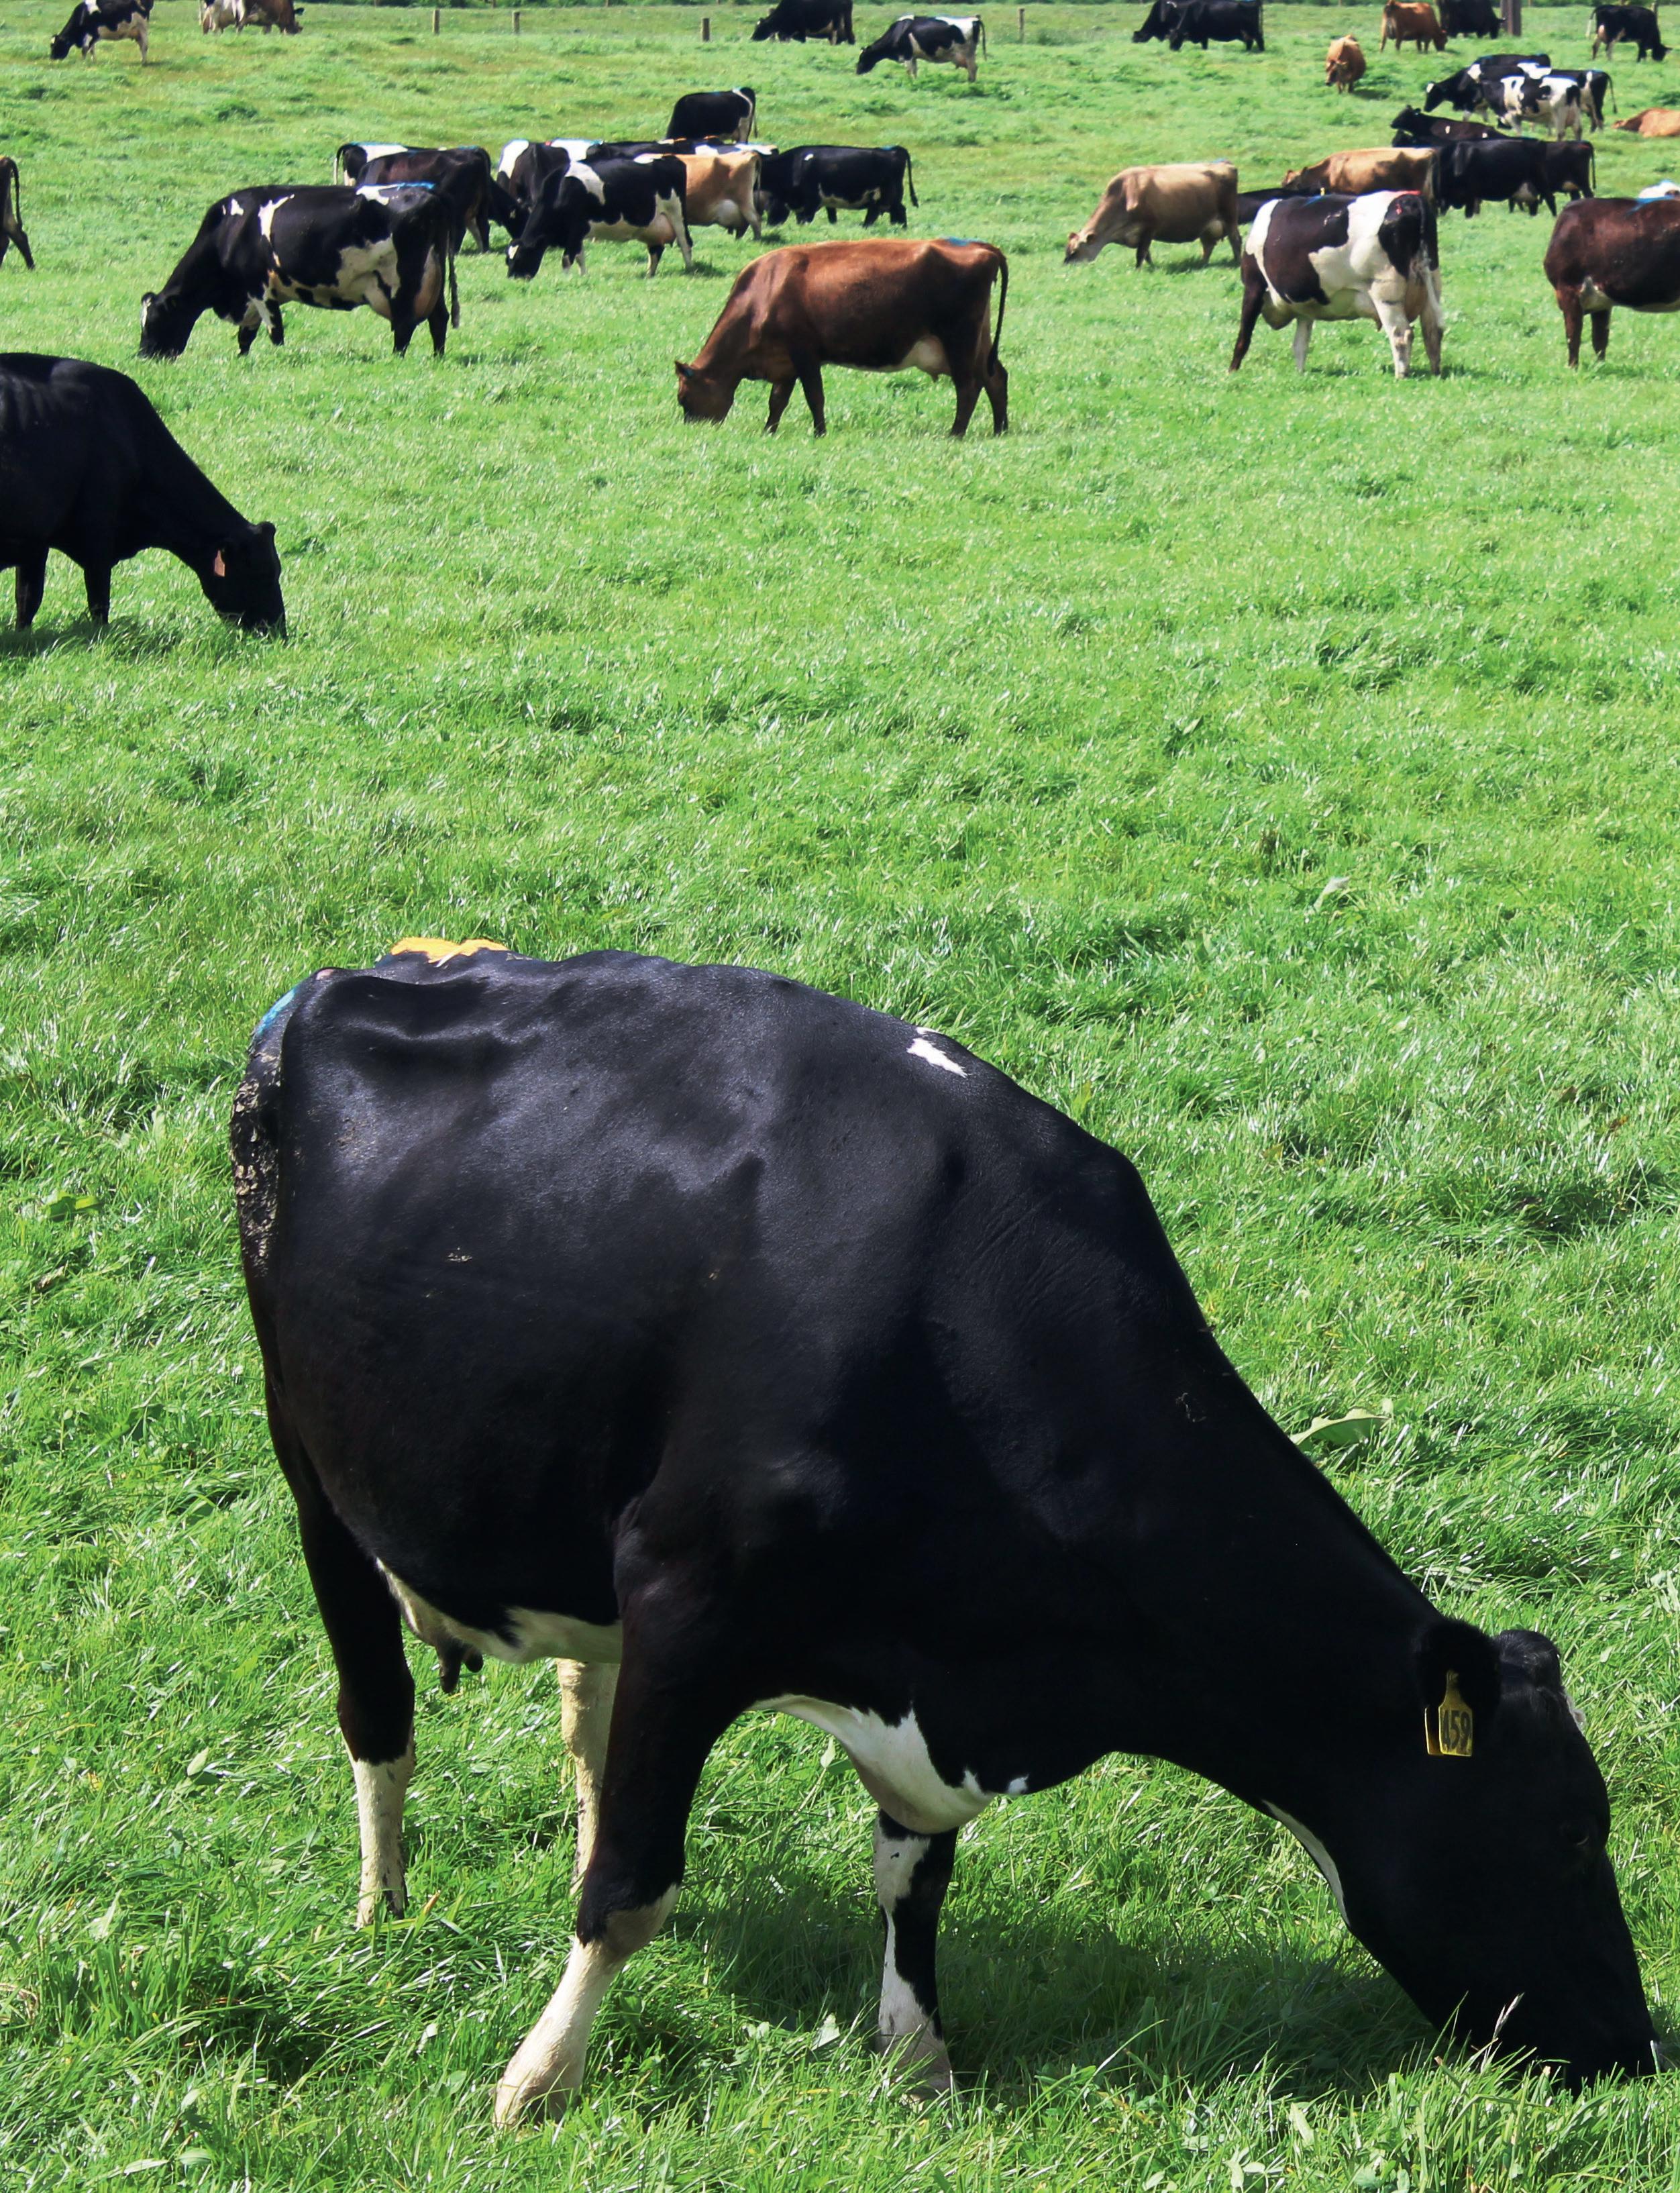
Revised Edition
 EDITED BY NATALIA MARTÍN AND


Humans have long set to alter and control the environment to their benefit. Key among these human-controlled activities is the production of food, which is a necessity of life. Evolutionary speaking, humans are omnivorous, with most people around the globe eating a range of plant and animal-based foodstuffs. Food security is an ongoing concern for many nations because most countries produce some food locally, with international trade relations providing additional food resources. Only a few countries are completely self-sufficient in food production. Even New Zealand imports 50 per cent of the food consumed in the domestic market, although the country’s economy is based on food exports. As such, livestock farming within New Zealand is a major industry providing exportable products and international revenue.
Internationally, New Zealand relies on an image of green pastures grazed by sheep and cattle, next to winding rivers under a picturesque alpine background. This is an attractive image, but ten-
sions between livestock farmers and their critics often surface in the media and commentary. The latter worry about the impact of livestock on the environment, and may also be concerned about animal welfare and the safety of food produced on New Zealand farms.
The growth of dairy farming, particularly in the South Island, has led to concerns about the long-term impact of irrigation on water resources and the negative effects of nutrient run-off from urine, faeces and fertiliser on the quality of surface water in streams and rivers. A growing concern for the welfare of farm animals has led to regular exposés of animal abuse, often involving the pig and poultry industries, but increasingly including the dairy industry. In addition, there is a growing lack of understanding of livestock production among the general population, as is to be expected with reducing rural populations and a concomitant growth in urbanisation. This lack of understanding may lead to poorer communication between urban
and rural communities. A recent illustration of this occurred when some commentators on calf rearing did not appear to understand that to get milk from cows, their calves had to be weaned soon after birth and be fed artificial replacement milk so that the cows’ milk could be taken for human consumption. This is an old practice, obvious to farming folk but not to some of those unfamiliar with dairy farming.
The world has a large and increasing appetite for milk and meat. Global meat production and consumption over the past 50 years has trebled, to 328 million tonnes in 2021. The cost of food to the consumer is an important political issue; in most developed countries, people spend less than 13 per cent of their disposable income on food. The pressure to keep food prices low results in competition at the retail end of the market, and the prices paid to farmers for their produce are often only just above — or even below — the cost of production. The economic pressures on
farmers caused by low prices for their produce are countered in the United States and Europe by subsidies that keep farming viable. In New Zealand, farming is not subsidised and many livestock farmers survive economically by keeping large herds or flocks and using low-input systems to maintain profitability. Today there is little scope for increased livestock numbers in New Zealand; on the contrary, many areas that used to be dedicated to livestock farming have now been planted with exotic trees for carbon farming. Furthermore, more regulations around the environmental impact of farming have come into play over the past decades, including rules on winter grazing, biodiversity and greenhouse gas emissions pricing. Thus, New Zealand has to produce food in an increasingly complex and regulated farming environment.
New Zealand is known internationally both as a tourist destination and as a source of food. The country’s economy depends on these two
industries, of which food production is the more important in terms of export earnings. A significant proportion of export growth in the past decade has been from agriculture. The foods produced for export include milk products, meat (beef, lamb and venison), fruit, wine, honey and some vegetables. Poultry meat, eggs and pig meat are produced for national consumption. Minor livestock products include velvet, goat and sheep milk, and goat meat; horse meat is also exported. A multitude of other livestock products are exported, including wool, hides, tallow and meat meal. However, although New Zealand exports a wealth of livestock products, it also imports a lot of food — about 50 per cent of the food eaten here is imported, including lamb, beef and milk products and more than half of the pig meat consumed by New Zealanders.
Some important factors underpin New Zealand’s position in world meat and milk trade. One is the disease-free status of its livestock. Foot and mouth disease (FMD) and bovine spongiform encephalopathy (BSE, commonly known as mad cow disease) are not present in the country, allowing it to export fresh chilled and frozen beef and lamb to a great number of markets. Nearly all of New Zealand’s cattle and sheep are grass-fed, which has a particular advantage in some markets in the United States and Asia. Meanwhile, there are threats to New Zealand milk and meat exports from other countries. Some South American countries would be able to compete for our lamb and beef markets if they improved their animal health status, and the United States and EU countries compete with us on the international milk market. Moreover, there is the potential for self-inflicted damage to our export markets. Modern communication can quickly disseminate news internationally and, as
a 1080 incident in 2015 showed, it is important to be prepared to counter bad publicity immediately (Brackenridge, 2016). Being ‘clean, green and kind’ is an important marketing strategy for New Zealand food exporters — but it has to be real, as evidence to the contrary will be publicised by special-interest groups and perhaps even our market competitors. Attaining the goal of significantly increasing primary sector exports to NZ$64 billion by 2025 not only requires that care be taken to maintain our reputation (Peterson, 2016), but must also have public support.
This book sets out to provide a basis on which to build an understanding of livestock production systems in New Zealand and an introduction on how animals are farmed commercially in the country. As such, it is a key text for the Massey University degrees in the agricultural and animal sciences areas. It has not been written to defend livestock production, nor to condemn it. Debate about how we manage land, water and animals in this country is ongoing, and this is a healthy aspect of our democracy. This book was written to inform this debate, as debate with knowledge is valuable, while uninformed debate is pointless and probably damaging. The authors of this book are, in general, academic staff of Massey University and actively engaged in research to improve both the performance and impact of livestock farming for a sustainable future.
Brackenridge, J. (2016). Why are we wasting a good crisis? The value shift our primary sector needs. In C. Massey (Ed.), The New Zealand Land and Food Annual, vol. 1 (pp. 27–36). Auckland: Massey University Press.
Petersen, M. (2016). Never say die: The way forward for the New Zealand agrifood sector. In C. Massey (Ed.), The New Zealand Land and Food Annual, vol. 1 (pp. 37–43).
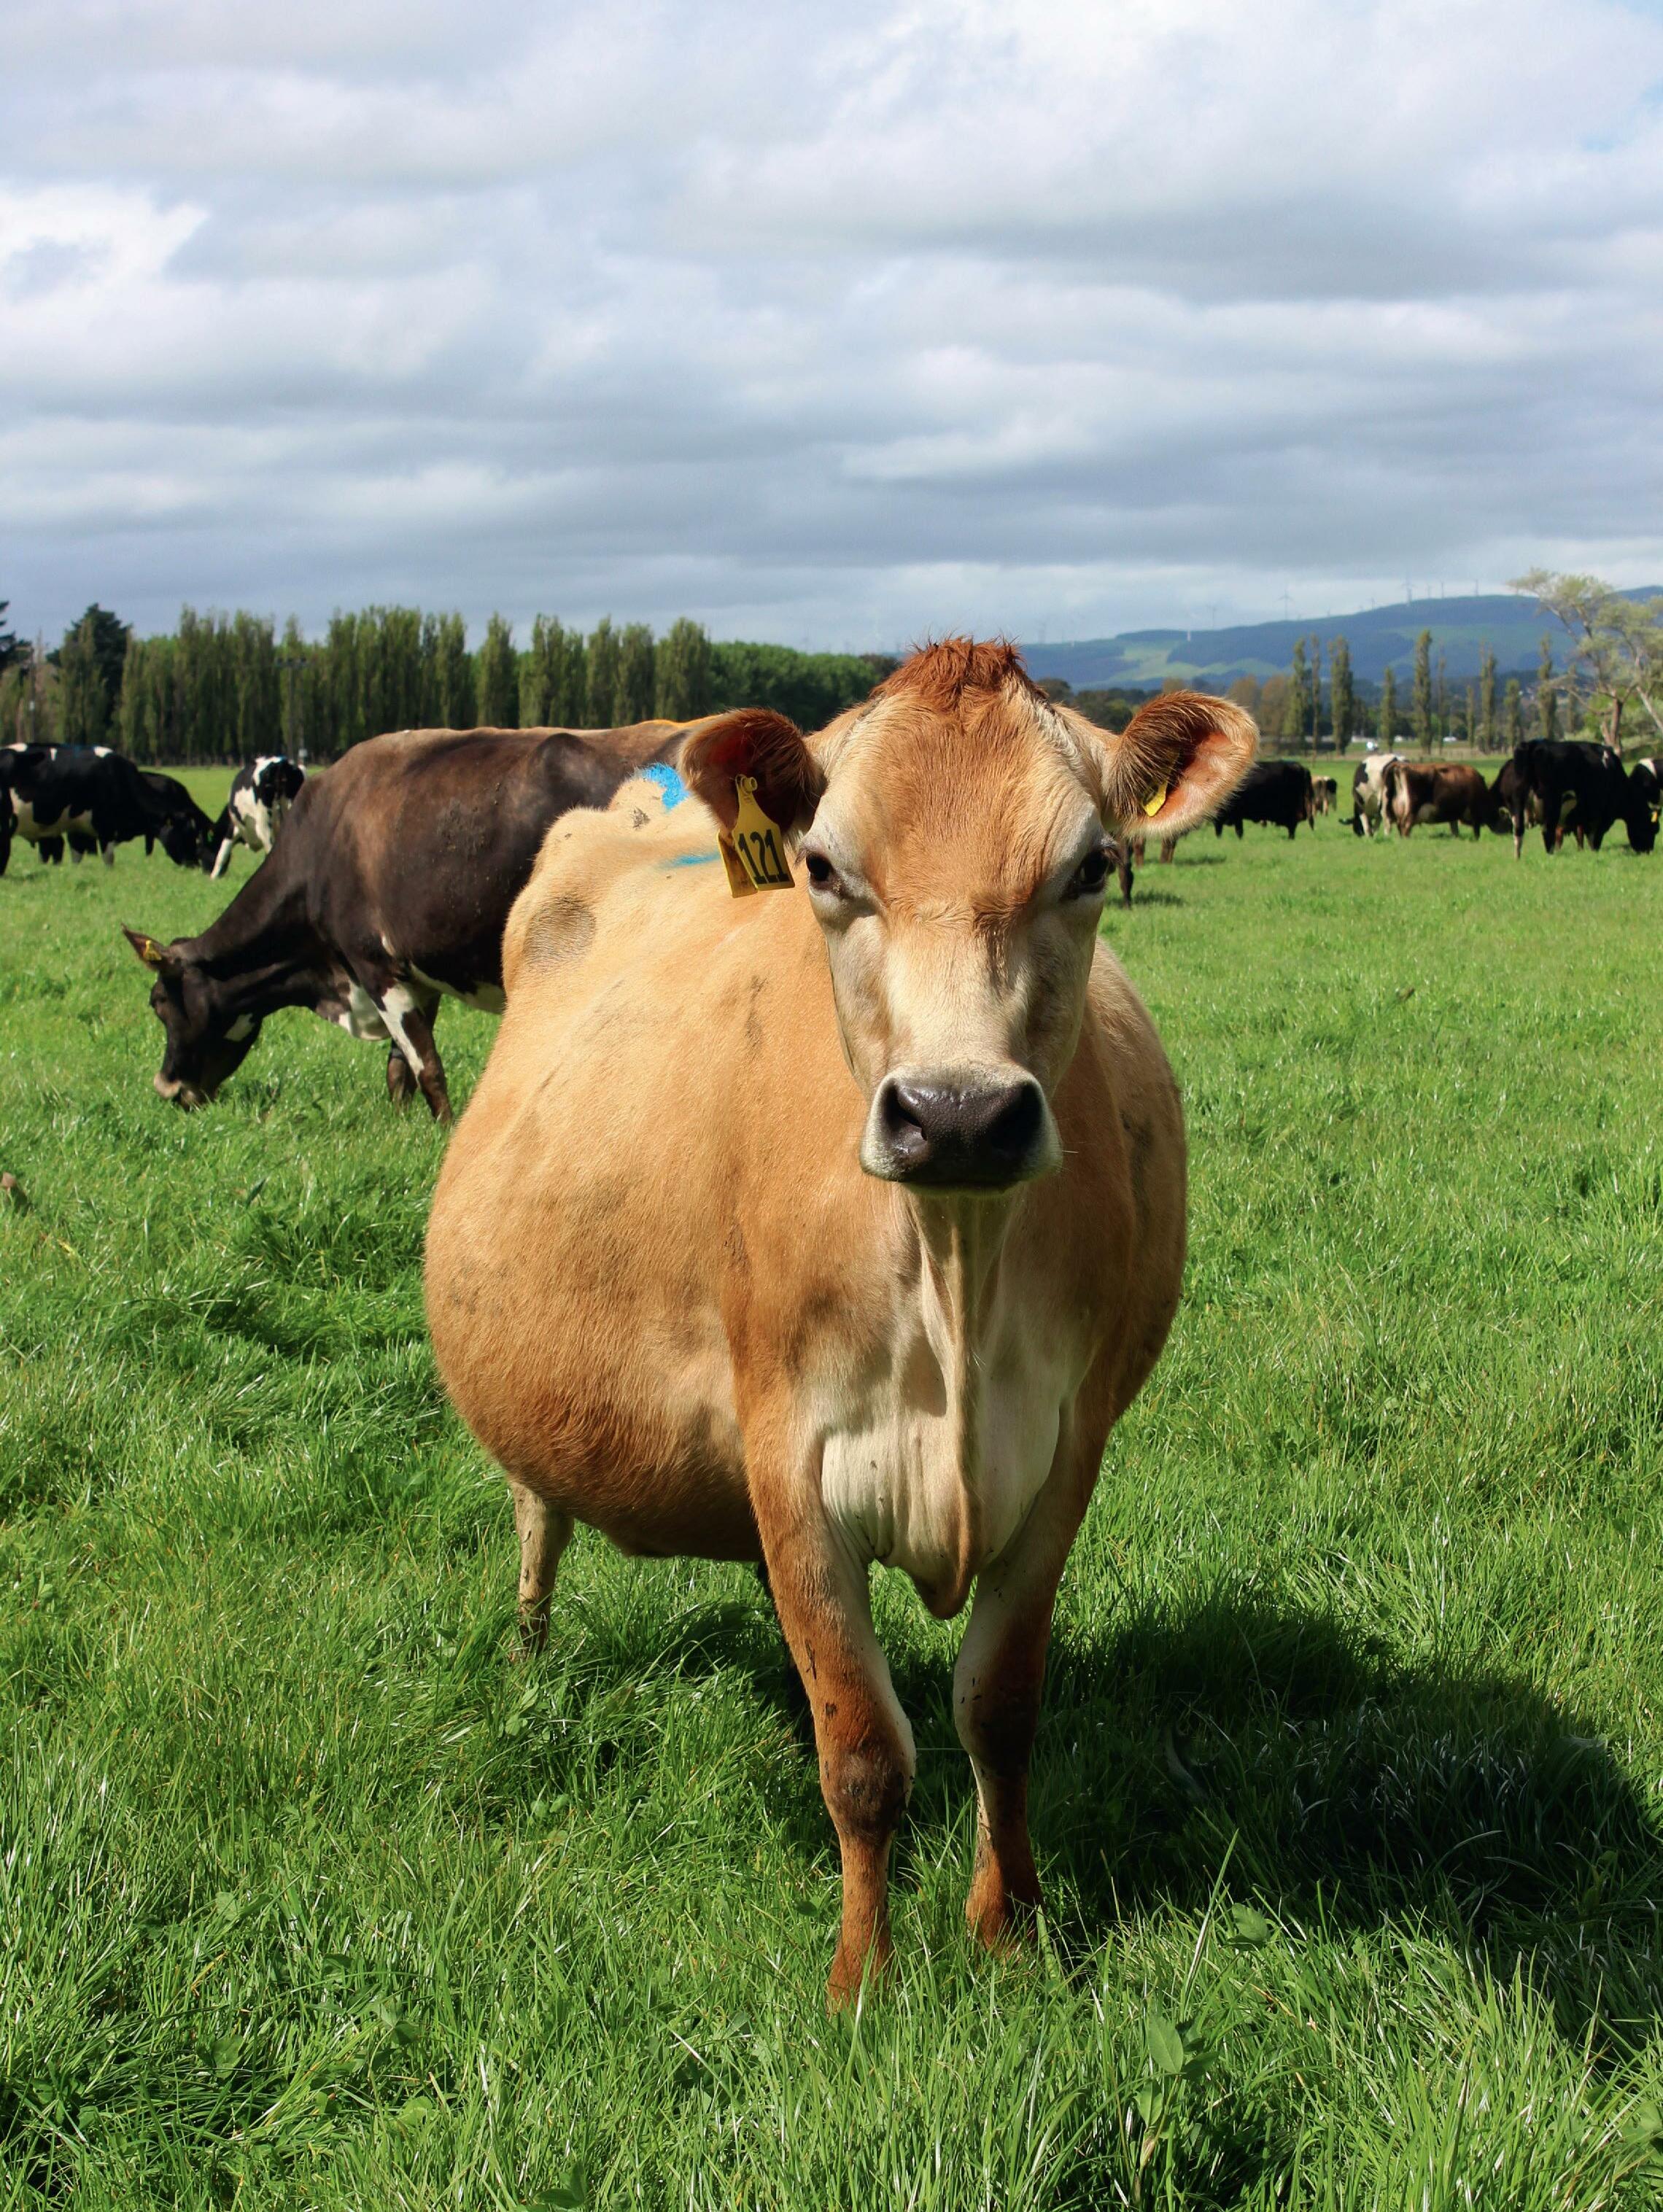


Massey University — Te Kunenga ki Pūrehuroa, Palmerston North
In New Zealand, dairy production is based on the efficient conversion of grazed pasture into milk. Grazing pasture as a main source of feed is one of the biggest differences between New Zealand and the majority of the dairy systems in North America and Europe. The northern hemisphere system is more intensive — cows are typically housed and fed grains, concentrates, food industry by-products and conserved forage (silage), with little or no pasture. While these systems can produce greater milk yields per cow, they are more labour-intensive and have far greater running costs. Conversely, one of the New Zealand industry’s strengths has traditionally been converting low-cost feed (pasture) into product, with a focus on milk production per hectare (Holmes et al., 2007). More recently, however,
the focus has been on increasing milk production per cow through increased supplementary feeding of purchased feeds (such as those used in the northern hemisphere systems). This change has been driven by high milk prices, which make it financially feasible to use more expensive feeds. Increased milk production per cow is also desirable from a sustainability perspective: it is envisaged that in the future more milk will be produced from fewer cows, reducing the environmental footprint of dairy farming. However, importing more feed has increased the costs of production (cost per kg of milksolids produced), which on many farms cannot be supported with the current lower milk prices, and farmers are now focusing again on grazing management.
Shareholders’ Council
35 farmer members (25 wards) Corporate centre (Auckland) NZMP
Collection, manufacturing, ingredients business (production and marketing)
NZ MILK
Global consumer goods, production and marketing
FONTERRA CO-OPERATIVE GROUP LTD
9500 dairy herds (4.1 million cows; 1.44 million ha)
Milk (16,295 million litres)
Collection
Dairy factories
Products (3.01 million tonnes) Brands Anchor, Anlene, Chesdale, Fern, Fernleaf, Mainland, Tararua
The New Zealand dairy industry is an integrated system, encompassing the production, manufacturing and marketing of milk products. It is supported by companies with a focus on improving herd inputs. Genetics and herd recording are carried out by the LIC (Livestock Improvement Corporation) along with research, extension and advice from DairyNZ (Figure 1.1). Historically, the dairy industry was based on a co-operative, farmer-owned structure whereby milk processors focused on maximising finan-
Livestock Improvement (LIC)
Herd testing services
Animal recording (MINDA)
Bull breeding and proving
Artificial breeding (AB) services
Industry statistics
FarmWise consultants
DairyNZ (formerly Dexcel)
On-farm research, development, extension and education Research farms (Hamilton, Hawera, Stratford, Waimate
West, Lincoln University)
Consulting officers
Marketing and Innovation Group (formerly Fonterra Research Centre)
Production and development of products from milk
cial returns to shareholder farmers; companies such as Fonterra and Tatua are co-operatives. Recently, some new corporate companies such as Open Country Dairy and Synlait have been purchasing milk on a contract basis. This has reduced the requirement for farmers to own shares and is starting to change the ownership structure of the industry.
The dairy season in New Zealand is seen as running from June to May each year, with payments to farmers based on kilograms of
milksolids (kg MS); defined as the combined yield of fat and protein in the milk. The payment formula is based on fat yield plus protein yield minus milk volume. There are price penalties for failing to comply with specific quality specifications, for example for high somatic cell count (SCC) or the presence of antibiotics in the milk. Dairy farmers are not paid for all of the milk they produce as they supply it. Prior to the start of each season (late May), a forecasted payout (price per kg MS) is announced; farmers are paid about 65–70 per cent of this forecasted payout during the milking season, until about March. The forecast is revised several times over the season if market signals require it. The final payout is decided the following September; meanwhile, the payments to farmers are finalised over the four months following the end of June. As the forecasted payout is revised over the season, budgets need to be routinely updated.
A new facet of the dairy industry in New Zealand is the recent growth in the goat and sheep dairy sectors. The Dairy Goat Co-op
(www.dgc.co.nz), based in Hamilton, produces nutritional powder products (e.g. infant formulas and milk powder) and long-life milk from goats. Sheep dairying primarily involves cheese production, e.g. Whitestone cheese in Oamaru (www.whitestonecheese.co.nz). There are about 45 boutique cheesemakers in New Zealand, making a range of cow, buffalo, goat and sheep cheeses (New Zealand Specialist Cheesemakers Association, 2016).
New Zealand produces about 3 per cent of total world milk production, approximately 21 billion litres of milk per annum. It is a small producer compared with the USA, which produces 12 per cent of total world production. However, in contrast to most other countries, over 95 per cent of the milk produced in New Zealand is manufactured and exported, meaning that New Zealand accounts for approximately 30 per cent of all internationally traded dairy products. A wide variety of products is manufactured, including butter, cheese, milk powders, infant formulas, casein and protein products (Table 1.1).
In contrast to dairy industries in other countries, the New Zealand industry produces and exports without the support of government subsidies or export incentives. Fonterra sells milk products by auction, this having been introduced to bring transparency to international milk prices and the volumes of product sold. Fonterra was the innovator of this concept, with other international processors now starting to follow their lead.
The development of functional foods, such as low-fat, high-calcium and high-protein milk, has been a growth sector within New Zealand’s dairy industry. Other areas that have been developed include biomedical and health products, such as colostrum-based supplements and hyper-immune milk products. Products for
inclusion in sports drinks have been developed to aid the post-event recovery of athletes.
Currently, Fonterra collects around 79 per cent of the raw cows’ milk produced in New Zealand and is the major dairy processor. The co-operative exports milk products to 130 countries, with increasing amounts going to ‘developing’ countries. Fonterra is the world’s largest exporter of dairy products. Of the milk produced, 97 per cent is processed into product, with the remainder supplying the local liquid milk market and producers of other fresh dairy products for local consumption. Dairy exports were worth around NZ$21.6 billion in 2021–22 (around 8.1 per cent of GDP) to the New Zealand economy (Ministry for Primary Industries, 2022).
DairyNZ: the industry organisation that represents New Zealand dairy farmers. It is funded by farmers through a levy payment, currently 3.6 cents for every kilogram of milksolids supplied to a milk processor. The purpose of DairyNZ is to ‘secure and enhance the profitability, sustainability and competitiveness of New Zealand dairy farming’. Its activities include research, extension through consulting officers and the development of resources for farmers. For more information see: www. dairynz.co.nz.
Dry cow: a non-lactating cow.
Fonterra: the largest dairy processor in New Zealand. It is a co-operative that is owned by around 9500 dairy farmers, and a global business. Fonterra processes 19 billion litres of milk a year worldwide; 17 billion litres are produced in New Zealand, with the remainder produced by local suppliers in Australia, Chile, Brazil, Sri Lanka and North America.
Heifer: this term is used by farmers in a variety of ways. It may describe a young female cow that has not produced a calf or has had one calf, whereas heifer calves are calves aged from 0 to 9 months, and are then commonly referred to as R1s, meaning rising (nearly) one-year-old. They are referred to as R2 heifers after about 18 months of age. R2s that have calved are commonly called heifers for their first lactation.
LIC (Livestock Improvement Corporation): this organisation became a user-owned co-operative in 2002. Its activities include the provision of
genetics, information and advice for dairy herd improvement. Services provided to farmers include herd testing, herd recording and artificial breeding, DNA analysis, research to improve farm profitability, farm automation, farm advisory services and statistical information relating to the New Zealand dairy industry. For further information see: www.lic.co.nz.
Milk solids: milk is 87 per cent water; the solids are what is left after the water is removed, i.e. fat, protein, lactose (sugar), vitamins and minerals. The milksolids (MS) measurement that is used to determine the payout to farmers is different, comprising just fat plus protein.
Oestrus: the sexualy receptive period of the sexual cycle.
Payout: the financial payment received by dairy farmers for milk supplied, based on kilograms of milksolids (kg MS).
Ruminant stomach: cows’ stomachs are composed of four compartments — the reticulum, rumen, omasum and abomasum.
SCC (somatic cell count): this measures the number of somatic cells that are present in milk. The SCC increases rapidly when cows have an infection, and is thus used to measure milk quality.
Season: a dairy farming season or year runs from 1 June to 31 May, and events occur regularly at the same time every year.
The first cows were imported to New Zealand in 1815 by the Reverend Samuel Marsden, when Shorthorn cattle (a dual-purpose breed, used to produce both milk and meat) were shipped from Sydney to Russell, in the Bay of Islands. During the next 30 years increasing numbers were imported, so that by the 1840s small amounts of butter and cheese, mainly from Shorthorn cows, were being exported to Australia. In 1848, Ayrshire cattle were imported by Scottish settlers in Otago; and in 1862, one Jersey bull and two Jersey cows were imported to Whanganui. The first Friesian cattle were imported from the Netherlands in 1884 (Holmes et al., 2007). In this way, the parent breeds of the modern national herd were established early in the industry’s development.
Dairy companies in New Zealand have traditionally always had a co-operative structure, where the farmers who supply the milk are also the company’s shareholders and owners. The Otago Peninsula Co-operative Cheese Factory Co. Ltd was the first commercial dairy company, established in 1871. Exporting was a challenge initially, as products were carried by sea, but by 1882 refrigeration had been developed. By 1895, 218 dairy factories were in operation, and refrigeration had allowed new products such as condensed milk, casein and lactose to be added to the main products of butter and cheese.
The quality of the milk and dairy products became the focus. Following the development of a test for measuring the concentration of milk fat, a payment system based on the quantity of milk fat supplied was devised in the 1920s, when the number of dairy companies and factories
reached its maximum with about 540 companies operating (Holmes et al., 2007).
Mechanical machine milking started in 1918; this enabled farmers to milk more cows, so herd sizes started to increase. The number of herds increased until 1920 and then decreased again, although the total number of cows and the number of cows per herd have both continued to increase since then. Milk yield per cow has also continued to increase with improved genetics, pastures and feeding. Seasonal fluctuations are evident due to the impact of factors that cannot be controlled, such as bad weather. These include droughts in summer or cold, wet springs, which can limit pasture supply and hence the amount of milksolids produced.
The breed composition of the national herd has changed over time. In the 1890s the majority of cows were Shorthorns; however, due to a focus on producing milk fat, the number of Shorthorns then decreased while Jersey numbers increased rapidly, so that by the 1960s Jerseys were the dominant breed. After 1965 the number of Friesian cows increased rapidly, dominating breed proportions due to calves being in demand for bull beef production.
Until the 1990s the production of milk fat had been the focus of measurement, payment and genetic selection; then routine measurement of the protein concentration in milk resulted in a change in the payment system. The concentrations of both fat and protein are now measured, and yields calculated and combined. The combined yield is expressed as ‘milksolids’. Another major change resulted from the development and introduction of artificial breeding
(AB) in the 1950s. This allowed the genes from high-producing animals to be spread faster and wider in the national herd. More recently there has been a focus on crossbreeding, which has led to Holstein Friesian x Jersey crossbred cows (known as KiwiCross cows) becoming the dominant breed (LIC & DairyNZ, 2022).
The Dairy Board, which was responsible for marketing and selling all milk products, was established in 1923. It existed in several forms until 2001, when the two largest dairy companies (New Zealand Dairy Group and Kiwi Co-operative Dairies) merged with the New Zealand Dairy Board to form the Fonterra Co-operative Group Ltd.
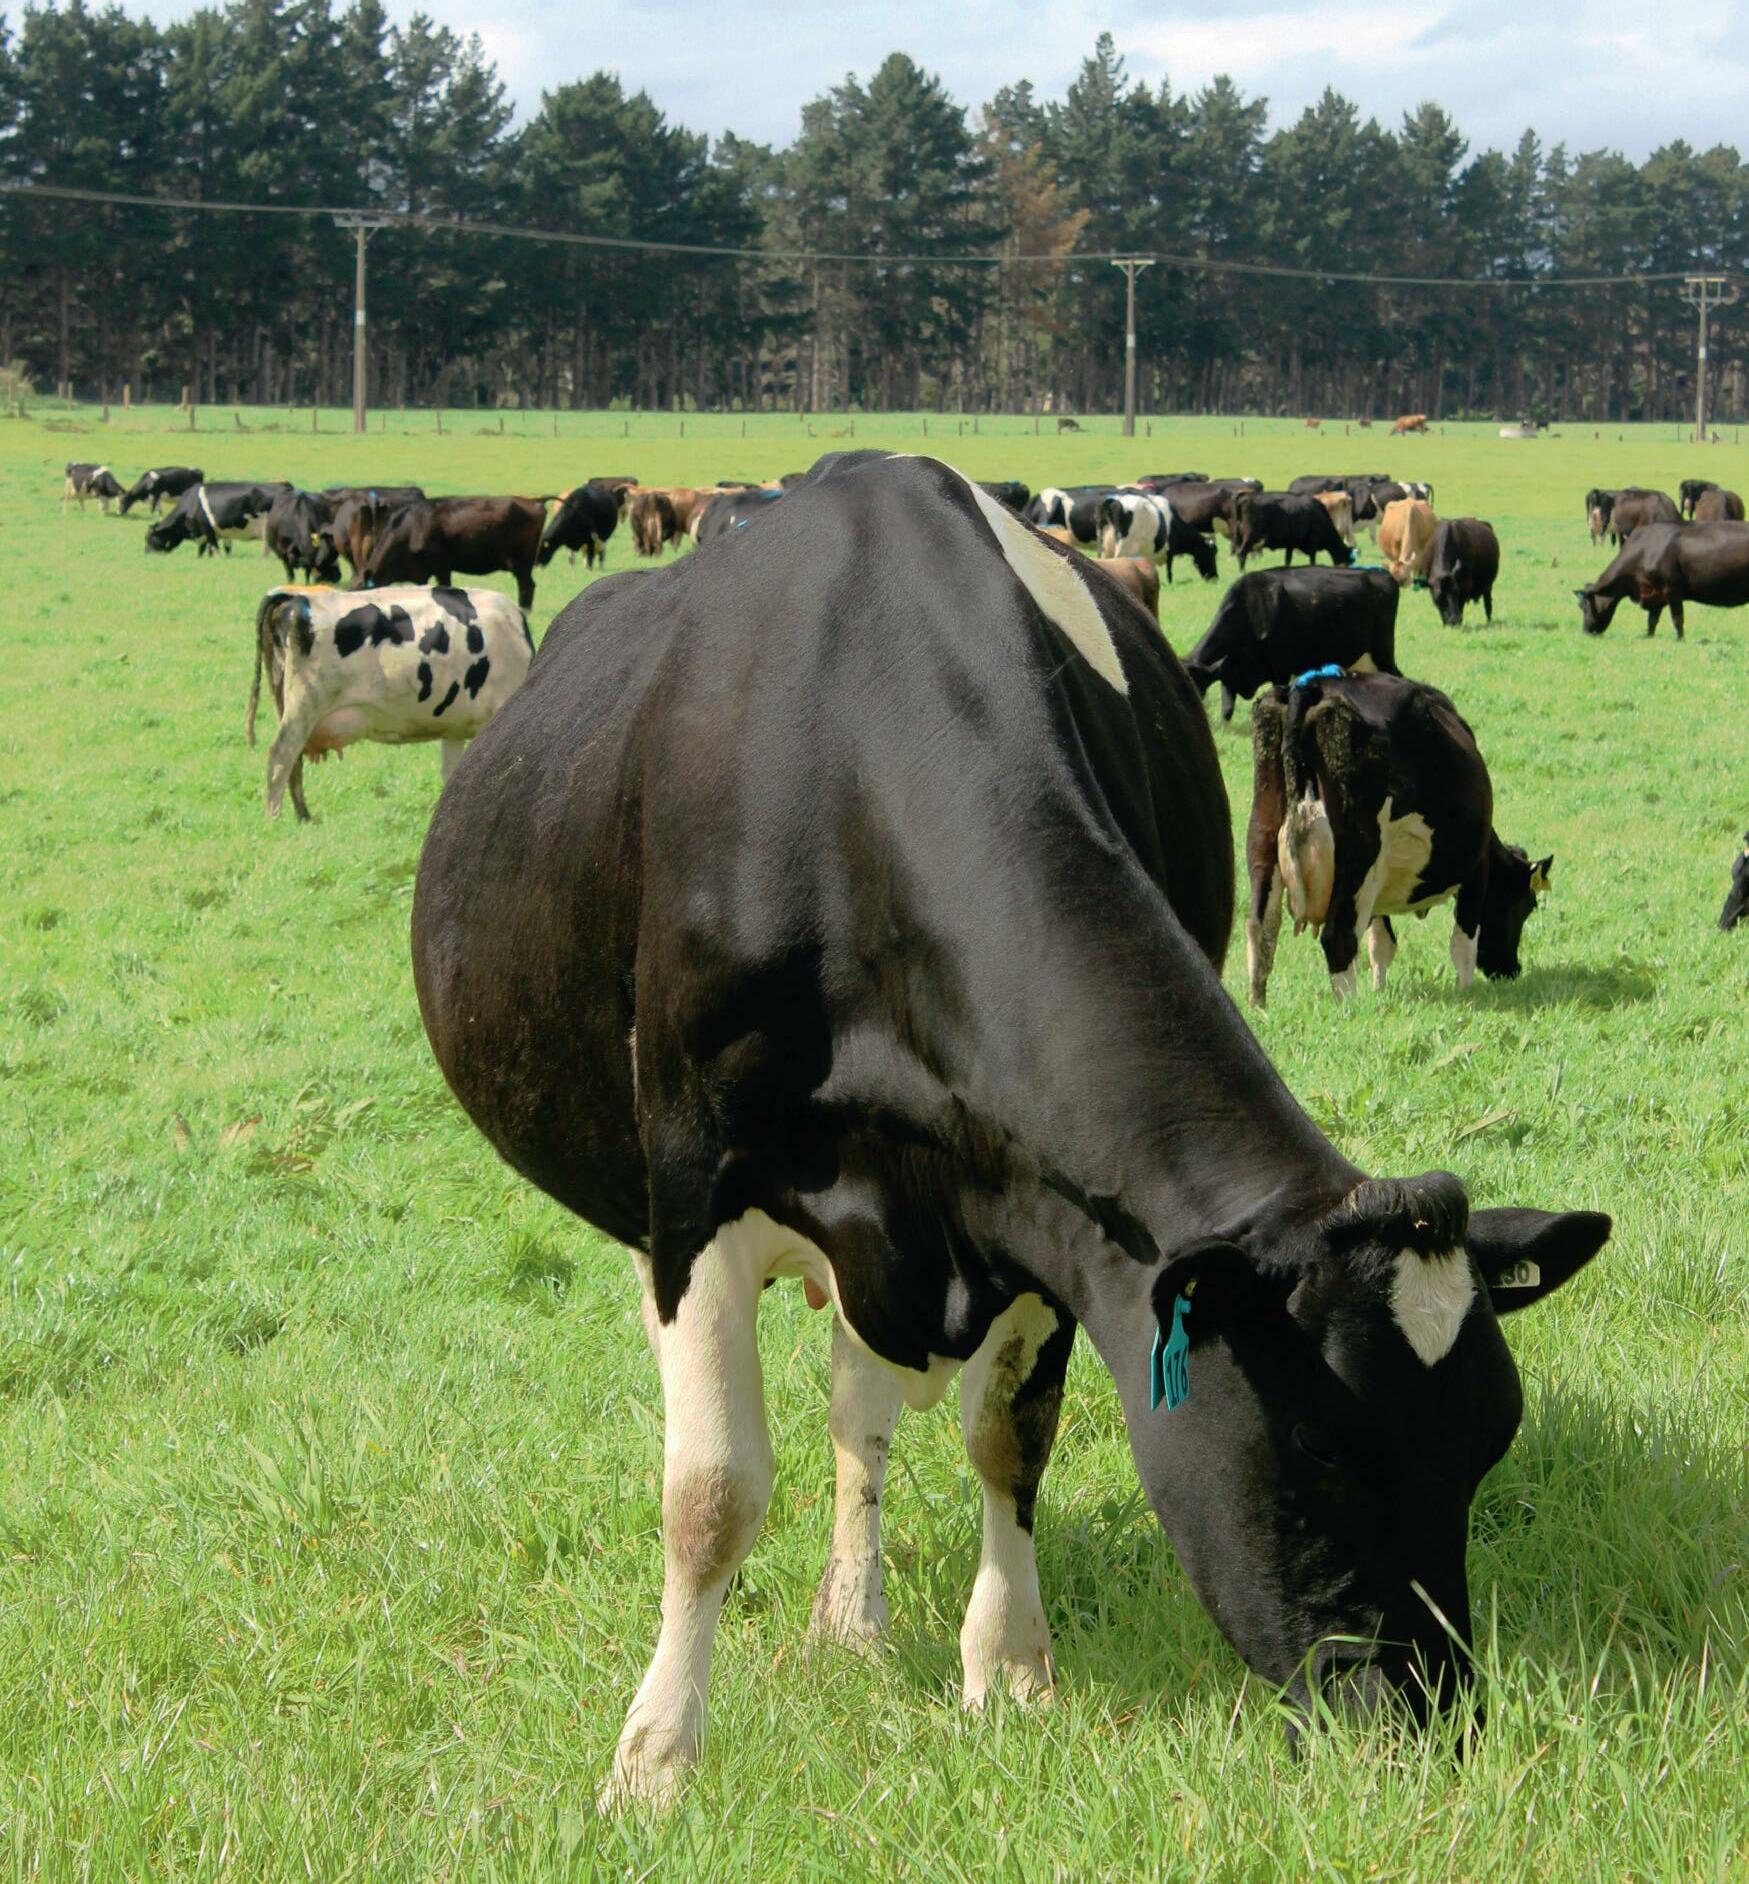
Most cows do not lactate (produce milk) all year; the average lactation length, or days in milk, for cows in New Zealand is around 270 days. Lactation length is influenced by management and cow factors that include the age of the cow, its health status, the level of feeding (quality and quantity), milking frequency and calving date. The main factors affecting productivity on a dairy farm can be seen in Figure 1.2.
The challenge for farmers is to match feed supply with feed demand. Feed supply can be classified as the amount of pasture and other feed sources available to feed animals on farm. Feed demand is the animals’ own requirements for feed. Demand is the sum of the energy required for maintenance of body function and for growth, pregnancy and lactation; the amount of energy for these processes differs depending
FEED FACTORS
COW AND HEIFER FACTORS
• Climate
• Soils and fertilisers
• Cultivars
• Management of pastures and crops
Pasture and crops grown per ha
• Stocking rate
• Management of deficits and surpluses
• Conservation of surpluses
Pasture not eaten per ha
Total pasture and crop DM eaten per ha by cows
Plus imported supplements eaten by cows (tDM per ha)
TOTAL FEED EATEN PER HA (tDM per ha)
• Feeding
• Genetic merit, age, health
• Reasons for culling
• Replacement rate and genetic merit of heifers
• Milking; mastitis and milk quality
Average milk yield per day of lactation
• Fertility and management of mating
• Dates of calving (start, median, end)
• Dates of dry-off (mean)
Days in milk (mean calving date to dry-off date)
Milk yield per cow (kg MS per cow)
Feed required per cow (tDM per cow)
FEED CONVERSION EFFICIENCY (kg MS produced)
MILK PRODUCED PER HA (kg MS per ha)
on farm, such as cereal grains and blends. Palm kernel expeller (PKE), a by-product of palm oil production, is imported from Indonesia and Malaysia specifically as cow feed.
The challenge of matching feed supply with feed demand means that lactation lengths are shorter in pasture-based systems than the housed systems of the northern hemisphere, unless large amounts of supplementary feed are incorporated into the system.
DM = dry matter; MS = milksolids (fat + protein).
(2010).
on age, liveweight and stage of the season, i.e. whether a cow is lactating or not, and what stage of lactation she is at (Table 1.2). Detailed information on how this can be calculated can be found in Rattray et al. (2007).
In most areas of New Zealand, the basic diet for dairy animals is pasture that usually comprises ryegrass and white clover species. Some areas, such as Northland, use subtropical kikuyu pasture, which better tolerates the climate in that area. In periods when pasture growth exceeds animal demand, pasture is conserved as hay and silage and fed in times of feed deficit (summer, winter).
Different forages and crops can also be grown to provide extra feed for times when pasture does not grow well, such as dry summer months and colder winter months. These crops include pastoral herbs such as chicory and plantain, legumes such as red clover and lucerne, brassica crops such as turnips and kale, fodder beet, and cereal crops such as winter oats. Maize is grown either to make maize silage or to be fed as greenfeed maize, which can be grazed.
These crops not only provide more feed (quantity), but also provide feed of greater quality. Extra feed can also be purchased and bought
The recent high milk prices resulted in many farmers building concrete feed pads and winter housing barns to supply cows with extra feed during lactation and to extend lactation into winter. While this increased feeding increases milk production, it also increases costs. With lower milk prices, less supplemental feed is supplied in this way and stocking rates are reduced on many farms.
Following the recent change in feeding systems with increasing amounts of supplements being imported on to farms, DairyNZ has described five production systems so that farmers can compare their farm’s performance with others using a similar system. These definitions are based primarily on when imported feed is fed to dry stock or lactating cows during the season. It also includes off-farm dry cow grazing, but does not include grazing or feed for young stock.
• System 1: all grass, self-contained, all stock on farm (traditional system). No feed is imported on to the farm, and no supplement is fed to the herd except for that harvested on farm (grass or maize silage). Dry cows are not grazed off.
• System 2: approximately 4–14 per cent of total feed is imported, either as supplement or in the form of dry cow grazing off farm.
• System 3: approximately 10–20 per cent of
total feed is imported to extend lactation in autumn and for dry cows. Farms feeding 1–2 kg of meal or grain per cow per day for most of the season best fit into this system. The highest proportion of farms in New Zealand operate under this system.
• System 4: approximately 20–30 per cent of total feed is imported and used at both ends of lactation and for dry cows.
• System 5: approximately 25–40 per cent of total feed is imported and used throughout lactation and for dry cows. This system also includes farms where more than 40 per cent of cow diet is sourced from off farm.
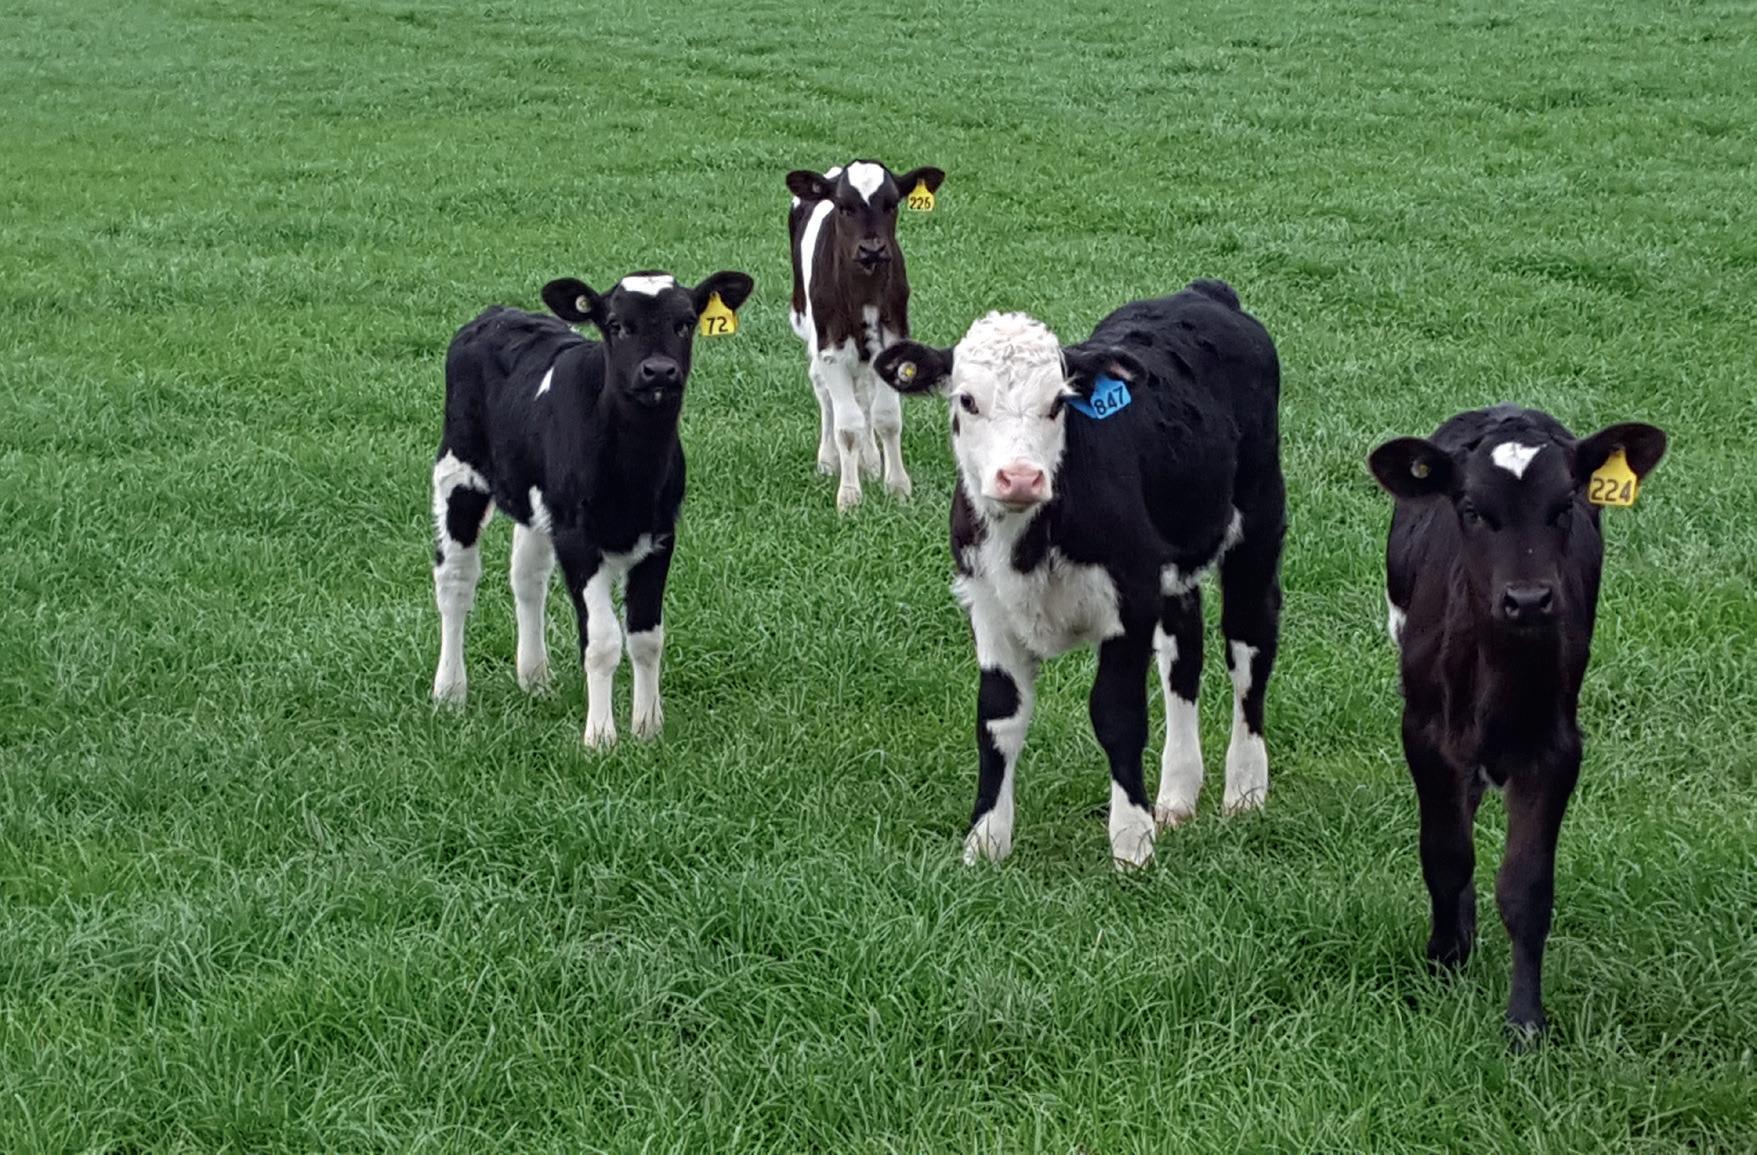
Pasture growth is much greater in spring than in winter, and the majority of herds in New Zealand
calve in late winter/early spring (July to September) to produce milk during spring, summer and autumn. This enables herd feed requirements to be matched with pasture growth rates. It is important for seasonal milk production to maintain a 365-day calving interval, so cows must become pregnant again between October and December to ensure that they will calve again in the following July to September. The gestation period of cows is about nine months.
Following spring calving, milk production declines slowly over summer and autumn, and cows are dried off once milk yield drops to around 5–6 litres per day or the next calving date is approaching. Drying off means that farmers stop milking the cows and over the next few days they stop lactating. This happens in late summer/ autumn (March to May), and depends on pasture growth, milk yield and other factors (body con-
dition, days to next calving). All spring-calving cows are dried off before winter so that their dry period (when they don’t produce milk and their feed requirements are lowest) coincides with the period when pasture growth is lowest.
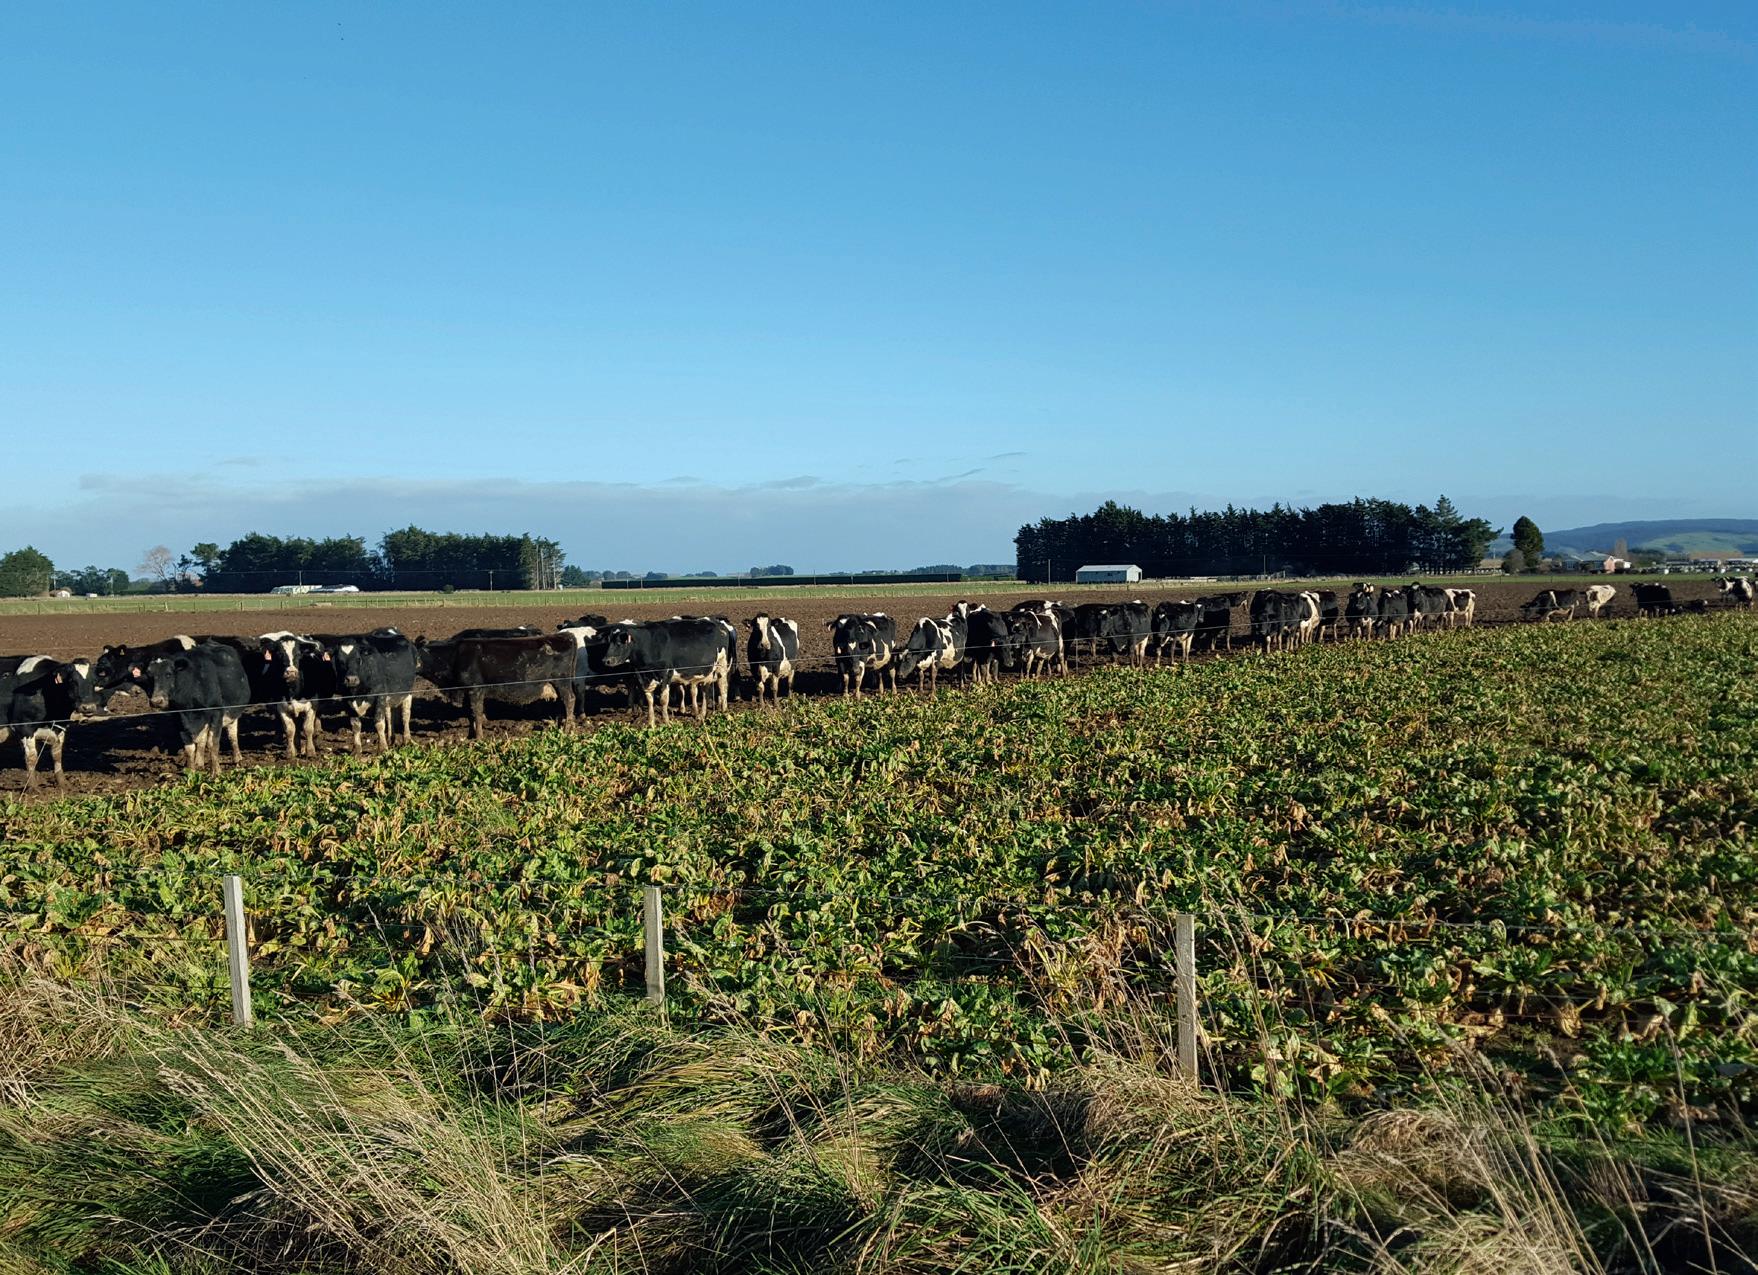
In New Zealand, unlike Europe or North America, the majority of cows remain outside throughout the year. They graze and spread dung and urine. These two features of farming make for a cheaper farming system, as feeding indoors and managing cow excrement and urine add large costs in terms of housing, machinery, labour and feed costs in more intensive systems. However, the situation is starting to change; dairying has moved into areas such as Southland that have heavy soils with a high waterholding capacity and a more difficult climate in the winter for farming cows. Housing is being introduced there, particularly during the winter
months, as having the animals off wet, muddy paddocks is good not only for pasture protection and animal welfare but also for managing effluent and run-off into surface water. Housing must be well constructed, with sufficient room for the number of animals housed, stalls (cubicles) of the correct depth to allow cows to lie down comfortably and suitable access to food and water.
A portion of the national herd calves in autumn so as to be milked during winter to supply fresh milk and associated products to the domestic market. These farms have a ‘winter milk contract’ with their dairy company, which specifies that a certain volume of milk must be supplied daily during a specific period (e.g. May to July).
Dairy companies use winter milk contracts to make better use of their plant and to ensure

continual supply of product. Farmers with a winter milk contract receive a premium price for milk supplied during the contract period.
To supply milk during winter, cows calve in March and April (autumn) and are mated in June to July (winter). They are dried off in December or January (summer). On most farms with a winter contract there will be two herds, an autumn-calving herd and a spring-calving herd. The spring herd calves ‘as normal’ in spring, and these farms therefore supply milk for 365 days a year. In some regions, for example parts of Northland, that have warm winters and dry summers, some herds calve entirely in autumn and produce winter milk only, to avoid trying to milk through the very dry summers experienced in those regions.
For cows to keep producing milk, the milk has to be removed either by a calf or through milking. Over the past century, cows have been selected to perform well when being milked twice daily. Once-a-day (OAD) milking was used as a shortterm strategy to overcome feed shortages such as those experienced during a dry summer, or in adverse weather conditions such as floods. More recently, however, some farmers have started milking OAD for the whole season. This system can be of benefit in many situations, such as long, thin farms or those with steep hills where the cows are walking significant distances. On some farms it is possible to milk an increased number of cows by having two herds, one that is milked in the morning and the other in the afternoon, enabling an increase in herd size without having to invest money in building a new milking shed.
By reducing milking to OAD, a lower milk
yield is expected. While this indeed happens to some cows, others are not greatly affected. Selection for cows that tolerate the reduced milking frequency has led to farmers whose herds have been milked under this system for an extended period of time reporting little effect on overall milk production (Mikkelsen, 2012). However, achieving this result takes three to four seasons and farmers must be in a financial position that enables them to cope with reduced milk income during that time. Management of mastitis (infection of the udder) also needs to be a top priority with cows that are only being monitored OAD at milking. However, established OAD herds usually have lower SCCs and no increase in clinical mastitis cases. Cows with high SCCs or that have had recurring cases of mastitis should be culled before starting OAD milking.
There are also beneficial effects in terms of reproduction and the incidence of lameness. With a reduced milking frequency, cows are better able to maintain their body condition; this results in being able to identify cows that are cycling more easily, and in better conception rates and six-week in-calf rates. Improved reproduction has resulted in farmers having greater numbers of heifer calves to choose replacements from (Mikkelson, 2012). The surplus heifers are often reared and then sold, which creates a new income stream; hence, farm profitability may not be significantly reduced. Other advantages can be a requirement for fewer staff or lower staff turnover, and a better lifestyle. Less time spent milking cows means that farmers can be more involved in family, community and industry events.
The seasonal, pasture-grazed system is possible in New Zealand due to the physical and temperate
climatic conditions that allow pasture production to continue all year round in many regions. The main dairy areas in the North Island are capable of growing at least 10 tonnes of dry matter per hectare (tDM/ha) per year — this requires at least 1000 millimetres of rain per annum and an altitude of up to 400 metres above sea level. In drier areas, grass production can reach 20–22 tDM/ha if irrigation is used. Pasture production is affected most strongly by climate and soil fertility, and ranges between 8 and 16 tDM/ha annually in the main dairy areas (see Table 1.3).
Pasture quality can be maintained by having pasture and clover in a leafy state, which supplies around 10–12 megajoules of metabolisable energy per kilogram of dry matter (MJ ME/kg DM) and 15–30 per cent crude protein. Older pasture with a high proportion of old leaves and stems results in a lower feeding value, around 6.5 MJ ME/kg DM. The differences in pasture production between areas is one of the main causes of differences
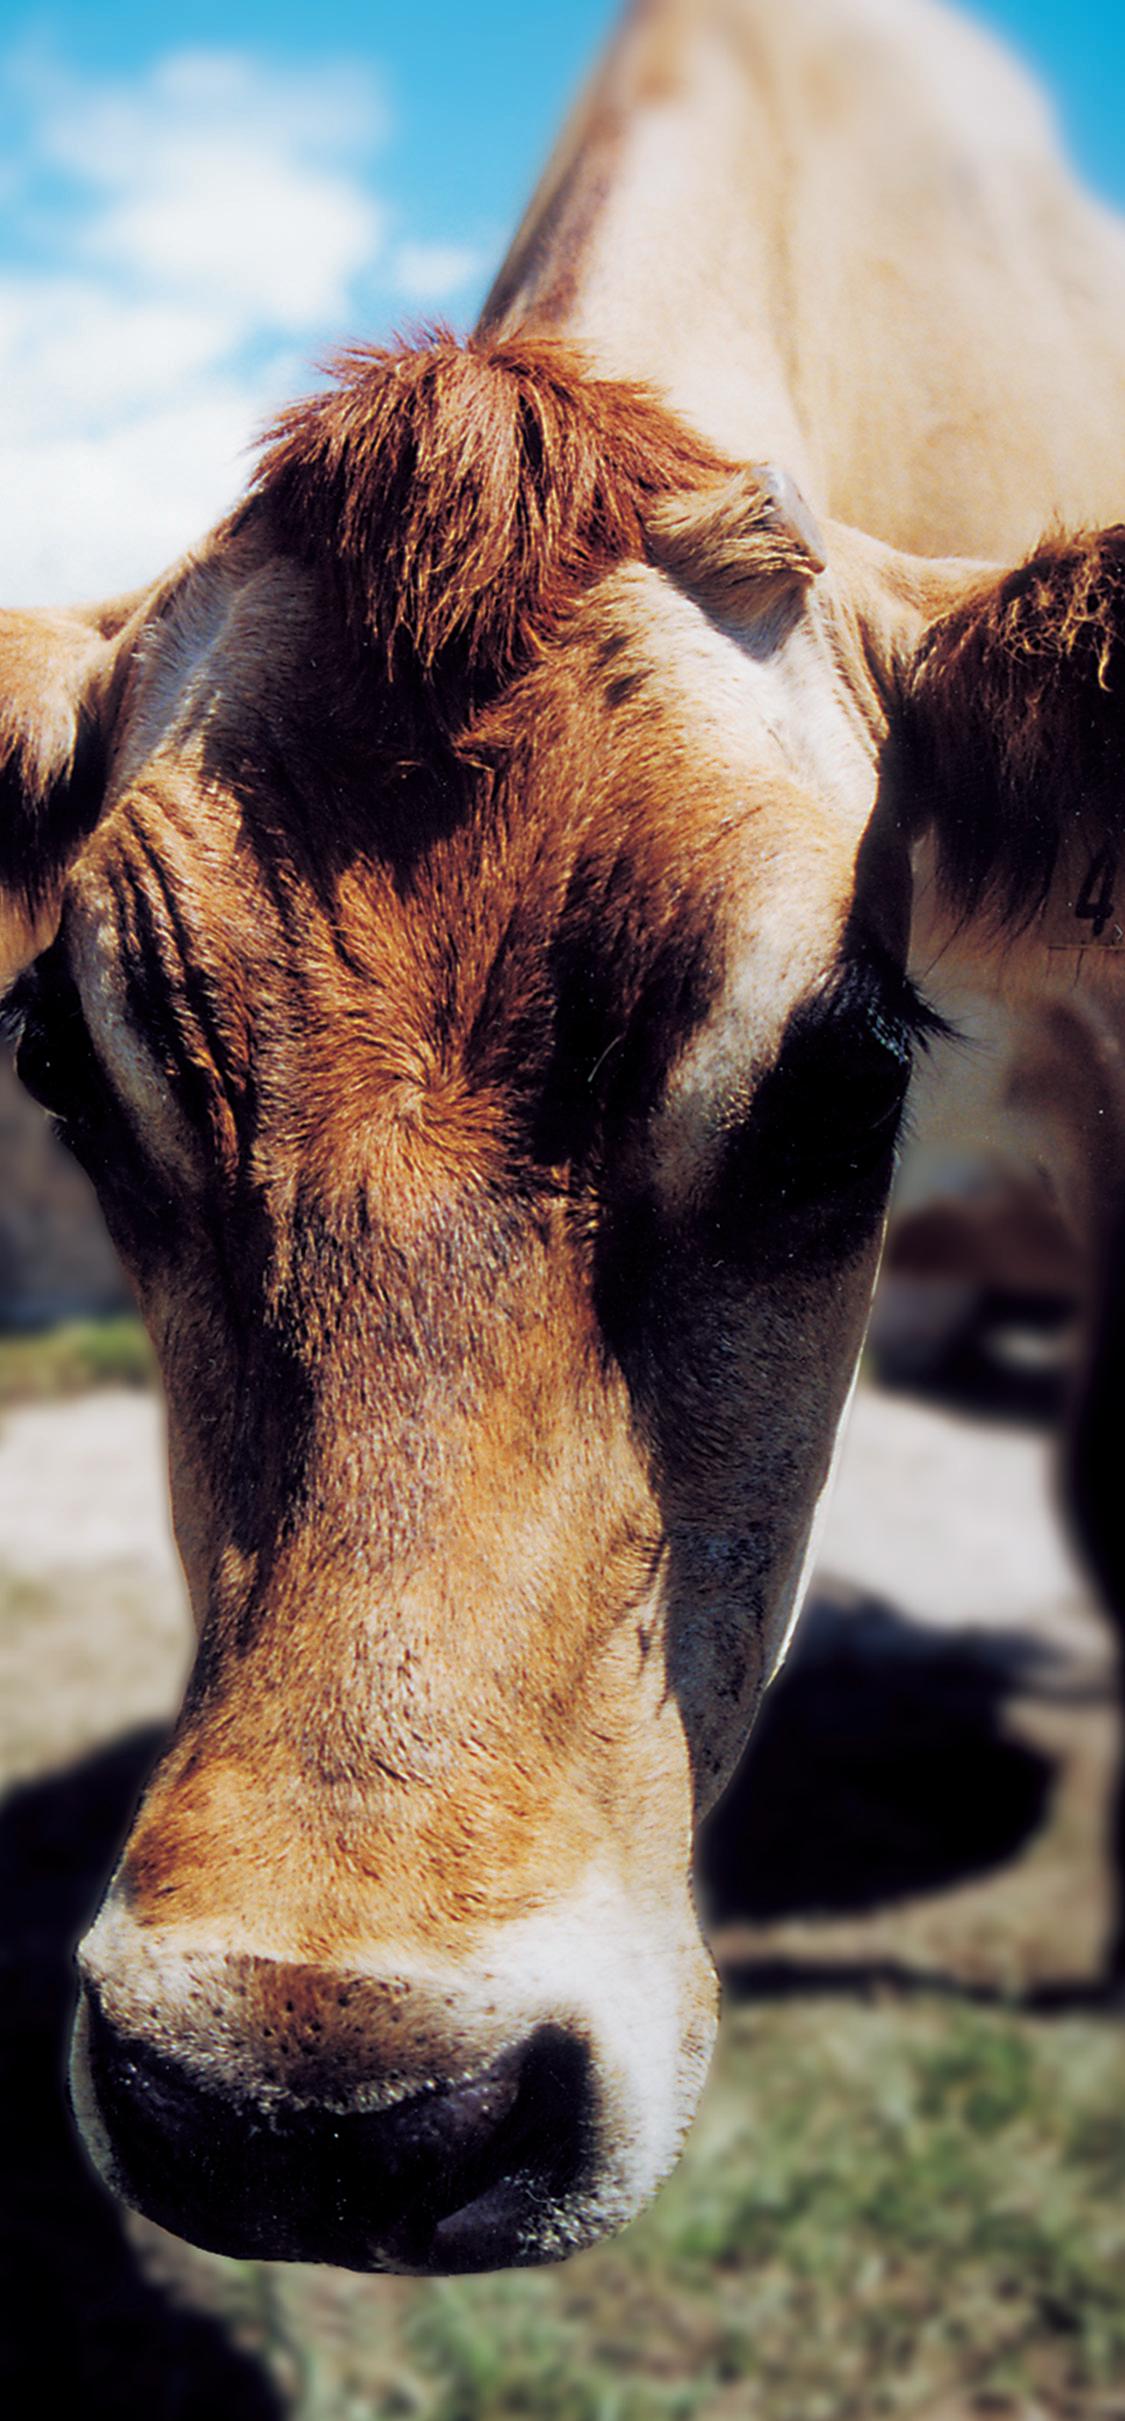
in milksolids production (Table 1.4); however, the use of irrigation and of greater amounts of bought-in feed now play a large part in milksolids production. The amount of pasture grown, and how effectively it is harvested and converted into milk by cows (utilisation), is influenced by many management factors, such as stocking rate, calving and dry-off dates, fertiliser use, intensity of grazing patterns, drainage and fencing (Holmes et al., 2007).
The stocking rate is expressed as the number of adult cows being grazed per hectare. Stocking rates are important as they determine the amount of pasture that is eaten by cows. High stocking rates utilise virtually all spring pasture growth but cause a deficit in available pasture in summer. This then requires the feeding of supplements and/or earlier drying off to prevent cows losing body condition and becoming thin. In contrast, low stocking rates can result in pasture being wasted in spring if it is not eaten, and in loss of pasture quality. Farmers must determine the optimum stocking rate for their farm by balancing all of these factors.
In spring-calving systems, the choice of calving date, the date the herd starts calving, depends on pasture growth rates in late winter/ early spring, the availability of other feeds (e.g. silage), the use of nitrogen (N) fertiliser and the stocking rate. Calving dates vary between regions (see Table 1.5). Dry-off date is chosen so as to reduce herd feed requirements and to balance cow needs with low winter pasture growth rates. Dry cows do not need to eat as much feed as milking cows.
The dry-off date is also chosen to allow cows enough time to gain weight and regain body condition before calving again. Cows are generally dried off when milk production is approximately 5 litres or less. They require a dry period of at least 60 days to allow the mammary gland to shrink and repair before the next lactation. If cows are milked for too long, they can become thin and may then still be thin when they calve the following spring; this will decrease milk yield and reproductive performance in the next season (i.e. they will produce less milk and take longer to get in calf).
Table 1.5 gives data for an ‘average’ dairy farm in New Zealand.
For most dairy farms, the milking platform (area of the farm used for the milk herd) is supplemented by extra land for grazing off heifers and dry cows over winter and by purchased-in feeds. Yields of milk per cow are relatively low compared with overseas, due to shorter lactation lengths, lower feed intakes, smaller cow sizes and the high stocking rates required to harvest pasture effectively. There are differences between the North and the South islands in terms of herd and farm size. Average herd sizes are increasing in both islands, but South Island herd sizes and farm sizes are increasing faster than in the North Island. In 2020–21, there were 2.06 million cows in the South Island compared with 2.84 million in the North Island. The largest average herd size in the South Island is 818 cows (North Canterbury) compared with 650 cows in the North Island (Hawke’s Bay). The smallest
average herd sizes are found in the North Island: Auckland (289 cows), Taranaki (300 cows) and Northland (325 cows) (LIC & DairyNZ, 2022).
South Island farms have higher herd production (in terms of total MS); for example, in 2020–21 North Canterbury was highest with 357,000 kg MS as a result of larger herd sizes, high stocking rates and high MS produced per cow. In the North Island, Hawke’s Bay was highest with 241,169 kg MS due to large herd sizes. Average production per hectare and per cow were higher in the South Island (1137 kg and 397 kg, respectively) than in the North Island (1052 kg and 381 kg) (LIC & DairyNZ, 2022).
The high cost of dairying land plus higher financial returns compared with sheep and beef in recent years has seen the expansion of dairying into non-traditional areas such as Canterbury and Southland. The availability of irrigation in Canterbury allows increased pasture growth rates and therefore greater production.
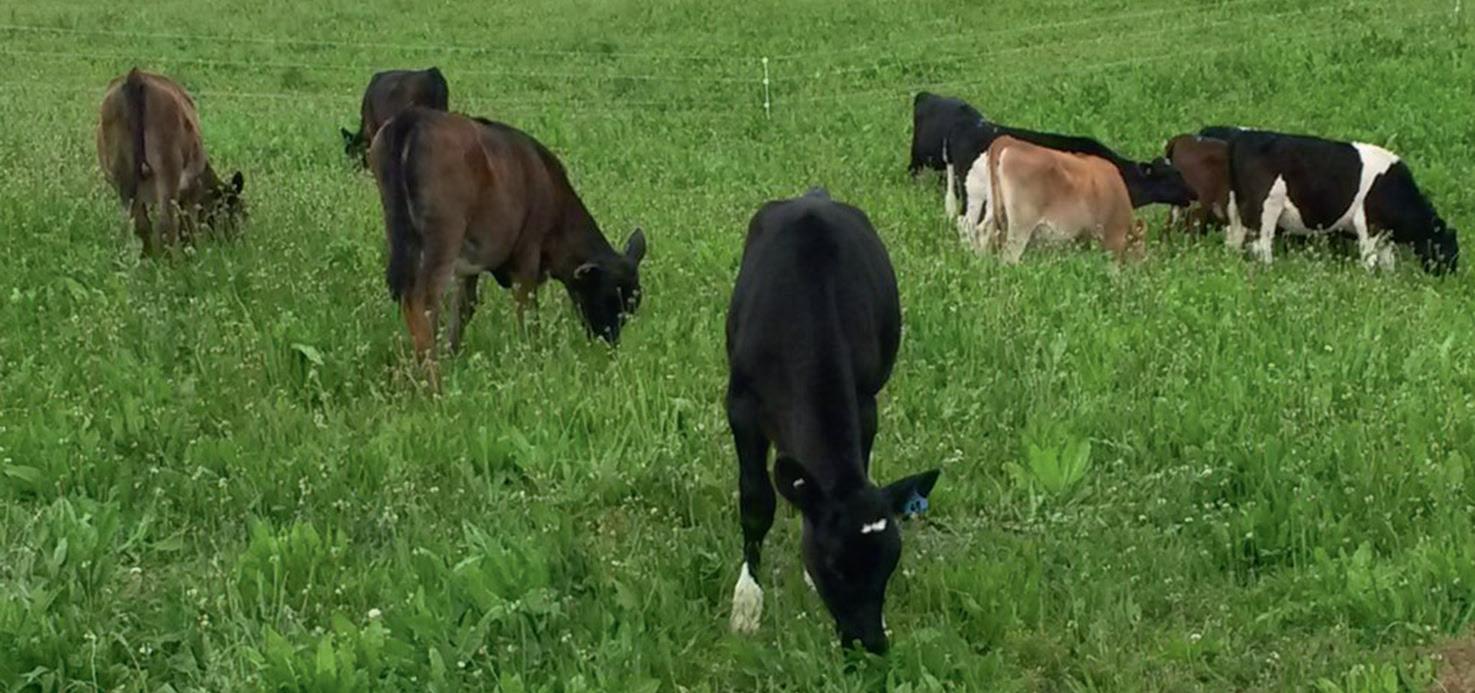
Table 1.5 Data for the ‘average’ seasonal-supply dairy farm and ‘average’ cow for 2020–21
Cows 444 milking cows (includes about 97 heifers which are first-calving two-year-olds)
Area 155 ha (ignoring races, plantations, etc.)
Stocking rate 2.86 cows/ha
Young stock 110 heifer calves
100 one-year-old heifers (yearlings)
Feed Growing 10–16 t pasture DM/ha
Consuming 10–13 t pasture DM/ha
Main fertiliser inputs: 25–50 kg P/ha; 20–100 kg N/ha
plus some feed ‘imported’ and some dry stock (heifers and cows) grazed away from the home farm
Labour Operated by about two people with help from casual labour at busy times such as calving
Ownership
56.2% are owner-operators
28.5% are sharemilkers
Production 222 kg milk fat/cow (5.02% fat)
175 kg protein/cow (3.95% protein)
397 kg milksolids/cow
Breeds 32.5% Holstein Friesian (HF)
8.2% Jersey (J)
49.6% HF x J crossbreds
0.4% Ayrshire
9.3% other (e.g. Brown Swiss, Guernsey)
Breeding Breeding worth (BW) = $102.1
71.3% of herds artificially inseminated
Calving date Early July for upper North Island
Mid to late July for lower North Island
Early August for South Island
Herd testing 74.5% of cows are herd tested (3.73 million cows)
Source: Adapted from LIC & DairyNZ (2022). ha = hectare; kg N/ha = kilograms of nitrogen per hectare; kg P/ha = kilograms of phosphorus per hectare; t pasture DM/ha = tonnes of pasture dry matter per hectare.
However, this has come at an increased cost of capital investment, meaning an increased cost of production; these farms must therefore be high-producing and efficiently run to dilute this cost. In Southland, the challenge of heavy
soils and more severe winters has resulted in increased use of housing. It remains to be seen whether the increases previously described continue with the forecasted lower payouts over the coming seasons.
(JULY TO OCTOBER)
Most herds calve in spring, and calves are removed from their mothers within 24 hours of birth. On most dairy farms, newly calved cows and their calves are brought in from the paddock and separated once a day. Calves should be tagged and navel-sprayed (to prevent infection) in the paddock. The identity of the mother of the calf is recorded, as this is needed to establish each calf’s breeding worth (BW) and breed make-up. Each calf is placed in the calf shed with other calves of the same age. The cow joins the colostrum cow mob to start milking.
On most dairy farms, a proportion of the female calves (heifers) are kept to be reared as replacements for cows that are sold (culled) from the herd. Unwanted heifer or bull (male) calves are sold, either to the bobby calf trade (for slaughter as veal), or at calf sales where they are purchased by commercial calf-rearers. A small proportion (usually Jersey bull calves) may be reared as breeding bulls. These bulls are leased to other farmers to get dairy cows in calf and then are either retained or sent to slaughter. A proportion of calves are born very small or weak and unhealthy, and may be killed on farm. These are unwanted as it is unlikely that they will grow into worthwhile cattle. Calves should be killed using a captive bolt gun followed by pithing (destruction of brain tissue) and perhaps bleeding out. Blunt force is not recommended for killing calves.
When a cow calves, the milk she initially
produces is called colostrum. It is different from normal milk and is not supplied directly for human consumption. Farmers cannot legally supply milk from the first eight milkings after calving, unless contracted to do otherwise, so the colostrum and early milk are normally stored and fed to calves. It is also used in the manufacture of human health products for improved immune function, healing injuries, improving muscle mass and aiding sports recovery. It is not used for the usual milk products (cheese, butter, milk powder). The composition of colostrum changes quickly to that of milk over a few days.
Colostrum is very important for the newborn calf. The calf has a naïve immune system, and the mother’s colostrum supplies the antibodies needed to protect the calf from disease for the first few months of its life. It is therefore important that calves receive colostrum to prevent illness. Calves are managed so that they receive first-milking colostrum, which should have high levels of antibodies, during their first feeds in the sheds. The calves have to be taught to drink from feeders with rubber teats. If they don’t drink, they can be stomach-tubed to ensure that they receive colostrum. Calves should receive at least 2 litres of first-milking colostrum, preferably 10 per cent of their body weight (up to 4 litres) soon after they are moved into the calf shed.
Bobby calves can be sent for slaughter at four days of age. They must be a minimum of 20 kg liveweight. They must have been fed before transport, be able to support their own weight, have a dry navel and be healthy. They should have received the same level of care as the calves that are being held on the farm or being sold at calf sales.