3 minute read
Unlocking the Secrets of Lithium Battery Powder Impurities
Source: ATA Scientific
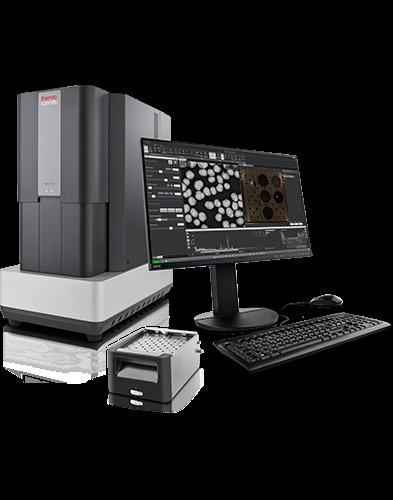
The surge in demand for lithium-ion batteries, driven by the rapid adoption of electric vehicles and renewable energy storage solutions, has placed a premium on the quality and efficiency of battery materials. At the heart of this technological revolution lies a challenge: identifying and analysing impurities in lithium battery powder to ensure optimal performance, safety and longevity. This article highlights how the Thermo Scientific Phenom ParticleX Desktop SEM is addressing this critical need.
The Importance of Impurity Analysis
Lithium-ion batteries are recognised for their high energy density and long cycle life, which make them popular for use, however, battery safety and durability can be compromised by impurity particles that may cause internal short circuits and thermal runaway. These short circuits may occur when large-size impurity particles mechanically pierce the separator or when metal impurity particles in the high-potential cathode undergo a dissolutionprecipitation process. Copper (Cu), characterised by its low dissolution potential and commonly generated in raw material manufacturing, poses a high risk of dissolving on the cathode side, diffusing to the anode side, growing and depositing along the separator’s pores, connecting the anode and cathode, and causing micro short circuits. Manually identifying impurity particles is a time-consuming and labour-intensive task. To address this issue, Thermo Scientific Perception Software reduces the time per particle analysed to less than one second, providing quick results and generating detailed, conclusive reports.
Automated Impurity Analysis
Perception Software integrates SEM control and automates particle analysis, facilitating the entire particle analysis process. Analysing impurity particles takes only a few steps from loading the sample into the sample holder, setting the analysis area, loading the recipe and initiating the analysis for impurity particle analysis. This can run overnight, unsupervised and produce an automatically generated report. The criteria for analysing particles of interest can be defined, such as specifying the size parameters (diameter, aspect ratio, etc.) of particles to be analysed and their composition. Users can analyse impurity particles for e.g. larger than 15 micrometres in diameter within LiFePO4, or particles larger than 5 micrometres in diameter within NCM powder. During runtime, particles falling outside the specified size range are automatically skipped.
A recent publication “Automated impurity analysis for lithium-ion batteries with Perception Software” showed results from a sample prepared by mixing than 5 µm on the sample.

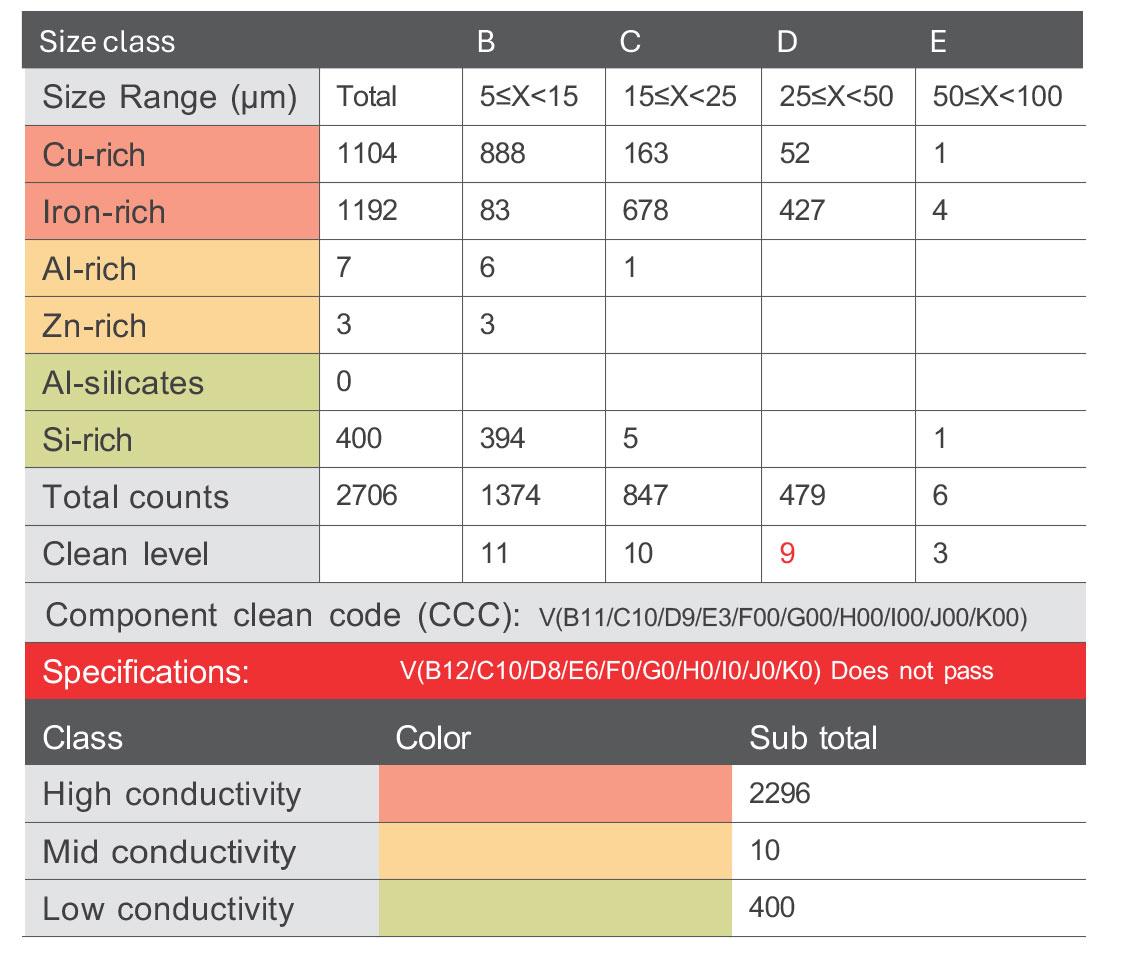
Table 1 reports whether particles within different size ranges meet the specified standards. Rows represent particle categories, while columns display the size distribution of particles. Red, yellow, and green indicate particle conductivity. At the bottom of the table, “CCC” represents the defined cleanliness standard. The results show cleanness level for column D is 9, exceeding the set value of 8. Therefore, the bottom section of the table is marked in red and displays “Does not pass specification.”

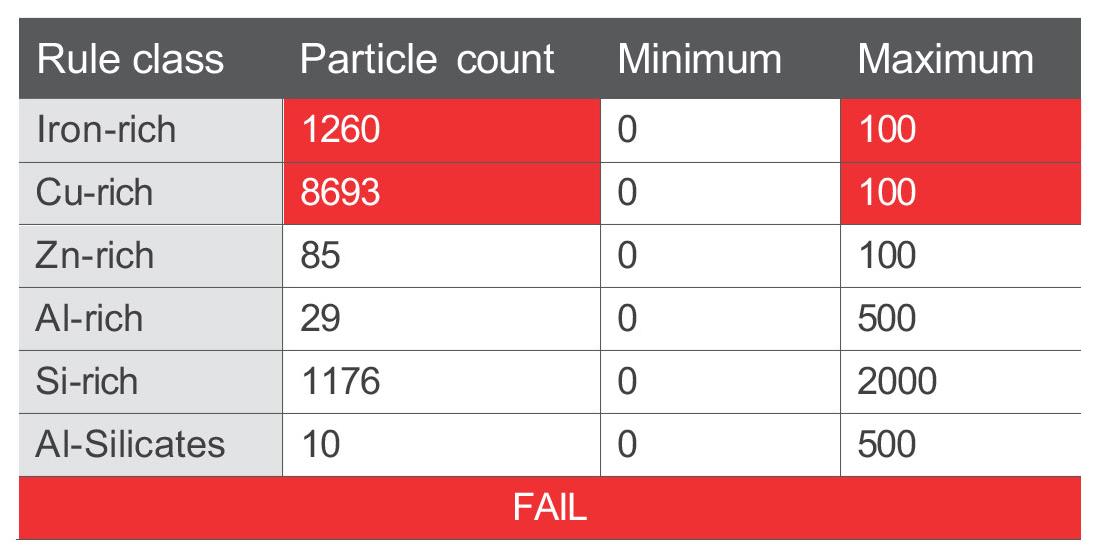
Table 2 reports whether each particle category meets the requirements and can be customised by limiting the particle count. The result shows that 1,260 iron-rich particles and 8,693 Cu-rich particles rich were detected, exceeding the maximum acceptable particle count of 100. As a result, the bottom row of the table is marked in red, indicating that it did not meet the requirements.
Par$cle limits
Par$cle limits
To investigate detected impurities, the particle information table displays representative particles rich in Cu or Fe, presenting particle images, mask images, particle positions, morphology information and labelled spectra. In the Perception Software UI, particles can be revisited for further analysis and confirmation. The report software provides table and chart plugins to display particle data that can be customised, saved as a template and integrated into the particle analysis recipe. Alongside each run, a .pxz file containing all particle information is generated, making it possible to integrate the analysis results into data management software.
Particle Information
Conclusion
Metal impurity particle analysis is attracting increasing attention in the battery industry, especially after the implementation of the Chinese standard GB/T 41704-2022, which has streamlined the analysis process. By ensuring the quality and cleanliness of raw materials and the manufacturing process, potential internal short circuits caused by metal impurities can be effectively minimised. Perception Software automates the impurity particle analysis process, enhancing measurement efficiency and data reliability. The information on impurity particle morphology, composition, and classification aids in tracing the source of impurities and improving production process optimisation. Furthermore, Perception Software can automatically generate reports, providing immediate results on whether quality control requirements are met. By adopting Perception Software’s automated analysis solution, users can enhance quality control processes and ensure the safety and reliability of lithium-ion batteries.
DON’T WAIT - BOOK YOUR PERSONAL DEMO & START USING THE PHENOM XL G2 DESKTOP SEM TODAY!
For more information contact us
ATA Scientific Pty Ltd +61 2 9541 3500 enquiries@atascientific.com.au www.atascientific.com.au
References:
[1] Thermo Fisher Scientific. (n.d.). Impurity analysis of lithium battery powder using automated SEM/EDS particle characterization. RJL Micro & Analytic. Retrieved from https://www.rjl-microanalytic.de/wpcontent/uploads/Thermo-ParticleX-Impurity-Analysis-Lithium-BatteryPowder.pdf
Table 2 reports whether each par9cle category meets the requirements and can be customised by limi9ng the par9cle count. The result shows that 1,260 iron-rich par9cles and 8,693 Cu-rich par9cles rich were detected, exceeding the maximum acceptable par9cle count of 100. As a result, the bo4om row of the table is marked in red, indica9ng that it did not meet the requirements.
Table 2 reports whether each par9cle category meets the requirements and can be customised by limi9ng the par9cle count. The result shows that 1,260 iron-rich par9cles and 8,693 Cu-rich par9cles rich were detected, exceeding the maximum acceptable par9cle count of 100. As a result, the bo4om row of the table is marked in red, indica9ng that it did not meet the requirements.


