11 minute read
RASP at the Taupo Nationals
from SoaringNZ Issue 15
by mccawmedia
RASP AT THE TAUPO NATIONALS – LOTS OF INFO, BUT IS IT ACCURATE?
Over the last couple of months, first at the Drury Comps in January, and then at the recently completed Taupo Nationals, we’ve had the opportunity to use the RASP (Regional Atmospheric Soaring Prediction) system in anger. In doing so, we hoped to answer a few questions. Such as:
Advertisement
Is it any good? Is it useful? Is it just another computerized distraction that provides lots of pretty pictures but doesn’t actually contribute anything new?
In short, the answers to these were yes, yes and no, respectively, but in the interests of padding out column inches with some pretty pictures, I shall now elucidate.
At Taupo, Roland van der Wal was the ‘head honcho’ weather forecaster and it was my job to feed him the RASP forecasts and help integrate them with the big picture. Roland and I were also flying, so we had to (as Roland so succinctly put it) “put our balls on the line” repeatedly. Our respective testicles got a good airing! Before I delve into a day-by-day account of the aforementioned ventilation, I’ll briefly talk about the benefits and pitfalls of computerized weather forecasting, then describe the RASP system and what it will and won’t do.
Computers and Weather Forecasting
Predicting what any particular part of the atmosphere is doing comes down to knowing four things: its pressure; its temperature; its humidity; its velocity. For any small cube of air, you also have to know what’s going on around it – how the “walls” of the cube affect what goes on inside the cube. The equations which govern the behaviour of the cube of air are proven and well-known, so the whole modelling process comes down to three steps. Firstly, establish the boundary conditions – what’s happening to the walls of the cube; secondly, establish the initial conditions of the cube contents; thirdly, solve the equations to find the final state of the cube contents. Easy really.
The limitations of these techniques show up when you start scaling things up. Knowing how a cubic foot of air will behave is one thing. Knowing how billions of these cubes behave and interact with each other is something else entirely. Herein lies the forecaster’s dilemma: know nothing about everything or everything about nothing.
If you’re well-funded, you can afford a very fast computer, so you can examine the air behaviour of the entire globe in reasonable detail. NOAA (the US National Oceanic and Atmospheric Administration) uses such a system to produce the Global Forecast System (GFS) model every 6 hours – the atmosphere up to 35,000 ft is modelled in 110 km square blocks over the entire globe. MetVUW and the NZ Met Service use smaller systems to look at only the SW Pacific region. Each of these computer models is regularly updated with the latest actual weather information so, theoretically, they should all do a reasonably good job of forecasting. Theoretically. In practice, there are three flies in the ointment.
Chaos, Garbage and Ground
The equations that govern the behaviour of the atmosphere are chaotic – tiny differences in the starting conditions can lead to wildly-different final conditions. Practically, this means that you can have confidence in a computer forecast one or two days ahead but after that, the accuracy gets worse. The more complex a situation, the harder it is to issue long-range forecasts. Currently, NOAA, MetVUW and the Met Service all produce reasonable forecasts up to a week in advance, provided that ‘normal’ conditions are prevalent. When things get complicated (deep lows, complex occluded fronts, events happening on scales smaller than your atmospheric block size), MetVUW seems to do a better job than the other two.
The next critical factor in a lot of modelling is the accuracy of the initial conditions – if you put garbage in, you get garbage out. This was highlighted during last year’s Northern Regionals (or ‘The 2009 Super Sailplane Saturation Soirée’) when both NOAA and the Met Service were forecasting periods of fine breaks. Ha!
The last problem with the big forecast systems is the detail of terrain they can cope with – the same size as the blocks of air. Want more detail? Buy a bigger computer. MetVUW and the Met Service seem to operate models with a 20 km grid, so they’re better than NOAA but still not ideal.
RASP BLIP maps – the Solution to the Woes of Soaring Life
This is where the RASP system can potentially be a great benefit. It’s already been described in SoaringNZ issue 13 by Mats Henrikson but I’ll repeat some salient points here. The RASP program sits on a fairly fast (but otherwise ordinary) computer. It downloads the latest GFS run and uses this as its boundary and initial conditions. It then generates a forecast model including terrain on a grid as fine as 1.3 km square. Pretty good, but it still needs to be treated with caution.
BLIP stands for Boundary Layer Information Prediction – note the first two letters. The boundary layer – the layer of the atmosphere where the thermal activity occurs – is modelled using a series of discrete atmospheric slices. As height increases, the slice spacing increases also. High cloud (cirrus etc.) is often thin cloud, so it can be (and frequently is) missed out. Its detailed presence is often difficult to predict anyway and if NOAA misses it, so will RASP.
Surface water and humidity can also be a problem. NOAA forecasts use the humidity of local air-masses but tend to ignore any contribution from ground evaporation. This is especially problematic after heavy rain – there can be so much moisture around
– LOTS OF INFO, BUT IS IT ACCURATE?
that, although the forecasts for post-frontal conditions show nice high cloudbases, the actual bases are a lot lower. RASP copes with this better than the Met Service but it doesn’t take into account any soil porosity or rain history. Yet.
Finally, the whole of NZ is currently divided up into four regions, and the full fine-scale forecast for each region takes about three to four hours to complete. This is not a problem if you’re only running one region but, to make forecasts for the whole country in a timely manner, Mats starts them about 24 hours in advance. Consequently, if things change rapidly, the forecasts will be out of date before they’re released. Caveat emptor. The solution to this is to have four separate PCs, one responsible for each area of the country. Why four areas? In setting up the NZ system, Mats has gone for the greatest level of detail possible because, being made of small islands with varying terrain, NZ is a forecaster’s nightmare. As you may have noticed, we are not Australia, where huge swathes of the country can be modelled as one big flat area of the same type of terrain.
So what will RASP do? Give you hour-by-hour forecasts for a whole range of useful things, including surface heating, Cu cloudbase, thermal strength, surface wind, sea-breeze convergence and sink, and wave bands. RASP will not give you 100% accurate forecasts all day, every day, improve your thermalling technique or add points to your best L/D.
OK, you get the idea. Now some examples, all taken from the recent Taupo Nationals. Day 1, Saturday February 20th
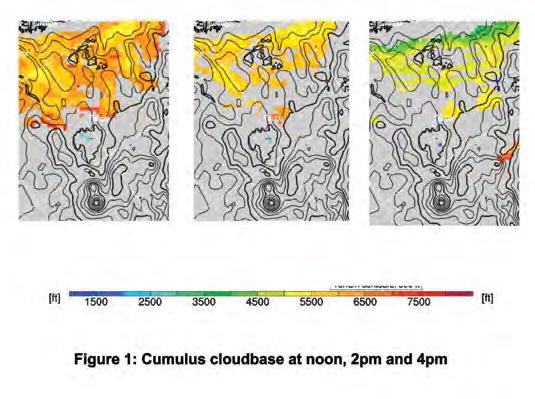
It’s looking like a good day, with the rubbish of the previous week having finally moved off. So what does RASP tell us? First off (see Figure 1), what’s the likely cloudbase?
By David Hirst
Grey areas mean “no Cu’s likely” i.e. the condensation level is higher than where thermals will stop. Even though it looks like the cloudbase is descending, there are actually different colour scales in use for all three plots (which I won’t show here, since obfuscation often offends) – the cloudbase would stay at around 4500 ft – 5500 ft all day.
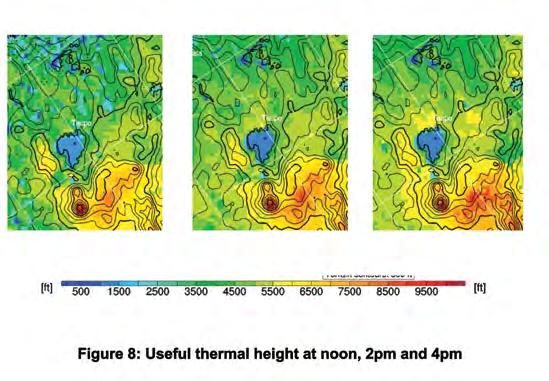
OK so far. What useful thermal height can we expect? Go ye to Figure 2. Note that this “useful height” is determined by where the thermal strength starts to taper off, so it can often be lower than the cloudbase.

These three pictures show an enlarged section of the NI, centred on Lake Taupo, with the Rotorua lakes at the top and the National Park mountains at the bottom. The thin white lines are lat/ long – the pictures have been rotated to best cover the bulk of the North Island. The black lines are mostly terrain contours.
Thermal height generally gets higher as the day warms up, is pretty good over high ground but is comparatively lower to the east of Lake Taupo (you’ll see why later).
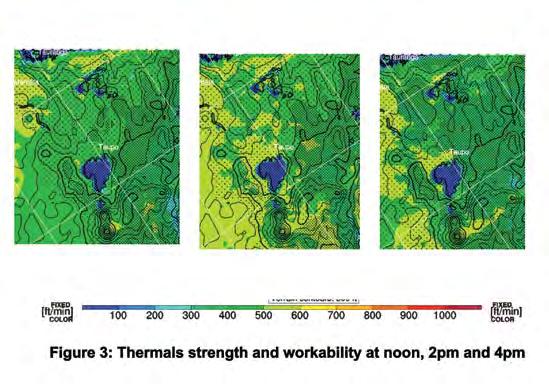
So, those thermals then – how strong will they be? For answers, stare at Figure 3 until you see Elvis.
We can expect 4-5 kt thermals mid afternoon but things get weaker out east later in the day. The denser the stippling, the

harder those thermals are going to be to work. Note that, out to the east of the lake, those thermals are weak and scrappy – we have been warned! It’s a good day to set a task out north and west.
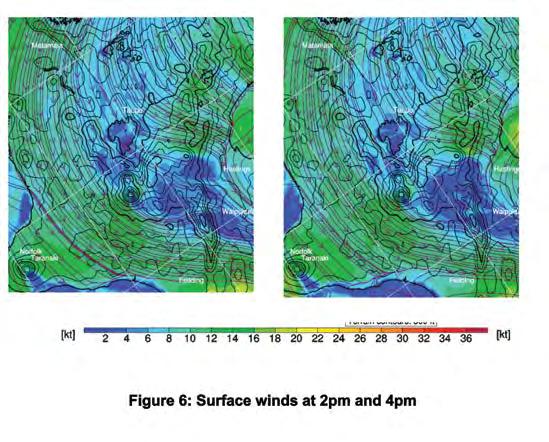
Why so bad to the east? Let’s look at surface winds in Figure 4.
They’re generally west to northwest, which means that a cool lake breeze will kill off anything low to the east from mid afternoon.
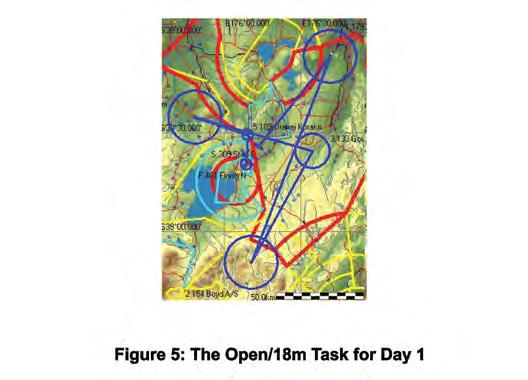
Right, enough forecasting. The task for the day is shown in Figure 5.
I’ll describe the flight in more detail later. What happened? Both forecasters landed out, so we got our comeuppance! In fact, quite a few people got shot down by the lake breeze and only 3 out of 41 gliders completed their respective tasks. There was slightly more cloud than forecast (often the way on blue days) and slightly weaker thermals, but generally 8/10 for RASP.
Day Four, Tuesday 23rd
As shown in Figure 6, winds are forecast to be light northerlies pretty much everywhere.
Cloudbase looks OK to the north and west, but seems to be turning blue to the southeast. The Cu cloudbase (when present) is shown in Figure 7.
The thermals seem reasonable, practically up to cloudbase, as is patently obvious (?) from Figure 8.
Thermal strength is OK, with some areas easier to work than others. Gaze fixedly at Figure 9 and hum until others back away slowly.
Moreover, there are some convergence lines forecast near to the lake, as well as sea-breeze fronts on the coasts. There’s an inversion still hanging around, so streeting is looking likely. Look at Figure 10, especially the stronger (orange or red) convergence lines near coasts, hills and the lake edge.
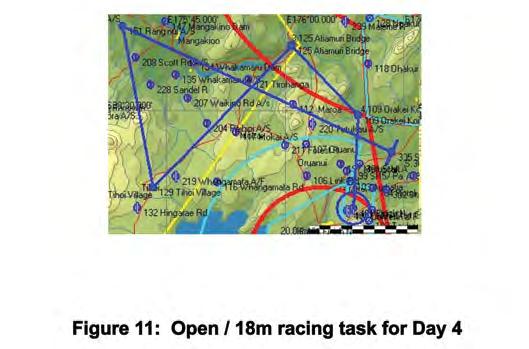
In short, it’s looking like a good day. The problem is that the day takes a while to heat up. A shorter racing task is eventually set, as shown in Figure 11.
There ended up being some good convergence lines to follow; the day was slow to get started but it turned out pretty good. As to the RASP model? I’d say 7/10 for the day. A few more clouds

than forecast and cloudbase a bit lower, but the wind was more northwest than the forecast north, so that brought in a bit more humidity. A forecast run closer to the task time would probably have picked this up – a recurrent complaint for the six flying days. Overall, I’d still give RASP 8/10. Roland and I deliberately erred on the pessimistic side and were frequently granted better conditions. Some days, a pessimistic forecast was warranted; Brett Hunter was heard to comment on such a day that RASP “was spot on, unfortunately”.
You can read all about the Nationals in other articles but I hope I’ve managed to convey here the fact that RASP is a useful addition to the forecaster’s toolbox. A local pilot with lots of experience of a certain area will usually be able to come to the same conclusions as RASP, or be able to tell when it’s telling porkies, but not everyone is able to bend the ear of a suitably-cooperative local.
So what do you do? Have a look at the RASP forecast on a website. Currently, Mats Henrikson runs the two SI models daily (http://zakalwe.com/rasp/), with the NI available given advanced notice. There was enough interest at Taupo to start technical types


talking about Plans – plans that are afoot to possibly generate the forecasts locally and feed them in to the GNZ website. Wouldn’t that be interesting! Watch this space.
