
Drone surveying of Gjiri I Drinit & Patok Lagoon for Sea Turtles Presence & Distribution (2020-2022)


FINAL Technical Report
APRIL 2023
A report by the Mediterranean Association to Save the Sea Turtles (MEDASSET)

CONTACT DETAILS MEDASSET - Mediterranean Association to Save the Sea Turtles
1c Licavitou St., 106 72 Athens, Greece | T/F: + 30 210 3613572 medasset@medasset.org www.medasset.org
COPYRIGHT
Production and dissemination in full or in part of this publication for educational, or other noncommercial purposes, are authorised without any prior written permission provided the source is fully acknowledged and cited. All Photos (unless otherwise specified): © 2020 MEDASSET, photo E. Sacdanaku, © 2021 MEDASSET, photo E. Sacdanaku, © 2021 MEDASSET, photo E. Sacdanaku
Editing & Layout: Amerssa Tsirigoti, Vicky Rae
CITATION
Sacdanaku, E., V. Rae. 2023. Drone surveying of Gjiri I Drinit & Patok Lagoon for Sea Turtles
Presence & Distribution (2020 – 2022):
Technical Report. A report by the Mediterranean Association to Save the Sea Turtles (MEDASSET). 32 pp.
DISCLAIMER
The designations employed and the presentation of material in this document do not imply the expression of any opinion whatsoever concerning the legal or development status of any country, territory, city or area or of its authorities, or concerning the delimitation of its frontiers or boundaries.
ACKNOWLEDGEMENTS
A warm thanks to the student team (Klajdi Duro, Rajmonda Lila, Suada Hatija, Jonida Skorra, Albjona Agolli, Enxhi Selimi and Ilda Prifti) for their major contribution in the two-year survey. We are grateful to the Director of the National Agency of PA in Albania and to all PA staff for their assistance and collaboration We also thank the authorities of the Ministry of Tourism and Environment for their assistance to this project. Lastly, we express our sincere appreciation to Dr Gail Schofield for her expert advice and support throughout this project.
ABOUT MEDASSET With roots back to 1983, MEDASSET was founded in 1988 in the UK and in 1993 in Greece. It is an international NGO registered as a not-for profit organisation in Greece. MEDASSET plays an active role in the study and conservation of sea turtles and their habitats throughout the Mediterranean, through scientific research, environmental education, advocacy and awareness raising. The organisation is a partner to the United Nations Environment Programme’s Mediterranean Action Plan (UNEP/MAP) and a Permanent Observer-Member to the Bern Convention, Council of Europe, since 1988. In Albania, MEDASSET has successfully completed three major projects, delivering important scientific findings: the “Rapid Assessment Survey of important marine turtle and monk seal habitats in the coastal area of Albania” in 2005, “Monitoring and Conservation of Important Sea Turtle Feeding Grounds in the Patok Area of Albania” in 2008-2010 and under Phase I of this project the “Exploration of potential nesting sites & design of conservation measures for sporadic nesting in Albania” in 2018 - 2020. Subsequently, in 2011 MEDASSET prepared the “Management Recommendations for Drini Bay” and the “Action Plan for the Conservation of Sea Turtles and their Habitats in Albania” which was adopted by the Ministry of Environment in 2012.
PREFACE Drone surveying of Gjiri I Drinit & Patok Lagoon for Sea Turtles Presence & Distribution (2020 – 2022) report is part of the Phase II regional project “Conservation of Marine Turtles in the Mediterranean Region“ which is funded by the MAVA Foundation and is implemented by ARCHELON, DEKAMER, MEDASSET, MedPAN, NMPZ, RAC/SPA (leader), WWF Greece, WWF Turkey.
PROJECT COORDINATION
Executive Summary
Previous studies have shown that marine turtles use the nearshore and offshore coastal waters of Albania throughout the year and Drini Bay is an important feeding, overwintering and developmental habitat in the Mediterranean. The Bay is used by both adult and subadult loggerheads, and occasionally by green turtles, for foraging or migration. Juvenile loggerhead and possibly green turtles are using the area as a developmental habitat. There are indications that loggerheads may be staying in the Bay during the winter months.
Drini Bay is a shallow sea (maximum depth in survey area is 47 m) which is about 30 km north from Buna River at the border of Montenegro, to south to the peninsula of Rodoni cape. It has a sand/mud substratum dominated by molluscs and crustaceans.
Under the scope of a Mediterranean regional wide funded project by the MAVA Foundation, in 2021-2022 MEDASSET implemented a project in Albania, where the main activity was a survey conducted in Drini bay aiming to increase our knowledge of:
(1) the temporal and spatial occurrence of sea turtle presence within the bay area
(2) the presence of sea turtles in Patok lagoon
(3) identification and mapping of anthropogenic activities occurring.
Protocols were designed, with support from Dr. Gail Schofield, to collect data through drone flights on sea turtle presence and distribution throughout the year in Patoku lagoon and Drini bay area as well as on anthropogenic activities. Additional data collected included sea water temperature, water transparency, and SIA and genetic samples. Surveying in Albania was led by Dr. Enerit Sacdanaku, supported by a dedicated team of trained students from Tirana University. In total 120 flight missions were completed at 17 inshore locations across Drini bay and Patok Lagoon covering a total area of 8.732km2. Surveying effort was concentrated in 10 southern sites, while seven sites in total were surveyed in the northern region, with four sites surveyed three times and three sites surveyed once. 25,133 total images were captured and analysed for the presence of sea turtles. All drone images were imported into QGIS 3.28 (Firenze) and the position of each sighting was recorded using the geo reference of the photo which displayed the turtle nearest to the centre of the image.
In 26 (of the 120) surveys, 13 positive sea turtles sightings were observed and an additional 25 possible sightings recorded. Three confirmed sea turtle sightings were recorded in Patok Lagoon, providing empirical evidence of sea turtles utilising the lagoon area. 69% of all confirmed sightings (n=9) occurred across three survey sites DBS.1.05-0607, with the highest recorded in DBS.1.07. No sea turtles were recorded in the survey areas during the coldest months. The inshore waters of Drini bay are very shallow and the maximum depth of the surveyed areas was <3.5m. These results support sea turtle overwintering behaviour exhibited at other sites, with a spatial temporal shift of sea turtles exploiting warmer deeper waters.
Winter water temperatures in Patok Lagoon are extremely low (minimum recorded 6.9°C) in comparison to the Bay’s sea temperatures. This low temperature may restrict the sea turtles’ presence within Patok Lagoon during the winter months
With four main river contributors flowing high sedimentary loads into the Bay area, combined with shallow waters and a fine sandy/muddy seabed, the water transparency of the Drini bay water is low. Positive identifications of sea turtles were only possible (with the exception of the Patok Lagoon) at the surface of the water.
The most common type of anthropogenic activity recorded is the artisanal fishery that is dominated by the use of small boats (mrezha fishing nets) and stavniks. The use of surrounding fishing nets “mrezha” is considered the most important threat to the population of the sea turtles in the area of Drini bay.
Despite the low numbers detected, these results provide support to previous research findings considering the southeastern region of Drini bay as a potential hotspot.
Data collected in the framework of this project for water temperature and sea turtle presence and distribution provides additional evidence and new knowledge for the temporal and spatial occurrence of the sea turtles within Drini bay and Patok Lagoon.
1. Introduction
1.1 Gjiri i Drinit, Albania
Gjiri i Drinit is located in the northern region of Albania, extending approximately 30 km from Buna River at the border of Montenegro, to the 8km peninsula of Cape Rodoni in the Adriatic Sea. The seabed is covered mostly by sand and mud while significant amounts of terrigenous sediment are transported to the bay by four major rivers (Buna, Drini, Mati, and Ishmi) (Fig.1). Benthic fauna is abundant, marine flora is sparse, and subsurface visibility is extremely low. The bay is sparsely populated, with a higher density in the northern half and lower in the southern part. The main economic activity is artisanal fishing, usually conducted from small flat-bottomed rowboats. Additionally, there is a small trawling fleet based at the port of Shengjin in the north-eastern part of the bay that frequently fishes illegally within a few meters from the shore; law enforcement resources are extremely limited (White et. al., 2013).

1.2 Previous Work
Previous research within Gjiri i Drinit has shown that this area is nationally and regionally important for the sea turtles, where it has been confirmed that marine turtles use the nearshore and offshore coastal waters of Albania throughout the year and Drini Bay is an important feeding, overwintering and developmental habitat in the Mediterranean. The Bay is used by both adult and subadult loggerheads, and occasionally by green turtles, for foraging or migration. Juvenile loggerhead and possibly green turtles are using the area as a developmental habitat. There are indications that loggerheads may be staying in the Bay during the winter months. (White et al. 2011). In collaboration with the local fishers, MEDASSET conducted a three-year survey (2008- 2010) and the collected data revealed that sea turtles are regularly incidentally caught in stavnik nets1. From this survey 407 individual turtles (402 Caretta caretta and 5 Chelonia mydas) were recorded, with the majority of individuals pertaining to the mature juvenile (subadult) size class CCL 5070cm (n=86.7%, 30-80cm). Within the same study, mark- recapture data of 396 tagged individuals (of 407) and satellite tracking of three Caretta caretta (CCL= 66cm, 69.5cm and 76cm), revealed both short and long term turtle residencies (White et al. 2011; Snape et al. 2019). Tissue samples of 40 Caretta caretta were also collected for genetic analysis and results indicated a high probability of Gjiri I Drini’s Caretta caretta population originating from Greek rookeries (Yilmaz et al. 2011). These results are supported with the recording of a Gjiri I Drini tagged female nesting on Sekania, Zakynthos (Yilmaz et al. 2011) and other tracked individuals from Greek nesting sites (Schofield et al. 2013). Piroli (2021), also reports in her PhD thesis, that Drini bay is regularly frequented from marine turtle species, especially loggerhead (Caretta caretta), where, from 2011 – 2018, an average of 179 individuals per year are being caught, mainly in stavnik fishing traps, but also in other type of fishing gears. She reports a total of 1391 individuals of loggerhead turtles caught in different stavnik fishing nets in the area of Drini bay, with almost half of the records captured in Mati outlet stavnik fishing type In terms of monthly distribution, Piroli (2021), reports the largest number of turtles being caught in the fishing gears is during the spring – summer period (April – September), with a peak in June (Fig. 2)
1 Stavnikes are set at approximately 5-6m depth and form a series of static nets creating sections in which to trap fish. Due to the sections providing space for turtles to swim and access to the surface to breathe, this form of fishing is considered a low risk form of incidental capture (White et al. 2011).

These results all support that the habitat within Gjiri I Drini is significant to Caretta caretta, being ultilised as a developmental, foraging and overwintering ground, and forming part of a migratory corridor. The recognition of its significance has been acknowledged within the adopted National Action Plan (NAP), and is proposed for designated protection under the longterm strategy of the Ministry of Environment, Forest and Water Administration, MoEFWA (MEDASSET 2012).
With the exception of satellite tracking data, the presence and distribution of Gjiri I Drini’s sea turtle population has been limited to the incidental captures in Stavnik nets. These nets are set from April to September (weather dependent) in the shallow nearshore waters, approximately 5- 6m depth and while this data source has proved invaluable, it is spatially and temporally restricted. Analysis of the tracking data revealed turtle habitat ultilisation within the bay to a larger extent (Fig. 3) and displaying a preference for habitats shallower than 30m depth, individually exhibiting intermittent presence, but collectively inhabiting Gjiri I Drini all year round (Snape et al. 2019). This survey aims to address these data gaps and increase our knowledge and understanding of sea turtle presence and distribution throughout the year in Gjiri I Drini.

1.3 Survey Objectives
The Gjiri I Drinit survey aimed to build on previous research for the local population of sea turtles and contribute to attaining Objective 42 of the National Action Plan, to implement designated marine protected areas. The survey objectives are to increase our knowledge of:
(1) the temporal and spatial occurrence of sea turtle presence within the bay area
(2) the presence of sea turtles in Patok lagoon
(3) identification and mapping of anthropogenic activities occurring
1.4 Survey Team
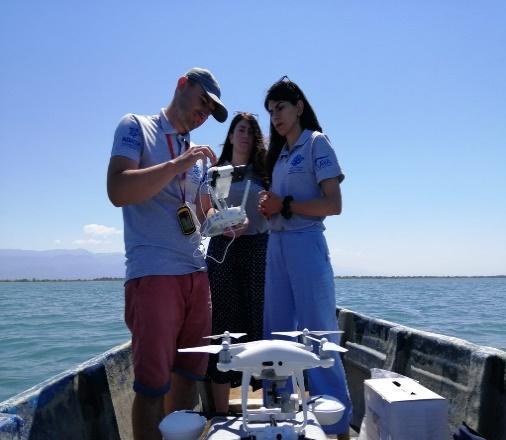
The survey team was led by Dr. Enerit Sacdanaku who was assisted in the collection of data by seven Tirana University students (Klajdi Duro, Rajmonda Lila, Suada Hatija, Jonida Skorra, Albjona Agolli, Enxhi Selimi and Ilda Prifti), selected through an application process. Local fishers provided support for the collection of data for sea surface temperatures and boat transportation to the remote/ limited access survey sites [Mr. Fran Prelaj and Mr. Gjok Cali] Scientific and technical support was provided by Vicky Rae and Dr. Gail Schofield.
2. Survey Methodology
2.1 Water Transparency
The transparency of the water column in Gjiri I Drinit is extremely low. A combination of heavy sedimentary outputs from four major rivers flowing into the Bay, shallow depth and a fine mud/ sand seabed (UNEP 2020) all contribute to an increased suspension of particles in the water column, severely reducing visibility. Complimentary data for the water transparency were collected using a secchi disk at pre-determined locations, co-insiding with the survey areas of the drone flight missions. This data help to determine the visual depth limitations to detect sea turtles and the viability of drone surveying for future research.
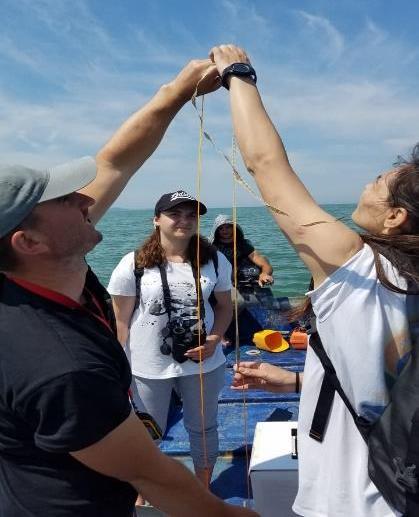
The water transparency measurement is the first task to be completed of each survey, requiring two persons to complete this task. The first surveyor lowers the secchi disk into the water, until the disk is no longer visible, and the second surveyor pinches the cord at the sea surface to mark the depth, as it is retrieved on board (Fig. 4). The length from the surveyor’s pinch to the disk is measured to the nearest millimetre and the visibility depth recorded. Three readings were taken at each site and the GPS locations recorded sing a handheld Garmin (Annex I).

2.2 Drone Survey
Development of the survey plan and sites took into consideration the listed factors in Table 1 Based on previous research, survey effort was concentrated in the southern region of the Bay and Patok Lagoon. A survey area template was generated in Google Earth and placed at 1.5 km intervals along the southern coastline of Gjiri I Drinit (eight sites) and in Patok Lagoon (two sites) All sites were uploaded to DroneDeploy using the ‘KML/SHP import’ App. These were reviewed and adjusted by the lead surveyor as per site accessibility and clear sight of the drone during entire flight Additional sites were created in the northern region of Gjiri I Drinit, but surveyed at a lesser effort Dependant on weather conditions, the southern sites were surveyed at monthly intervals and the northern sites three times throughout the duration of the project. To assess safe weather conditions and satellite connections for the drone surveys, the information provided on www.uavforecast.com was reviewed before each flight. All flights were flown using the automated pilot and settings for image capture were programmed in DroneDeploy (Table 2).
Factors affecting survey plan, area and transect locations.
Survey Extent & Location:
Previous research Synthesis of all available data from previous research of known sea turtle presence and distribution to be mapped. Survey locations to incorporate areas of reported presence and expand the surveyed area both spatially and temporally.
Drone Limitation and flight safety
Accessibility to coastal survey sites
Drone flights are limited to battery life and surveys was designed to follow safety protocol procedures (e.g. drone must be visible by the surveyors at all times during flight mission).
SHORELINE: Access to survey points along the coastline will be restricted to the presence and suitability of roads. This will be determined by the Lead Surveyor.
Safety at sea BOAT-BASED: Surveyors are collaborating with local fishers for boat hire and will adhere to fishers’ expert knowledge. Survey sites will be limited to the vessel’s capability and sea state conditions
Water Transparency High river-born sediments from 4 major rivers, coupled with a seabed consisting mainly of muddy sediments, creates a very low water transparency for Gjiri I Drini. Selection of survey locations will endeavour to avoid placement directly in front of river outflows.
Survey Timeframe:
Environmental conditions Weather conditions and sea state will determine if surveying can safely and successfully be carried out.
Project limitations
Fixed amount of funding is available to implement fieldwork activities, and subsequently determine the total number of survey days (max. 36 days).
Water Transparency High river-born sediments from 4 major rivers, combined with a predominantly sand/muddy seabed decreases Gjiri I Drini’s water transparency. Surveys will endeavour to be implemented during prolonged calm environment conditions and not after extreme weather events.
Gimbal Angle 90° (Nadir) Angle of image capture perpendicular to sea surface Altitude 60m Maximum spatial extent surveyed, without comprising turtle detection and gender recognition
Front Overlap 80% High overlap allowed to increase image capture rate
Side Overlap 30% Low overlap allowed to prevent repeated surveying in mission flight plan and increase survey area
Angle
to ensure transects were parallel to coastline and reduce the flight time and battery use
2.3 Aqua Loggers
As an ectothermic species, sea turtles’ life history strategies are dependent on their surrounding environment temperatures, influencing their distribution and behaviour. Loggerheads have a less restricted temperature range to green turtles and can tolerate cooler temperatures. Overwintering research of satellite tracked loggerhead turtles, have revealed that the duration of their dives increase with decreasing sea surface temperatures (Hochscheid et al. 2005) and that they can remain active (though at a lower rate) at temperatures as low as 11.8°C (Hochscheid et al. 2007). Therefore, understanding Gjiri I Drinit sea surface temperature temporal and spatial profiles will provide complimentary data to increase our understanding for environmental factors influencing sea turtles’ distribution and behaviour in the Bay and lagoon.
Data collected from this survey will also provide additional information to MEDASSET’s previous research, conducted under the same project3 . In-situ sea surface temperature data was collected at specific sites during the 2019 nesting season, and analysed in combination with Copernicus Ocean Monitoring Indicator data to evaluate the suitability of Albania’s inshore waters to support sea turtle nesting along its coastline From the data collected it was confirmed that the temperature threshold of 20°C was reached and maintained to facilitate the internal maturation of eggs in reproductive females, to initiate nesting activity (Márquez 1990). The data collected during this survey provide further clarification for favourable conditions to support sea turtle nesting activity in the northern region of Albania. Sea surface temperature data were collected for a minimum period of 12 months, using two Tinytag data loggers, type TG4100 (-400C – 700C) (more info can be found at: www.tinytag.info). Placement of the loggers was determined by the lead surveyor and in collaboration with Gjiri I Drinit local stavnik fishers (Fig 5). Loggers were configured to collect the maximum and minimum temperature every 30mins and placed at 1m below the surface in approximately 5m water depth


2.4 Anthropogenic Activity
Data for anthropogenic activities was collected at the same time as the drone flight missions were conducted Information was collected for each activity and type occurring and assigned a number, 1, 2, 3 etc., with re-occurring activities (the same activity re-entering the survey area if it travels outside the boundary), labelled as 1a, 1b, 1c etc. (Annex I). The start and end time for each occurrence was recorded, with pre-existing or post duration activities of the survey left blank.
2.5 SIA & Genetic Sampling

During the two-year field survey (2021-2022), isotopic and genetic samples were taken from live and dead specimens of loggerhead turtle (Caretta caretta) and from live specimens of green turtle (Chelonia mydas). For isotope analyses, scute samples were removed approximately 1cm in size from between the 2nd and 3rd lateral/costal scute, using a clean scalpel blade and gloves. The samples were placed in a labelled container and kept dry. As, for the genetic analysis, small samples of tissue (0.5cm) were removed from live turtles, placed in eppendorf tubes (14ml) and covered with alcohol (96%). Samples were stored at room temperature (Fig. 6).

3. Fieldwork Survey Results & Analysis
3.1 Water Transparency
A secchi disk was applied to measure the water transparency during seven surveys, from which a total of 21 measurements were taken (three measurements per location). The maximum and minimum average taken at each location was 615cm to 102cm respectively, with the minimum depth recorded 80cm in Patok Lagoon (PL1.10) and maximum 624cm at the most western site in the Bay area (DBS.1.01)
An additional method was applied to allow an evaluation of the water transparency for all surveys conducted Four categories were defined to analyse the drone images post survey, ranking the overall transparency of the water as Opaque (No features visible), Cloudy (Shadows visible), Hazy (Seafloor visible but features not well-defined), Clear (Seafloor visible and features defined), (Annex II). Throughout the survey period, 9% of all surveys displayed a clear transparency, 34.6% Hazy, 40.6% Cloudy and 15.8% Opaque. The highest water transparency was reported during March’s surveys (40% Clear and 45% Hazy) and the lowest during December’s surveys (40% Cloudy and 55% Opaque). Overall, no temporal trend was observed for water transparency throughout the year, however, the months with the highest transparency were recorded during the Spring and Summer months (March, May and August) and the lowest transparency during the Autumn/ Winter months (December, February and October) (Fig 7).
The surveys sites along the Peninsula of Rodoni Cape were situated furthest away from the outflows of the major rivers (Ishmit, Matit and Drinit), and presented the highest water transparency throughout the survey period (Fig 8). The images captured from the sites DBS1.01 to DBS1.04 exhibited the highest percentages of clear and hazy water transparency (55% - 75%), while the eastern survey sites, with the exception of PL.1.09, all exhibited lower water transparency, with higher percentages of Cloudy to Opaque transparency (66% - 83%). Across the northern survey sites, DBN.1.02 exhibited the highest water transparency (100% hazy) and DBN.1.03, located near the Drinit outflow, the lowest water transparency (100% Cloudy). These results reveal the limitation of drone surveying, with decreasing ability to positively identify sea turtles within the water column in the eastern region of the Bay.


3.2 Drone Survey
3.2.1 Survey Effort
In total 120 flight missions were completed at 17 inshore locations across Gjiri I Drinit and Patok Lagoon (Fig 9), covering a total area of 8.732km2 Surveying began on 19/05/2021 and finished 08/10/2022 with surveying effort concentrated in 10 southern sites; six sites were surveyed 10 times and four sites nine times (Fig. 9a) Seven sites in total were surveyed in the northern region, with four sites surveyed three times and three sites surveyed once (Fig 9b) Total flight time was 1,462mins, resulting in 25,133 images captured and analysed for the presence of sea turtles (Table 3) All drone images were imported into QGIS 3.28 (Firenze) and the position of each sighting was recorded using the geo reference of the photo which displayed the turtle nearest to the centre of the image (Fig 10).


3.2.2 Sea Turtles Recordings


In 26 (of the 120) surveys, 13 positive sea turtles sightings were observed and an additional 25 possible sightings recorded. In surveys which recorded more than one positive turtle (n=3), the timestamp of the image, the heading direction and the distance between the individuals was calculated in QGIS to determine unique individuals and eliminate duplication recordings (Table 4). To increase certainty in our conclusions, the fastest calculated swimming speed of an adult loggerhead turtle in coastal waters (1.7 km/ h) measured from previous satellite tracking data conducted by Godley et al. (2003), was applied to the time elapsed and distance recorded between the two turtle recordings In all surveys the measured distance was further (>100m) than the calculated swimming distance. Further evidence for supporting these turtles as unique individuals was obtained from the directional headings. For both DBS.1.05 (8) and DBS.1.07 (8) the first turtle captured in the survey is heading away from the location of the second turtle recorded There is less certainty for the two turtles captured in PL.1.10 (8), as the first turtle recorded (Image #6) is travelling in the same direction in the survey behind the second turtle (Image #113). Although this heading does not provide a direct link between the two turtles, the swimming track visible in the image #113, shows that this turtle was initially travelling from approximate direction of the turtle in image #6 (SE). However, the calculated swimming distance is approximately half of the measured distance between the two individuals. Therefore, all turtles positively sighted per survey are unique individuals, n = 13.

With the exception of individuals captured in the shallow waters of the Lagoon seabed, all positively sighted sea turtles were observed at the sea surface, displaying a clear body form so as to be identified. Of the 25 possible sea turtles recorded, six were positioned at the surface, nine at the top of the water column, three mid water column and seven at the seabed. The six positioned at the surface could not be confirmed due to their small size and/or exhibiting an undefined body outline. All possible sightings below the surface appeared as dark entities which represented the same size and basic body shape of a turtle and were not present in images taken at the same location in other surveys.


3.2.3 Spatial Distribution
Thirty-one sea turtle sightings were located within the Bay area, 28 (10 positive) in the southern region (Figs 10a-b) and four (one positive) in the northern region (Figs 10c-d). The remaining six sightings were observed in Patok Lagoon, three of which were positive sightings providing empirical evidence that sea turtles are utilising the lagoon habitat. Spatial analysis of the 10 positive turtles in the Bay in QGIS, showed that their average distance from the coastline was 457m (Min-Max = 280- 651m). An open source Bathymetry Shapefile produced from the UNEP 2020 survey provided the approximate depth of the location of each turtle. All turtles were recorded in waters with less than 3.5m depth.

Six of the 17 survey areas did not record any sightings. In the southern region these were DBS1.01 and DBS.1.04 and in the northern region DBN_1.04 (a&c) and DBN_1.01 (a&b). Confirmed sightings of sea turtles were recorded within six of the surveyed sites, with 69% (n=9) of these occurring across three sites in the south eastern region; DBS.1.05-06-07. The highest number of positive and possible turtles were identified in DBS.1.07, with five confirmed and 10 possible sightings. Only one positive sighting was recorded in the northern region at DBN.1.04
The results of the distribution of both the positive and possible sea turtle sightings highlight the south eastern region of Gjiri I Drinit as a potential hotspot area. Although caution is needed due to the low number of sightings recorded of the known much larger population that inhabits the Bay area (White et al. 2013) and the lower survey effort implemented in the northern region. However, these results identify the same region as a high use area of three satellite tracked sea turtles as those reported in Snape et al. (2019), providing additional evidence to support the south eastern region as a hotspot within the Bay area. Recommendations for further research are provided in Section 4.


3.2.4 Temporal Distribution
92% of all positive sightings were recorded during the Spring/ Summer months (May – August), with the highest number of sightings recorded during the month of May (n=6, 2021 and 2022). Possible turtle sightings were recorded across a larger timeframe and included recordings during the cooler months from March to December (Table 5). No sightings were recorded during the January or February surveys, however due to bad weather conditions, only two drone surveys could be completed during January.
The lack and lower number of sea turtle recordings during the cooler winter months, suggests that sea turtles are exhibiting the same spatial shifts behaviours as found at other overwintering grounds, exploiting deeper warmer waters and increasing their dive durations (REFs). This behaviour is also supported by the data obtained from the previous study of satellite tracked turtles by Snape et al. (2019). However, due to the extent of the bay, the low water visibility and limitation of the drone (maximum distance/ depth – 1km/ <3.5m), definitive conclusions cannot be made. Further analysis is provided in Section 3.3 (Sea Surface Temperature).

3.3 Sea Surface Temperatures
Two temperature loggers collected data from May 2021 to October 2022, (n=504 days), across four sites (Table 6); three in Gjiri I Drinit and one in Patok Lagoon. The loggers placed in Gjiri I Drinit were placed in collaboration with local fishers, with the devices were attached to their Stavnik nets. The fisher at Kune-Shengjin did not remove his nets over winter, so this device was not moved throughout the entire survey. The other logger was removed from the stavnik in the winter time, as the bad weather destroyd the nets and was placed into the lagoon to a wooden pool in collaboration with the fishermen It stayed in the lagoon for a few months from January until May and then was moved to another stavnik in the southern part in Rodoni cape, where stayed until October (table 6). A temperature range of 23.3°C was recorded across all sites, the maximum 30.2°C at Kune -Shengjin (15/07/2021) and the minimum 6.9°C in Patok Lagoon (31/01/2022) (Fig 11)
Daily
Daily
Comparison of the temperatures between the sites was calculated for the 30min interval maximums using the Wilcoxon Signed Rank Test in RStudio (Table 7). Data collected from the logger device which was moved during the survey (Mati, Patok and Rodoni) were compared to the logger device which remained at Kune – Shengjin over the same time period. No significant differences were found between the temperatures recorded in Bay area sites (Mati, Rodoni and KuneShengjin), presenting a consistent sea surface temperature profile across the southern inshore waters of Gjiri I Drinit The lowest sea temperatures recorded in the Bay corresponded with other research at overwintering grounds across the Mediterranean, where sea turtles’ behaviour is reported to become more dormant, coupled with increasing time spent in deeper warmer waters (Lazar et al. 2002, Broderick et al. 2007, Revelles et al. 2007 & Zbinden et al. 2008). The water depth in the surveyed areas did not exceed 3.5m, but reaches > 30m within the Bay area. At 30m the seafloor temperature average is approximately 14.4°C (Jan/ Feb 20224) which was 1.2°C warmer than recorded by the temperature loggers in the Bay. During the survey, no sea turtles (confirmed or possible) were recorded during the January or February (Av = 13.2°C) and confirmed sea turtle sightings were only recorded during May to October (Av = 23.1°C). Although caution is needed in the interpreting these results due to the limitations of the survey (4. Summary & Recommendations), it does support a spatial behaviour shift by sea turtles in Gjiri I Drinit, as found at other over wintering sites.
A significance temperature difference was found between the Kune- Shengjin and Patok Lagoon. This is perhaps not surprising considering the depth of the lagoon (max depth around 1.3m an the average depth 0.7m, which exhibits a relatively higher surface area to the atmosphere, therefore radiating and absorbing heat much more readily. This difference is more apparent for the recordings during January, February and beginning of March, with temperatures consistently <12°C in the lagoon; 47/ 51 days, (31st Jan – 22nd March) Whereas at Kune- Shengjin, temperatures only fell below 12°C for 4/51 days during the same time period Sea Turtles were positively identified in the Lagoon during the warmer months of October and May, with a possible sighting during April. No sea turtles were recorded during the cooler months (Jan – March), and the consistently low temperatures (<12°C) will most likely restrict their movements into the Patok Lagoon during this period. Further research should be implemented to investigate water temperature as a potential temporal limiting factor for the presence of sea turtles in Patok lagoon and the other lagoons connected to the Bay area.
At all locations, temperatures exceeded the 20°C threshold to support egg maturation in females; in 2021 at KuneShengjin and Mati on 24th May, and in 2022 at Kune -Shengjin and Rodoni on 27th May, and in Patok Lagoon on 4th May (Fig 11). At Kune -Shengjin where the logger device remained at the same location throughout the duration of the survey, the number of days over the summer months could be calculated for temperatures exceeding 20°C; this was 120/ 150 days (24/05/2021
22/10/2021) and 113/ 135 days (27/05/2022 – 08/10/2022). These temperature results are consistent with previous findings providing additional evidence that the inshore waters of the northern region of Albania can support nesting activity
Dataset: cmems_mod_med_phy-tem_anfc_4.2km_PT1HTS-m
3.4 Anthropogenic Activity

Data for anthropogenic activities inside the area of Drini bay were collected at the same time as the drone flight missions were conducted. The most common type of anthropogenic activity recorded was fishery with 58% of all the flight numbers recorded, 4% tourism and 38% no activity was observed (Fig. 12a).

Touristic activities, such as presence of the sport water vehicles and rarely touristic boats, were present only in the summer period (June – August) in the northern part of the bay (flights DBN_1.01, DBN_1.02), which it is known to be a highly developed touristic area. The tourism is poorly developed in the southern part of the bay due to the access and quality of the beaches, but instead of it, fishing activity is quite widespread. As it can be seen from the above figure (Fig. 12b) the most common type of fishing activity is artisanal fishing dominated by the use of small boats (surrounding nets called “mrezha”) and stavniks (concentrated mostly in the southern part, by Rodoni cape), followed by bilanc fishing type (observed to be present only in the Ishmi river outlet – DBS_1.05). Another type of fishing activity observed in the area was a Mussel (Mytilus galloprovincialis) farm present between flight DBS_ 1.04, 1.03 and 1.02 in the southern part of the bay (Fig. 13). While, trawl fishing activity was observed only in one case during the flight POP.Bay_05, where two big trawls were seen moving in a long distance from the shore, which seems to be fishing legally. It is important to highlight that in all other cases during our survey we did not observed any other trawls fishing activities operating near the shore. Anyway, there is a small trawling fleet based at the port of Shengjin in the northeastern part of the bay that is operating throughout of the year in the area of Drini bay, which probably fishes legally by respecting the required distance from the shore, but sometimes you may also see trawls operating quite near the shore.

Beside the trawls in deep water, considered as a major threat to the sea turtle population, in our case, in the shallow part of the bay the main threat could be considered the presence of the many small fisheremen operating within the bay and using “mrezha” type of fishing, one of the most widespread fishing method and “unfriendly” for the sea turtles captured as bycatch. There have been many cases reported by the fishermen, where the animals gets stucked in the fishing nets and dies, because they throw the nets into the sea and leave it for many hours to come and check later. While, if we speak about the stavnik fishing type, it is different, they are considered a “friendly” method for sea turtle, because the animal that enter into the stavnik trap chambers can swim inside and also can feed on fishes and other animals and the most important, can come up to the surface and breath. The presence of the mussel farm, might not have an impact on the sea turtle population in the bay, but on the contrary it can be used by the animals to feed there (eating the mussels).
3.5 SIA & Genetic Sampling
During the 2021-2022 survey period, a total 36 samples were collected with 18 samples for Stable Isotope Analysis (SIA) (a small piece of carapace scute approx. 3 cm in size and 0.1–0.4 grams) and another 18 samples from the skin for genetic analysis (approx. 2 cm and 0.03 grams) belonging to 17 individual of loggerhead (Caretta caretta) and one individual to green turtle (Chelonia mydas). 14 live specimens of Caretta caretta and one specimen of Chelonia mydas were captured as bycatch in Mati stavnik, Patok area and anouther tow live specimen of C. caretta were captured as bycatch in Vlora area, sothern Albania. While, one specimen of C. caretta were found dead (stranded) in the area of Gjiri Lalzit bay. Collected. Another four samples were collected for genetic analysis from the nest in Divjaka Beach during the excavation process in August 2023, consisted of two dead Caretta caretta hatchlings (two front flippers of 2.5 cm from each individual) and two late stage dead embryos. The samples will be delivered for analysis to University of Barcelona, Spain, as part of a Mediterranean regional assessment. Findings will be published.
4. Summary & Recommendations
4.1 Main Findings
Data collected in the framework of this project for water temperature and sea turtle presence and distribution provides additional evidence and new knowledge for the temporal and spatial occurrence of sea turtles presence within Gjiri I Drinit and Patok Lagoon. The main findings from the survey results are:
(1) Three confirmed sea turtle sightings were recorded in Patok Lagoon, providing empirical evidence of sea turtles utilising the lagoon area.
(2) 69% of all confirmed sightings (n=9) occurred across three survey sites DBS.1.05-06-07, with the highest recorded in DBS.1.07. Despite the low numbers detected, these results provide support to previous research findings identifying the south eastern region of Gjiri I Drinit as a potential hotspot.
(3) No sea turtles were recorded in the survey areas during the coldest months. The inshore waters of Gjiri I Drinit are very shallow and the maximum depth of the surveyed areas was <3.5m. These results support sea turtle overwintering behaviour exhibited at other sites, with a spatial temporal shift of sea turtles exploiting warmer deeper waters.
(4) Winter water temperatures in Patok Lagoon are extremely low (minimum recorded 6.9°C) in comparison to the Bay’s sea temperatures. This low temperature may restrict the sea turtles’ presence within Patok Lagoon during the winter months.
(5) The most common type of anthropogenic activity recorded artisanal fishery dominated by the use of small boats (mrezha fishing nets) and stavniks. The use of surrounding fishing nets “mrezha” is considered as the most threatened to the population of sea turtle in the area of Drini bay.
4.2 Survey Limitations
Limitations of the survey prevent definitive conclusions for defining hotspot areas for sea turtle presence, but compliment previous research for delineating a potential high use area. Limitations of the survey were as follows:
(1) The Survey Spatial Extent: The Gjiri I Drinit bay area comprises of approximately 409km2. Due to the safety protocols developed, the length of the drone battery life and the availability of a suitable marine platform to conduct the drone flights, surveys were restricted to the inshore waters. The total area surveyed in the bay represented 1.2% of the total Bay area.
(2) Survey Effort: Budget restrictions, suitable road infrastructures and accessibility meant it was not possible to logistically survey along the entire coastline of the Bay without increasing travel costs while decreasing the total number of surveys conducted. This necessitated our surveyor to concentrate survey effort to a region within the Bay. Previous research data had supported a higher use of the southern region by sea turtles, and in order to build on this work, the survey effort was higher along the southern coastline.
(3) Water Visibility: With four main river contributors flowing high sedimentary loads into the Bay area, combined with shallow waters and a fine sandy/muddy seabed, the transparency Gjiri I Drinit water is very low. Positive identifications of sea turtles were only possible (with the exception in Patok Lagoon) at the surface of the water. Positive identification of sea turtles within the water column were not possible, limiting the ability to confirm individuals.
(4) Small sample of confirmed sea turtles: Previous research conducted in the Bay have recorded a high numbers of sea turtles present within Gjiri I Drinit (396 tagged individuals White et al. 2011). From the 120 surveys, only 13 confirmed sea turtle sightings (12 unique individuals) were recorded, representing a small sample of the population.
4.3 Recommendations
To ensure a comprehensive understanding of sea turtles presence and distribution across the entire bay area and all adjacent lagoons, further research is needed to verify the results achieved thus far. The following recommendations are suggested:
(1) The application of alternative biotelemetry methods: Due to the limitations experienced in this survey to cover the spatial extent of sea turtle distribution across the entire bay and the low water visibility, other tracking methods should be applied. Two biotelemetry methods which can be applied in collaboration with the local stavnik fishers, mitigate the aforementioned issues are:
I. Satellite Tracking – Widely applied for sea turtle research, this method is more commonly used to provide data on long migrations and connecting nesting sites to foraging grounds. Additional satellite tracking of individuals in Gjiri I Drinit will build on the three previously tracked individuals and provide possible additional data for sea turtles utilising areas outside the Bay, linking habitats within the Adriatic Sea.
II. Acoustic Tracking - This method has been widely used for fish species and a lesser extent in sea turtles but can be applied to provide fine –scale spatial tracking data on sea turtles (Hardin & Fuentes 2021). The transmission distance of the acoustic tags is limited, but are effective for use in nearshore habitats and or specific area, such as in Gjiri I Drinit. Data can be collected either actively (hydrophone) or passively (stationary receivers). Furthermore, the overall costs of the tags and equipment is lower than the Satellite Tracking devices, therefore allowing a higher number of individuals to be tagged and provide data.
(2) Increase survey effort within the northern region: To date, information on sea turtle distribution of Gjiri I Drinit has revealed and focused in the southern region of the Bay area. Application of alternative methods in (1) will provide less bias in survey effort and provide greater insights of sea turtles spatial use across the entire Bay region.
(3) Sea Turtles’ utilisation of the lagoon habitats: Four open lagoons are situated adjacent to Gjiri I Drinit, Vilunit, Kunes, Vainit and Patok. To date, (to the knowledge of the authors of this report) research for the presence of sea turtles has only been applied for Patok Lagoon. Confirmation of sea turtle utilising Patok Lagoon provides increasing potential that the other Lagoons could also be utilised. Knowledge of the importance of the Lagoon areas (including Patok) to sea turtles is unclear and should be explored further for the number of sea turtles using these habitats and potential restricting factors limiting their use, i.e. low water temperatures during winter months.
(4) Factors influences sea turtle distribution within the Bay: In combination with increasing knowledge of sea turtle distribution, further research can be applied to examine the possibility of environmental/ anthropogenic factors which may be influencing the spatial use and extent. For instance, the use of the mussel farm or stavniks as potential foraging focal points or important habitats such as the rocky reefs/ Posidonia beds along the Cape of Rodoni.
(5) Implementation of an observer programme on the fishing fleets operating in the deeper waters of the Bay area from Port Shengjin.
5. References
Broderick A.C., Coyne M.S., Fuller W.J., Glen F. & Godley B.J. (2007) ‘Fidelity and over-wintering of sea turtles’ Proceeding of the Royal Society 274, 1533 – 1538. doi:10.1098/rspb.2007.0211
Godley B.J., Broderick A.C., Glen F. & Hays G.C. (2003) ‘Post-movements and submergence patterns of loggerhead marine turtles in the Mediterranean assessed by satellite tracking’. Journal of experimental marine Biology and Ecology (287) 119 – 134
Hardin E.E. & Fuentes M.P.B. (2021) ‘A Syetematic Review of Acoustic Telemetry as a Tool to Gain Insights Into Marine Turtle Ecology & Aid Their Conservation’ Frontiers in Marine Science 8:765418. doi: 10.3389/fmars.2021.765418
Hochscheid S., Bentivegna F. & Hays G.C. (2005) ‘First record of dive durations for hibernating sea turtle’ Biology Letters (1) 82 -86. Doi:10.1098/rsbl.2004.0250
Hochscheid S., Bentivegna F., Bradai M.N. & Hays G.C. (2007) ‘Overwintering behaviour in sea turtles: dormancy is optional’ Marine Ecology Progress Series (340) 287 – 298. DOI: 10.3354/meps340287
Lazar B, Borboroglu PG, Tvrtkovic N, Ziza V (2002) Temporal and spatial distribution of the loggerhead sea turtle Caretta caretta in the eastern Adriatic Sea: a seasonal migration pathway? In: SeminoV JA (ed) 22nd annual symposium on sea turtle biology and conservation. NOAA Technical Memorandum, Miami, pp 283– 284
Márquez M.R. (1990) ‘Sea Turtles of the world. An annotated and illustrated catalogue of sea turtle species known to date’. FAO Fisheries Synopsis, FAO species Catalogue, N0.125 (11) p.81
MEDASSET (2012) Action Plan for the Conservation of Sea Turtles and their Habitats in Albania. White M, Boura L, Grimanis K, Venizelos L. Athens, Greece. 38pp
Piroli (2021) Disertacion: Studim taksonomik dhe ekologjik i breshkave detare (Rendi Testudines) në Shqipëri. Tirane, 2021. Pp. 107 (https://api.fshn.edu.al/uploads/Vilma_Piroli_Doktorature_Biologji_f754e2627b.pdf).
Revelles M., Carona L., Aguilar A., Félix M.S. & Fernández G. (2007) ‘Habitat use by immature loggerhead sea turtles in the Algerian Basin (western Mediterranean): swimming behaviour, seasonality and dispersal pattern’ Marine Biology 151: 1501- 1515. DOI 10.1007/s00227-006-0602-z
Schofield G., Dimadi A., Fossette S., Katselidis K.A., Koutsoubas D., lilley M.K.S., Luckman A., Pantis J.D., Karagouni A.D. & Hays G. (2013) ‘Satellite tracking large numbers of individuals to infer population level dispersal and core areas for the protection of an endangered species’ Diversity and Distributions 19, 834 - 844
Snape R.T.E., Schofield G. & White M. (2019) ‘Delineating foraging grounds of a loggerhead turtle population through satellite tracking of juveniles’. Aquatic Conservation: Marine and Freshwater Ecosystems 1-7. DOI: 10.1002/aqc.3302
UNEP (2020) ‘Patok- Rodoni Bay: marine Survey in Albania in the Framework of the GEF Adriatic Project’. pp328
White M., Haxhiu I., Kararaj E., Mitro M., Petri L., Saçdanaku E., Trezhnjevna B., Boura L., Grimanis K., Robinson P., Venizelos L. (2011) ‘Monitoring and Conservation of Important Sea Turtle Feeding Grounds in the Patok Area of Albania 2008‐2010. Final Project Report.’ A project of MEDASSET in collaboration with H.A.S., Albania; University of Tirana; ECAT, Albania. Supported by: GEF/SGP, Tirana; RAC/SPA (UNEP/MAP); UNEP/MAP.
White M., Boura L., Venizelos L. (2013) ‘Population Structure for Sea Turtles at Drini Bay: An Important Nearshore Foraging and Developmental Habitat in Albania’. Chelonian Conservation and Biology, 12(2): 283–292.1
Yimaz C., Turkozan O., Bardakci F., White M. & Kararaj E. (2012) ‘Loggerhead turtles (Caretta caretta) foraging at Drini Bay in Northern Albania: Genetic characterisation reveals new haplotypes’ Acta Herpetological 7 (1): 155 – 162
Zbinden J.A., Aebischer A., Margaritoulis D. & Arlettaz R. (2008) ‘Important areas at sea for adult loggerhead sea turtles in the Mediterranean Sea: satellite tracking corroborates findings from potentially biased sources’ Marine Biology 153: 899- 906. DOI 10.1007/s00227-007-0862-2
ANNEXES
Annex I: Fieldwork Data Sheet
SECTION A: Survey Details
SECTION B: Water Transparency Readings
SECTION C: Human activities / impacts
Anthropogenic Activity Map (Example). Map generated in QGIS

Annex II: Water Transparency Categories’ as reviewed from the images.
CLEAR: Seafloor visible & clear

HAZY: Seafloor visible but features not well defined


CLOUDY: Only shadows visible
OPAQUE: No visibility
