MADISON HEIGHTS BRIEFING BOOK
PREPARED BY:

MADISON HEIGHTS
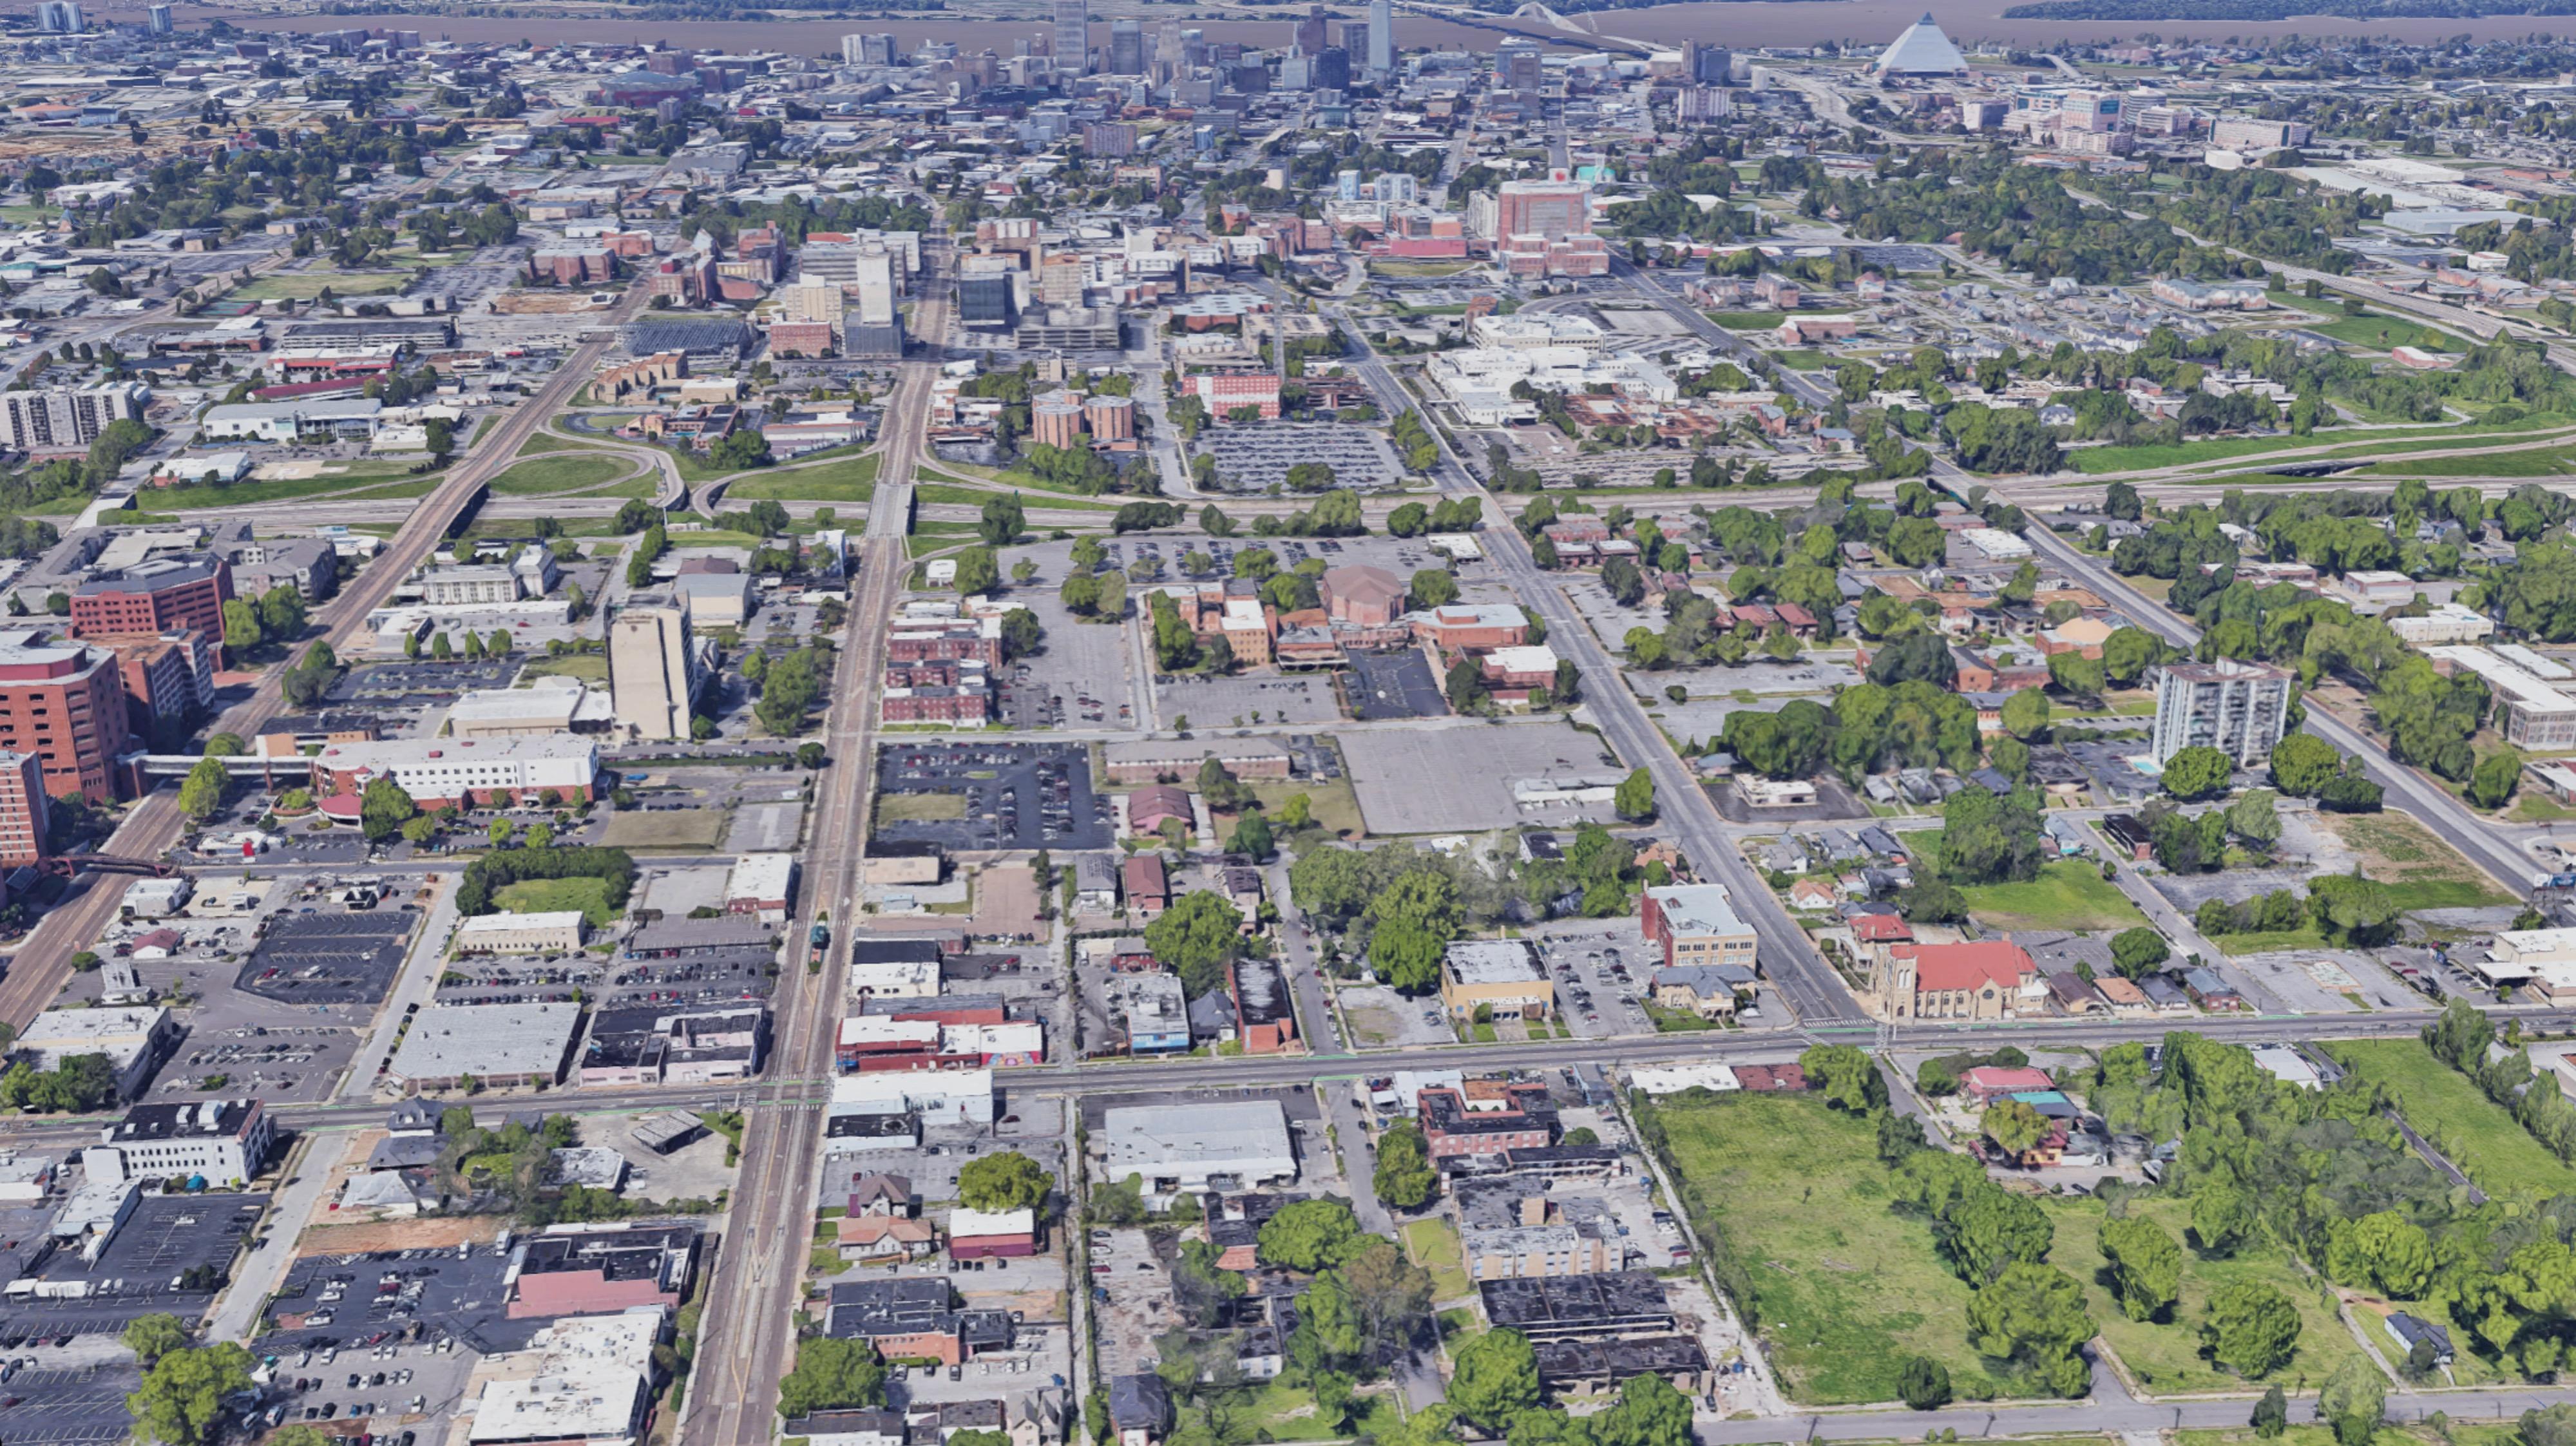
Madison Heights is one of Memphis’ more diverse neighborhoods: in terms of its history, its building stock, its businesses, its people – and its opportunities. Though few may use the name today, Madison Heights is a place steeped in history. The name has been used to describe the neighborhood since the late 1800’s, when it was still an independent township. Today, the neighborhood is the confluence point for where the more readily identified Crosstown, Midtown and Medical District areas meet.

For more information on the history of Madison Heights: https://www.highgroundnews.com /cities/madison-heights.aspx
INTRODUCTION
RAIN OR SHINE CELEBRATION
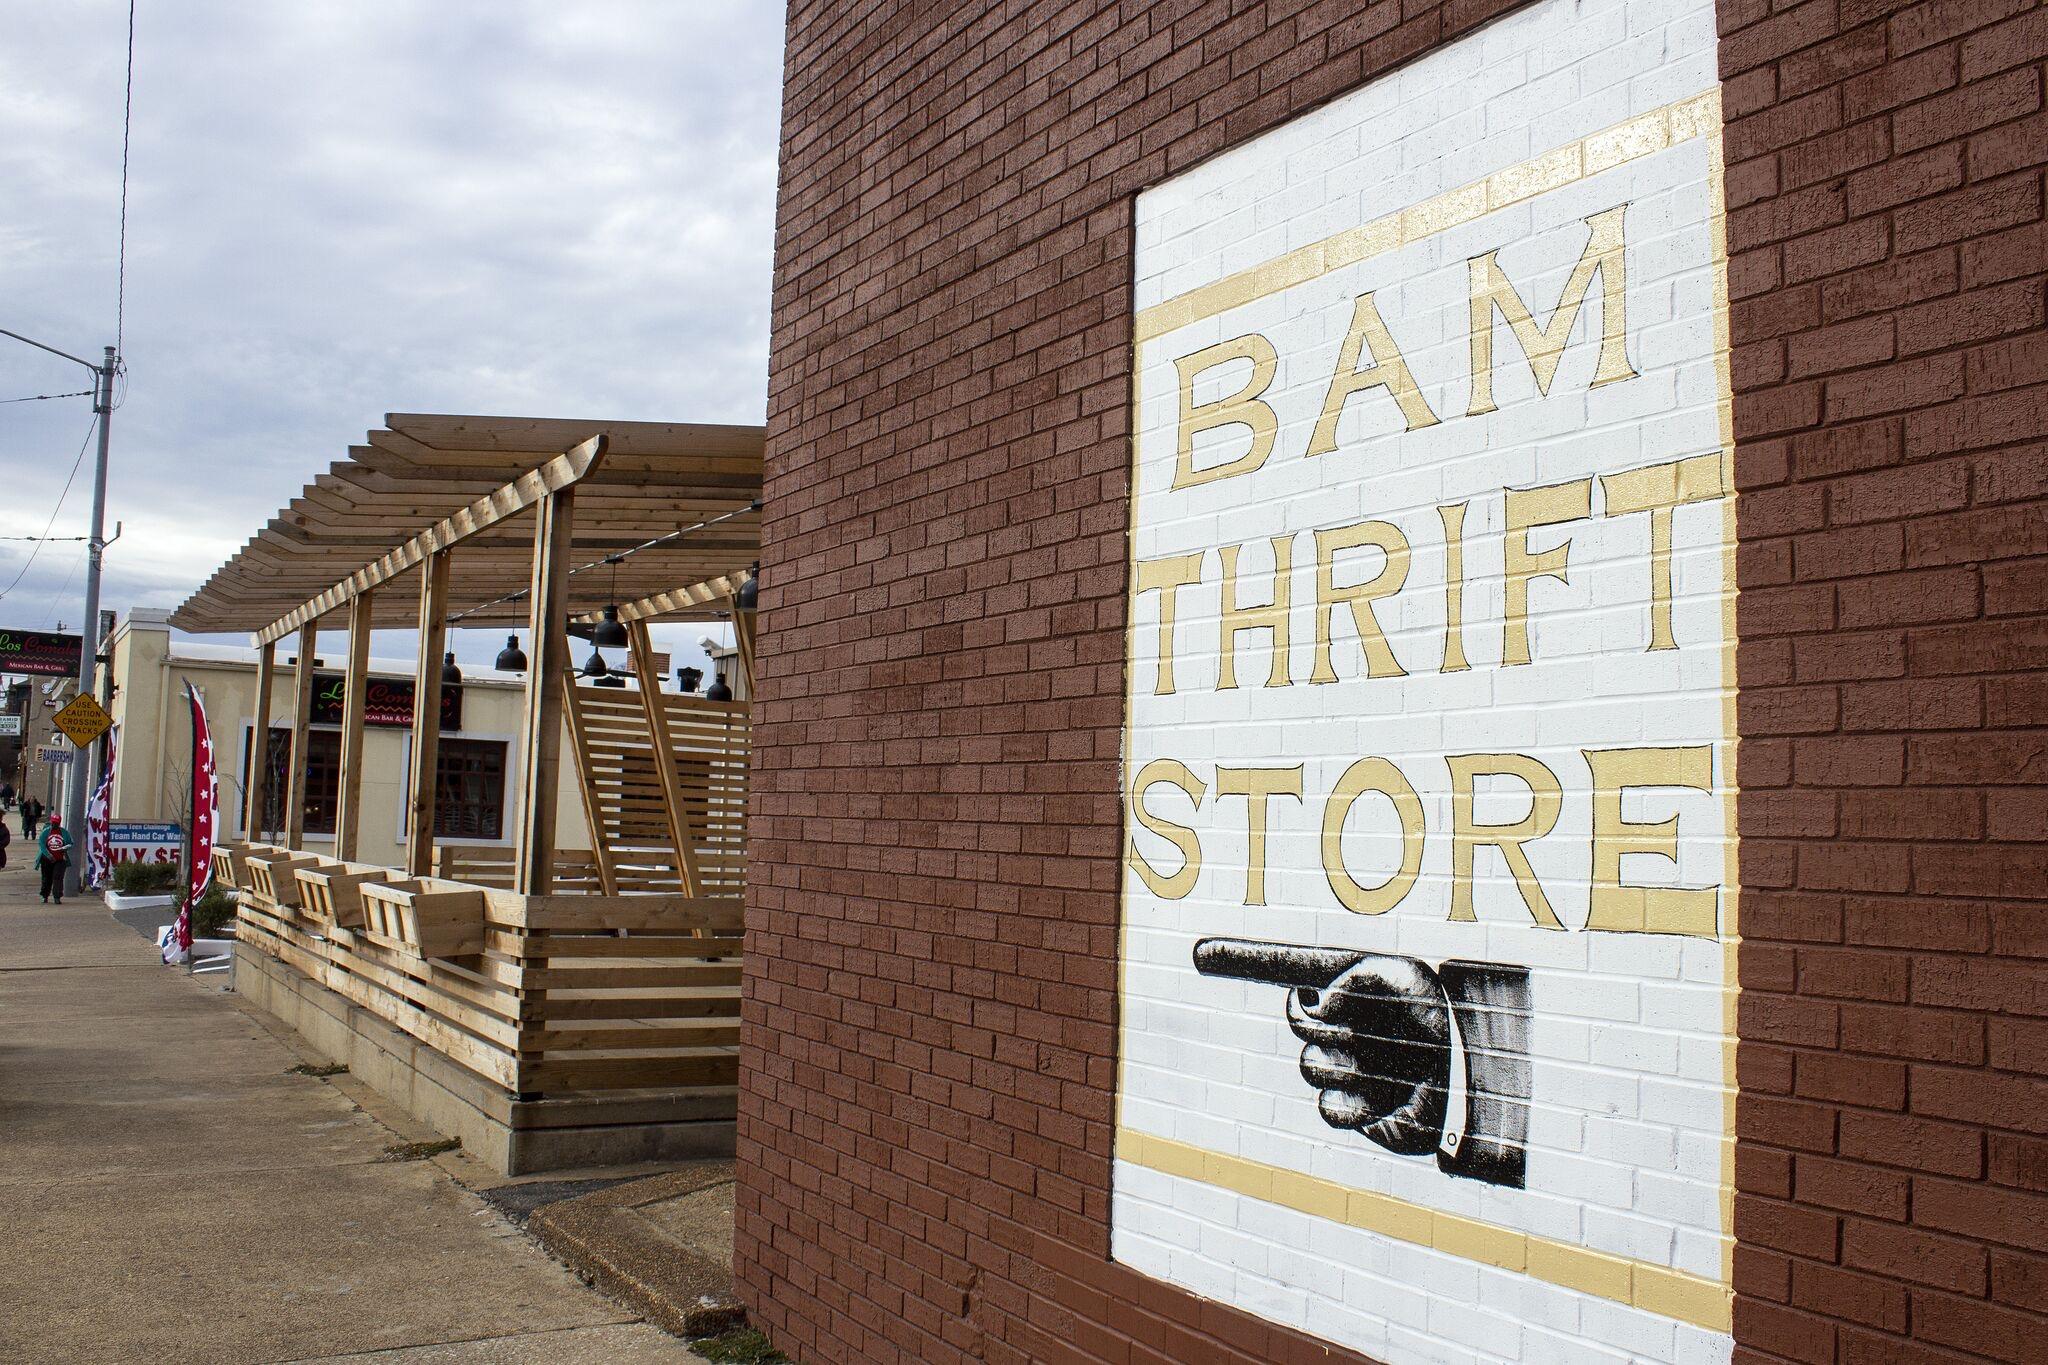
BAM THRIFT STORE
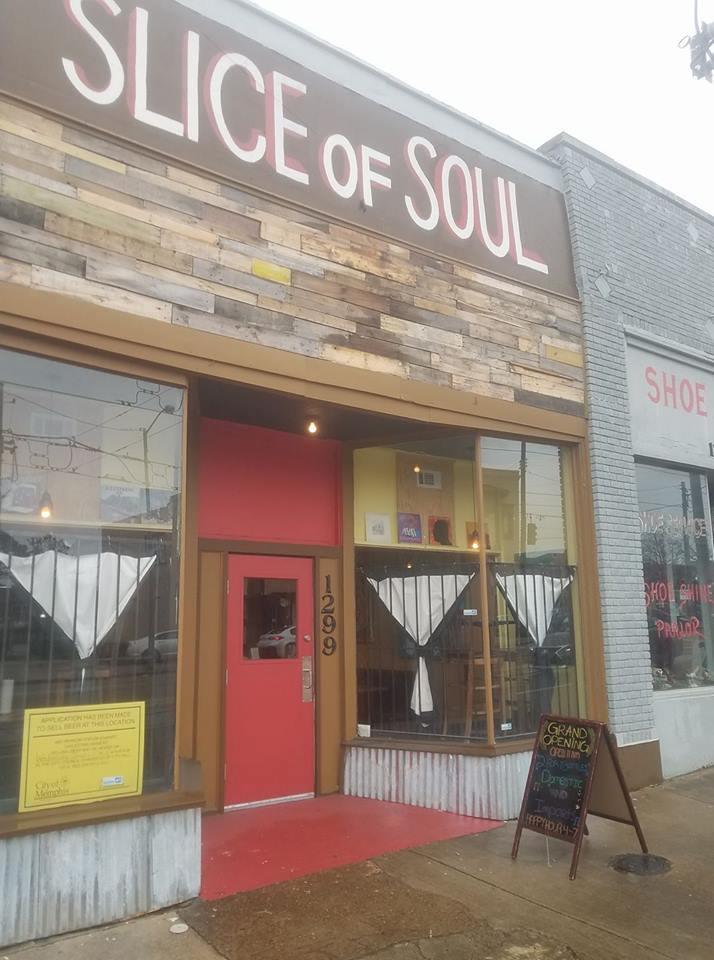
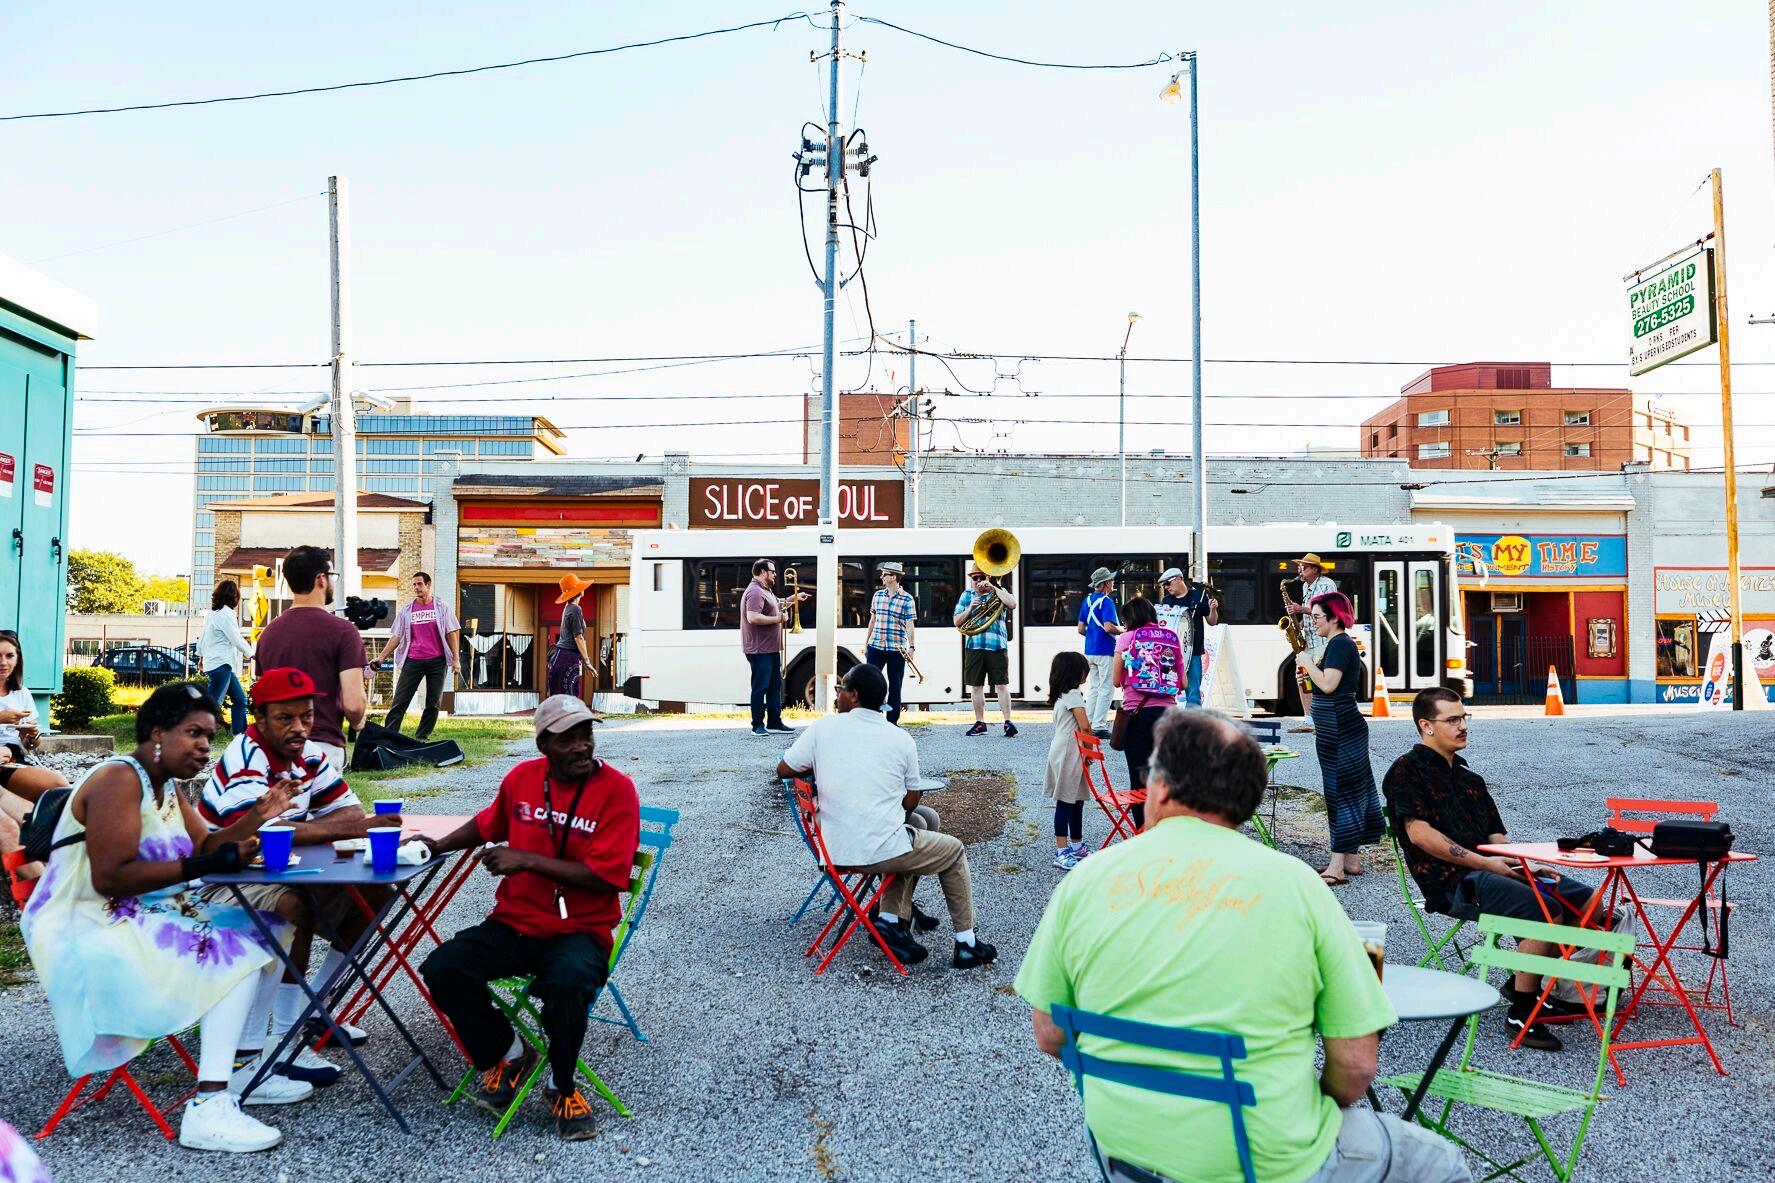
SLICE OF SOUL
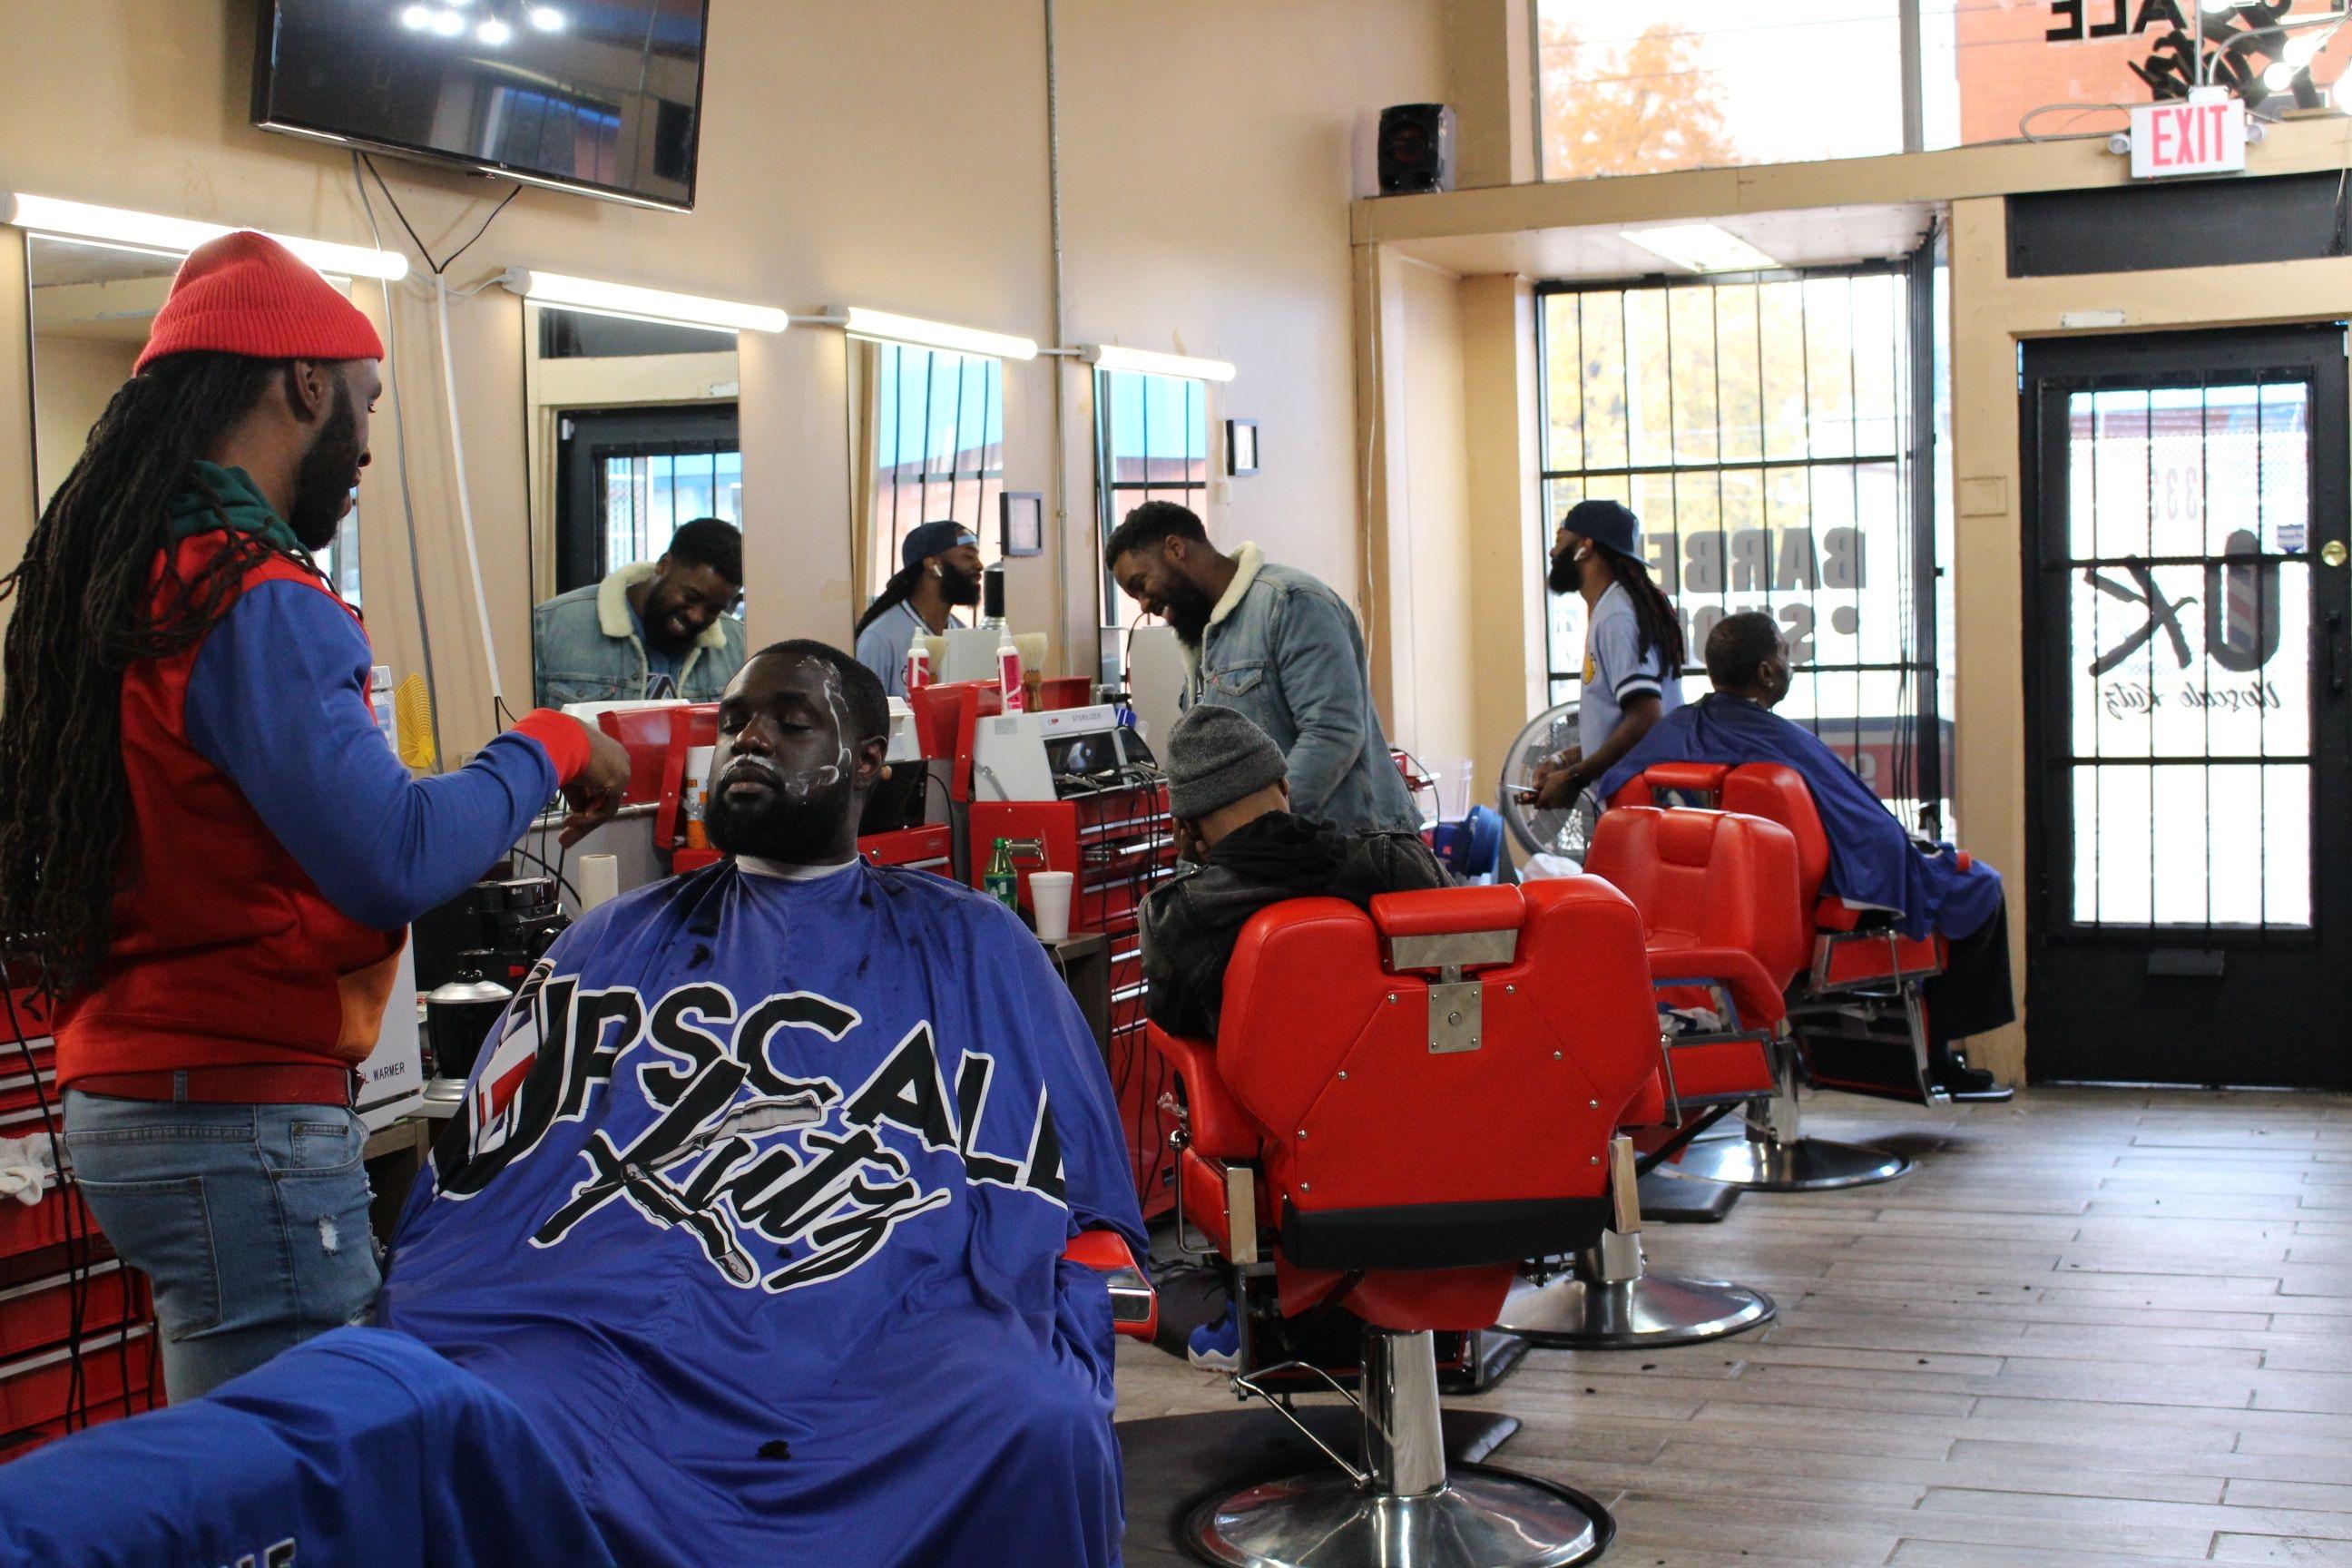
UPSCALE KUTZ
MEMPHIS MEDICAL DISTRICT
MADISON HEIGHTS BRIEFING BOOK
Study
Area Overview: Physical Description and Maps
Demographic & Housing Trends
Economic Trends

Development (Commercial and Residential)
MEMPHIS MEDICAL DISTRICT
MADISON
HEIGHTS BRIEFING BOOK
Appendix A: Previous Neighborhood Engagement
Appendix B: Additional Development Maps
Appendix C: Self-guided Neighborhood Tour

Addendum: Neighborhood Media Coverage
STUDY AREA OVERVIEW
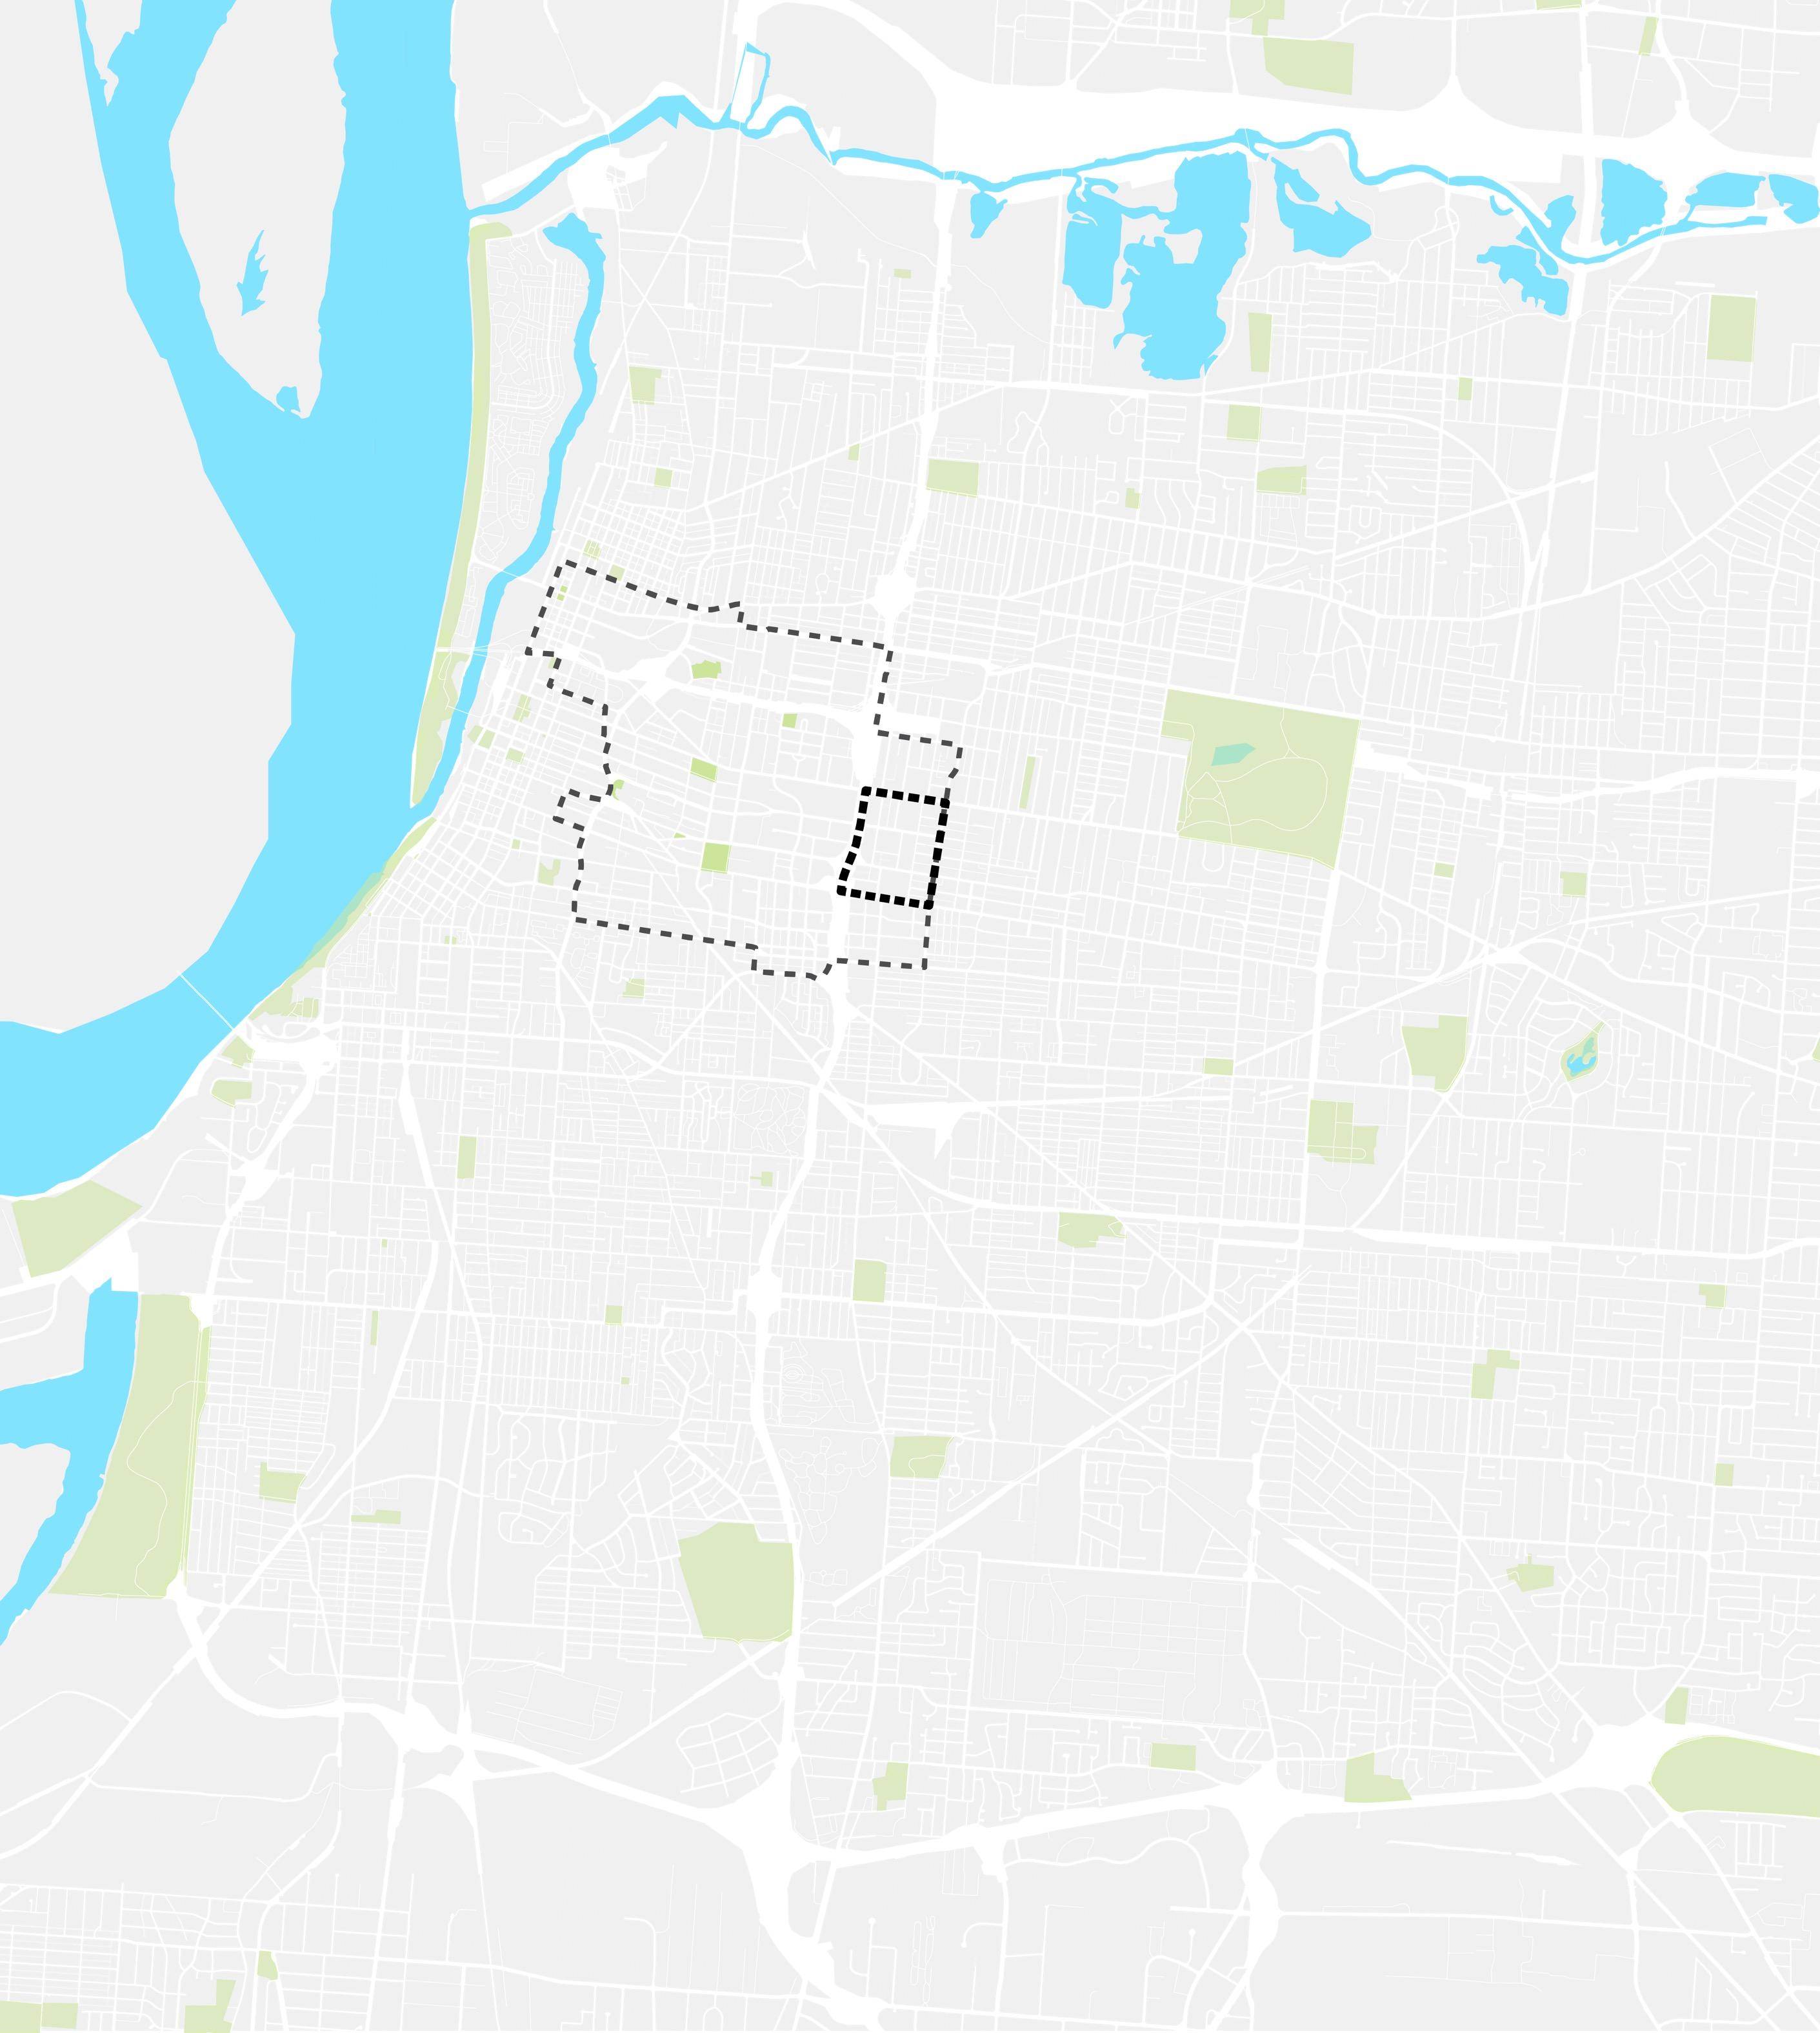
STUDY AREA
BOUNDARIES
The study area is a 124-acre site within the Madison Heights neighborhood, one of several distinct neighborhoods in the larger Medical District. It radiates from the intersection of Madison Avenue and Cleveland Street and includes a variety of land uses and shops, businesses, religious and educational institutions, service organizations and a small residential mix of apartments and homes. The boundaries of the study lie between Cleveland Street and Interstate-240 (east-west) and Poplar and Union avenues (north-south).
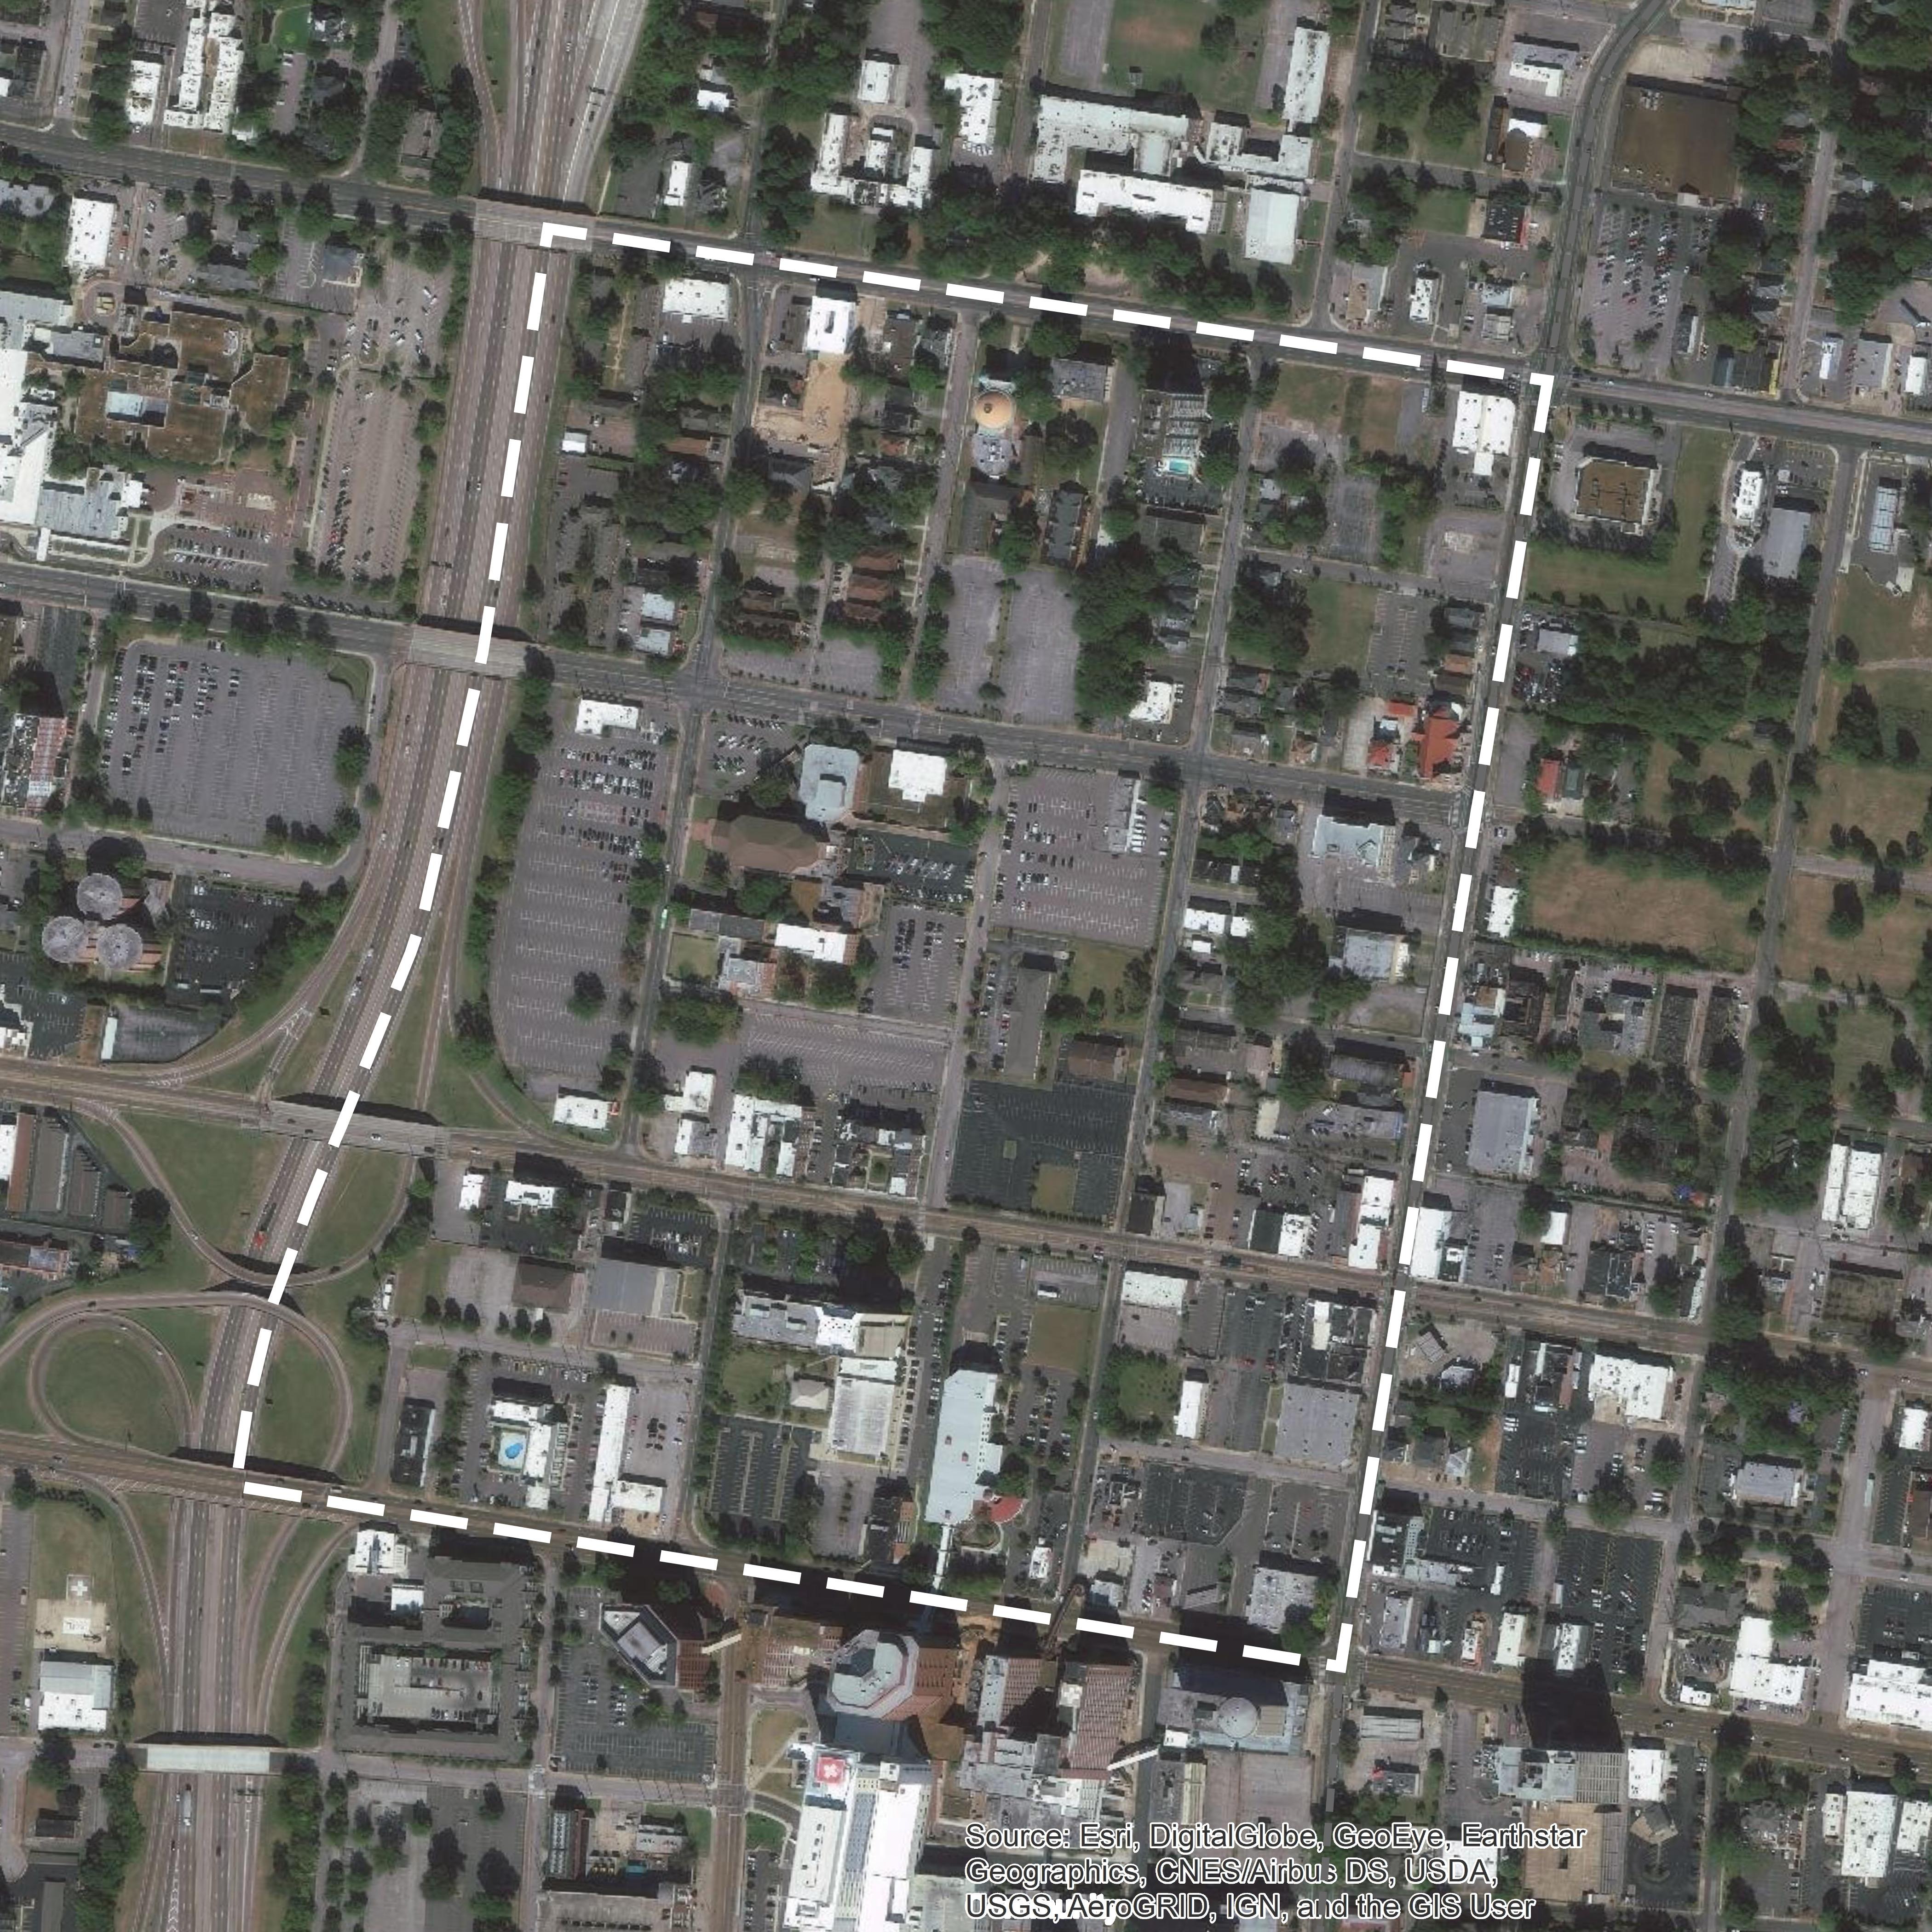
OVERVIEW
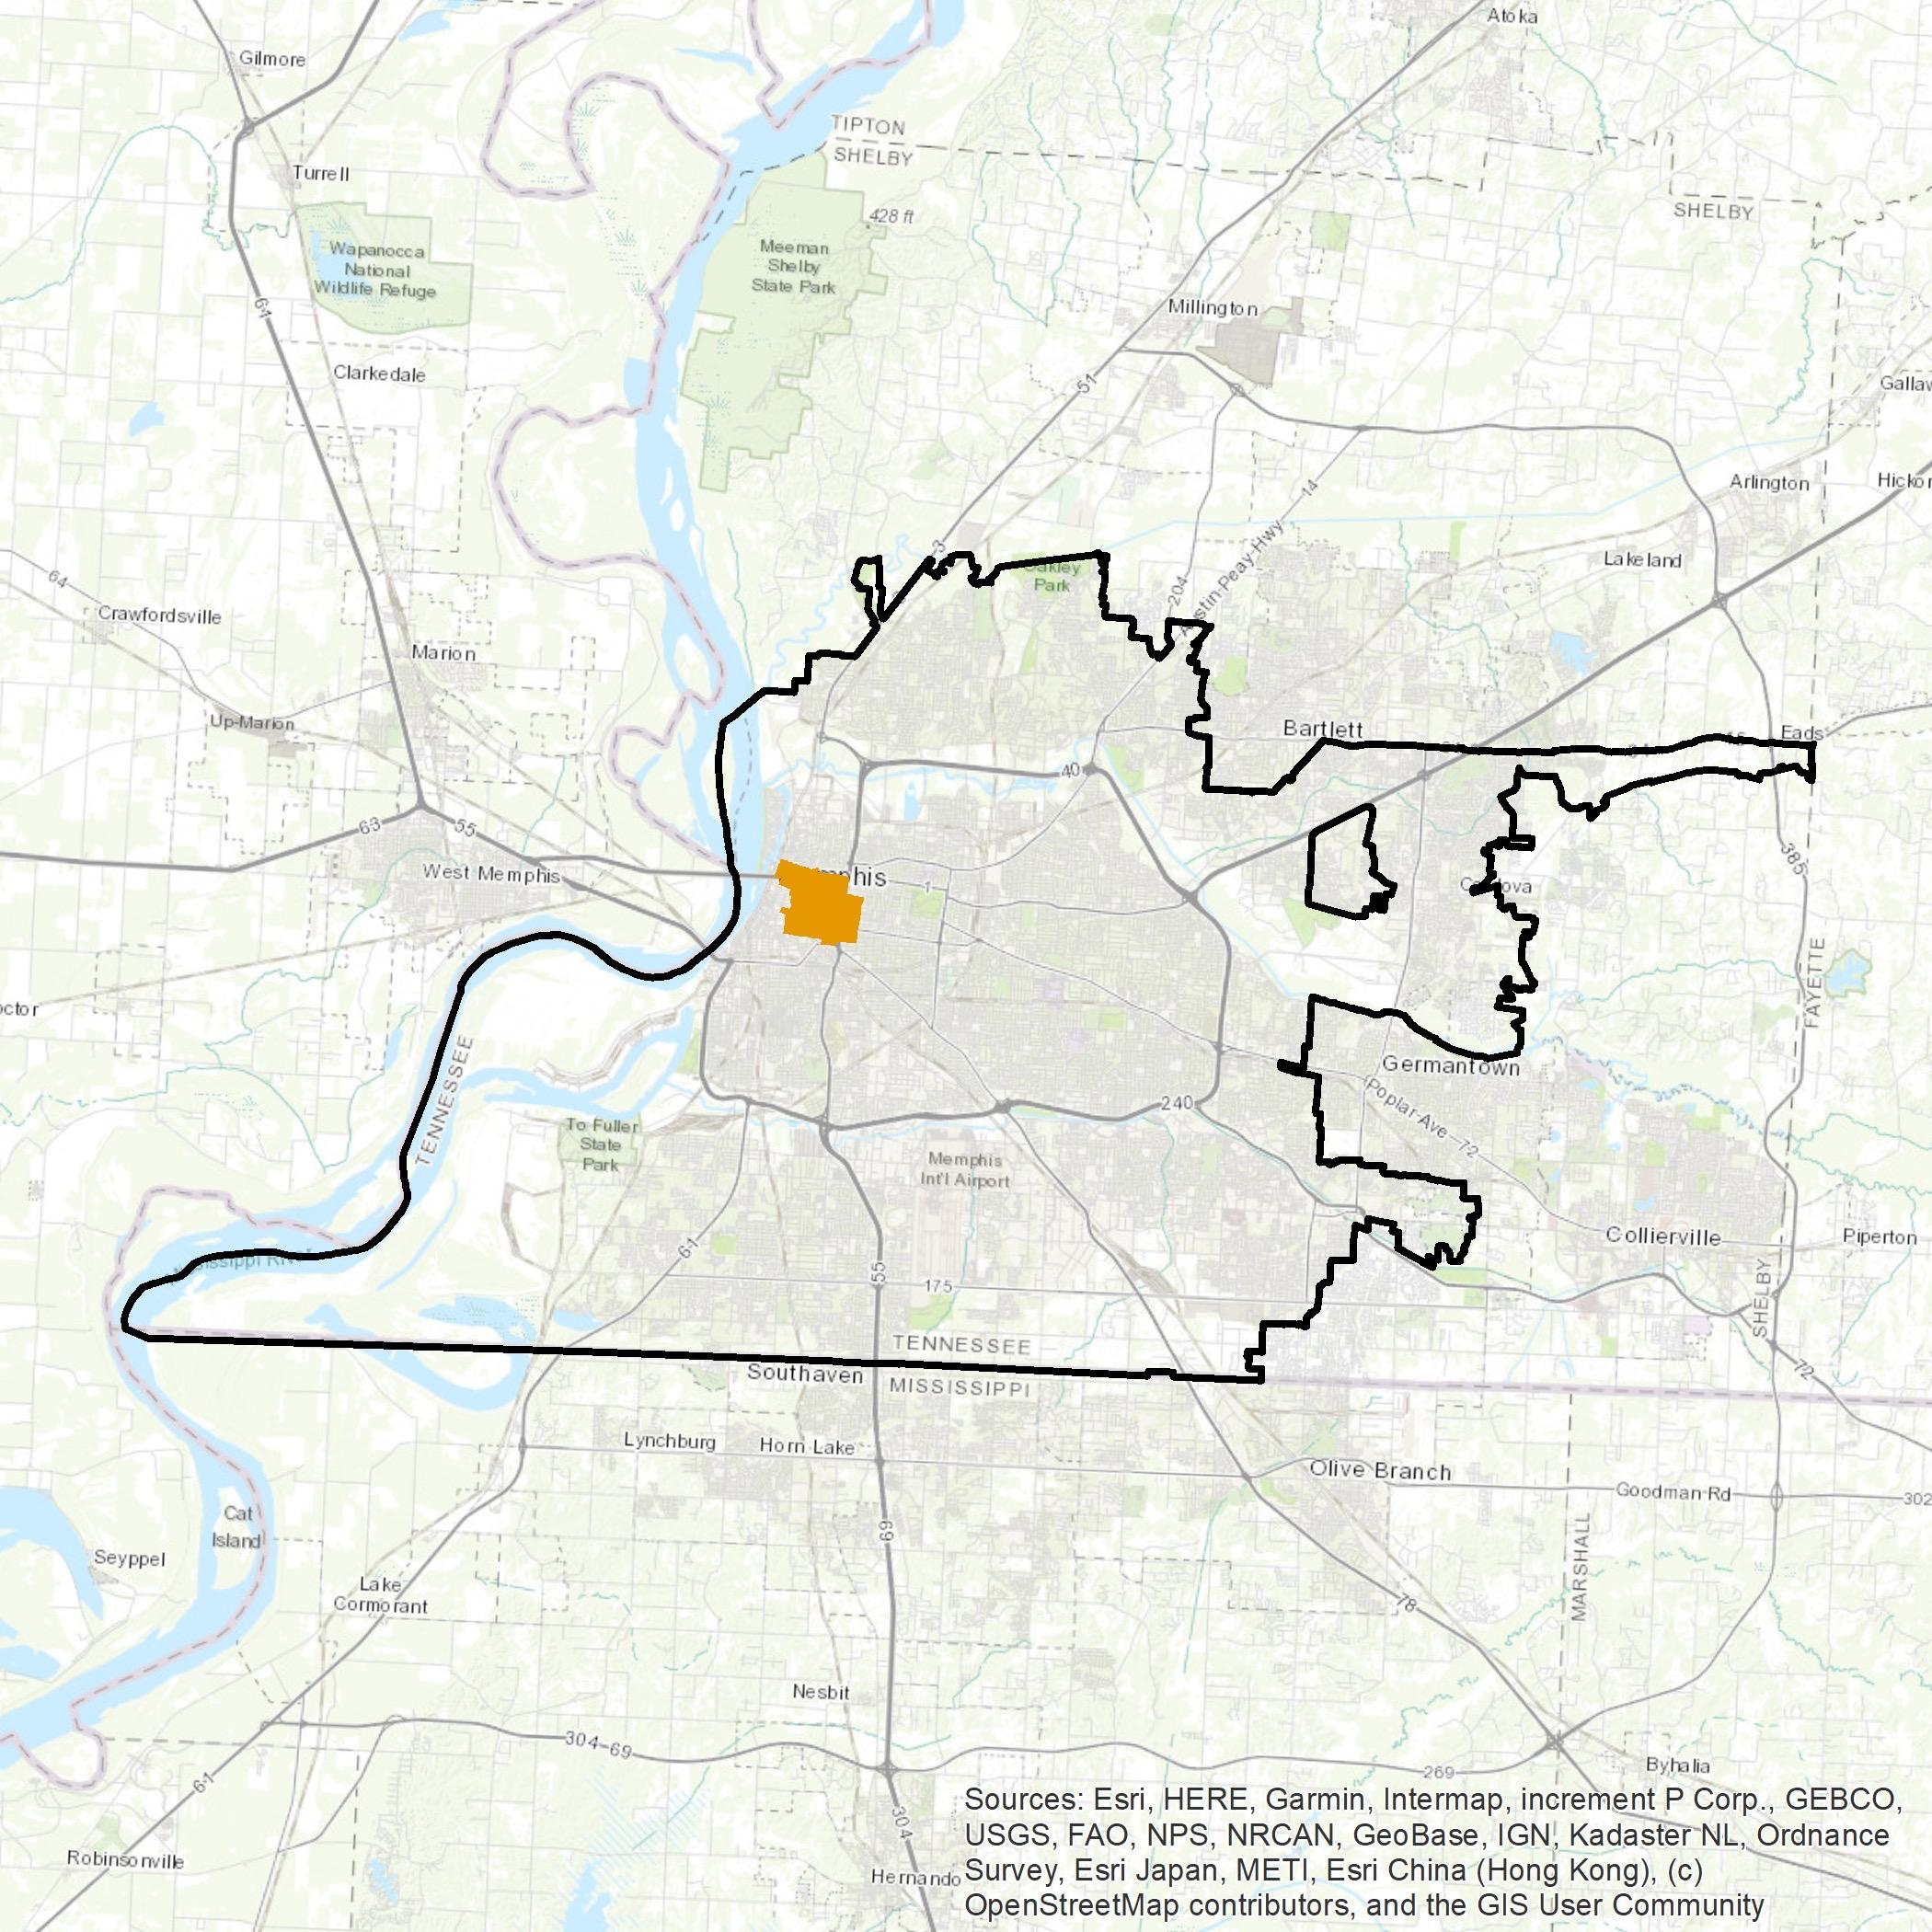
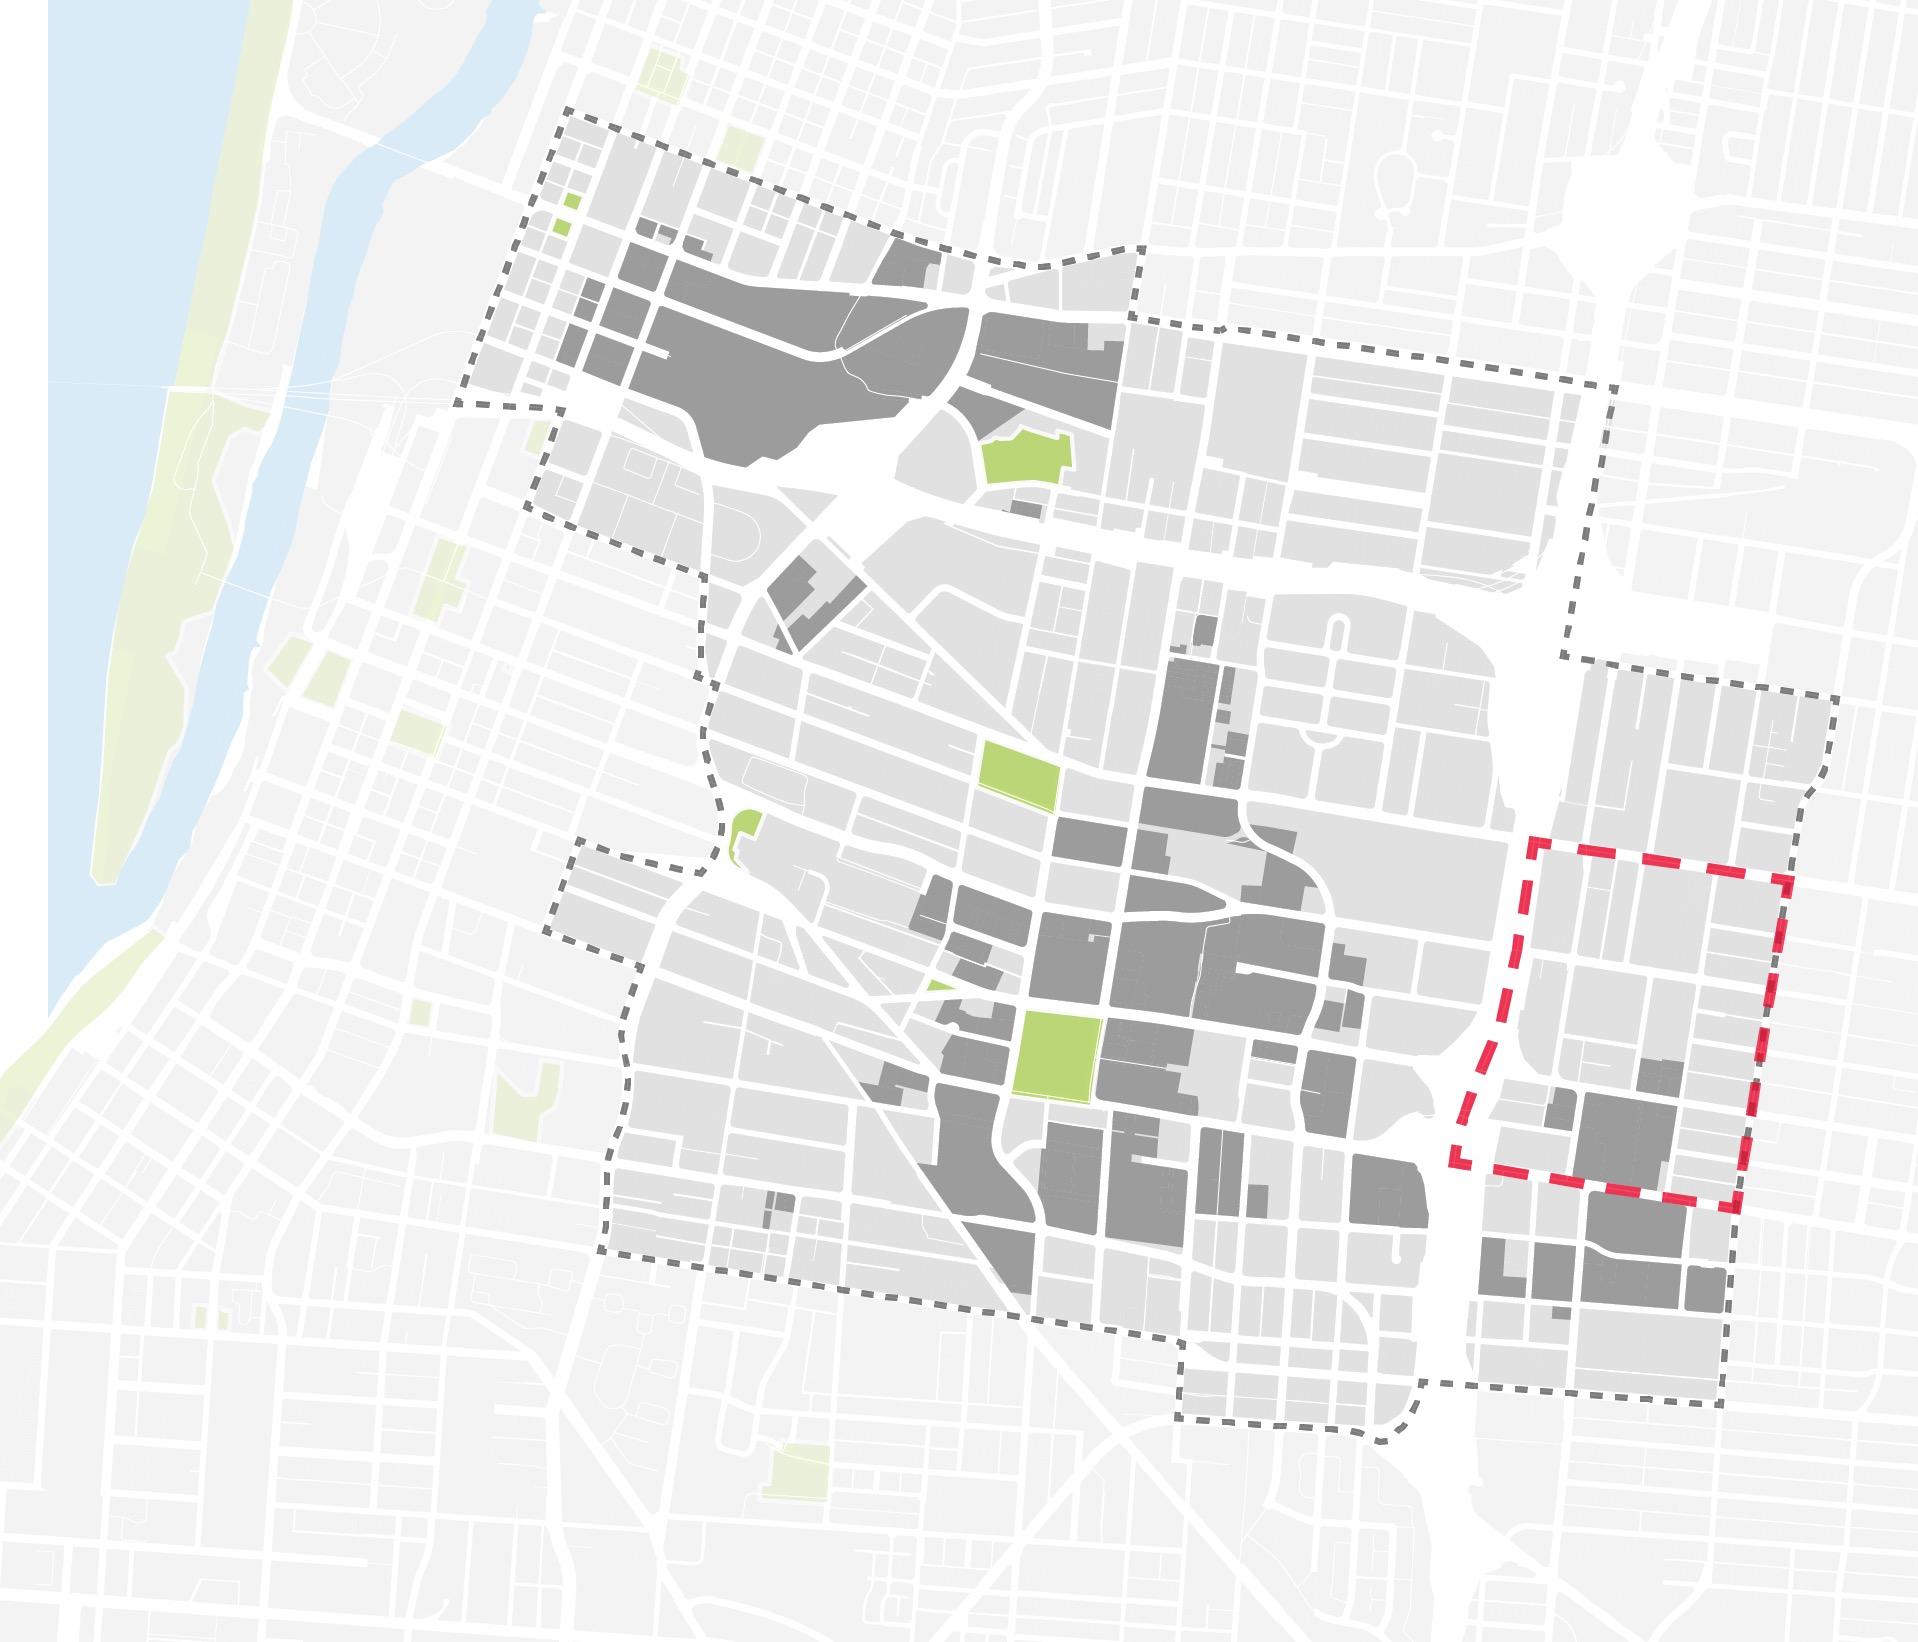
ANALYSIS BOUNDARIES
City: Memphis, TN
District: Memphis Medical District
The Study Area: Madison Heights
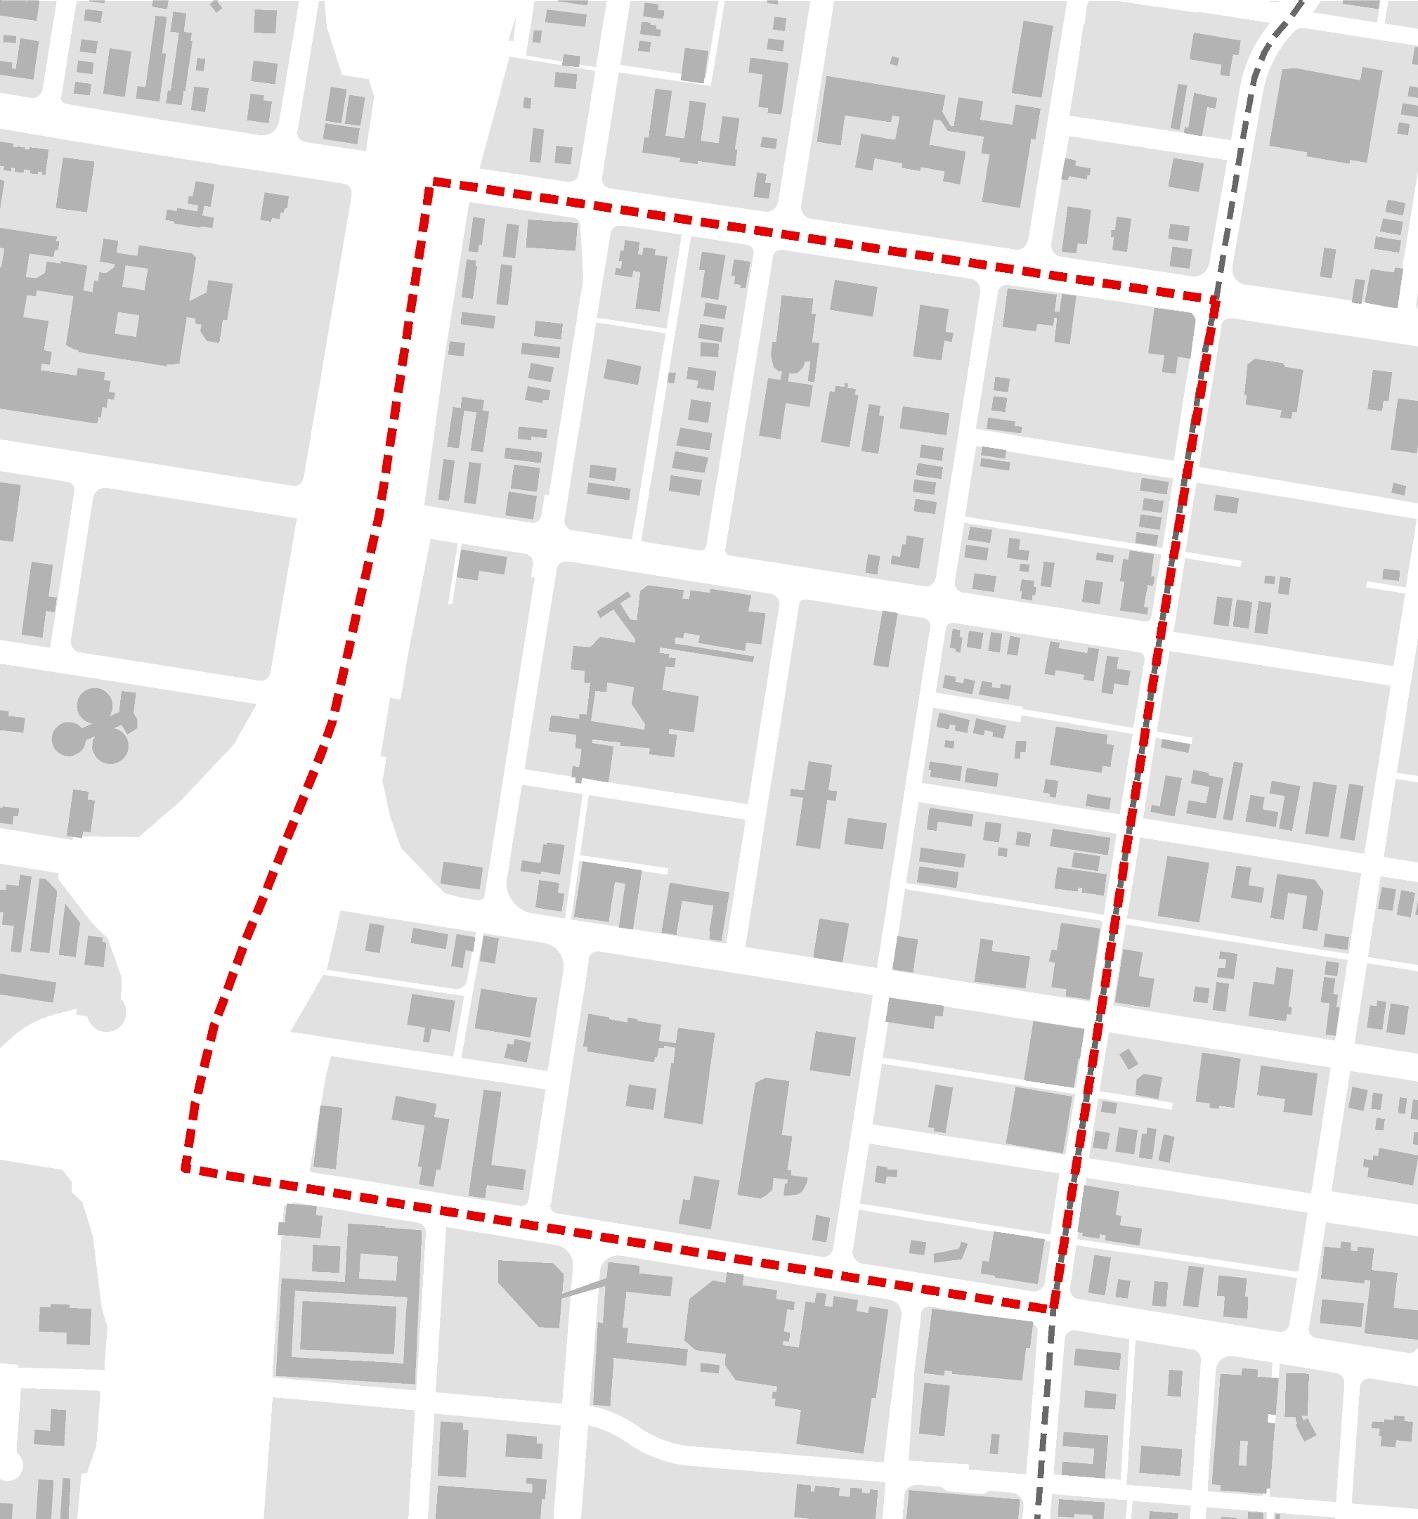
AREA OVERVIEW
STUDY
LAND USE
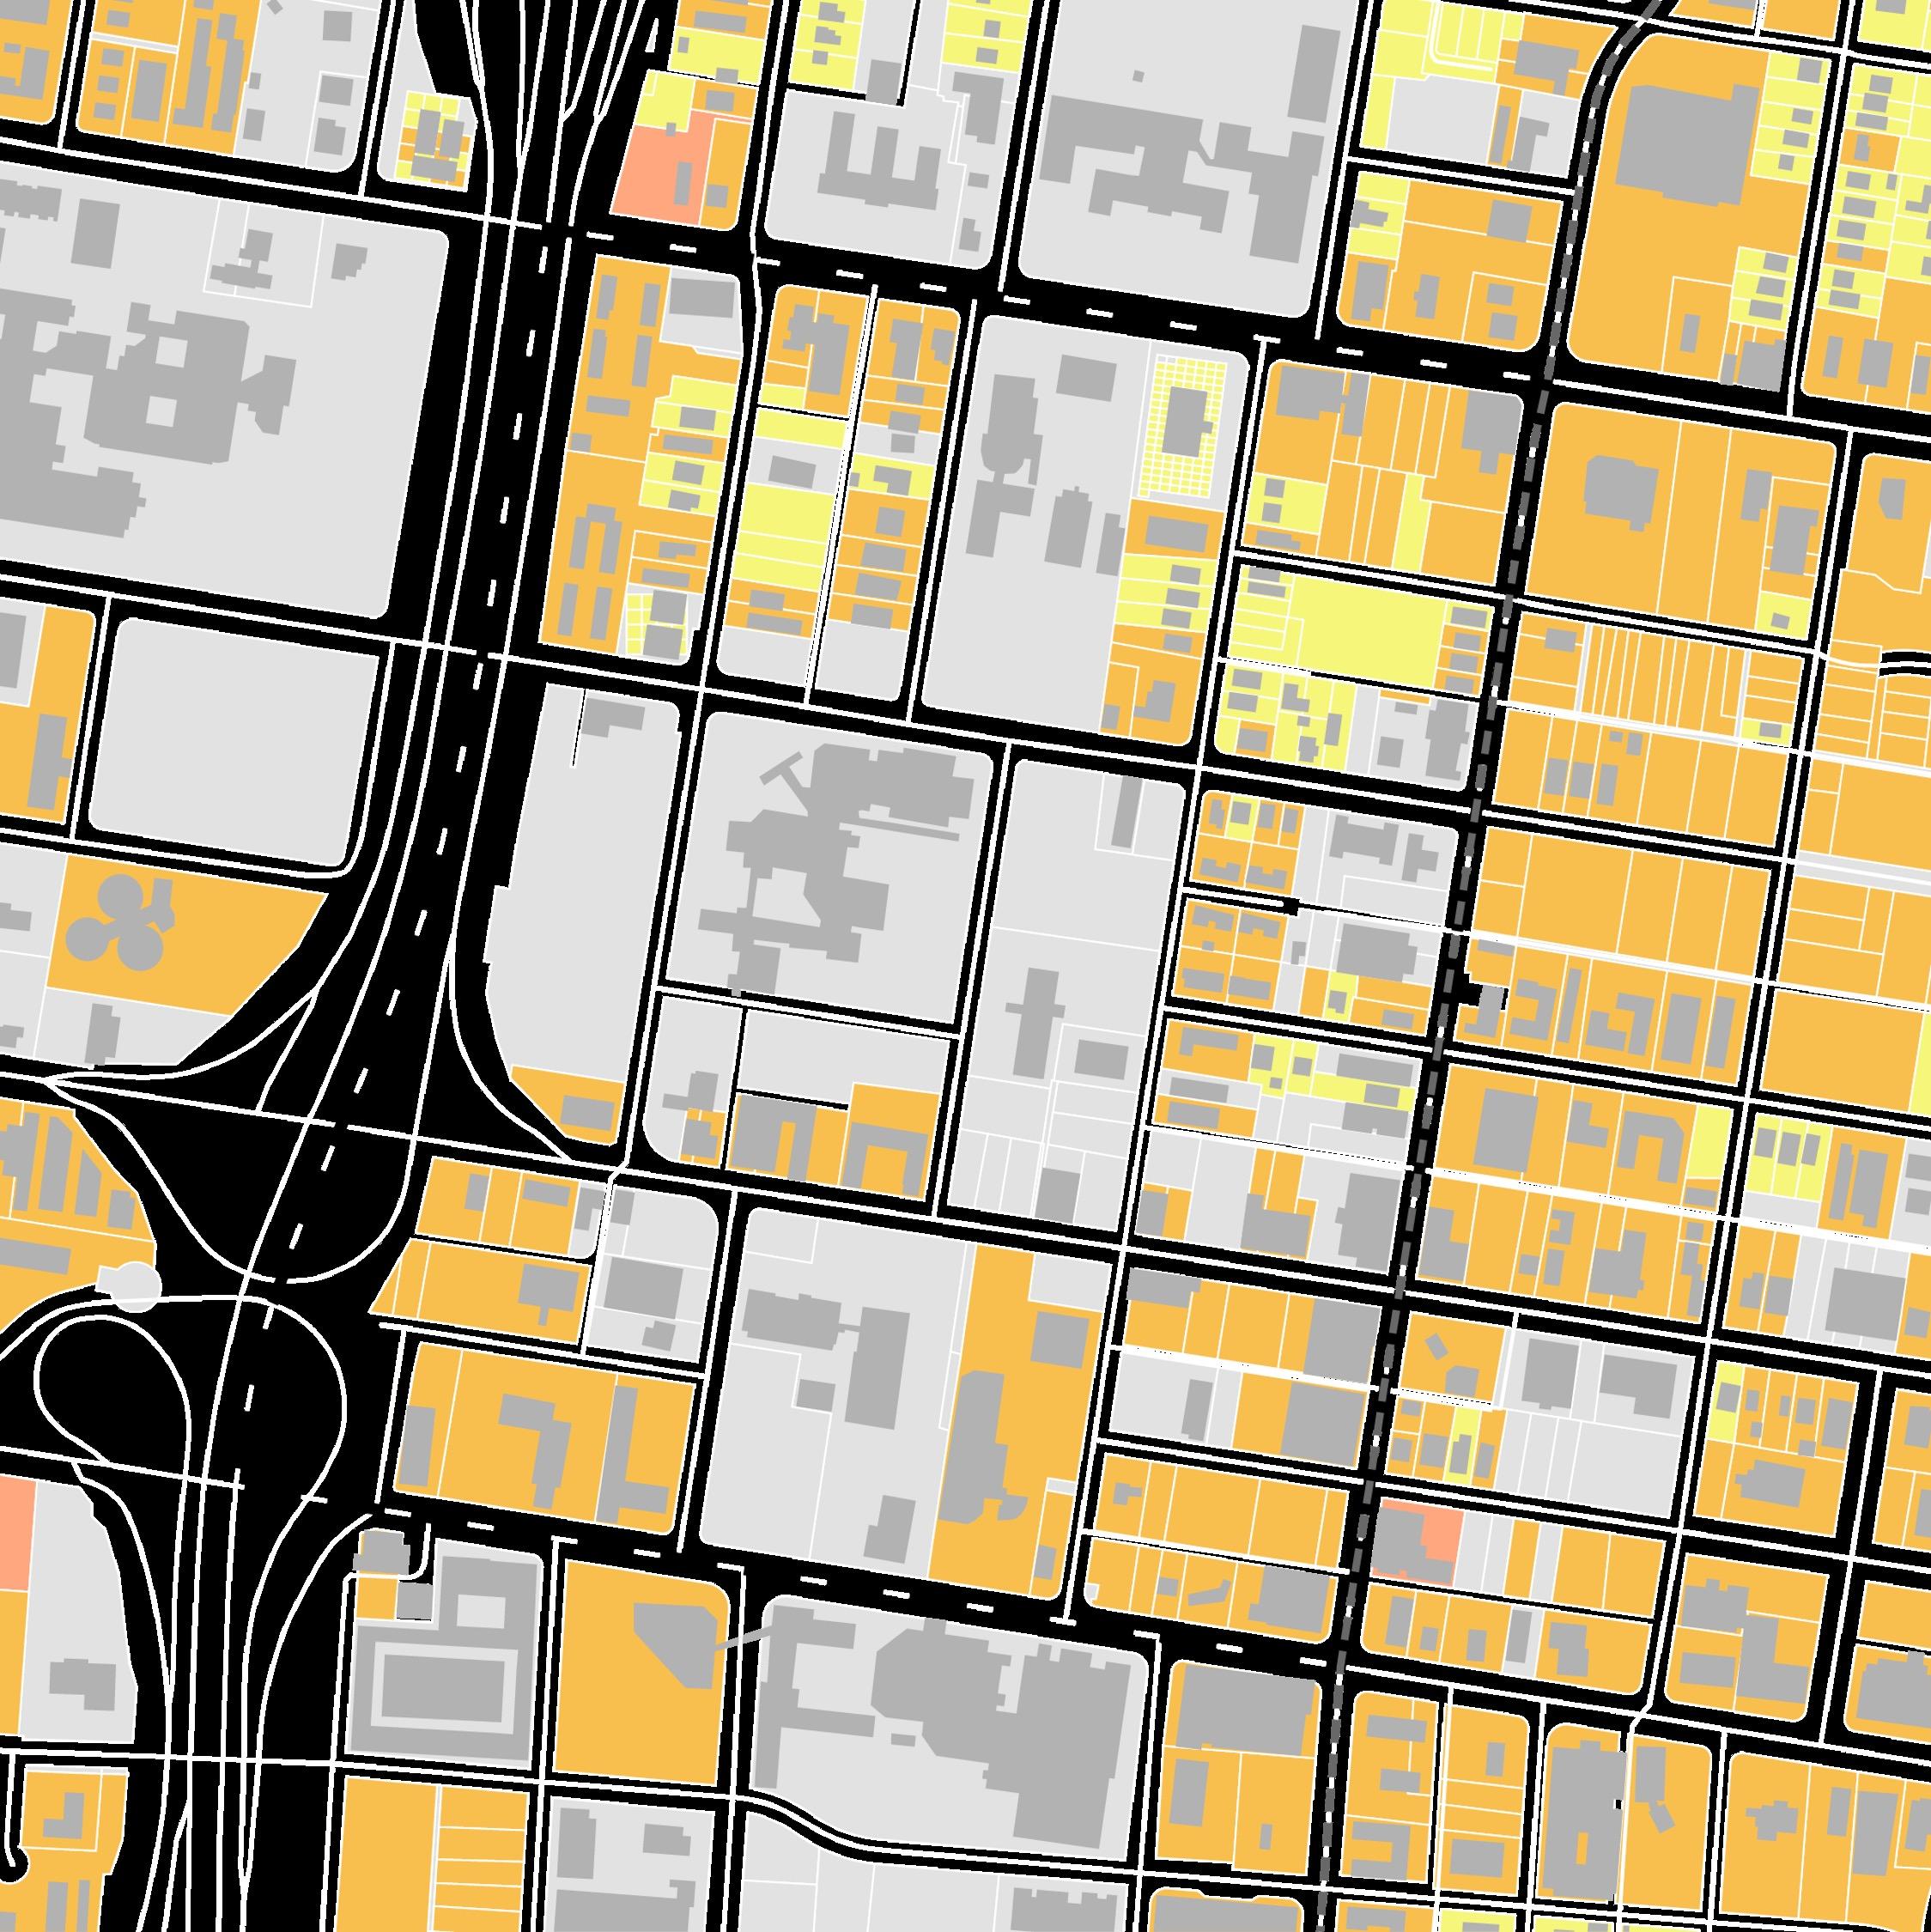
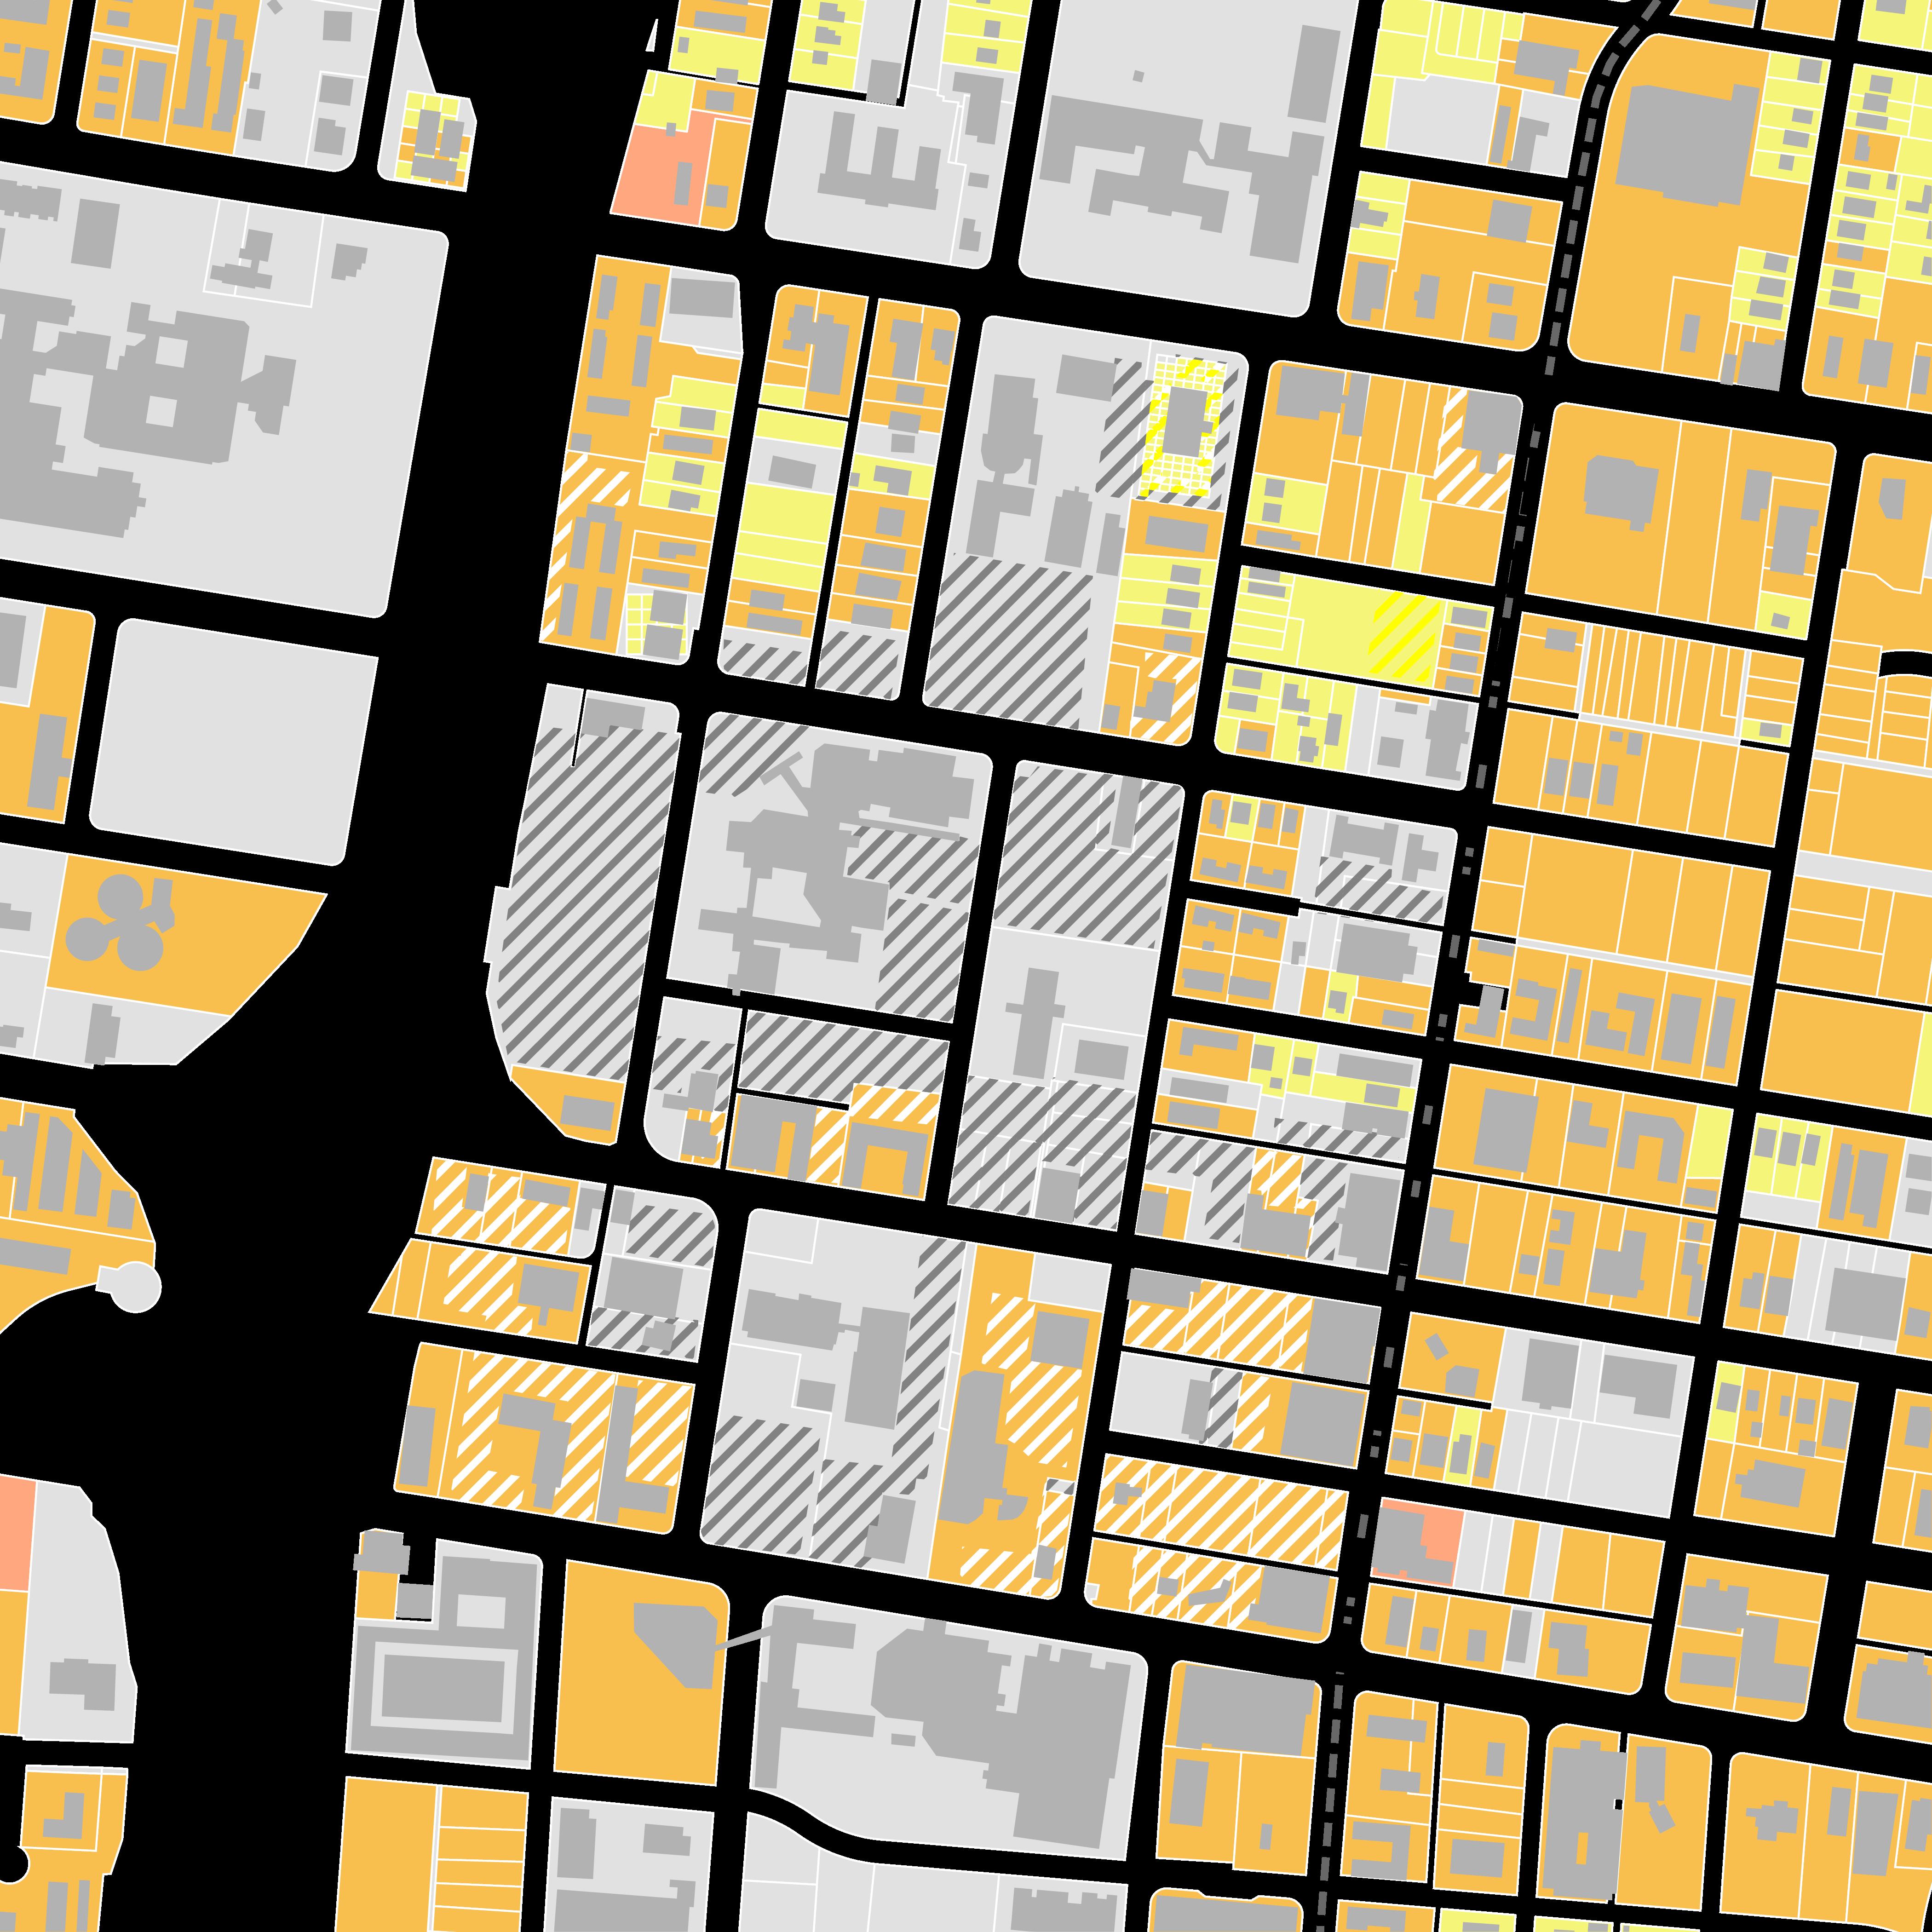
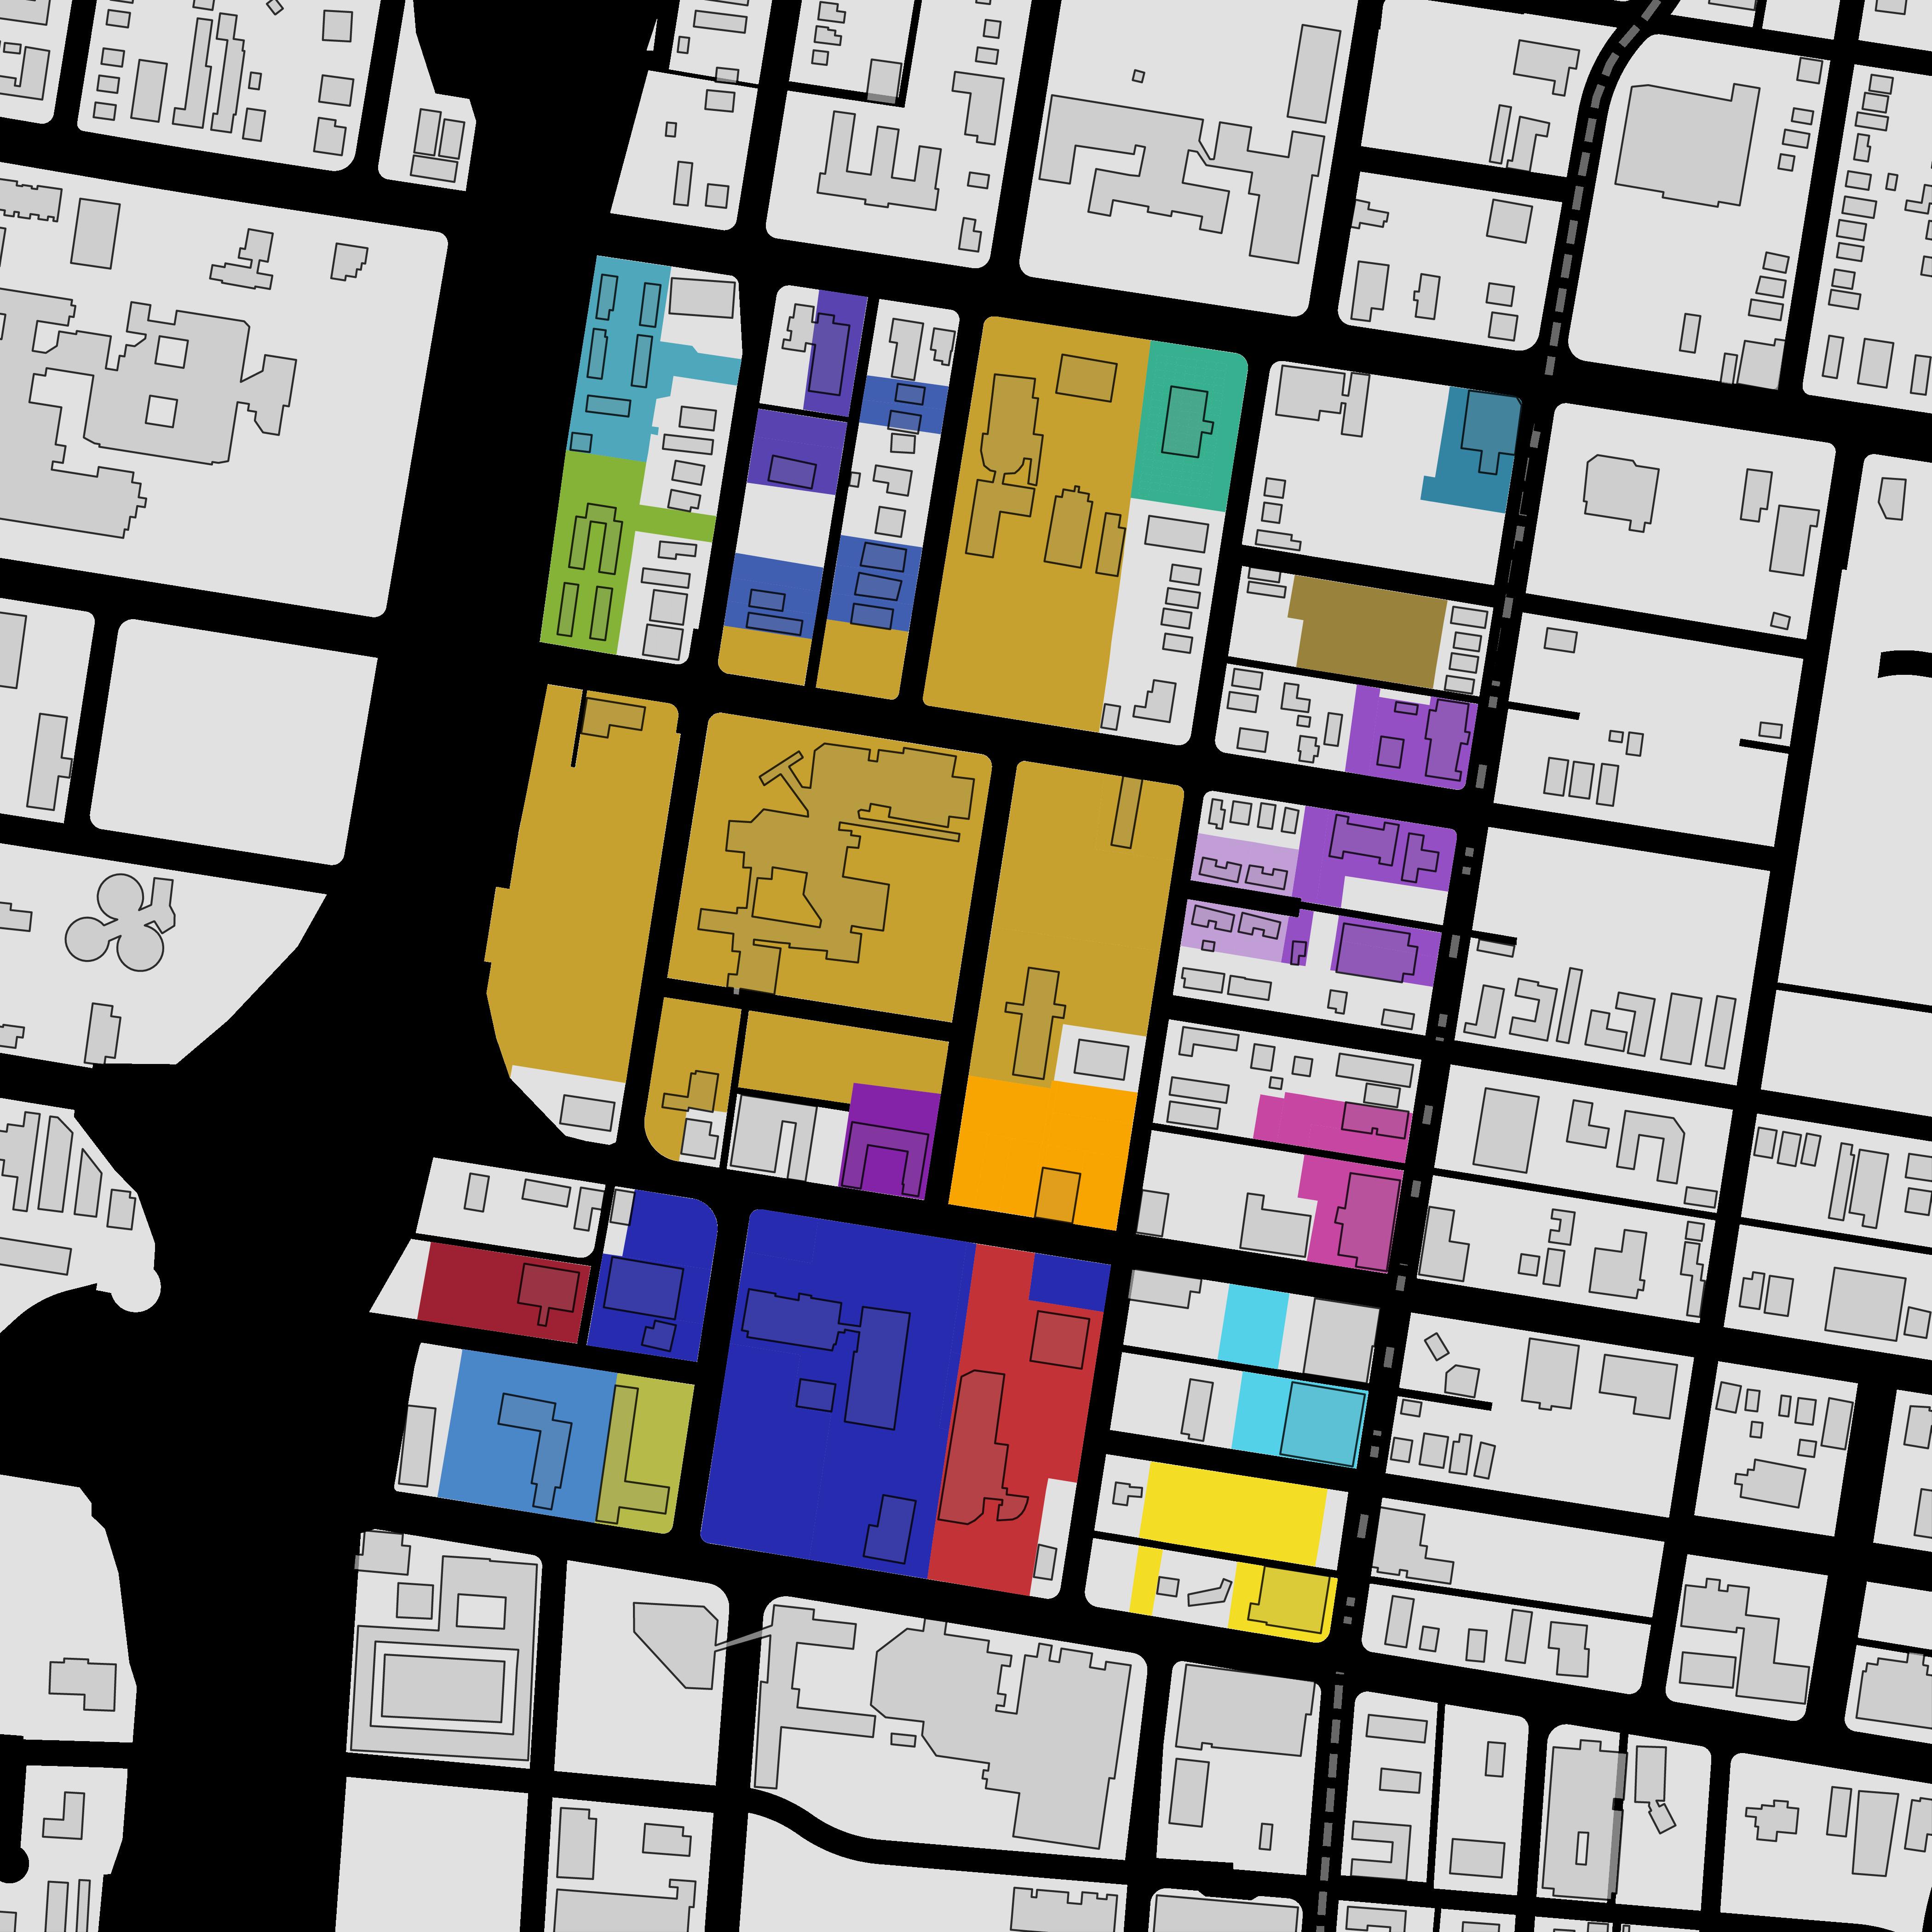
Over half of parceled land within the study area is taxexempt. Most of that tax-exempt land is owned by religious/charitable institutions, such as the Mississippi Blvd Christian Church, which owns over half of tax-exempt land, and educational institutions such as the Southern College of Optometry, which owns 22% of tax-exempt land.




STUDY AREA OVERVIEW
69 24 0 PoplarAve Jefferson Ave Madison Ave Dr M.L.K . Jr. Expy N Bellevue Blvd N Montgomery St N Claybrook St N Cleveland St S Cleveland St N Montgomery St S Bellevue Blvd S Claybrook St Monroe Ave Monroe Ave Court Ave WashingtonAve Landuse 52% (46 Acres) Exempt Land (Non-profit, charitable and other tax exempt institutions) 52% (35 Acres) Commercial/Mixed Use 9% (8 Acres) Residential Methodist University Hospital Southern College of Optometry Holiday Inn Express Memphis Holiday Inn Express Memphis Mississippi Boulevard Christian Church Poston Senior Housing Memphis Academy of Science and Engineering
Union Ave Sources: City of Memphis, 2018 Union Ave
UNENCUMBERED LAND
There is nearly 40 acres of land that is dedicated to


69 24 0 PoplarAve Jefferson Ave Madison Ave Dr M.L.K.Jr. Expy N Bellevue Blvd N Montgomery St N Claybrook St N Cleveland St S Cleveland St N Montgomery St S Bellevue Blvd S Claybrook St Monroe Ave Monroe Ave Court Ave WashingtonAve
Exempt Parking profit, charitable and other tax exempt institutions) Union Ave
STUDY AREA OVERVIEW
69 24 0 PoplarAve Jefferson Ave Madison Ave Dr M.L.K.Jr. Expy N Bellevue Blvd N Montgomery St N Claybrook St N Cleveland St S Cleveland St N Montgomery St S Bellevue Blvd S Claybrook St Monroe Ave Monroe Ave Court Ave WashingtonAve Map Label Map Color Owner Number of Parcels Total Acres % Mississippi Boulevard Christian Church 11 26.0 29% Southern College Of Optometry 9 9.0 10% Methodist Hospital 1 3.5 4% Dozier Carroll T Rev Bishop 7 2.6 3% Whalebone Limited Partnership 1 2.2 2% Southern College Optometry 10 2.1 2% First National Bank Of Memphis 5 2.0 2% District Apartments LLC 1 1.7 2% Napier (William, Patsy, Investment Company) 8 1.6 2% HDH LLC 1 1.6 2% Teen Challenge Of Memphis Inc 4 1.6 2% Bryton Tower Condos 128 1.4 2% MSDG Memphis Downtown LLC 2 1.3 1% Roman Catholic Diocese Of Mphs 1 1.2 1% National Retail Properties Inc 1 1.2 1% Memphis Center For Reproductive Health 3 1.1 1% BHW Union LLC 1 1.1 1% D T Associates LLC 4 0.9 1% Johnson Aldred K 1 0.9 1% ARC Rnmphtn001 LLC 1 0.8 1% 1 2 3 4 5 6 7 8 9 10 11 12 13 14 15 16 17 18 19 20 1 2 3 4 5 6 7 8 9 10 11 12 13 14 15 16 17 18 19 20 Union Ave
OWNERSHIP
THE DISTRICTS
The study area is within the Memphis Medical District and The Central Business Improvement District in the East Midtown area of Memphis.
‣ Memphis Medical District Collaborative (MMDC): MMDC is a community development organization working with partners to strengthen the communities in the Memphis Medical District so that they are more vibrant, prosperous and equitable. MMDC is involved in over 20 programs and initiatives in the District. MMDC has been an integral part of prior planning and activation exercises in Madison Heights, helping convene community-driven programs such as MEMFix and Creatives in Immersion with High Ground News. MMDC also offers continuous small business assistance in the neighborhood through its incentives and grants program.
‣ CBID Downtown Memphis Commission: The mission of the Downtown Memphis Commission (DMC) is to improve the economy of Memphis and Shelby County by coordinating an aggressive public/private program to promote the redevelopment and economic growth of the Central Business Improvement District (CBID), the area referred to as "Downtown.” Within the CBID geography, taxable commercial properties appraised at greater than $25,000 are included in the special assessment district, and the first $25,000 of appraised value on all commercial properties is exempt from the assessment. The assessment does not apply to residential properties, churches, or other tax-exempt properties, or commercial properties appraised at less than $25,000.
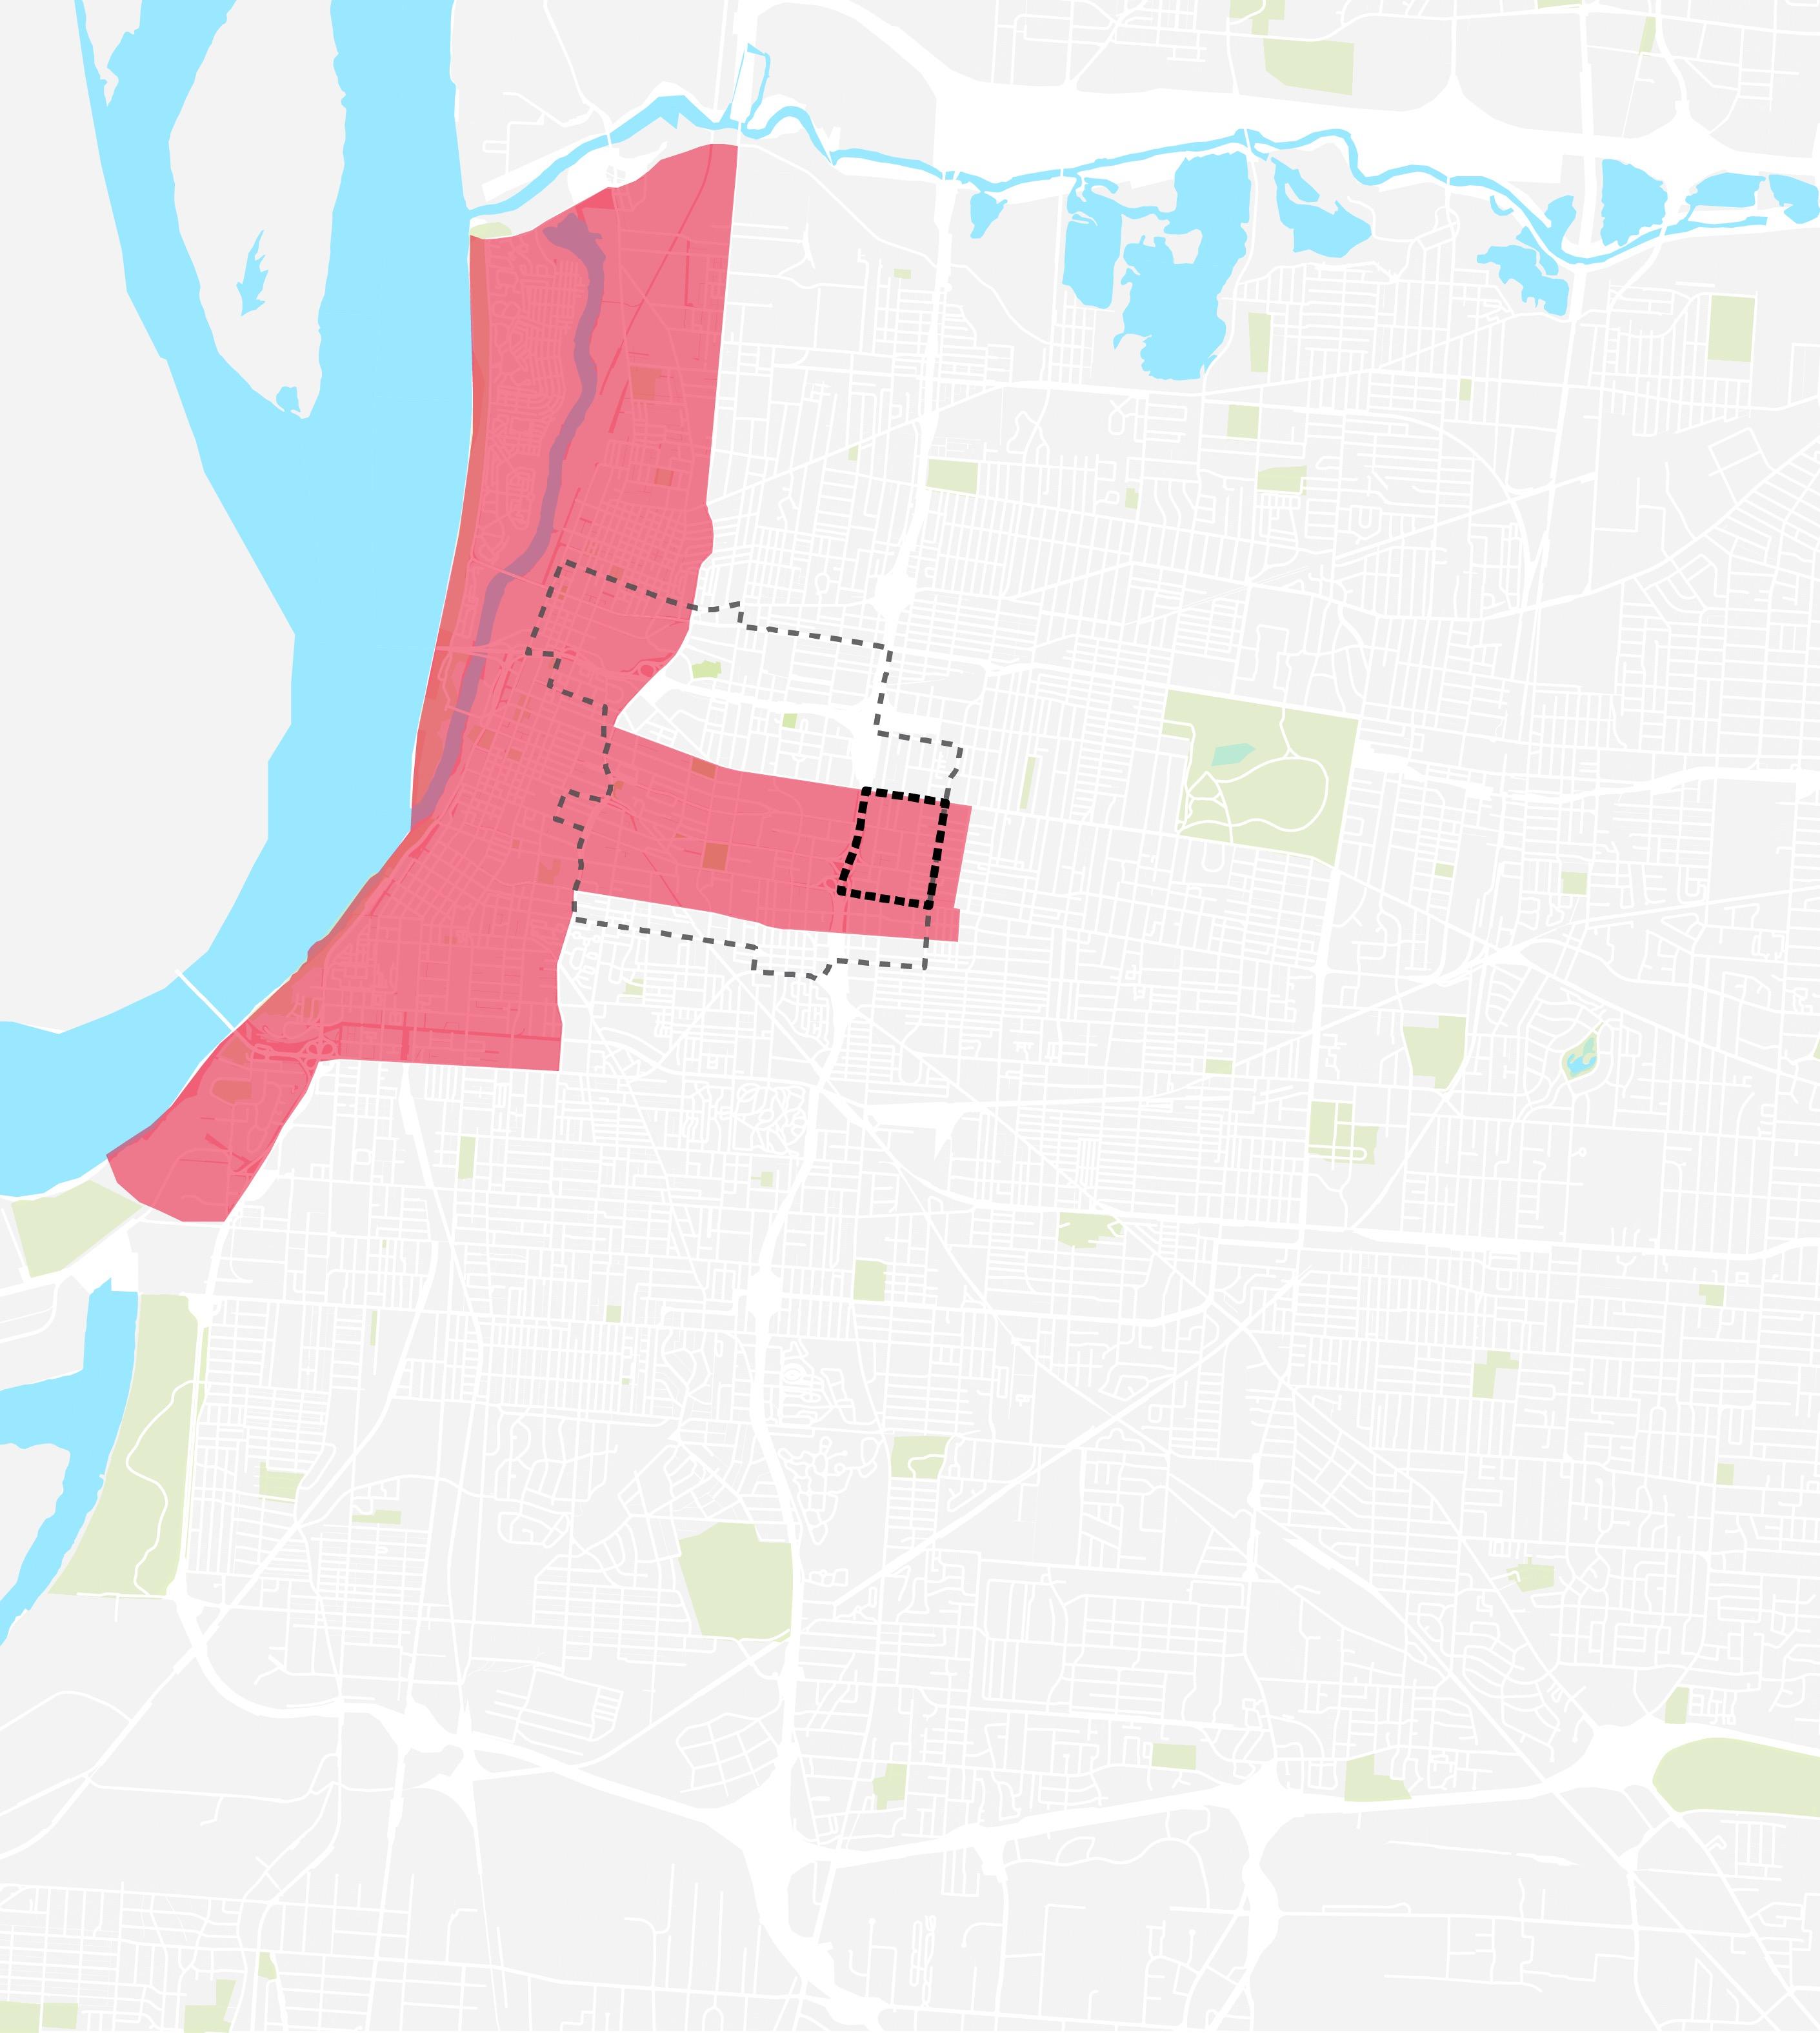
STUDY AREA OVERVIEW
MMDC (Memphis Medical District Collaborative) Study Area
Sources: CBID: https://www.downtownmemphiscommission.com/cbid MMDC: https://www.mdcollaborative.org/overview-of-programs Medical District Uptown Downtown Memphis Mud Island Crosstown Overton Park Midtown Central Gardens Annesdale Park
CBID (Central Business Improvement District)
Study Area
Daily Traffic Counts
MAJOR HIGHWAYS
The Memphis Medical District Collaborative Anchor Institutions and other businesses collectively represent over 30,000 employees, 8,000 students and 9,500 residents. A majority of the 47,000+ employees, students and residents commute by car.
Of the approximate 30,000 people working in the District, only 2% also reside there, meaning 98% are commuting in from other locations. Most (80%) of these commuters are traveling greater than 10 miles to work, and in terms of geography, they come from a variable spread of communities east of the study area.
Daily traffic counts data indicate that most commuters are entering the District by way of Interstate 40, Interstate 69 and Union Ave.
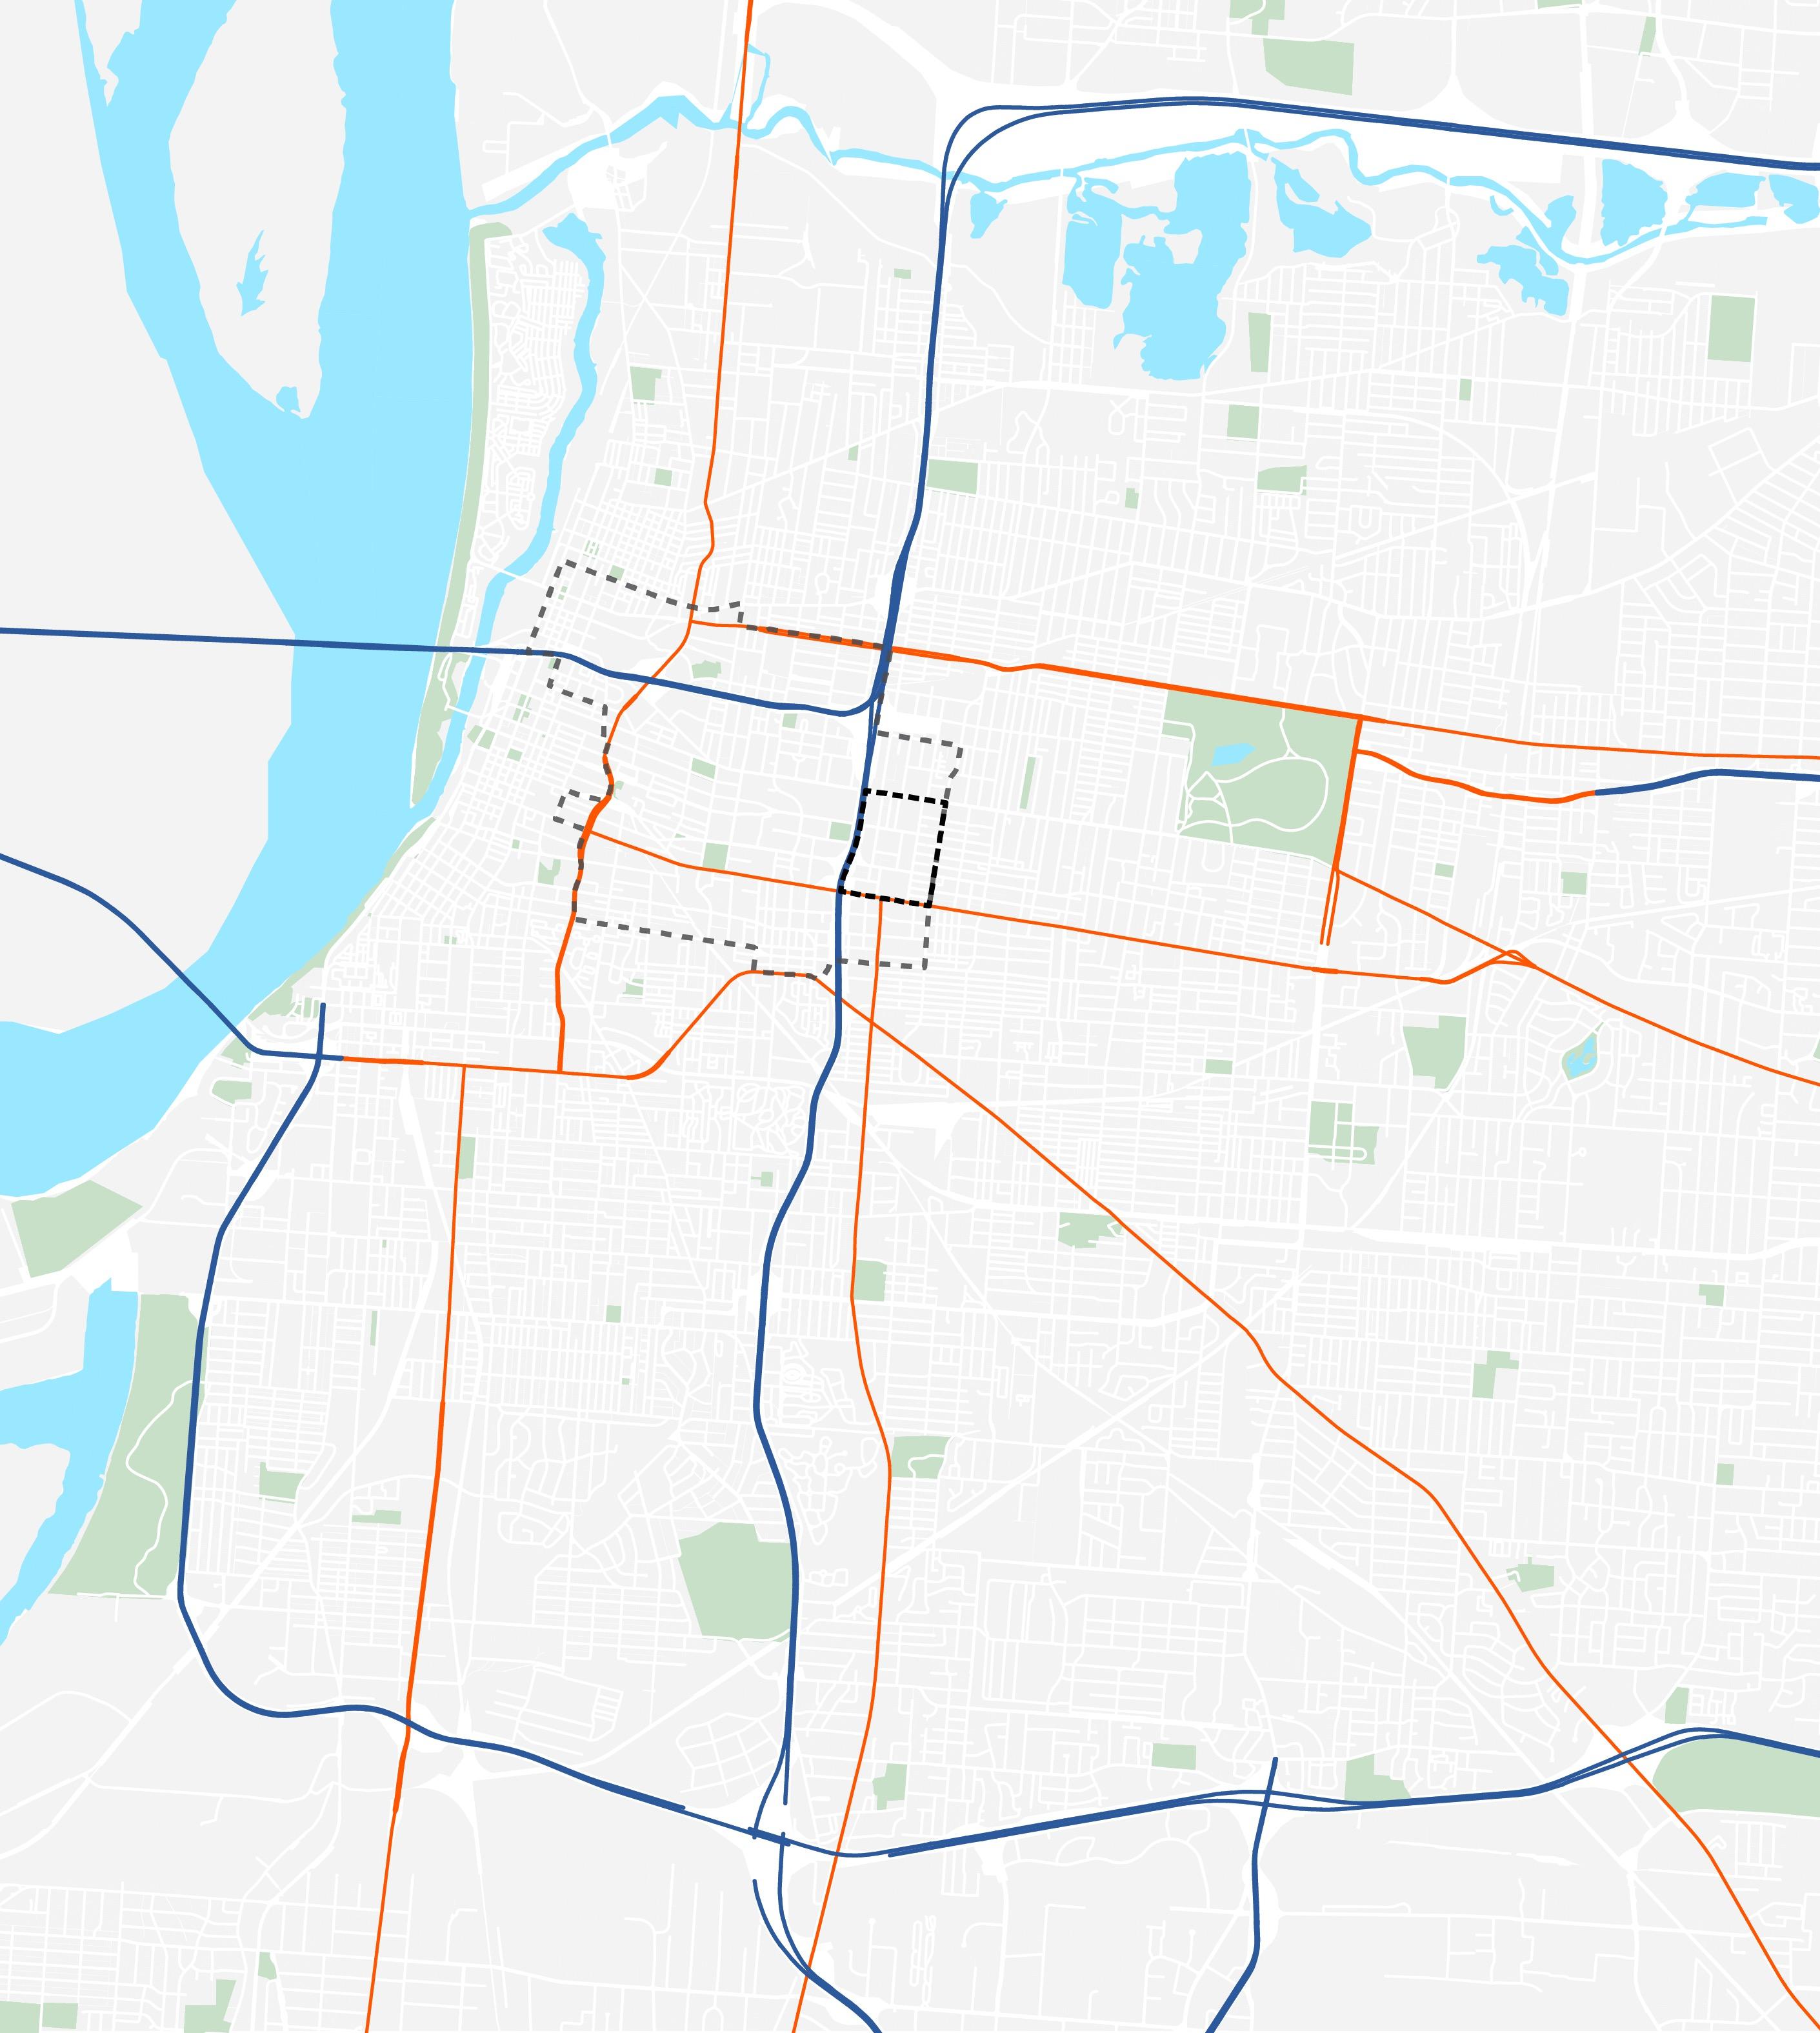
US and State Highways
Limited Access or Interstate
STUDY AREA OVERVIEW
40 69 MMDC (Memphis Medical District Collaborative) Study Area
Primary
Study Area
Primary
©2019 Kalibrate Technologies (Q4 2019). U.S. Census Bureau ACS 2018 (5-Year Estimates) 36,390 Union Ave 16,417 48,400 119,345 72,449 58,600
Sources:
Uptown Downtown Memphis Mud Island Crosstown Overton Park Midtown Central Gardens Annesdale Park Medical District
PUBLIC TRANSPORTATION
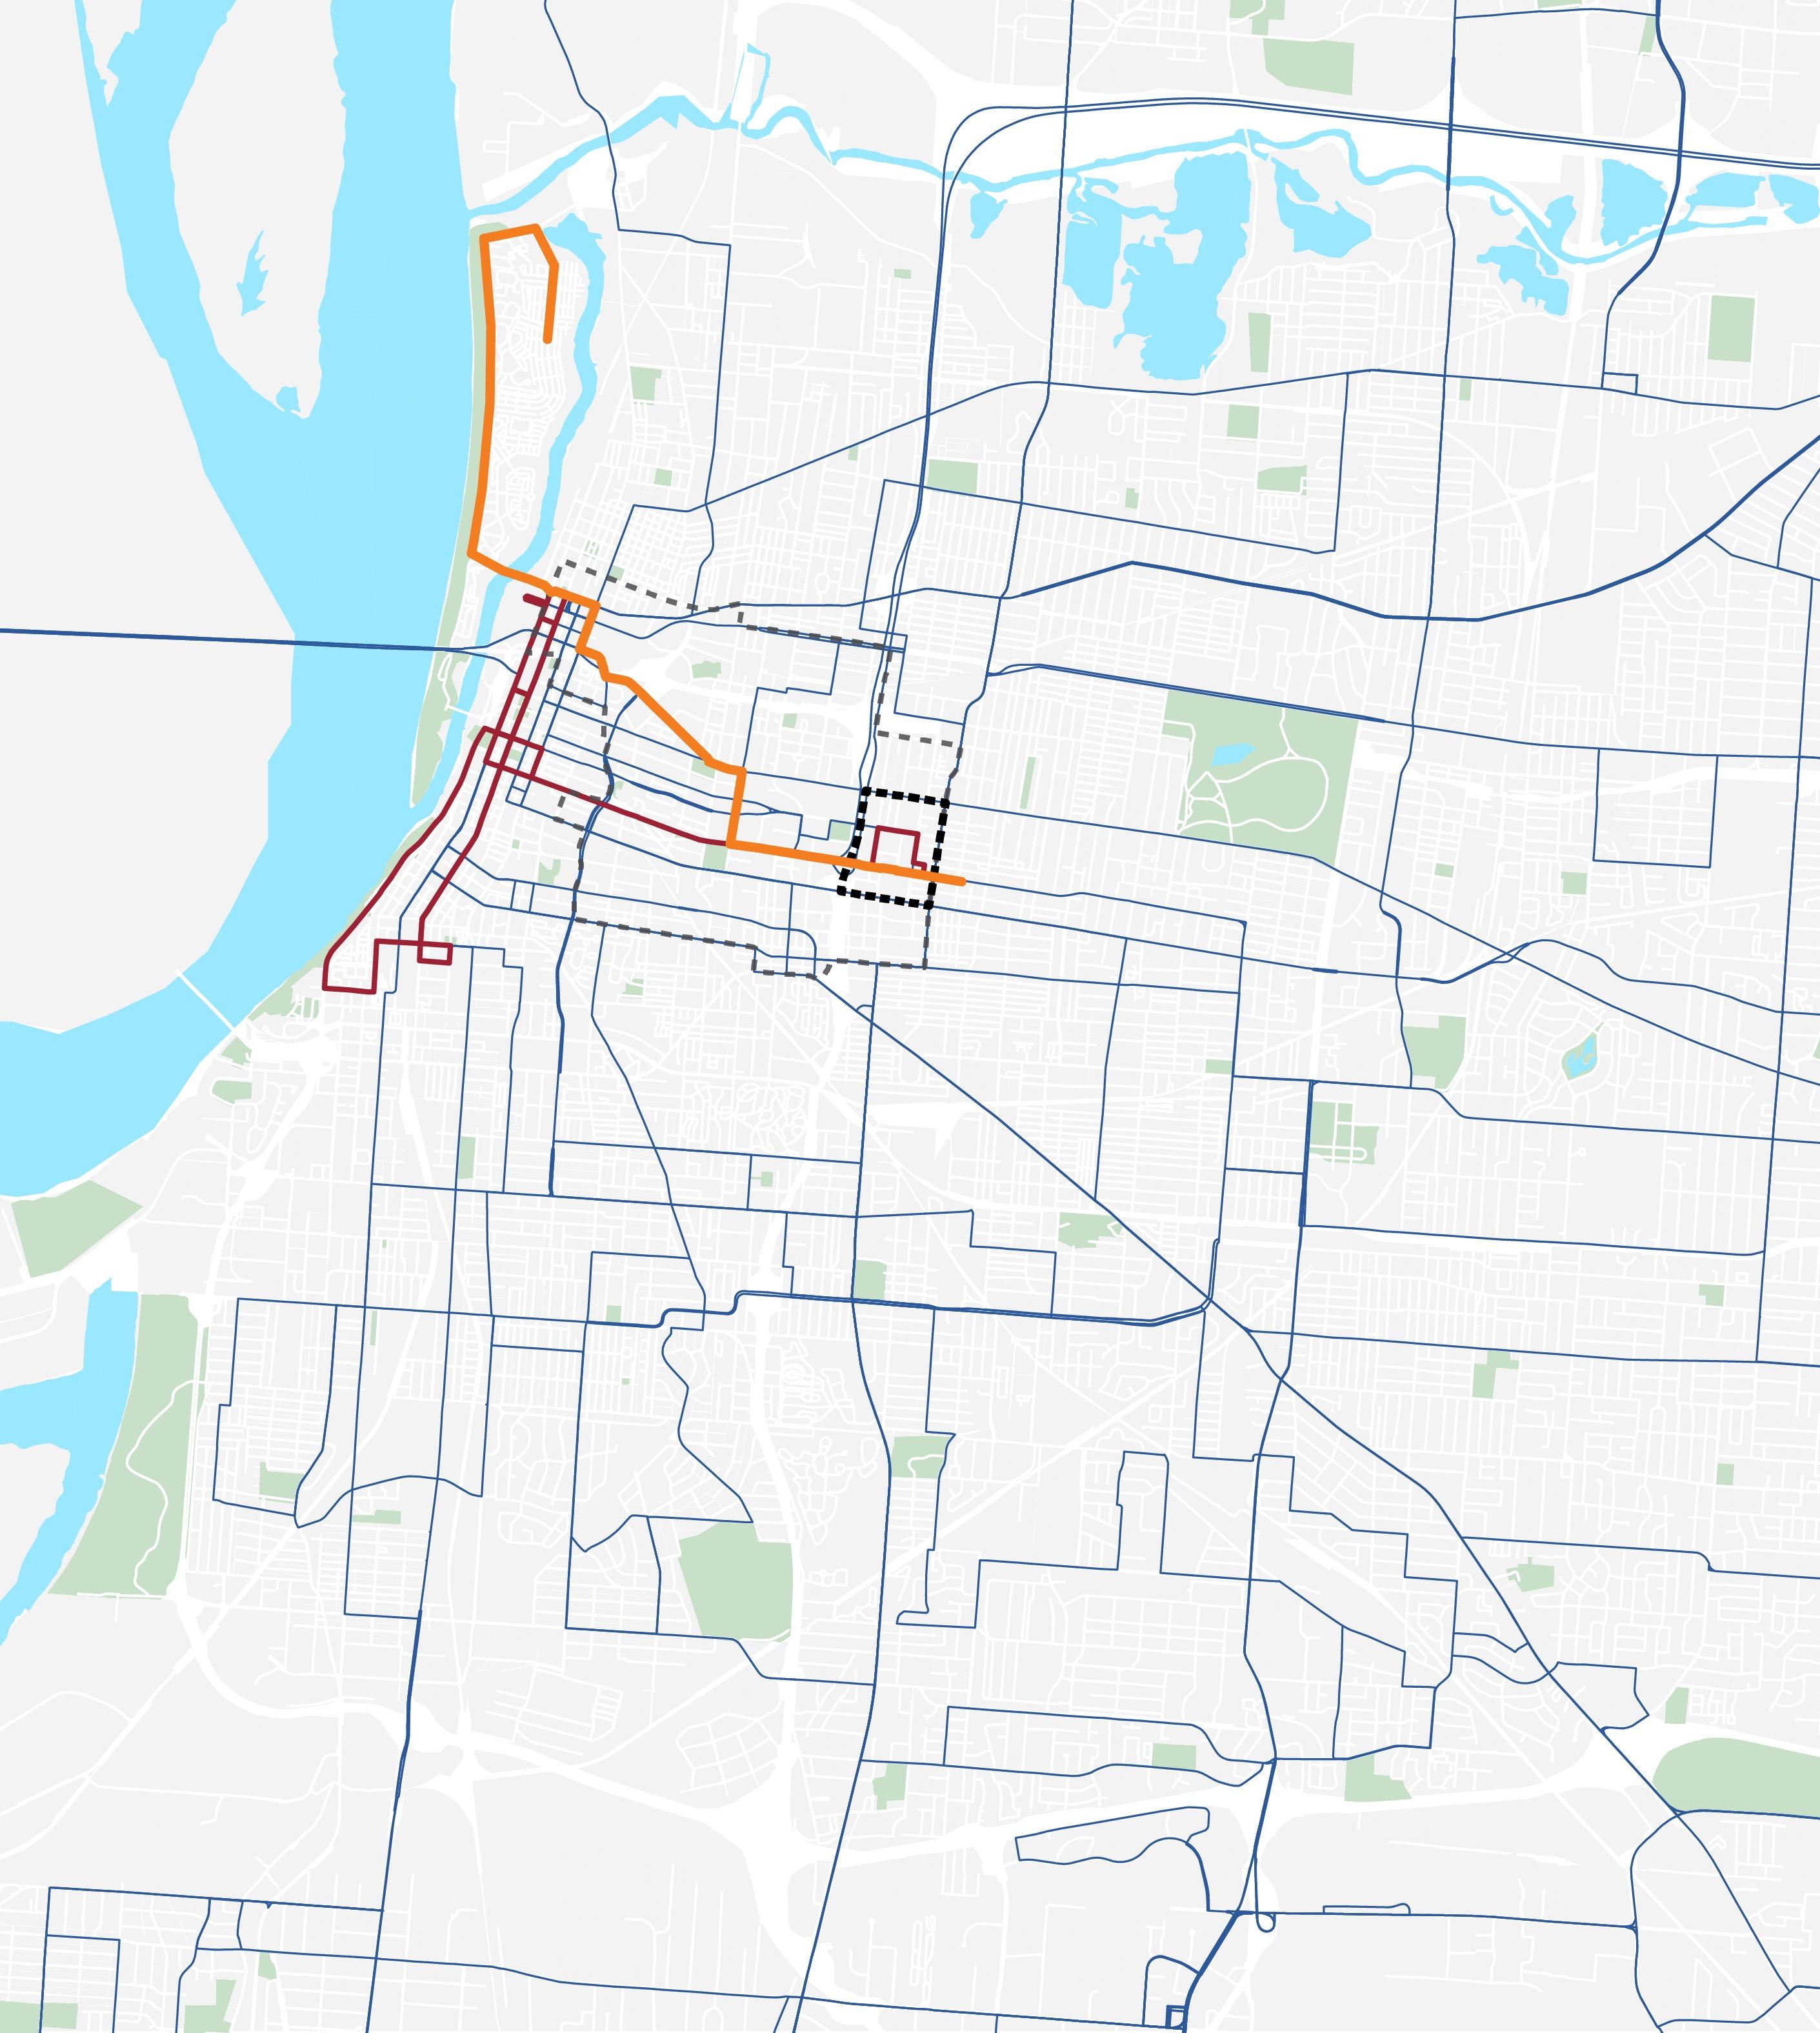
The Memphis Area Transit Authority (MATA) is the public transportation provider for the Memphis area. As one of the largest transit operators in the state of Tennessee, MATA transports customers in the City of Memphis and parts of Shelby County on fixed-route buses, paratransit vehicles and vintage rail trolleys.
There are approximately 35 bus stops within the study area and along its border streets. In addition, the Madison Trolley Bus Line and Groove Shuttle connect the residential areas with the Medical District and Downtown.
Study Area
STUDY AREA OVERVIEW
MATA Trolley MATA Bus Routes MMDC Groove Shuttle MMDC (Memphis Medical District Collaborative) Study Area MATA Transit Stations
Sources: MATA Route Name Average Daily Trips Madison Trolley Bus 45 Poplar 39 Crosstown 37 MMDC Grove Shuttle 35 Lamar 30 Madison 20 Walnut Grove 6 Walnut Grove Express 4 Medical District Uptown Downtown Memphis Mud Island Crosstown Overton Park Midtown Central Gardens Annesdale Park
STUDY
PLANNING AREAS
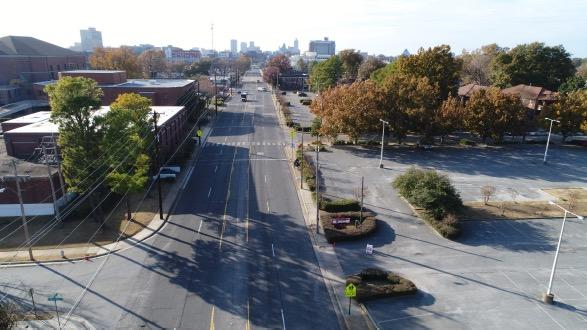
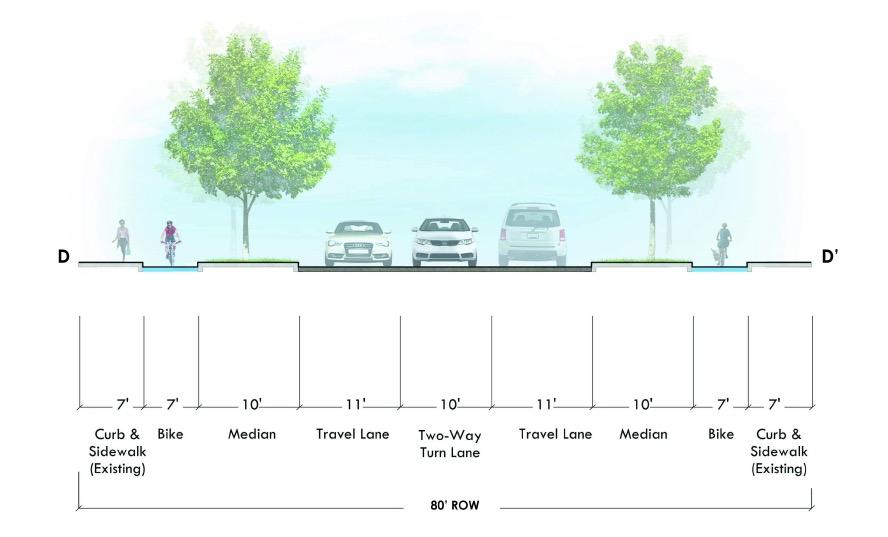
There are efforts afoot to enhance the public realm, including “The Better Jefferson Corridor” planning initiative. In 2019, MMDC alongside the City of Memphis, MATA, The Development Studio and Kimley Horn began assessing a reconfiguration of Jefferson Avenue.

Existing Jefferson Ave at Memphis Academy of Science & Engineering
Proposed Streetscape

Sources:
Study Area
AREA OVERVIEW
MMDC (Memphis Medical District Collaborative) Study Area
The
Better Jefferson Corridor Plan.
Jefferson Corridor
DEMOGRAPHIC & HOUSING TRENDS
TRENDS
INTRODUCTION
Madison Heights is a primarily commercial neighborhood. Though the current available housing stock is scant and often underutilized, and the economic profile of neighborhood residents is on paper below the median for Memphis, the statistics belie the neighborhood’s inherent dynamism and latent urbanism.
Madison Heights has a greater population density, housing mix and diversity than Memphis-at-large. And its proximity to jobs, anchor institutions, leisure activities and the city’s central core have positioned it for growth, as evidenced, in part, in recent years by rising property values.

& HOUSING
DEMOGRAPHIC
RAIN OR SHINE CELEBRATION
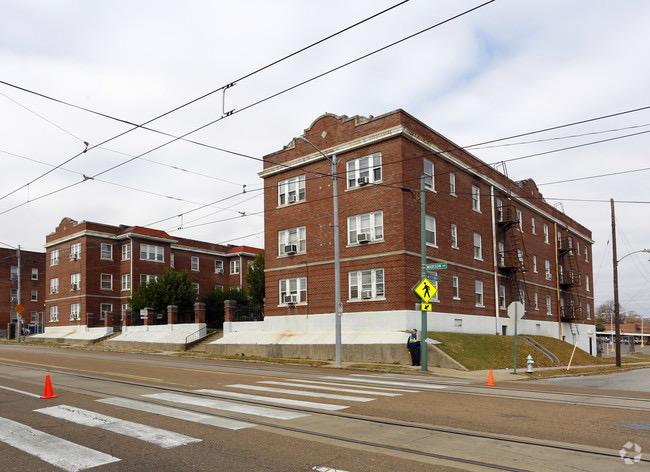
1236 MADISON AVE
1220 MADISON AVE
HOUSEHOLDS
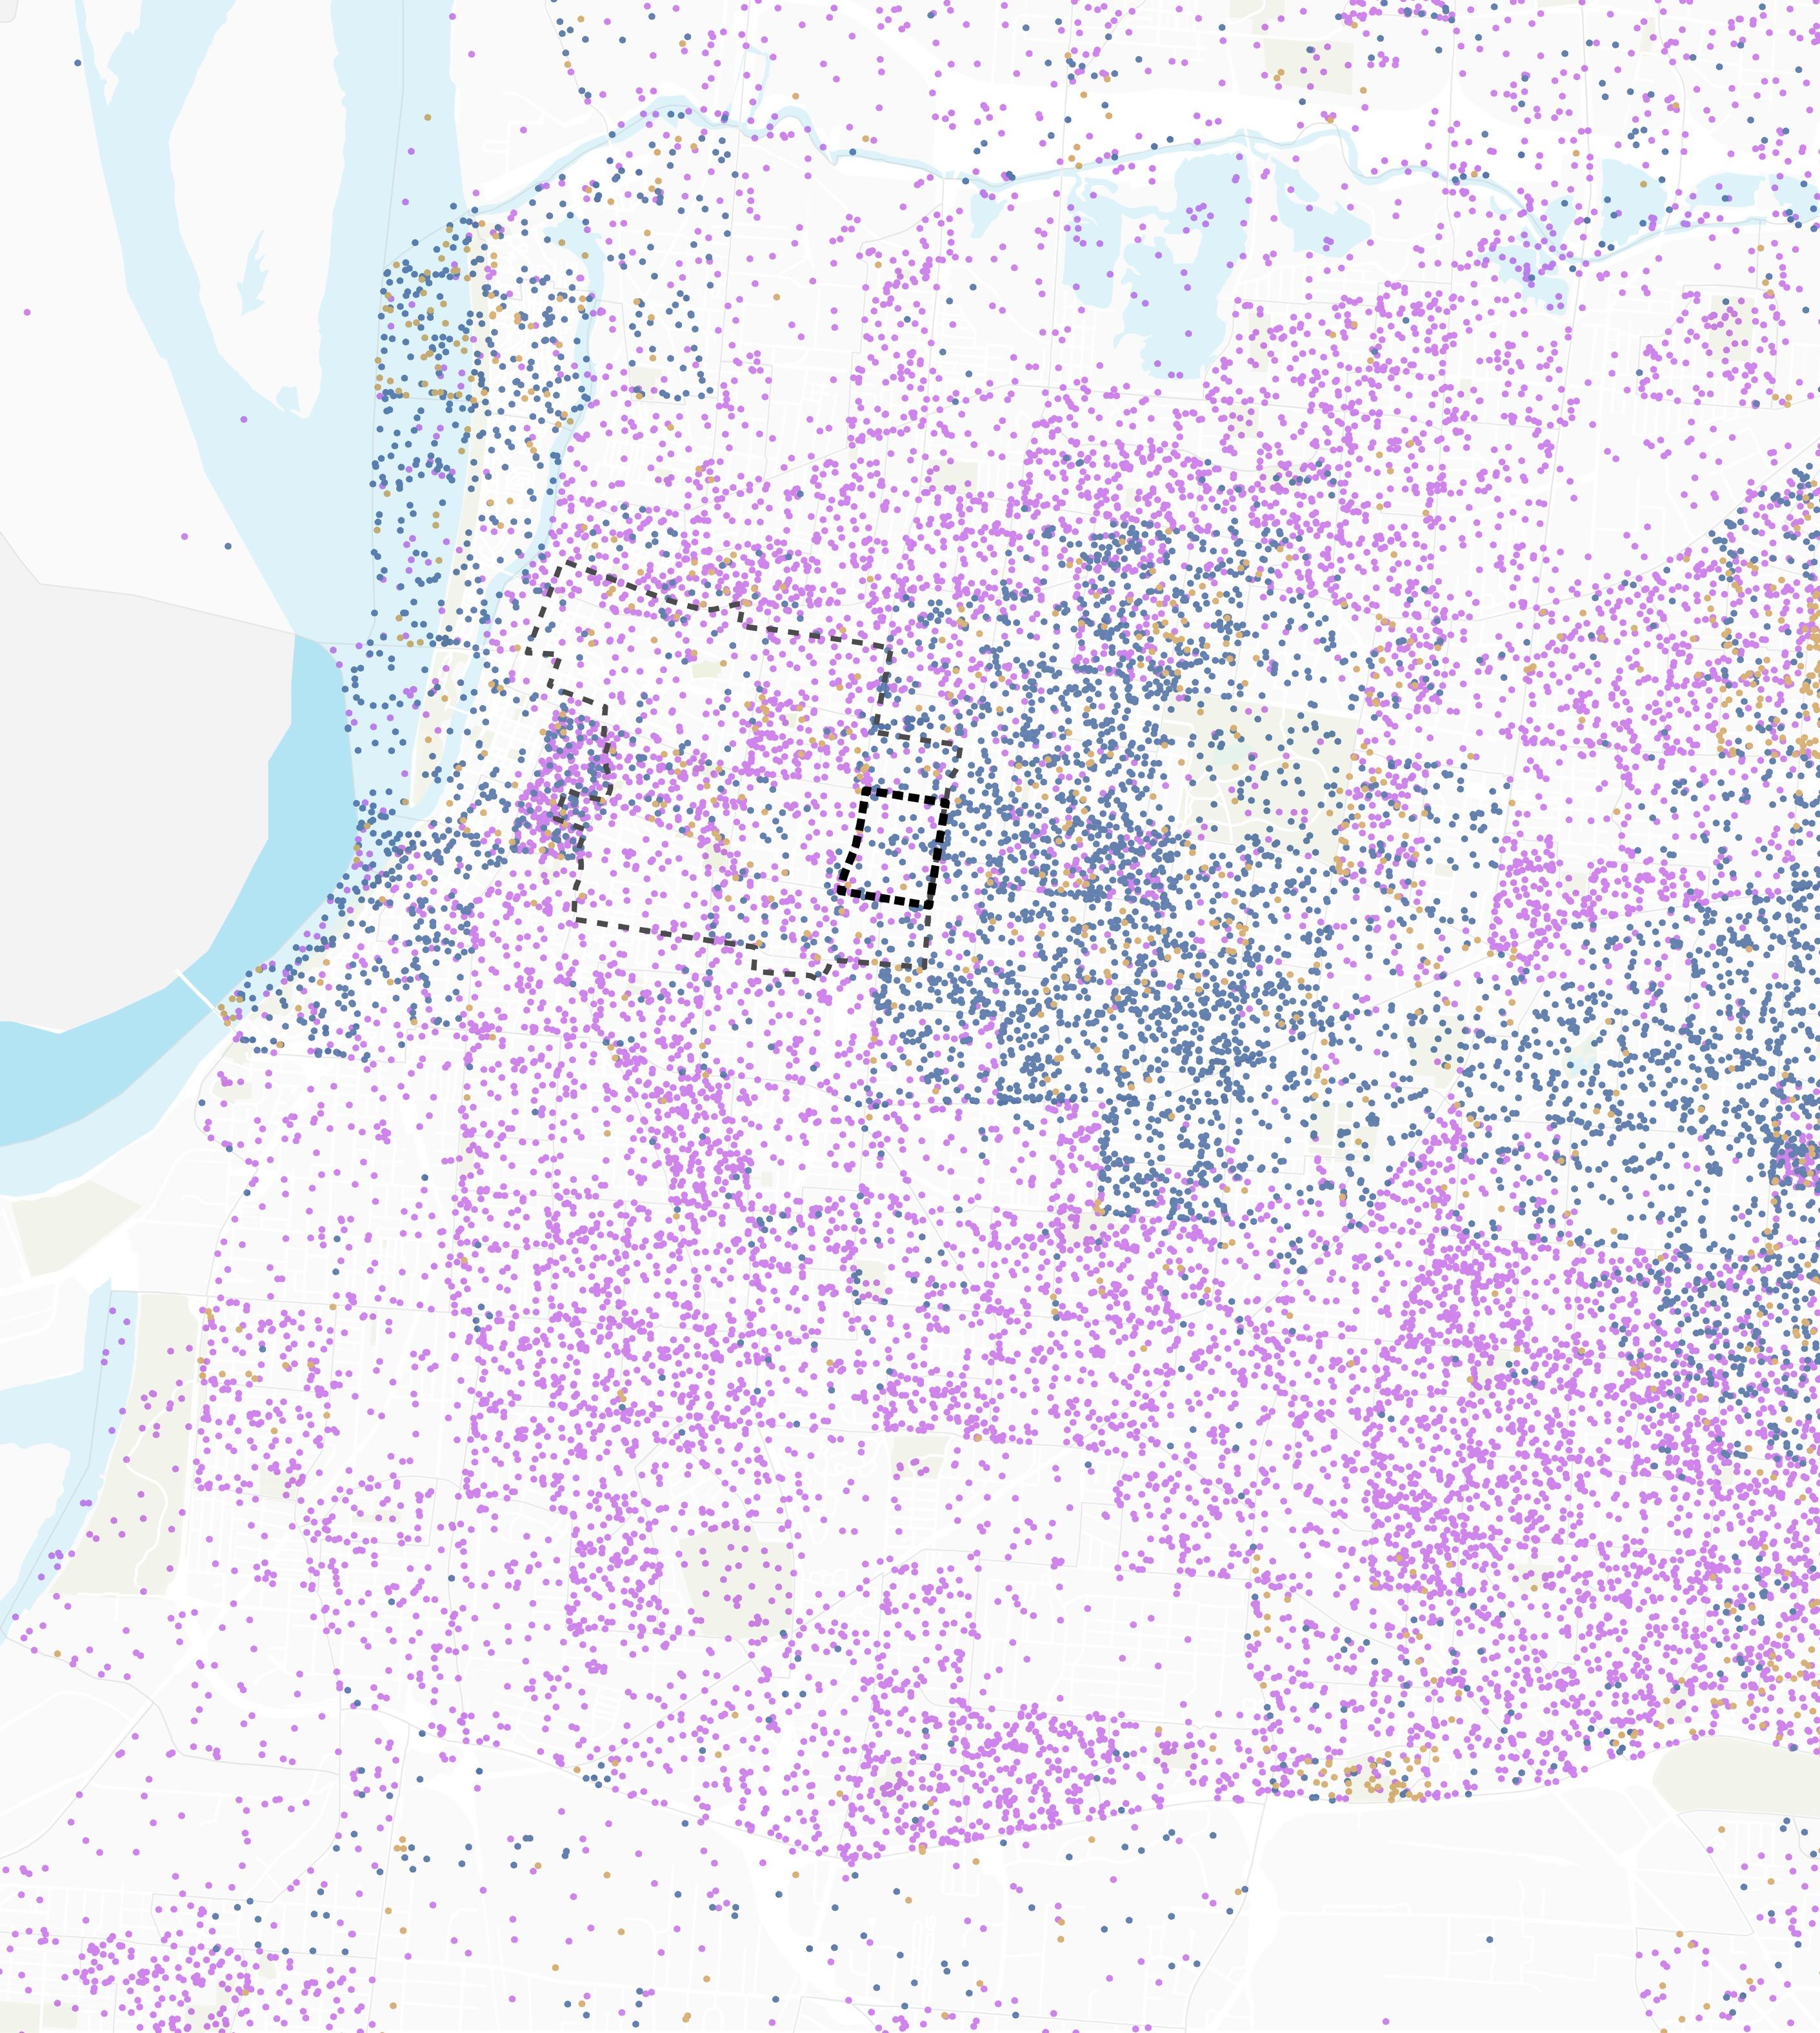
Study Area SOURCE: US Decennial Census 2010, American Community Survey, 2018 The Study Area 1,360 (-16%) Memphis 653,200 (+1%)
POPULATION (change since 2010) The Study Area 3,500 Memphis 2,074
(People Per Square Mile)
DEMOGRAPHIC & HOUSING TRENDS OVERVIEW
TOTAL
POPULATION DENSITY
(change since 2010) The Study Area 760 (-10) (16% FAMILY) Memphis 251,000 (+0.2%) (57% FAMILY) MEDIAN AGE The Study Area 39 Memphis 34 White Black Other Population Density By Race 1 Dot = 10 People Study Area Memphis 53% 45% 28% 69%
INCOME
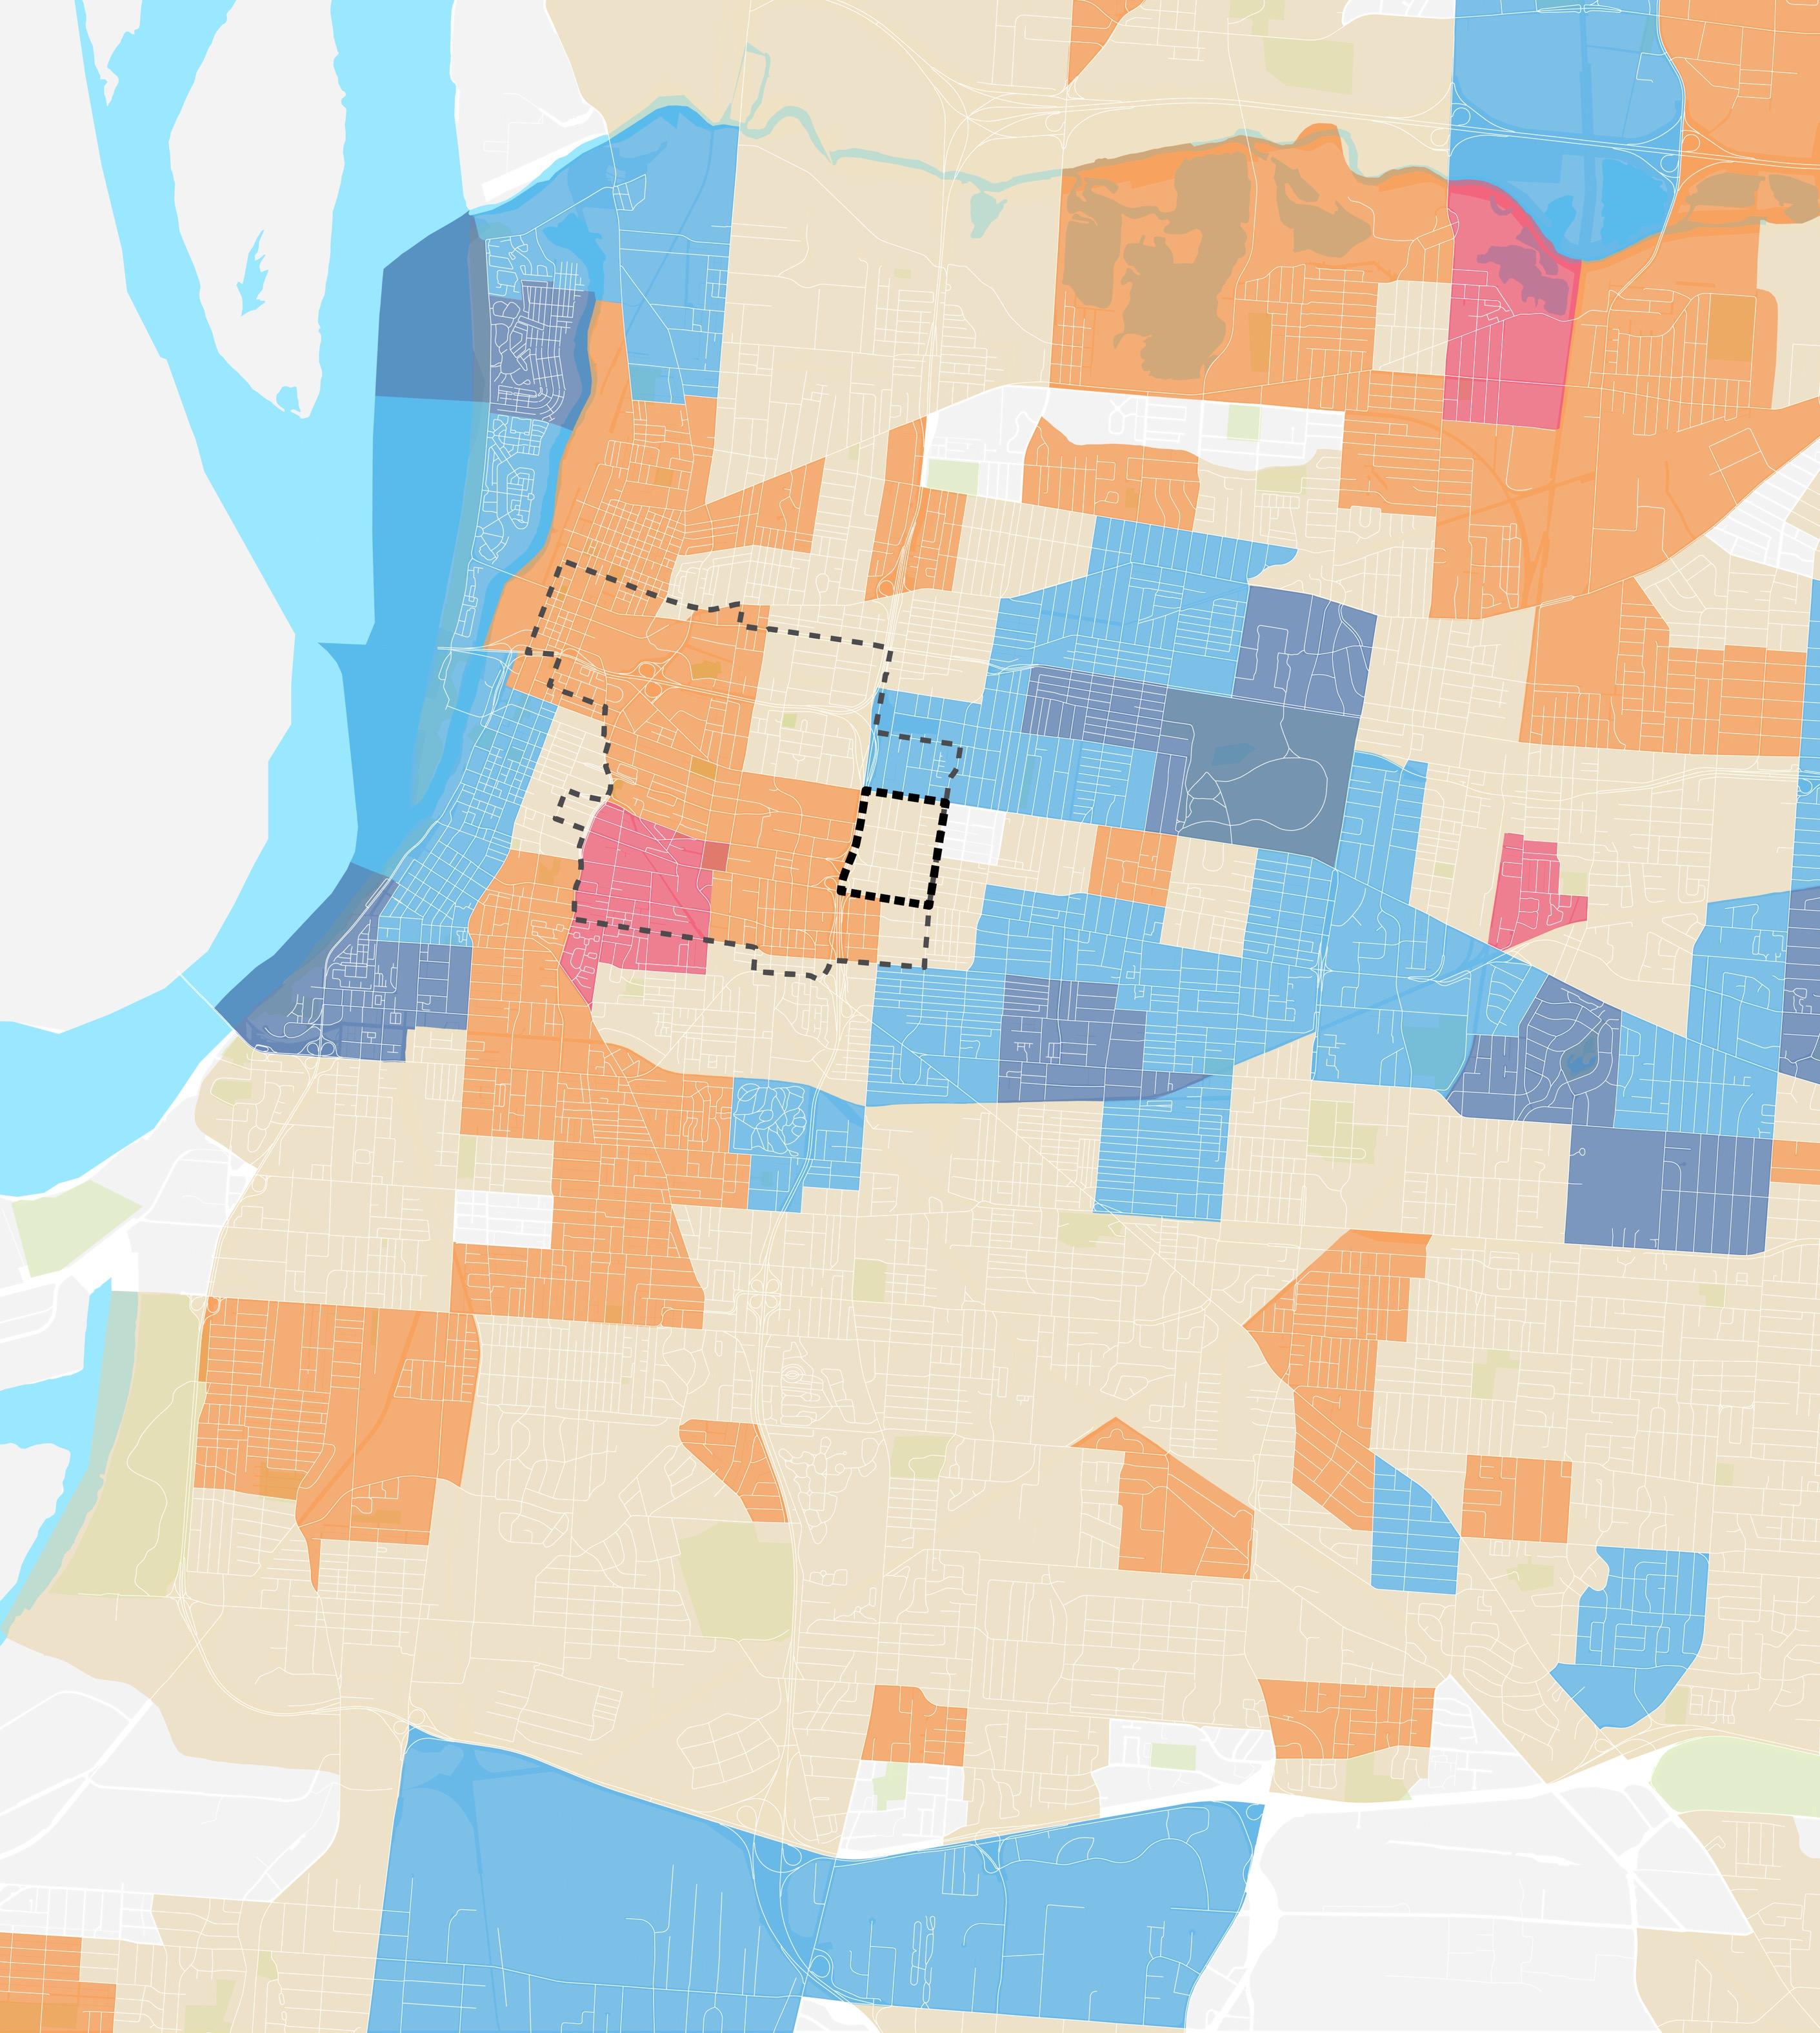
MEDIAN HOUSEHOLD INCOME
EDUCATIONAL ATTAINMENT
DEMOGRAPHIC & HOUSING TRENDS
$9,701 - $19,500 $19,501 - $39,000 $39,001 - $78,000 $78,001 or Greater
The Study Area $25,500 Memphis $39,100 FAMILIES
POVERTY The Study Area 38% Memphis 22%
School or Less Some College Bachelor’s Master’s or Higher
IN
High
(Highest Educational For Population Aged 25+) 27% 25% 28% 20% 16% 31% 29% 24% The Study Area Memphis Medical District Uptown Downtown Memphis Mud Island Crosstown Overton Park Midtown Central Gardens Annesdale Park Median Household Income $9,700 or Less SOURCE: US
American Community
2018
Census.
Survey,
HOUSING PROFILE


Study
DEMOGRAPHIC & HOUSING TRENDS
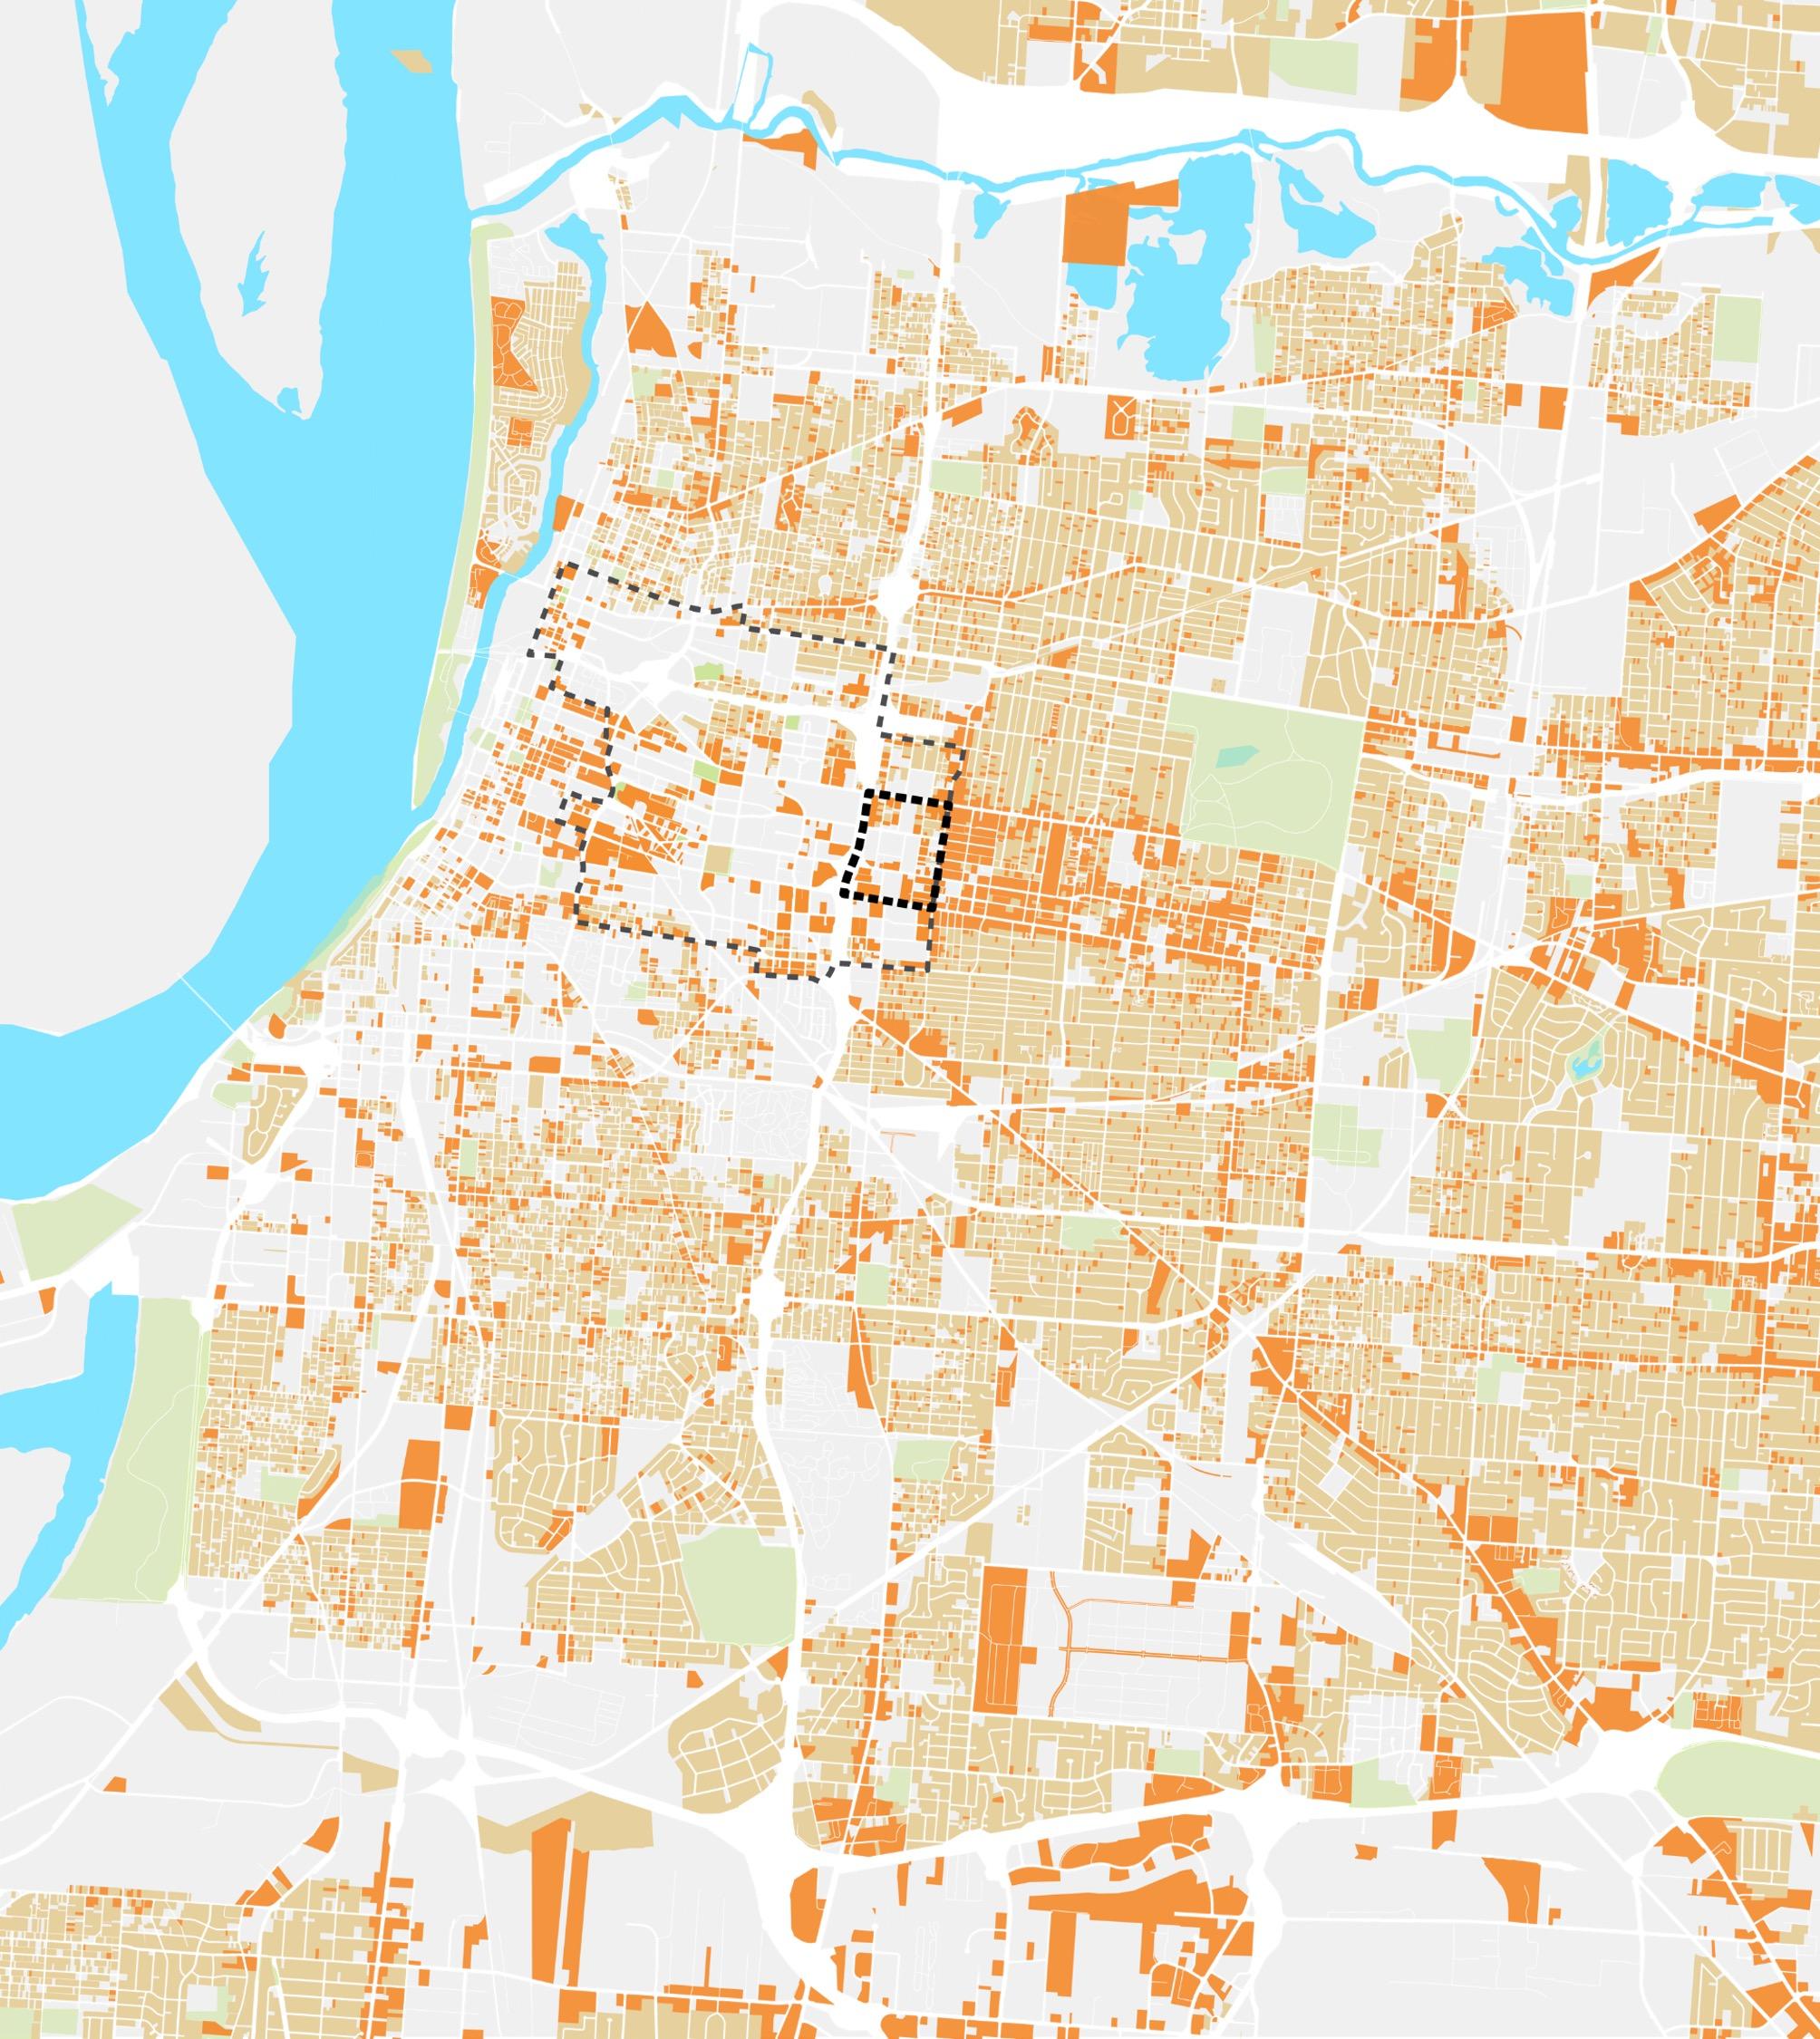
Area Study Area Total Housing Units: 1,100 (2018) Memphis, TN Total Housing Units: 251,000 (2018) 58% 32% 10% 44% 39% 16% Renter Owner Vacant Tenure
Occupancy Units In Structure Residential Mixed Use Other Uses Land Use 0% 20% 40% 60% 80% 1 2 3 to 4 5 to 9 10 to 19 20 to 49 50 or More 18% 2% 13% 18% 17% 8% 25% 0% 10% 20% 30% 1 2 3 to 4 5 to 9 10 to 19 20 to 49 50 or More 65% Single Family (60% Detached) 50% Apartments (10+ Units) Study Area (1,000 Units) Memphis, TN (251,000 Units) Medical District Uptown Downtown Memphis Crosstown Overton Park Midtown Central Gardens Annesdale Park 1954 Median Year Built 1970 Median Year Built Mud Island
&
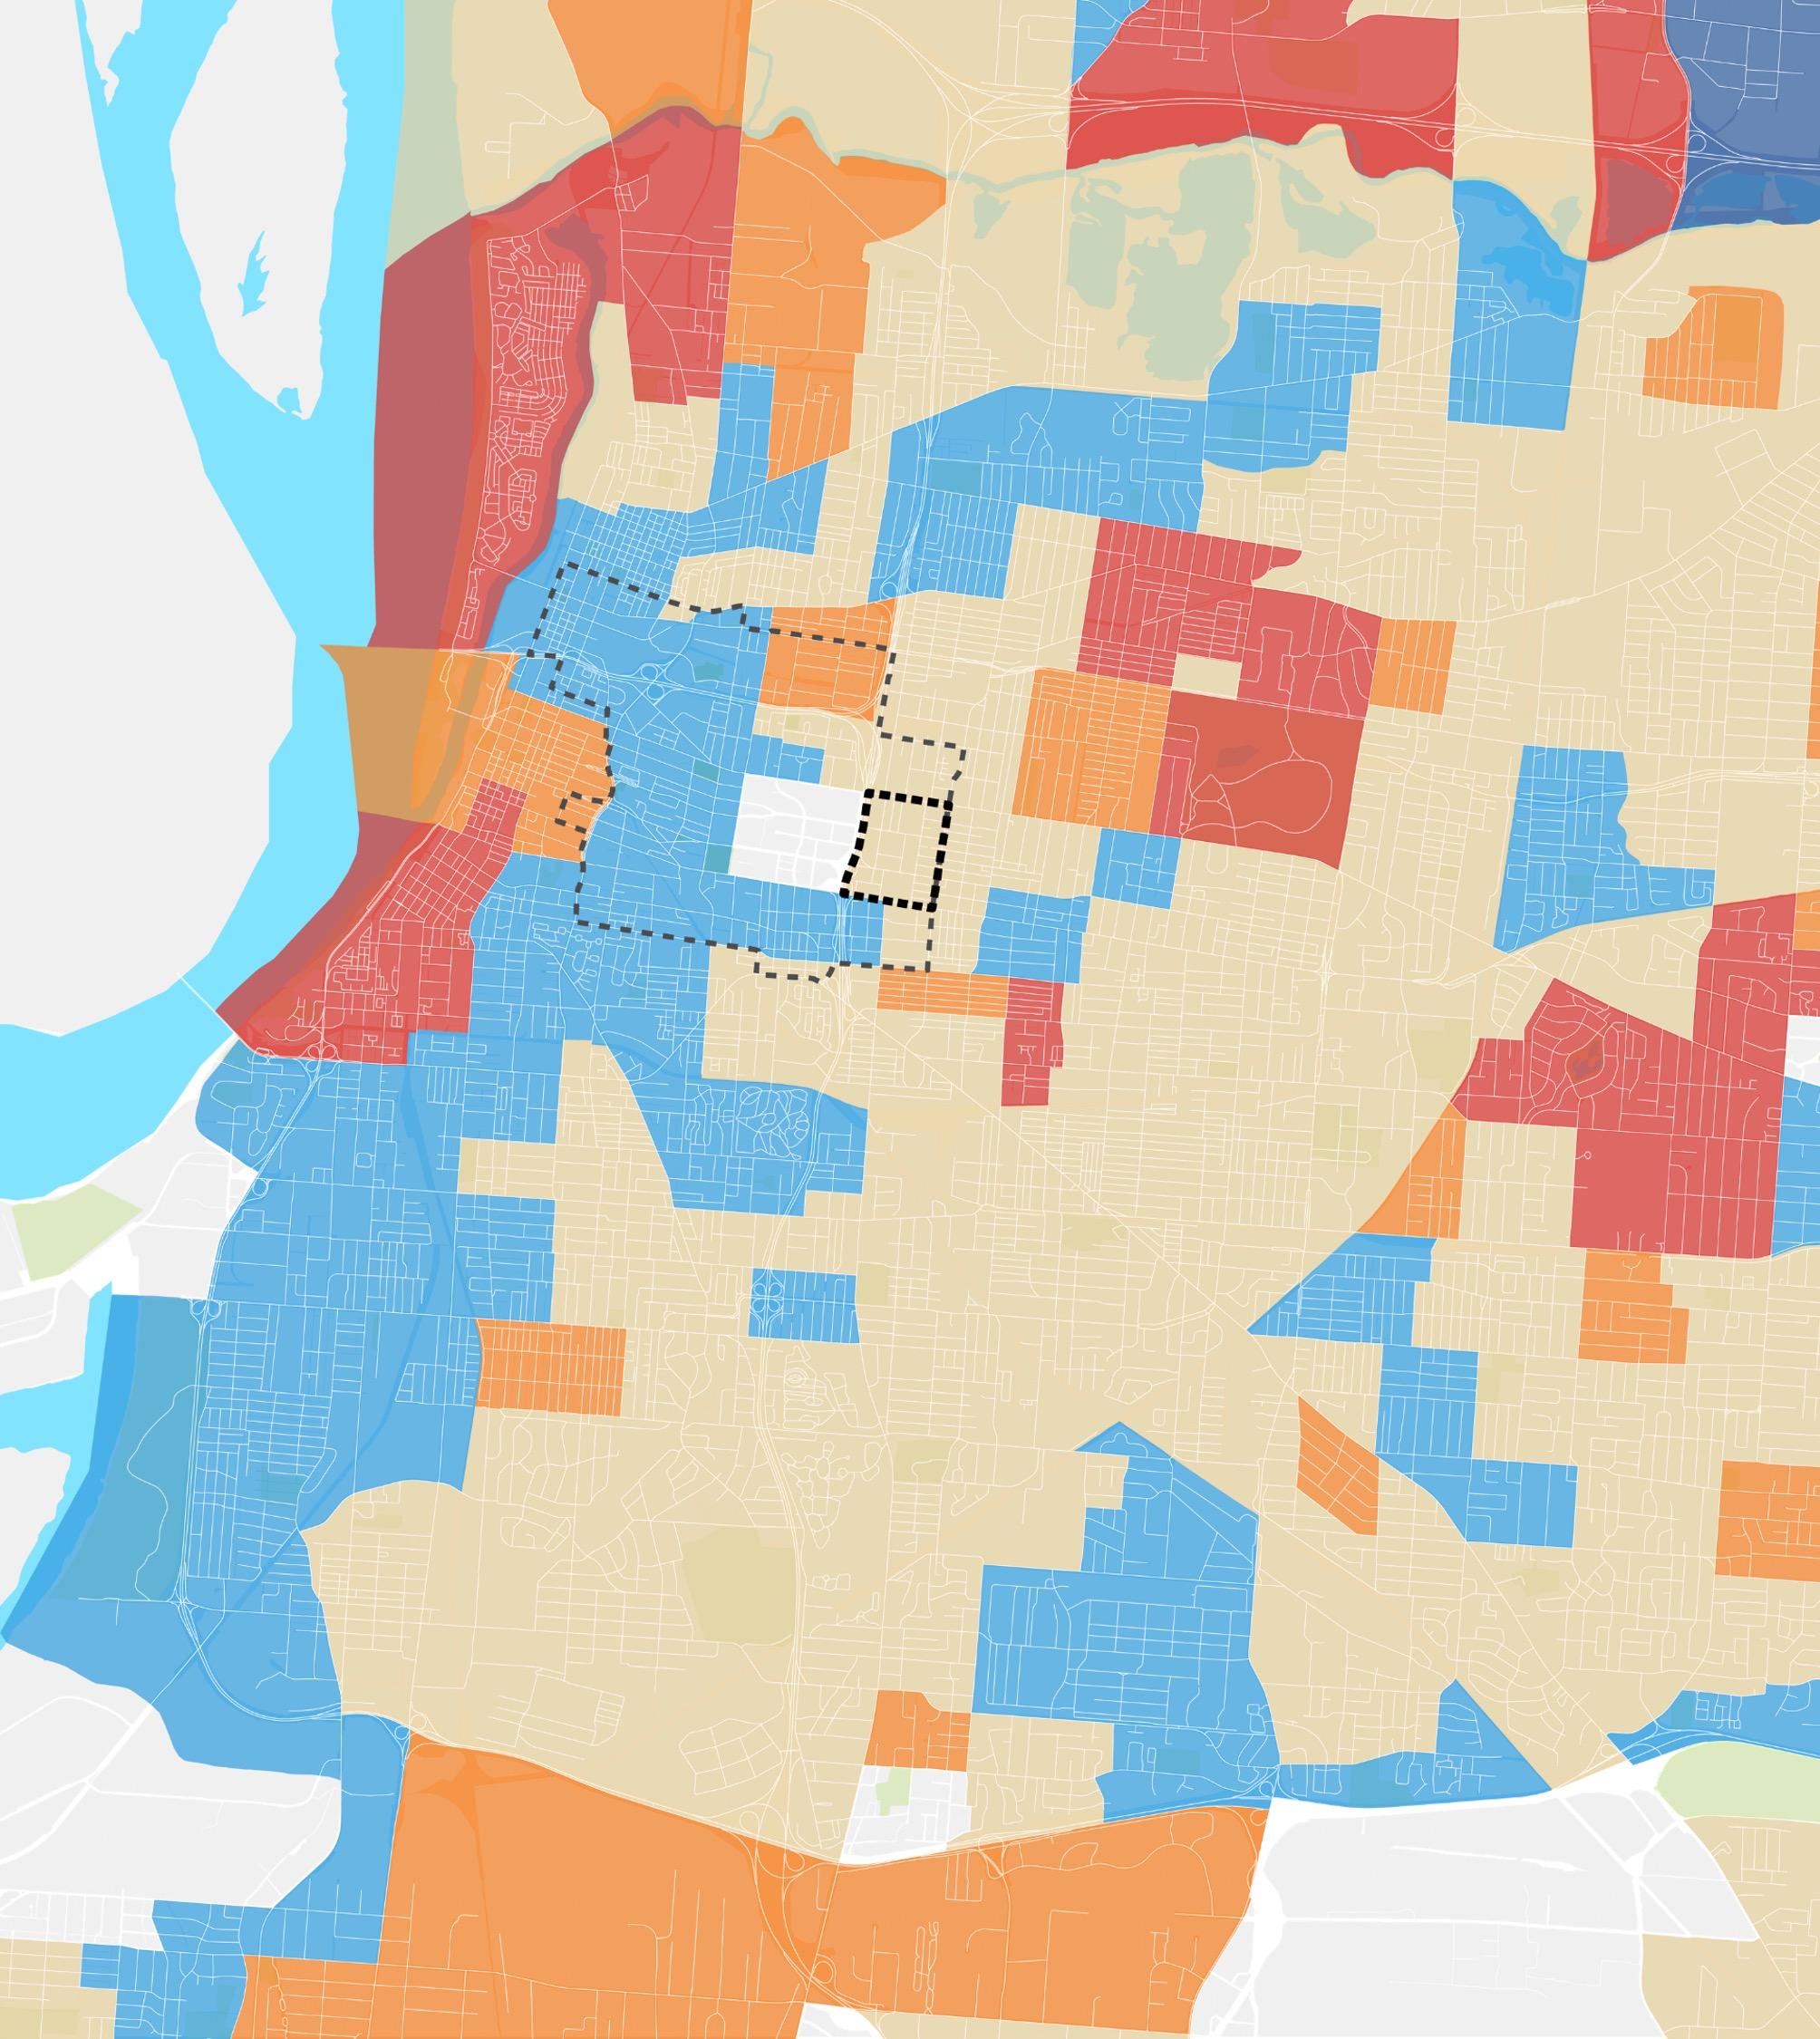
H0USING COSTS
(+4%) Median Rent/Month (change since 2010)
(+6.5%)
(-1) Median Rent as a Percent of Household Income (change since 2010)
K (-12%) Median Home Value for All Owner Occupied (change since 2010)
Costs as a Percent of Household Income (change since 2010)
DEMOGRAPHIC & HOUSING TRENDS
$719
Memphis $884
$276 - $660 $661 - $880 $881 - $1,100 $1,101 or Greater Medical District Uptown Downtown Memphis Crosstown Overton Park Midtown Central Gardens Annesdale Park Median
$275 or Less
Study
29%
Memphis 34%
The
$223
Memphis $98
The
17%
Memphis 19%
Mud Island
The Study Area
Gross Rent
The
Area
(+15%)
Study Area
K (+13%)
Study Area
(+32%)
(-18) Owner
SOURCE: US Decennial Census 2010, American Community Survey, 2018
ECONOMIC TRENDS
ECONOMIC TRENDS
INTRODUCTION
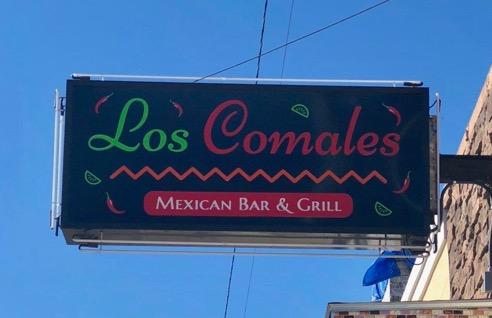
Madison Heights is situated in an area proximate to both large-scale institutions (medical, educational and social) located within the larger Medical District, as well as small-scale entrepreneurs, ethnic eateries and service industries.
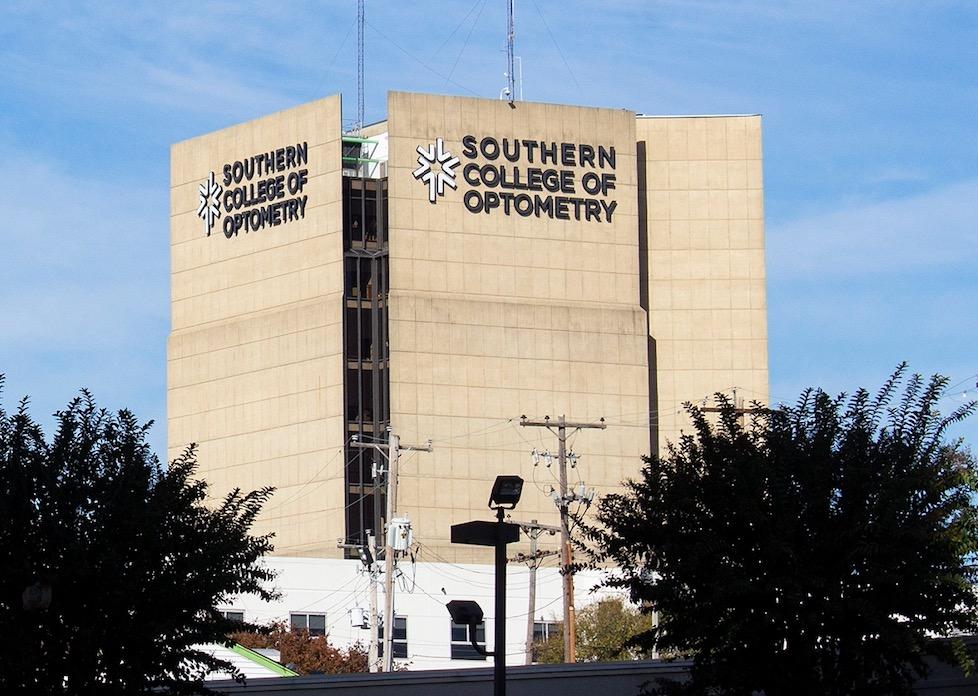
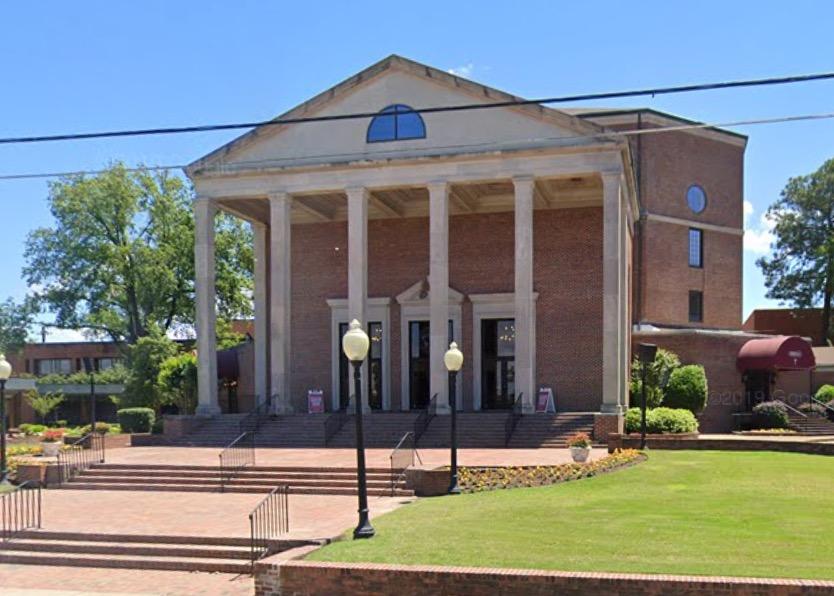
The fine-grained urbanism of the neighborhood, particularly around the central Madison/Cleveland intersection, provides the platform to support this economic interplay.

 VIET HOA MARKET
LOS COMALES
SOUTHERN COLLEGE OF OPTOMETRY
MISSISSIPPI BLVD CHRISTIAN CHURCH
ECONOMIC TRENDS
SMALL BUSINESSES
Small business growth has been ascendant in the neighborhood. As the community-development organization (CDC) in the Medical District, MMDC has seen and supported this development in the last few years. Reflecting this growth in small businesses, MMDC has, since 2017:

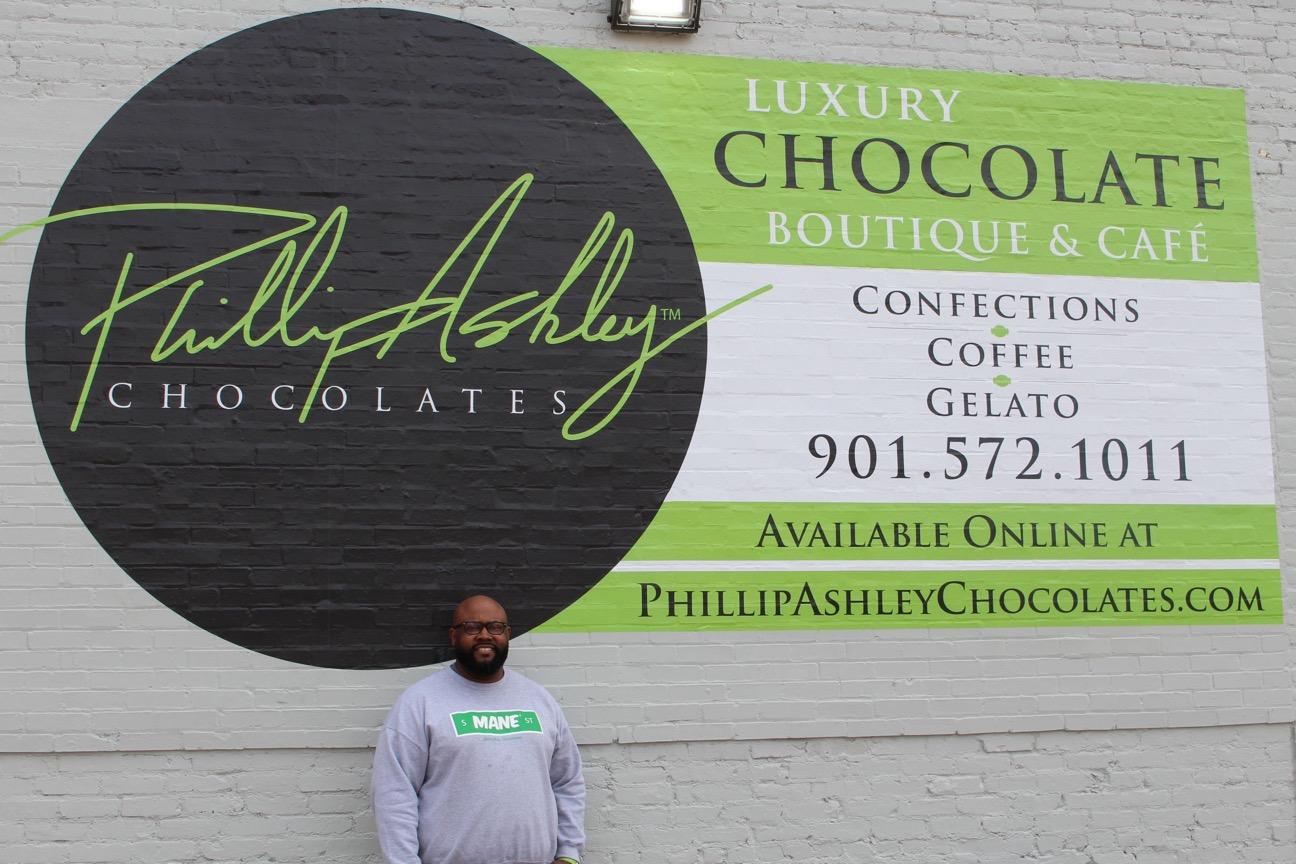
Provided technical assistance to new and existing businesses located in the neighborhood
Supported nearly $100K in façade improvement grants and business support
Assisted businesses that are over 90% MWBE

 BAM THRIFT STORE
PHILLIP ASHLEY CHOCOLATES
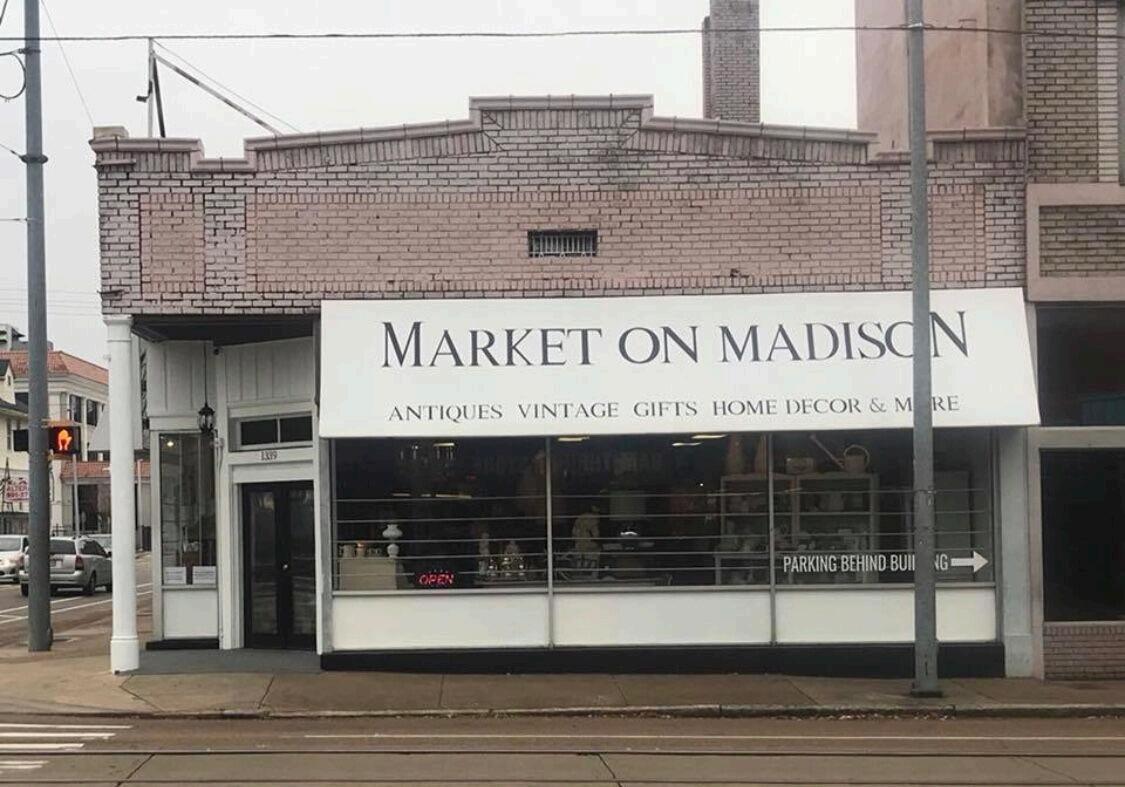
MARKET ON MADISON
RIKO’S KICKIN’ CHICKEN
ANCHOR INSTITUTIONS
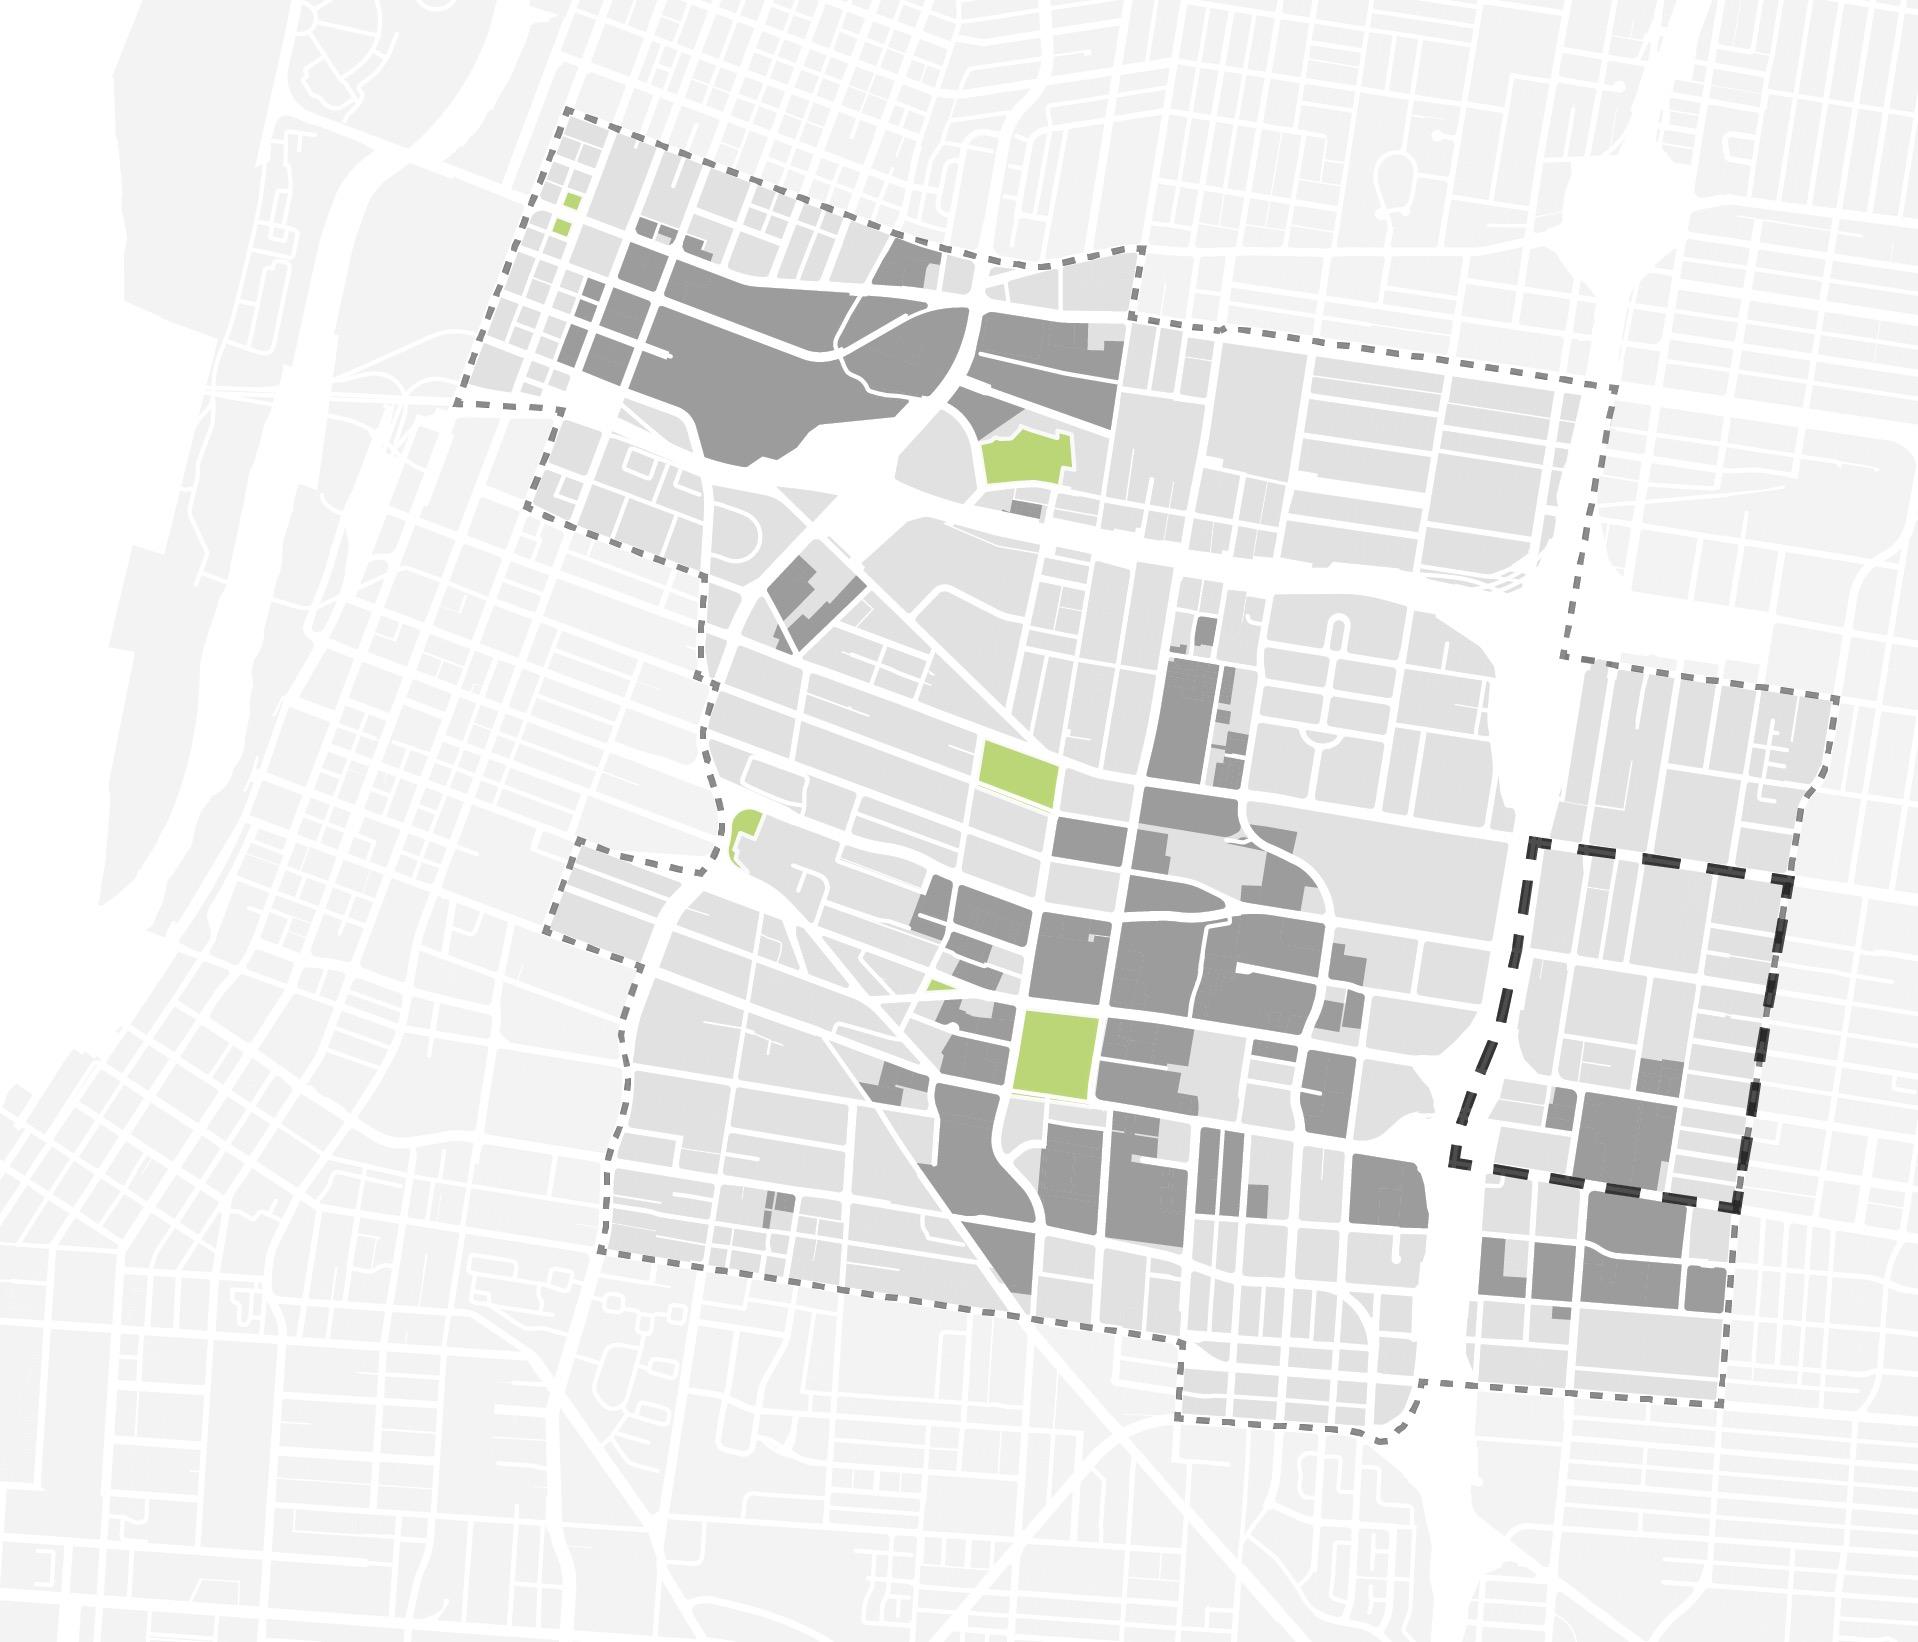
31,000


8,000
9,400


1 2 3 4 5 7 6 9 6 4 0 ECONOMIC TRENDS
1 2 3 4 5 6 7 St Jude Children’s Hospital Le Bonheur Children's Hospital Regional One Health University of Tennessee Health Sciences Southwest Tennessee Community College Baptist College Southern College of Optometry
workers Including 1,000+ within the Study Area
students Including 530+ within the Study Area
residents Including 1,300+ within the Study Area 8 Source: ESRI Business Analyst. IPEDs 2019. MMDC Anchor Institutions Study Area 300+ Acres of Real Estate Including 9 Acres within the Study Area 8 Methodist University
830 Businesses
Employing over 31,000 employees


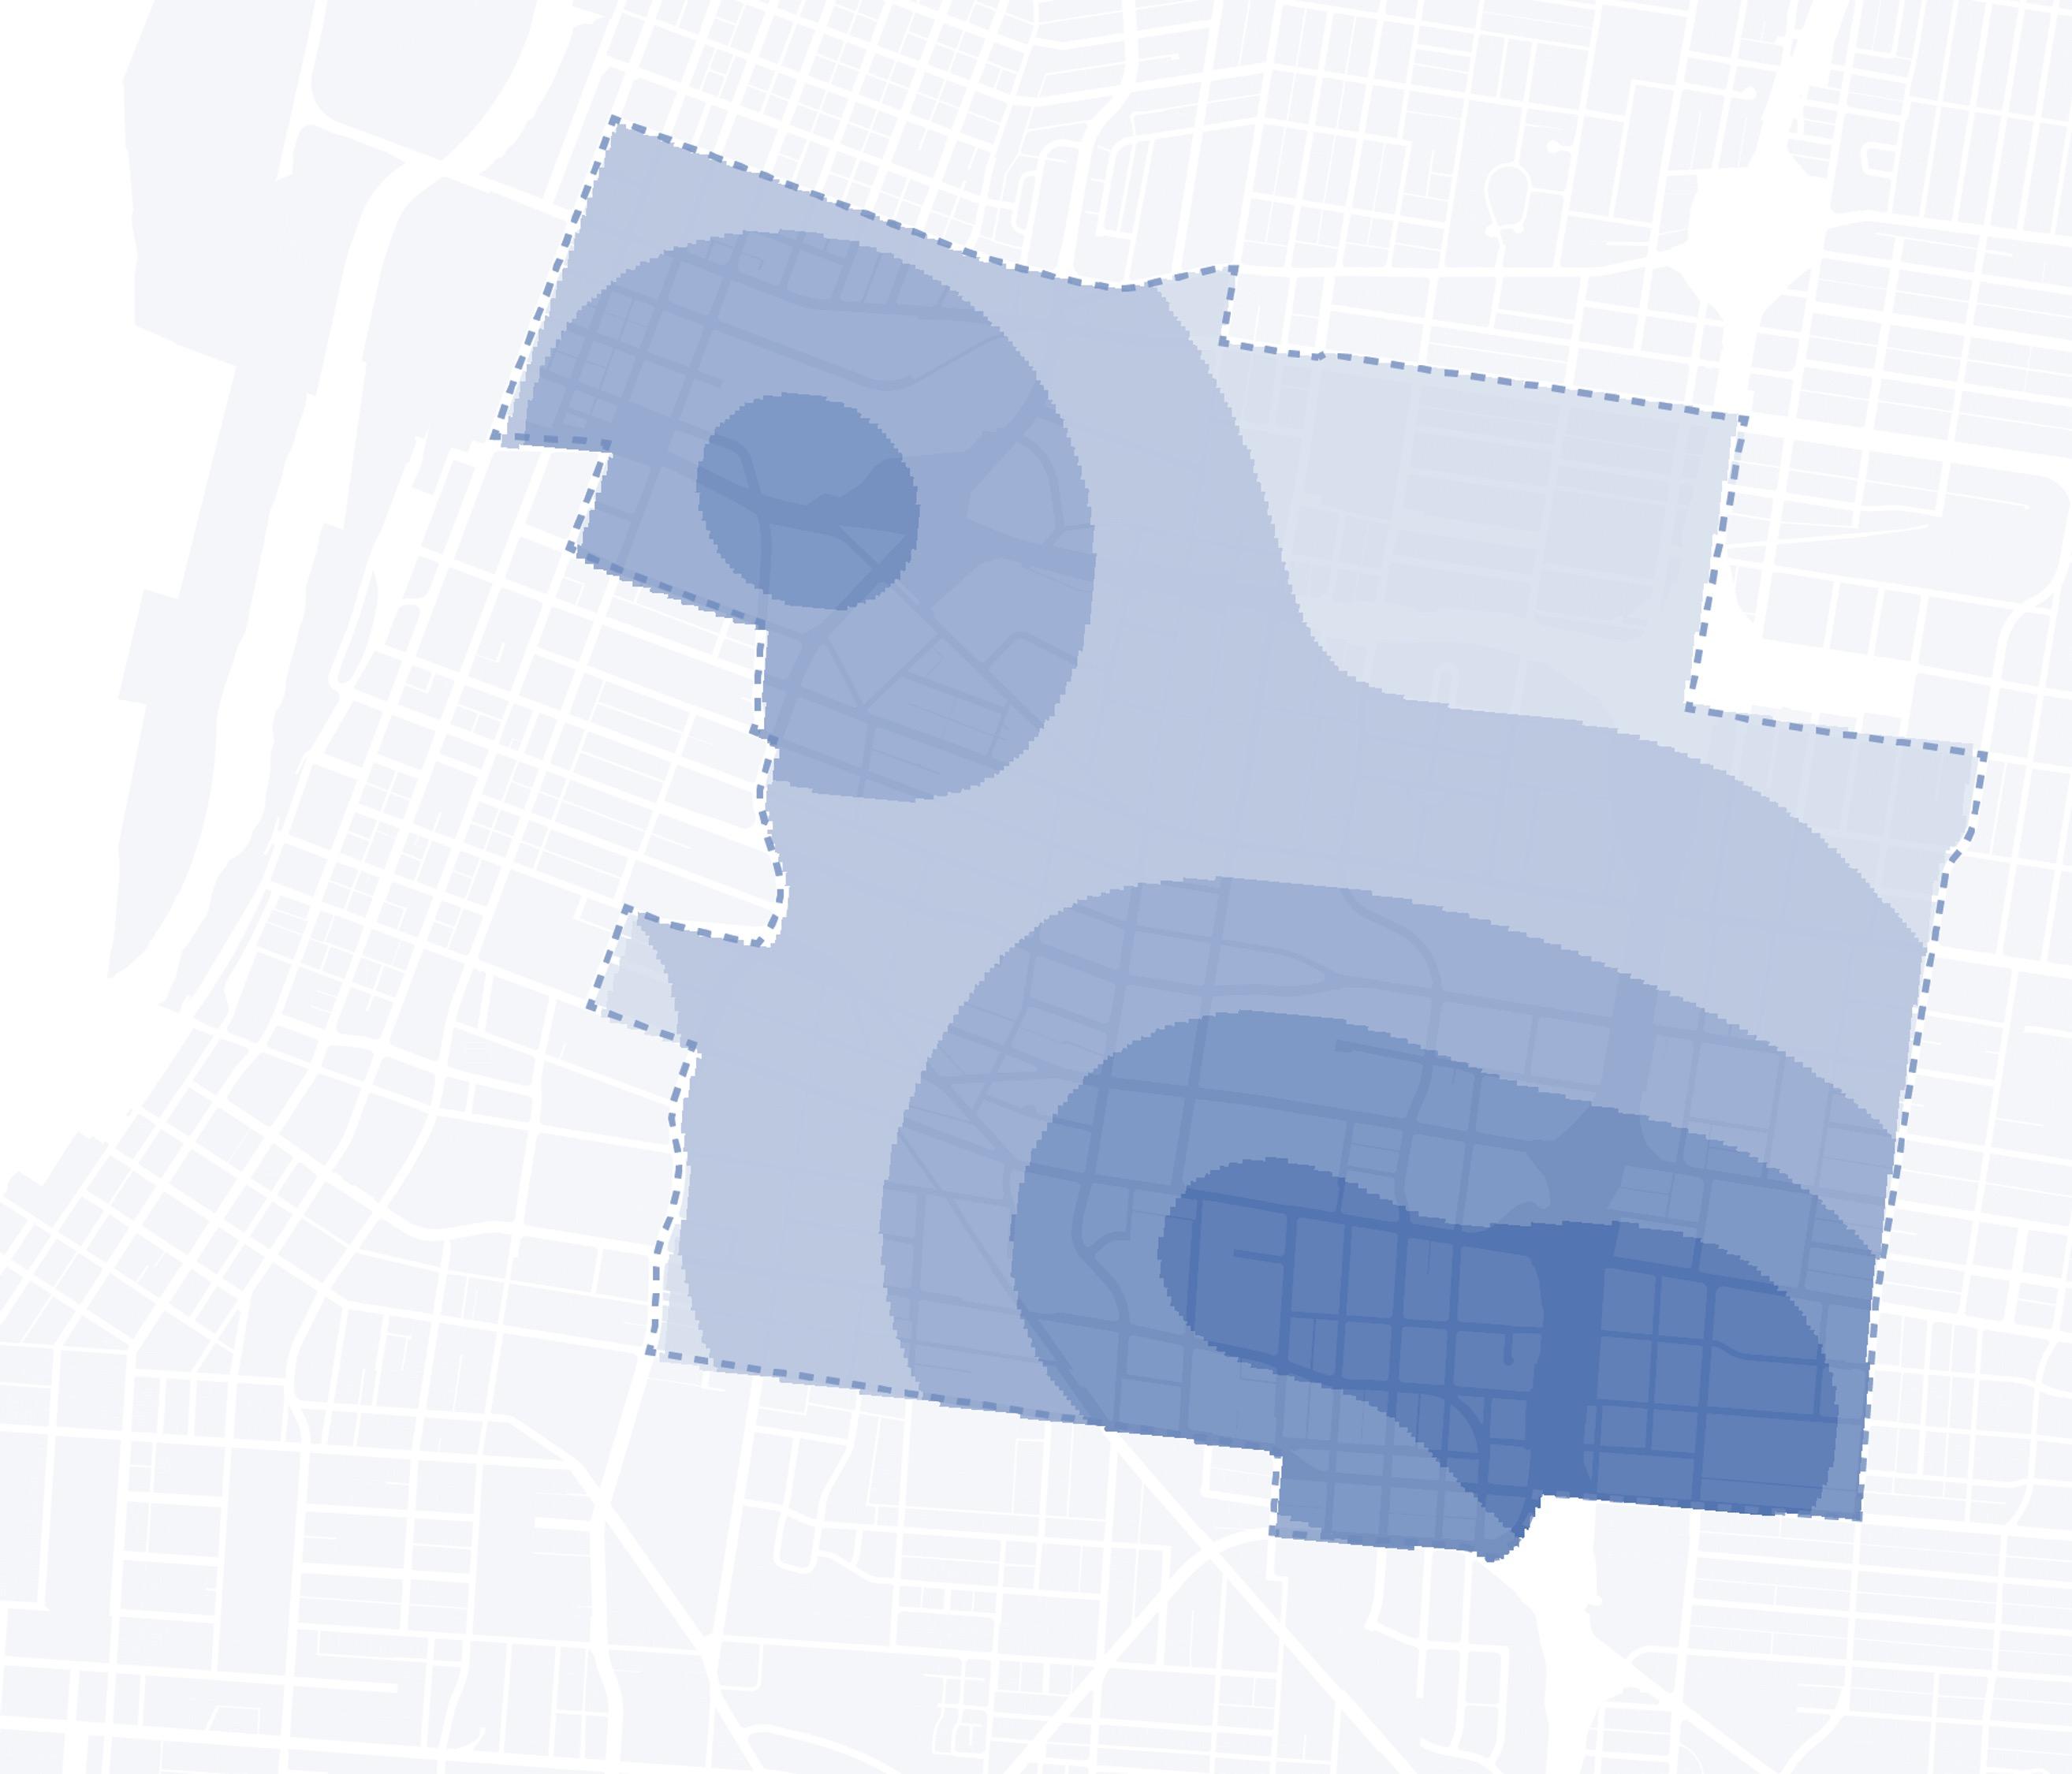
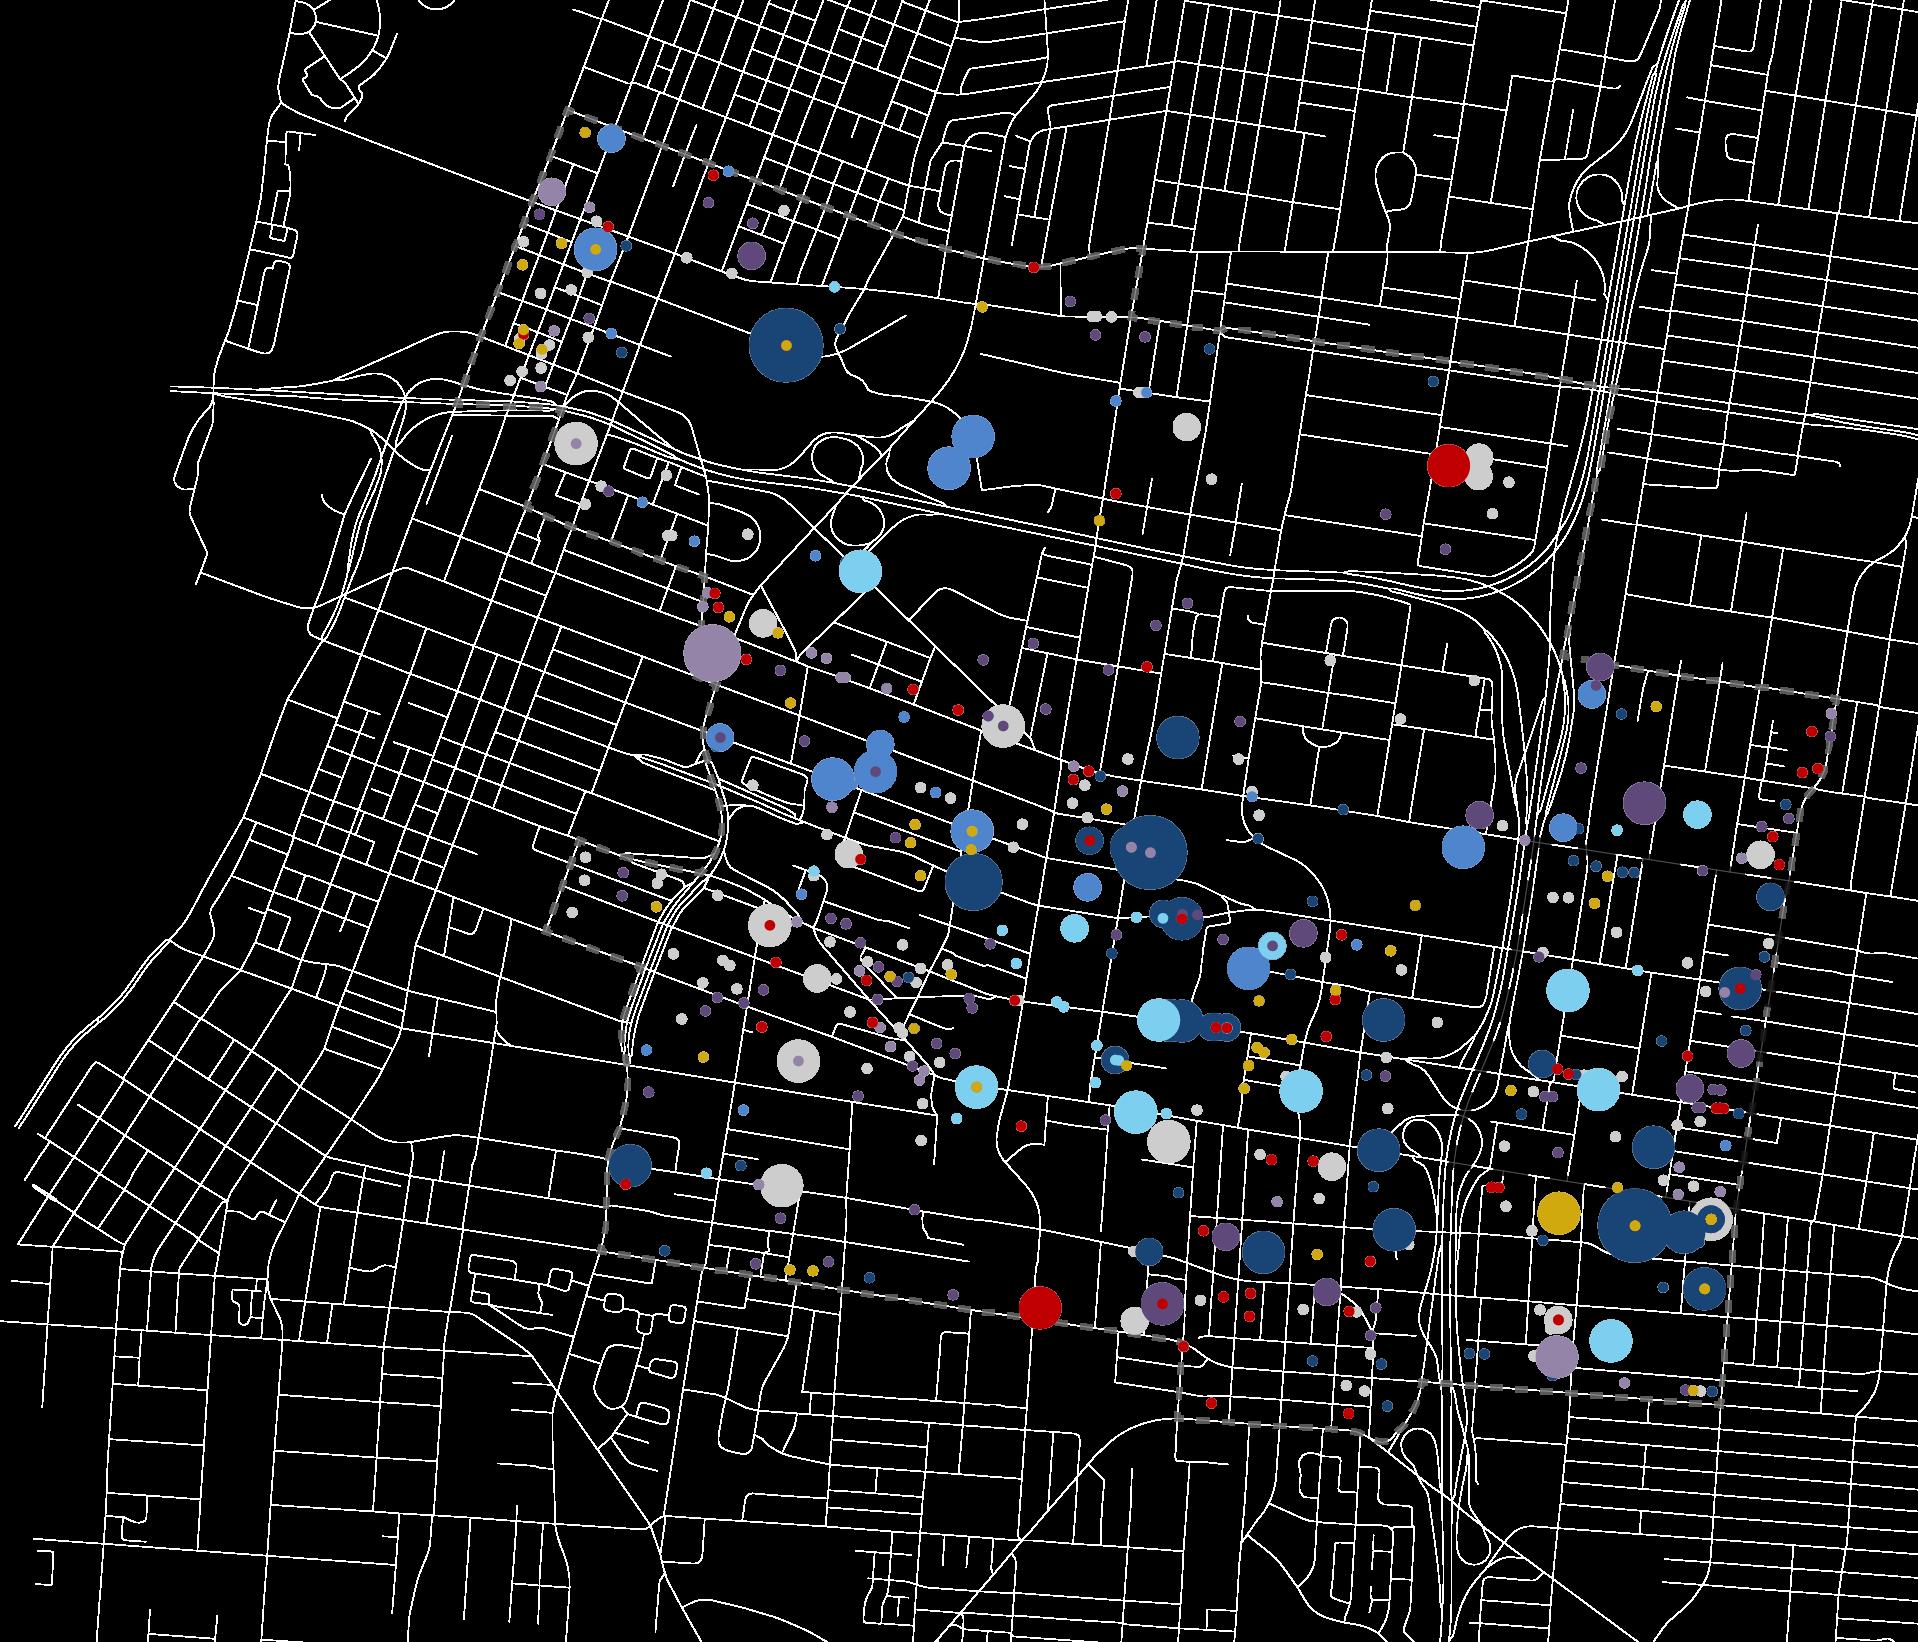
6 9 4 0 SOCIO-ECONOMIC DATA INDUSTRY Source: ESRI Business Analyst. IPEDs 2019. Jobs Per Square Mile High (19,000 or Greater) Low (1,200 or Less) Employment By Industry Healthcare & Social Assistance (66%) Educational Services (6%) Other Services (4%) Finance and Insurance (4%) Retail Trade (2%) Professional, Scientific, Technical (2%) Other (12%) Public Admin. (8%) Approximately
20 or Less 21 to 50 51 to 500 501 to 1,000 1,001 or Greater Total Employees Study Area
LABOR MARKET CHANGE
The greatest job gains in the district occurred in the Healthcare and Social Assistance, Public Administration & Educational Services with over 800 job gains for each industry sector since 2009.
Finance and Insurance Professional, Scientific, and Technical Services Information Administration & Support, Waste Management and Remediation Manufacturing Accommodation and Food Services Arts, Entertainment, and Recreation Real Estate and Rental and Leasing Utilities Management of Companies and Enterprises Transportation and Warehousing Agriculture, Forestry, Fishing and Hunting Mining, Quarrying, and Oil and Gas Extraction Wholesale Trade Construction Other Services (excluding Public Administration) Retail Trade Educational Services Public Administration Health Care and Social Assistance 879 961 1,223 (3,000) (2,000) (1,000) - 1,000 2,000 Source: U.S. Census Bureau, OnTheMap Application, (2009-2017). SOCIO-ECONOMIC DATA
DEVELOPMENT
DEVELOPMENT INTRODUCTION
Madison Heights is adjacent to areas that in recent years have seen increasing investment and development. Over $2 billion worth of institutional expansions are projected in the area, complementing an additional $137 million in humanservices and city-led projects, as well as $2.2 billion in proposed and/or recently completed projects.
Market studies conducted in 2017 indicated that the Medical District could absorb, by 2021, over 2500 additional housing units and approximately 200,000 square feet of commercial/retail space. Despite the pace of development referenced and projected above, a gap of over 1,300 units and nearly 170,000 square feet of commercial space was estimated at the start of 2020.
Even with changing market conditions given the current economic uncertainty, Madison Heights is poised to become better integrated into and benefit from development activity that meets latent market demand.

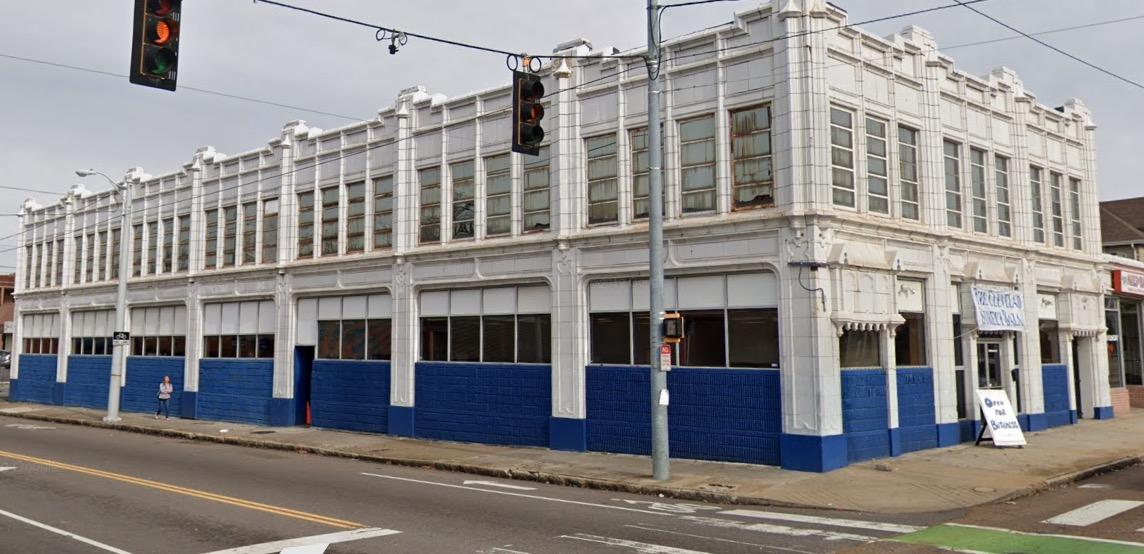 SCO MIXED USE DEVELOPMENT
1348 MADISON AVE

DISTRICT RECENT AND PLANNED INVESTMENTS Uptown Redevelopment $150 M Crosstown Concourse $202 M Bass Pro Shop $200 M Convention Center Upgrades $55 M St. Jude Campus $1.2 B Methodist University Hospital $480 M University Place $90 M Legends Park $83 M UTHSC $350 M Kroger Union $50 M South City $90 M Union / McLean $43 M Overton Square $40 M Broad Ave $30 M Shelby Farms Greenline - Phase 1 $6.5 M University of Memphis $275 M Overton Park Memphis Country Club
DEVELOPMENT IN & AROUND THE


TYPE Project Cost $ Methodist – Shorb Tower $275 M UTHSC – Campus Master Plan $500 M St. Jude – Campus Expansion $1 B Shelby County Health Department $25 M Le Bonheur Children’s Hospital $37 M FedEx Family House - Phase Three $12.8 M $2 B ANCHOR INSTITUTION PROJECTS $2 billion projected in institutional expansions 1 40 69 51 POPLAR ST MADISON AVE MANASSAS ST 3 5 2 2 2 3 4 6 1 2 3 4 5 6 Additional view of development projects available in Appendix B
DEVELOPMENT INSIDE THE MEDICAL DISTRICT PROJECTS BY


THE MEDICAL
PROJECTS BY TYPE 1 3 5 2 2 2 3 4 6 $137 million in Human Service & City Led Projects Project Cost $ Union Mission Expansion $16 M Hospitality Hub $8 M New Fire Headquarters $7 M Morris Park $2 M Poplar and Dunlap $3 M BRT – Innovation Line $75 M Juvenile Court Building $25 M $137 M HUMAN SERVICES / CITY PROJECTS 7 8 9 10 11 12 7 8 9 10 11 13 12 40 69 51 POPLAR ST MADISON AVE MANASSAS ST 13 Additional view of development projects available in Appendix B
DEVELOPMENT INSIDE
DISTRICT


INSIDE THE MEDICAL DISTRICT PROJECTS BY TYPE 1 3 5 2 2 2 3 4 6 7 8 9 10 11 13 12 40 69 51 POPLAR ST MADISON AVE MANASSAS ST $2.2 billion in Real Estate Activity 14 15 16 17 18 19 20 21 22 24 23 26 25 27 28 29 Project Cost $ Malone Park – Uptown $3 M Pinch Development - Pinch $1.1 B St. Jude Mixed Use Development - Pinch $50 M Affordable Sr. Housing – Legends Park $25 M Workforce Housing – North Poplar $8 M Apartment Rehabs – North Poplar $2 M Townhouse Infill – Peabody Vance $700 K Townhouse Infill – Victorian Village $1 M 616 Marshall Redevelopment – The Edge $3 M Chef Tam’s Underground – The Edge $700 K Slim and Husky’s – The Edge $ 1.5M Orion Headquarters – The Edge $40 M The Rise Apartments – The Edge $33 M Cycle Shop Redevelopment – The Edge $3.6 M Juvenile Court Building $1 M Union Row – Downtown Core $950 M $2.2 B REAL ESTATE DEVELOPMENT PROJECTS 14 15 16 17 18 19 20 21 22 23 24 25 26 27 28 29 Additional view of development projects available in Appendix B
DEVELOPMENT
APPENDIX A: Previous Neighborhood Engagement
PREVIOUS NEIGHBORHOOD ENGAGEMENT
As the community-development organization for the Medical District, MMDC has been privy to and/or convened, in partnership with other community partners, neighborhood engagements in Madison Heights such as:
◎ 2016: stART Project – Memphis College of Art students add temporary murals to two vacant storefronts
◎ 2017: Team Better Block leads a community walk and produces a concept plan for Madison Heights by identifying street and public space interventions. BLDG Memphis, Urban Art Commission, Urban Land Institute, and MMDC host MEMFix.
Local artist Quantavious Worship installs “901Hope Lives Here,” a mural at BAM Thrift Store.
◎ 2017 – 2018: Through multiple “Walk to Lunch” events, the “Be Aware” campaign advocates for pedestrian safety and promotes local restaurants in Madison Heights.
◎ 2018: Explore Bike Share adds two bike share stations in the neighborhood.
◎ 2019: Wonder / Cowork / Create, High Ground News, and MMDC sponsor four Memphis artists from diverse professional backgrounds to collaborate with residents and learn about the neighborhood’s assets, challenges, and create communityinformed artwork.


A:
APPENDIX
1348 MADISON AVE
APPENDIX B: Additional Development Maps
ANCHOR INSTITUTION
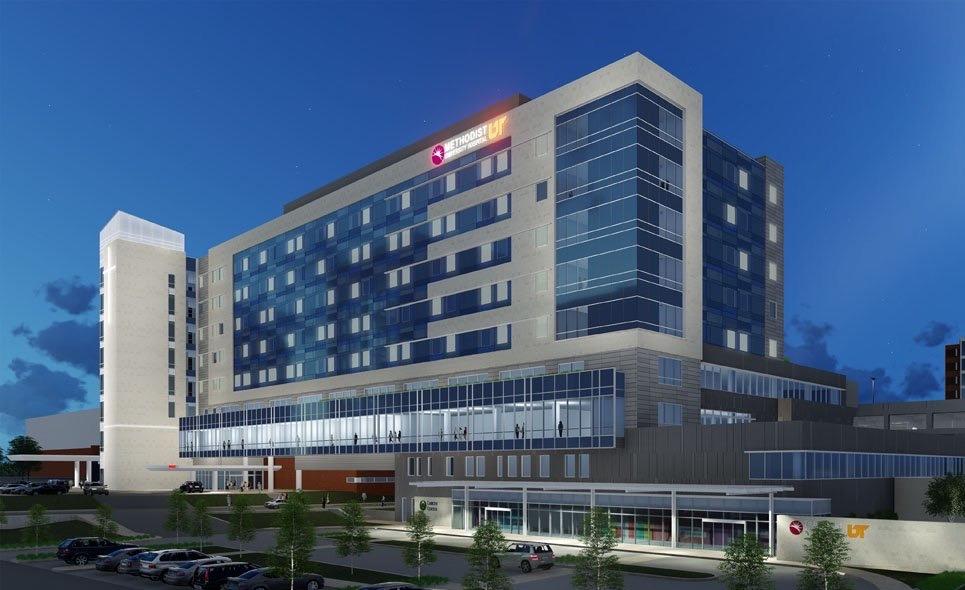
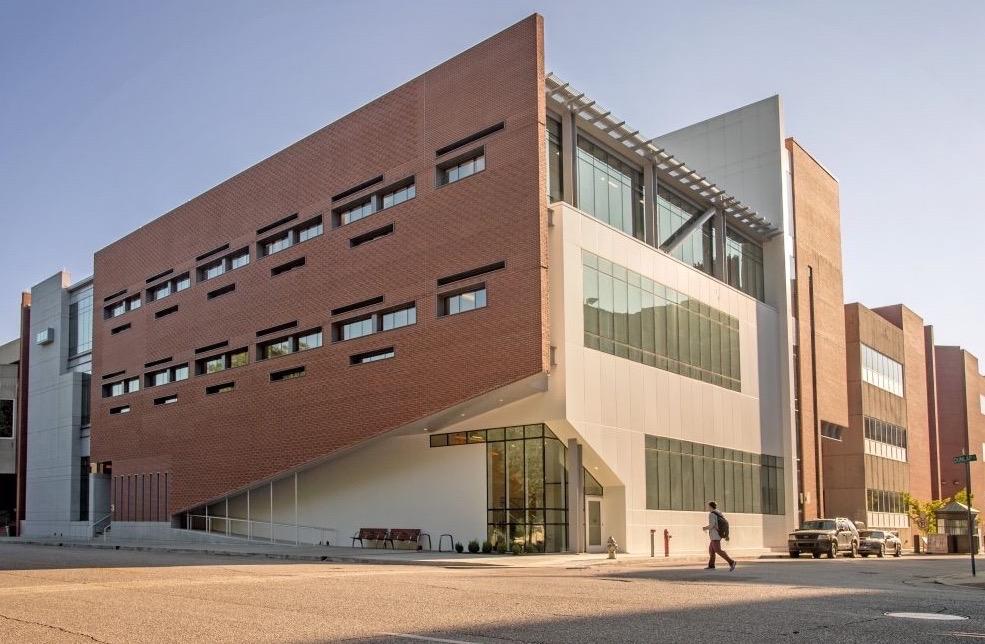
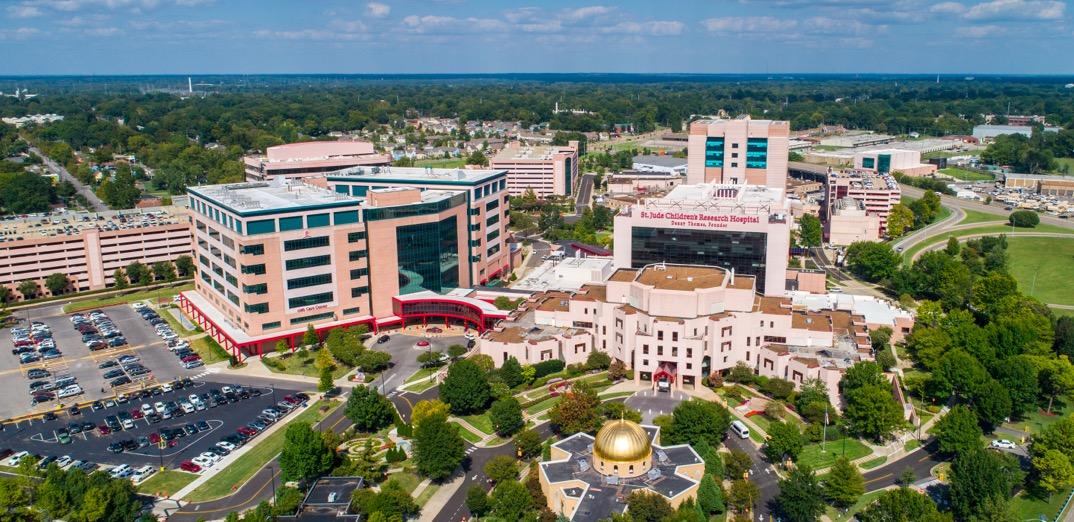


$2 billion projected in institutional expansions
EXPANSIONS 1 2
3 Methodist $275M St. Jude $1B UTHSC $500M 1 40 69 51 POPLAR ST MADISON AVE MANASSAS ST 3 5 2 2 2 3 4 6
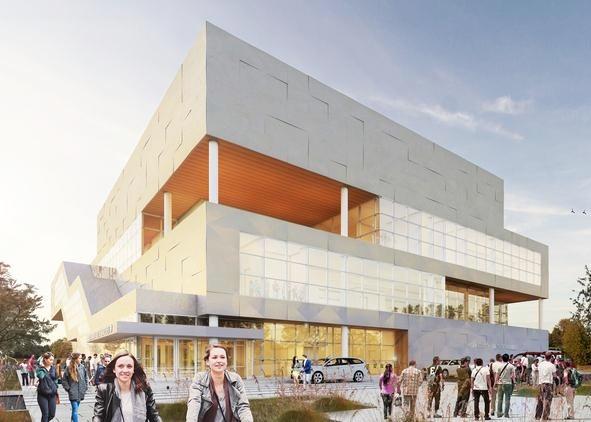
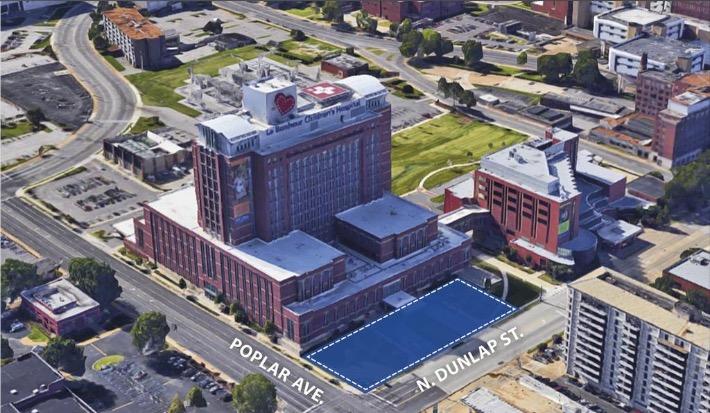
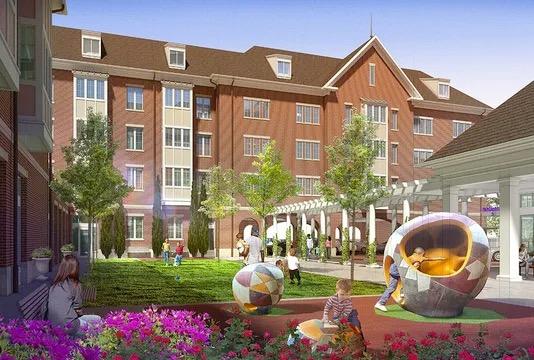


$2 billion projected in institutional expansions 1 40 69 51 POPLAR ST MADISON AVE MANASSAS ST 3 5 2 2 2 3 4 6 ANCHOR INSTITUTION EXPANSIONS 4 5 6 Shelby County $25M Fed Ex Family House $12M Le Bonheur $37M
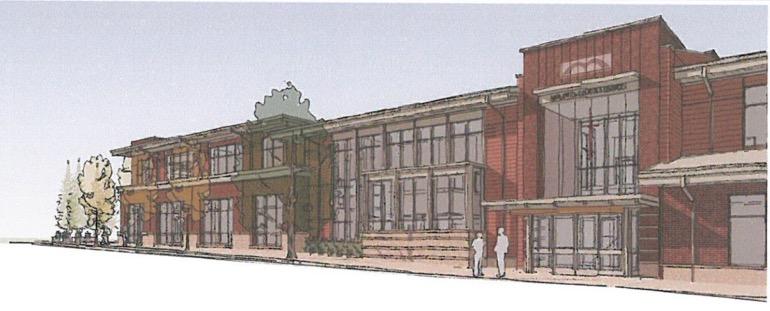
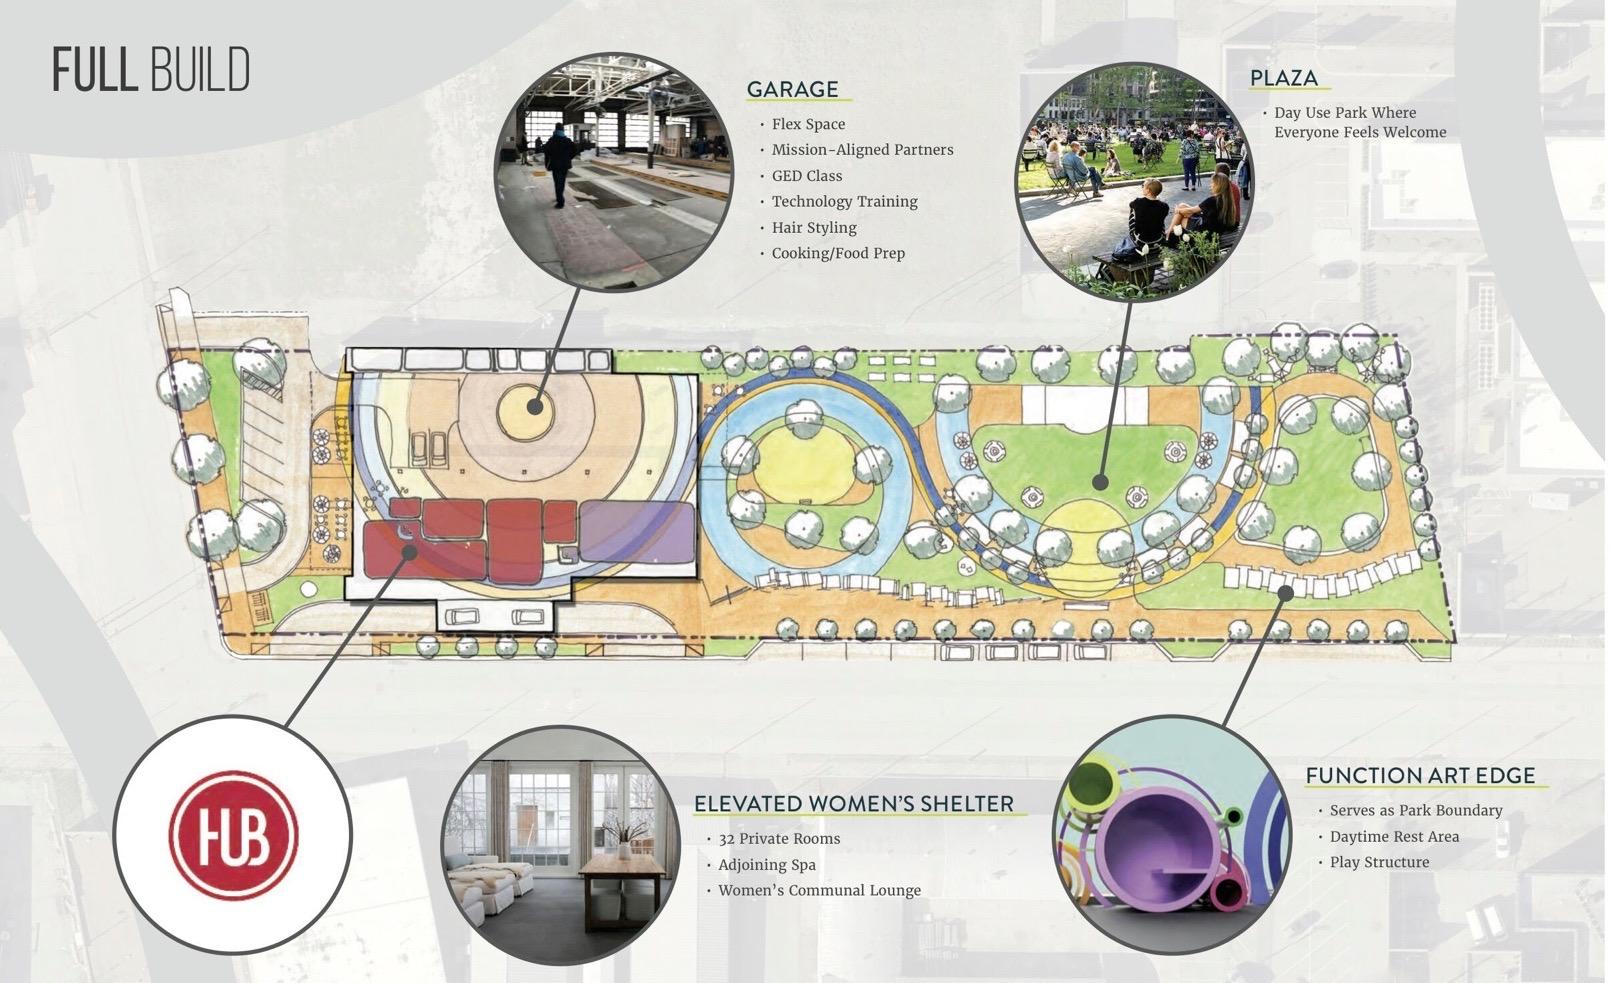


40 69 51 POPLAR ST MADISON AVE MANASSAS ST 7 8 11 HUMAN SERVICES / CITY PROJECTS 7 8 9 Union Mission $16M Fire Station $7M 9 10 13 12 $137 million in Human Service & City Led Projects Hospitality Hub $8M
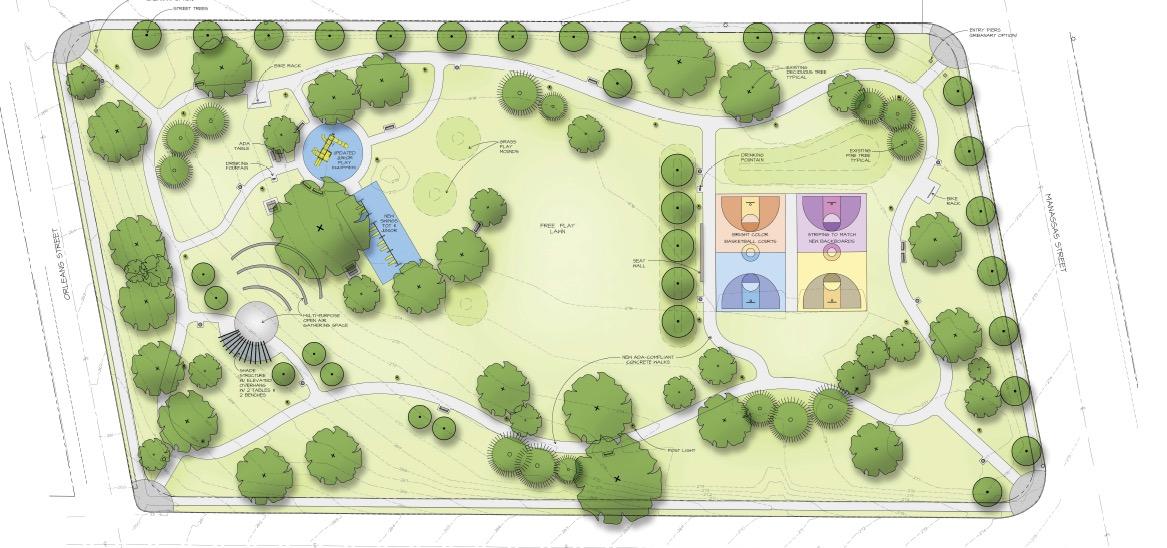
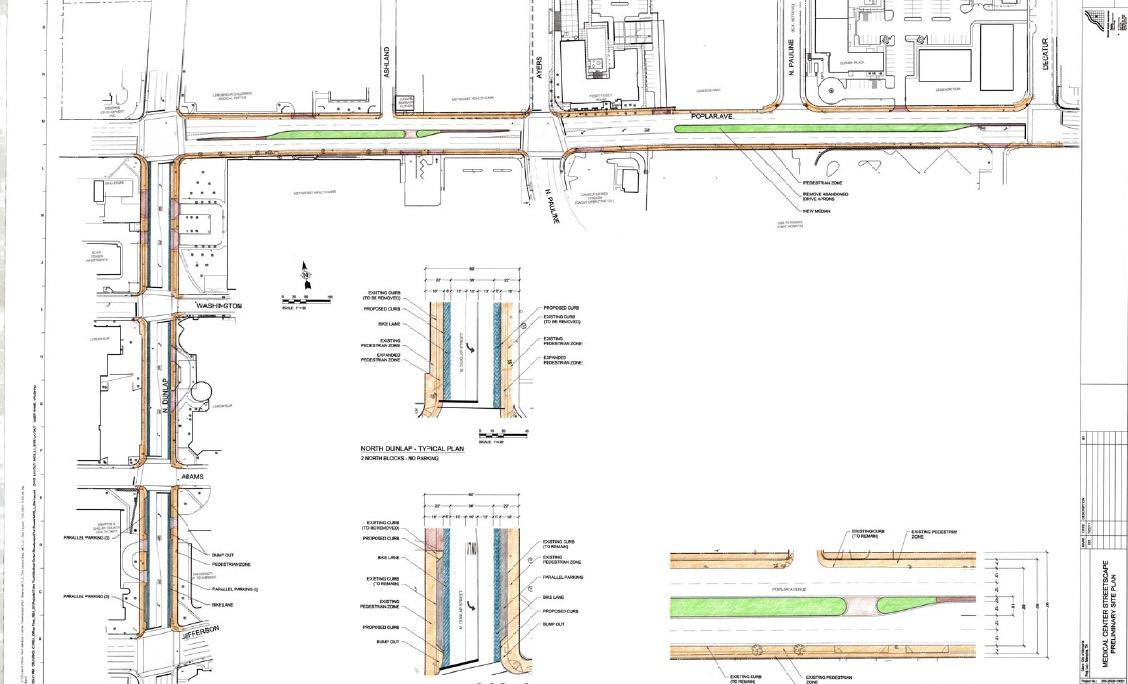
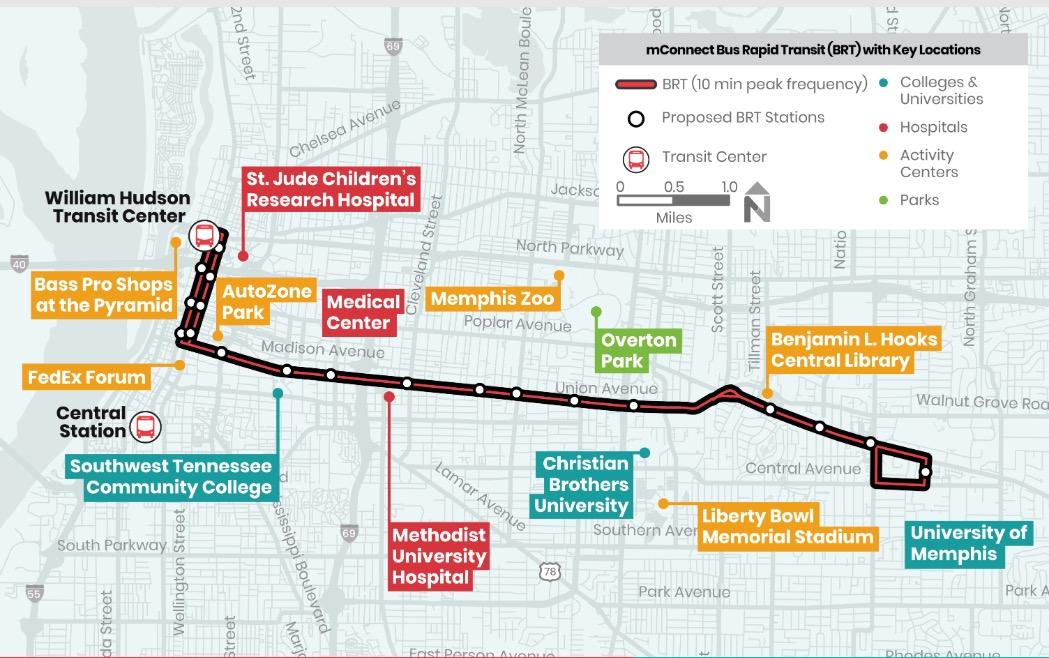


40 69 51 POPLAR ST MADISON AVE MANASSAS ST 7 8 11 HUMAN SERVICES / CITY PROJECTS10 11 12 Morris Park $2M BRT Innovation Line $75M Poplar/Dunlap $3M 9 10 13 13 Juvenile Court $25M $137 million in Human Service & City Led Projects 12
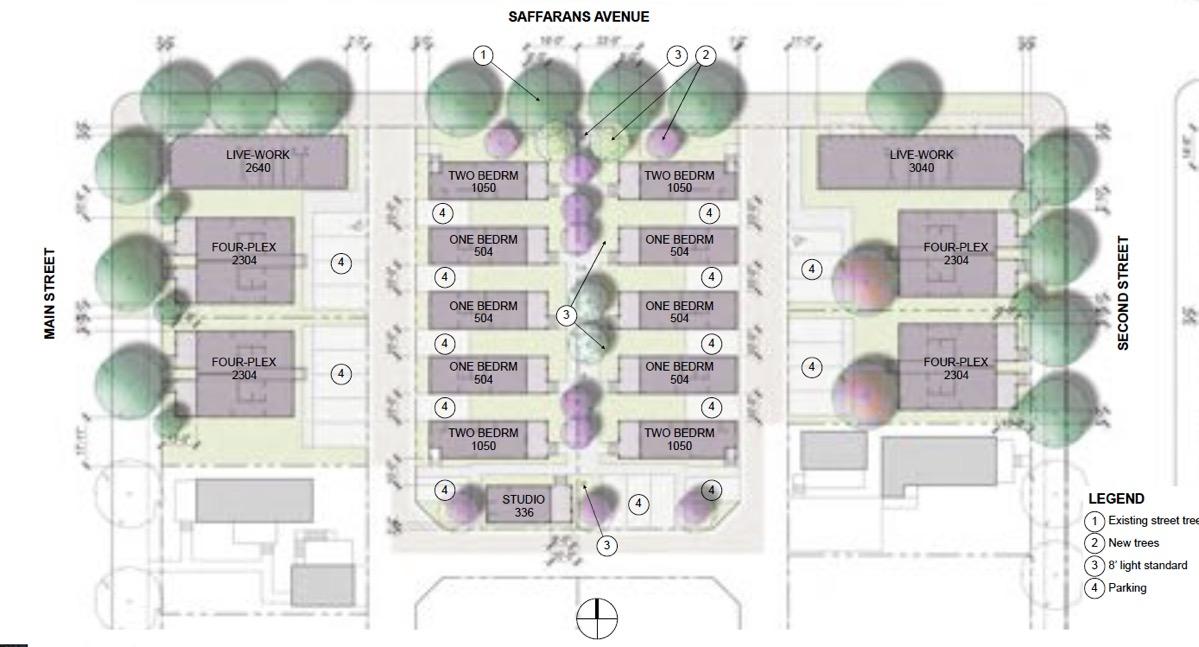

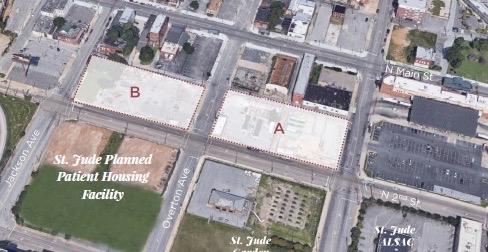
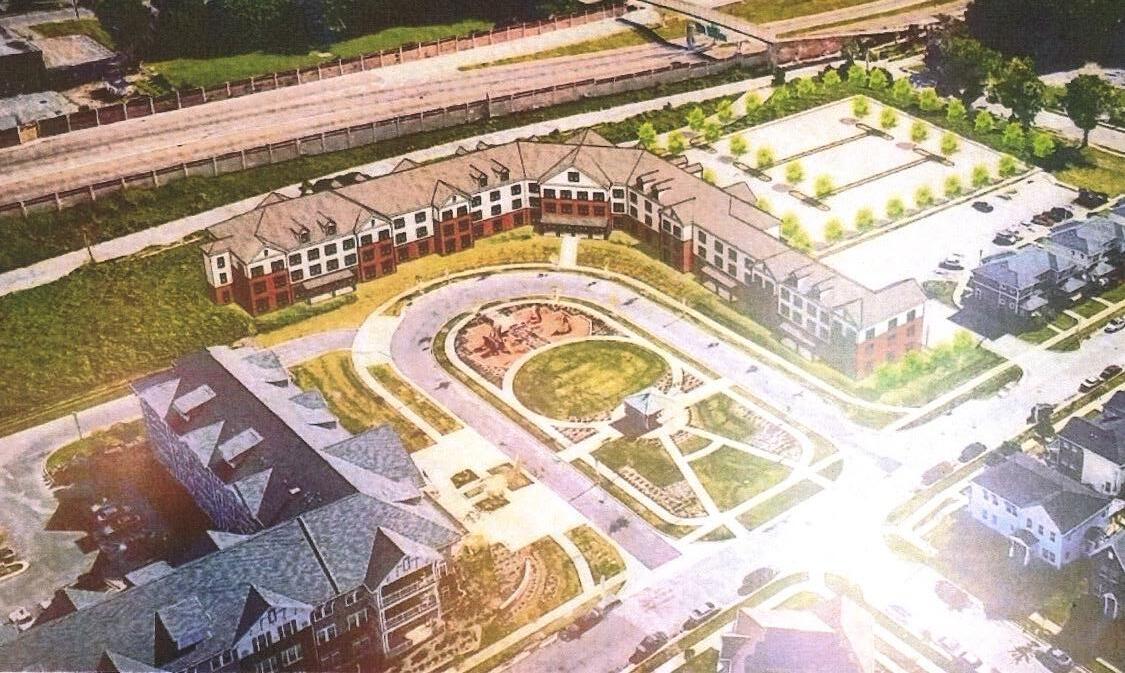


40 69 51 POPLAR ST MADISON AVE MANASSAS ST 14 15 16 17 18 19 20 21 22 24 23 26 25 27 28 29 REAL ESTATE PROJECTS 14 15 16 Malone Park $3M Pinch Development $1.1B 17 St. Jude Mixed Use $50M $2 billion in Real Estate Activity Sr. Housing 110 Units $25M
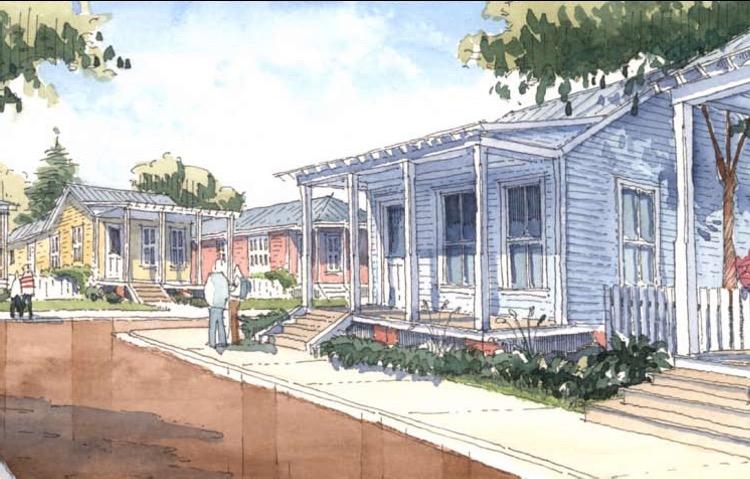
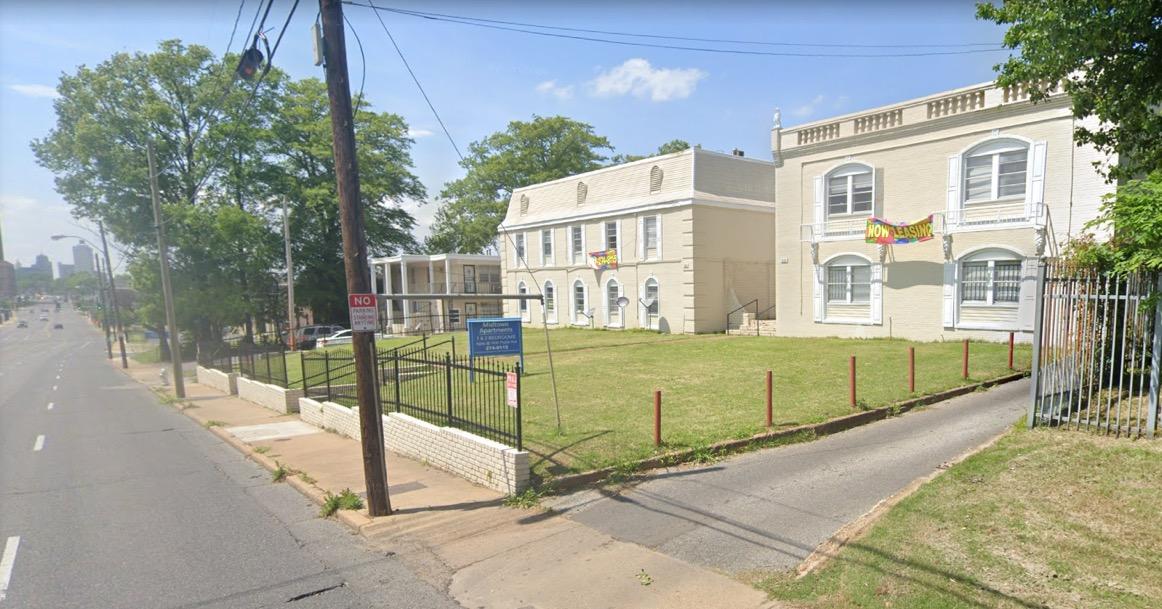

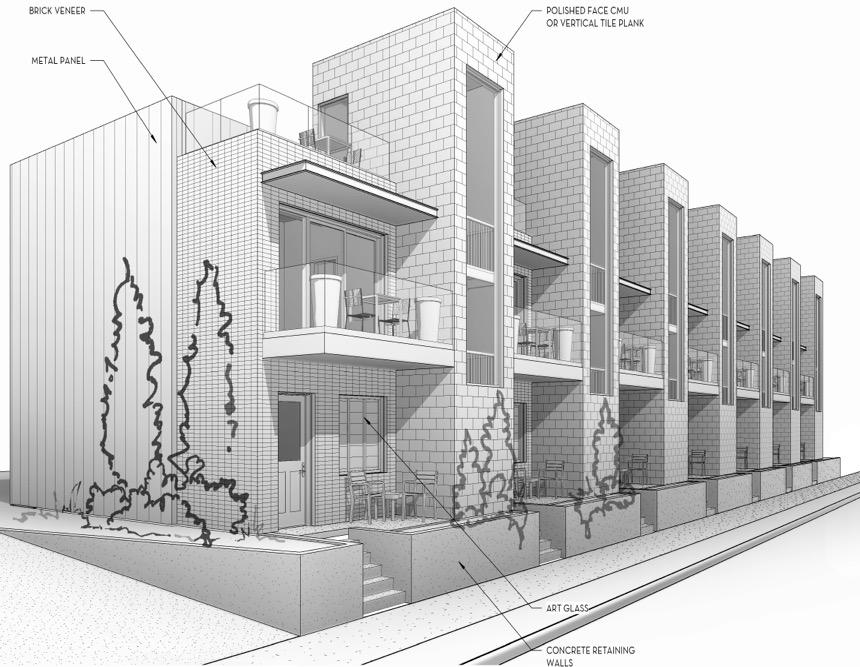


40 69 51 POPLAR ST MADISON AVE MANASSAS ST 14 15 16 17 18 19 20 21 22 24 23 26 25 27 28 29 REAL ESTATE PROJECTS 18 19 20 Workforce Housing $8M 21 Apartment Rehabs $2M $2.45 billion in Real Estate Activity Townhomes $700K Townhomes $1M
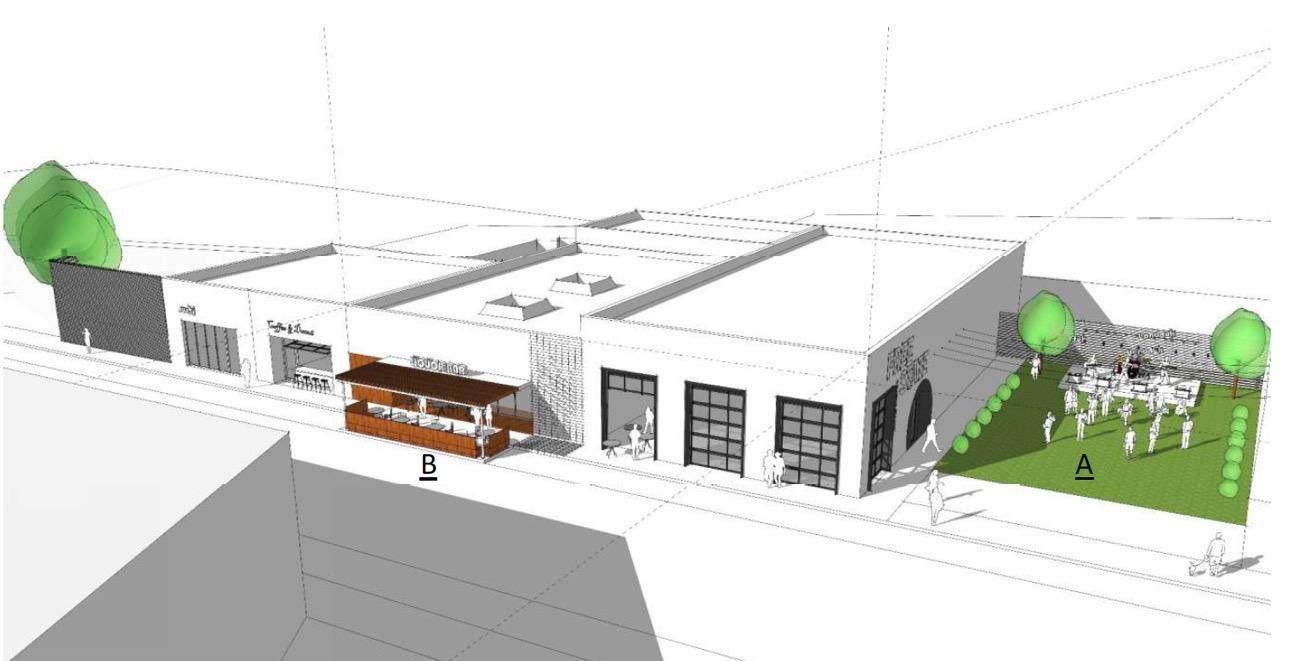
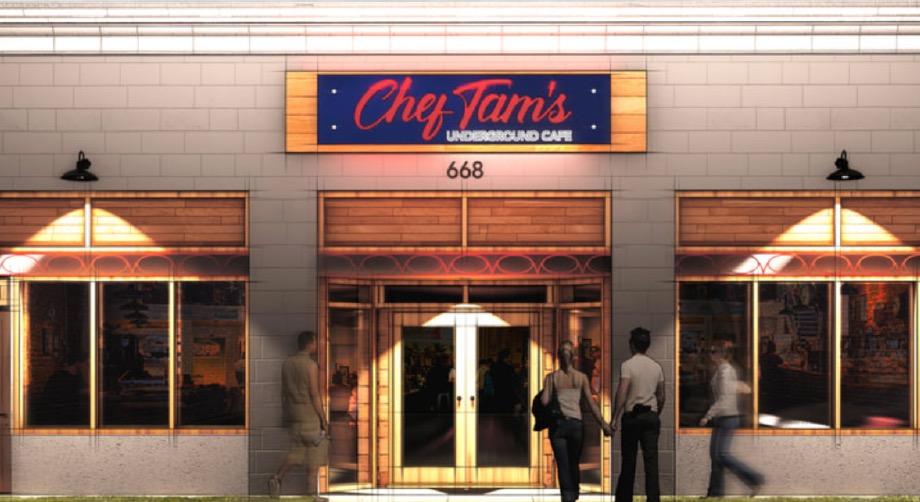

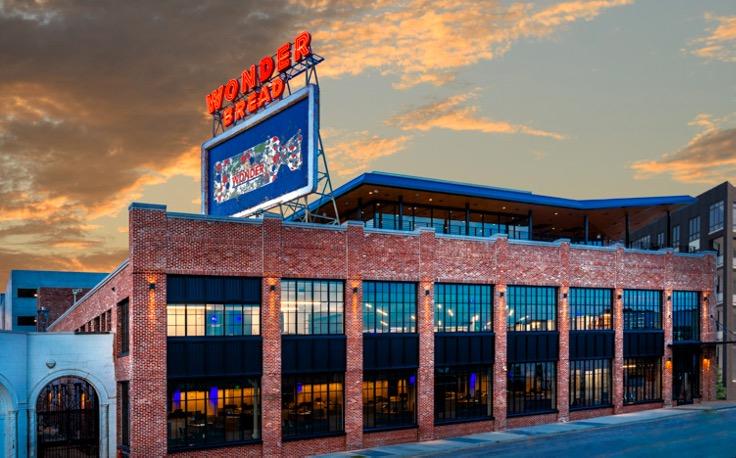


40 69 51 POPLAR ST MADISON AVE MANASSAS ST 14 15 16 17 18 19 20 21 22 24 23 26 25 27 28 29 REAL ESTATE PROJECTS 22 23 24 UTHSC $70M Chef Tam’s $700K 616 Marshall $3M 25 Slim and Husky $1.5M $2.45 billion in Real Estate Activity Orion $40M

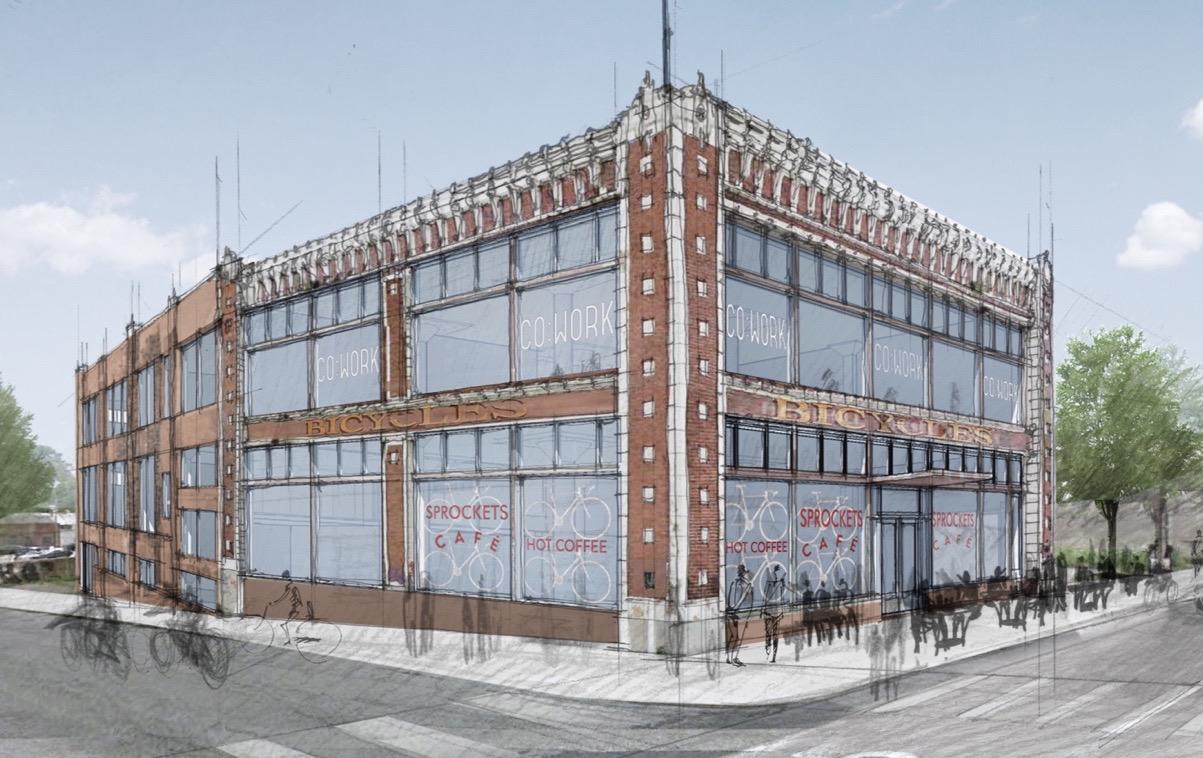
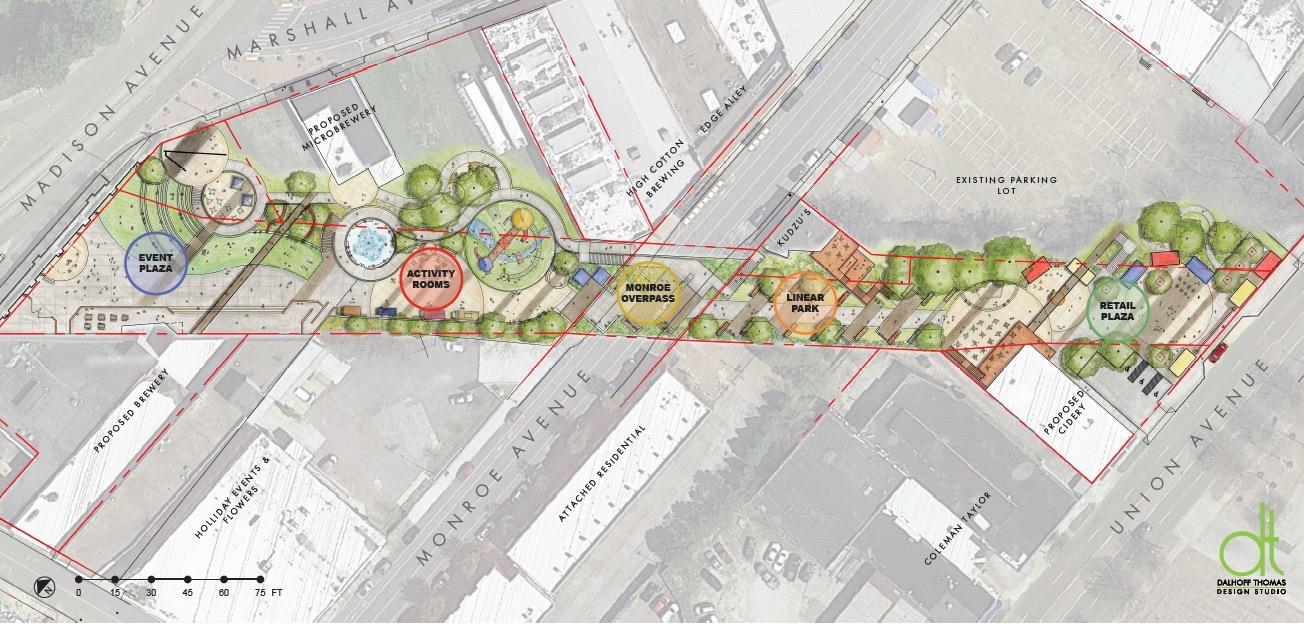


40 69 51 POPLAR ST MADISON AVE MANASSAS ST 14 15 16 17 18 19 20 21 22 24 23 26 25 27 28 29 REAL ESTATE PROJECTS 26 27 28 The Rise $33M 29 Cycle Shop $3.6M $2.45 billion in Real Estate Activity The Ravine $1M Union Row $950M
MEMPHIS LAND
USE STUDY

Study Area
Commercial Residential Industrial Exempt Institutions Mixed Uses
APPENDIX C:
Self - guided Tour
NEIGHBORHOOD TOUR
Mississippi Boulevard Christian Church
Proposed SCO Mixed Use Development | Madison Ave + Montgomery St / Claybrook St
Beauregard Properties | Potential infill housing opportunity
Community Garden | Underutilized commercial
corridor | NE Corner at Jefferson Ave + Claybrook St
Madison Heights Commercial Corridor | Madison Ave + Claybrook St
Planned Bus Rapid Transit (BRT) | Union Ave
Gateway into neighborhood | NW Corner at Union Ave +Claybrook St
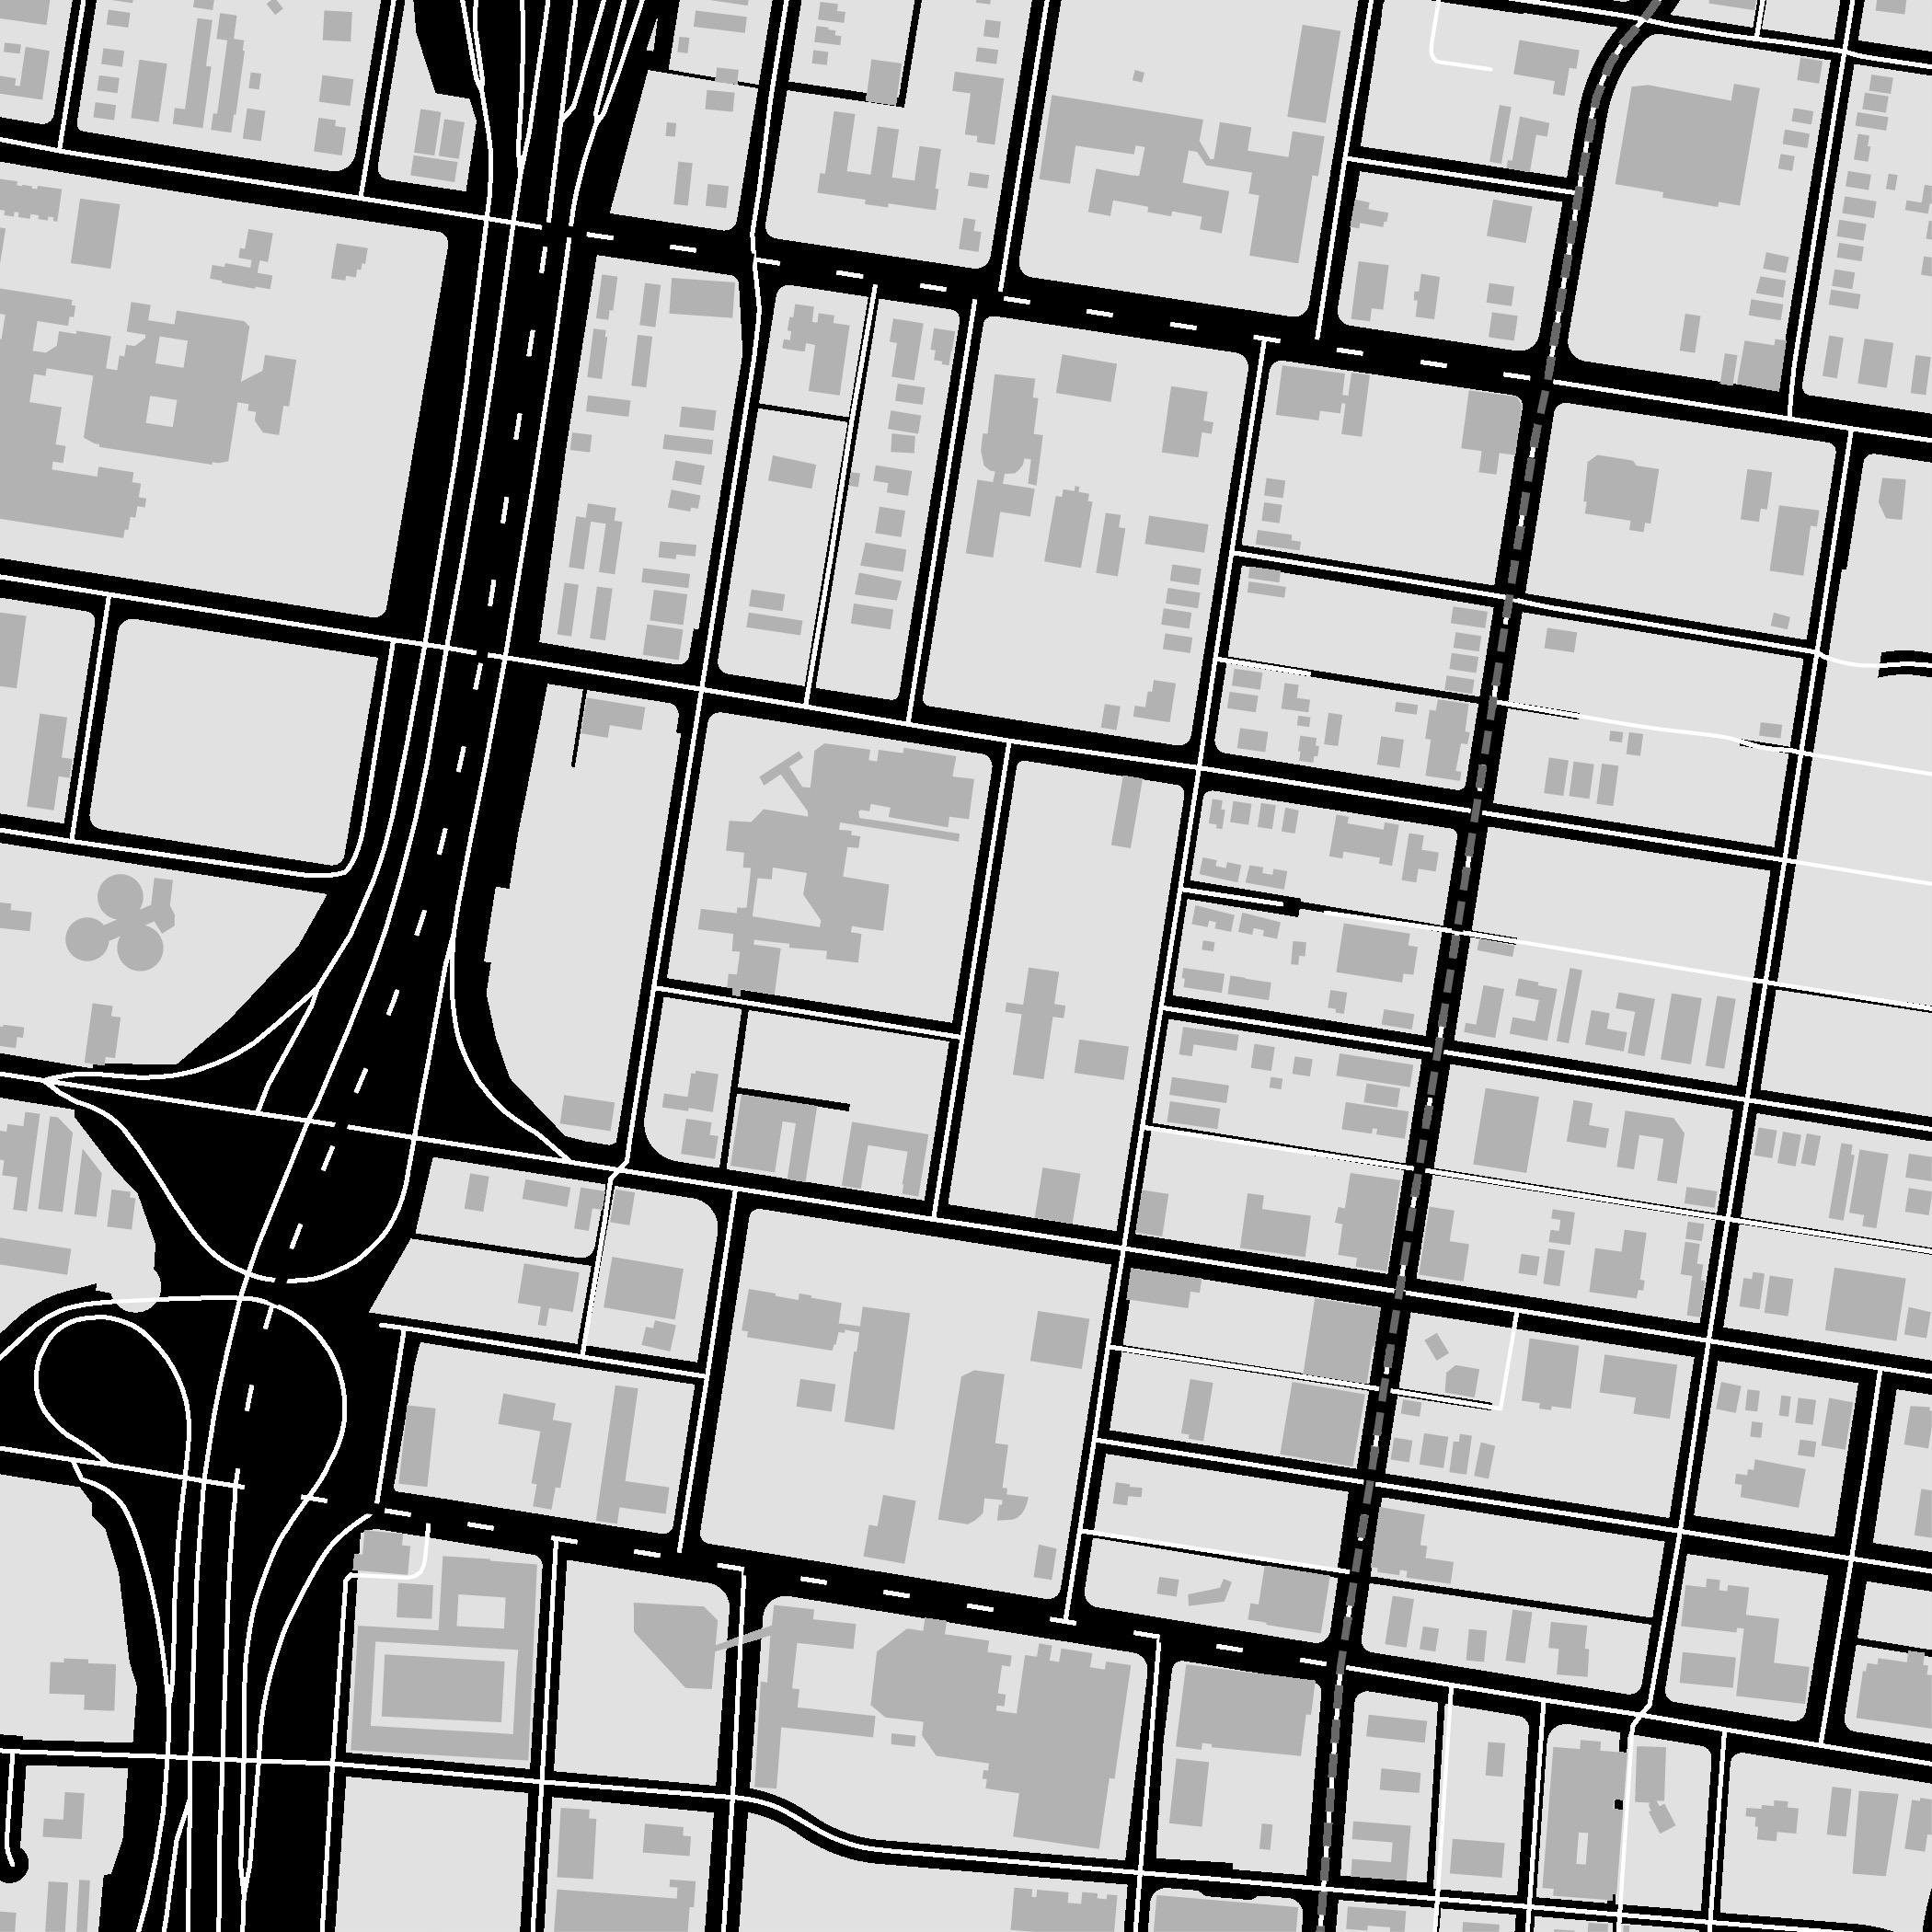
SELF-GUIDED
Poplar Ave Jefferson Ave Dr M.L.K. Jr. Expy N Bellevue Blvd N Montgomery St N Claybrook St N Cleveland St S Cleveland St N Montgomery St S Bellevue Blvd S Claybrook St Monroe Ave Monroe Ave Washington Ave Madison Ave Union Ave 1 2 3 4 5 6
7 Housing + additional Mississippi Blvd Christian Church holdings KEY POINTS 1 2 3 4 5 6 7
ADDENDUM: Media Coverage
PREVIOUS MEDIA COVERAGE
SEE ATTACHED


 VIET HOA MARKET
LOS COMALES
SOUTHERN COLLEGE OF OPTOMETRY
MISSISSIPPI BLVD CHRISTIAN CHURCH


 BAM THRIFT STORE
PHILLIP ASHLEY CHOCOLATES
MARKET ON MADISON
RIKO’S KICKIN’ CHICKEN


 SCO MIXED USE DEVELOPMENT
1348 MADISON AVE


