
15 minute read
Introduction and Background


Drowsy driving, or sleep-deprived driving, is a major cause of motor vehicle accidents. According to the National Highway Traffic Safety Administration (2018), drowsy driving is a factor in more than 100,000 crashes, resulting in 6,000 deaths and 80,000 injuries annually in the USA. When fatigued, the driver experiences multiple performance and psychological changes. He or she needs longer reaction times, has difficulty focusing, and more dangerously, can fall asleep unconsciously on the road. The driver may not notice the fatigue, especially during long or overnight trips, when their body can no longer safely operate the vehicle, and accidents often happen in these situations, causing serious consequences. There are multiple studies proposing vehicle-based drowsy driving detection systems. Biswal et al. (2021) have developed an IoT (internet of things) system consisting of a car camera for fatigue detection, crash and force-sensitive sensors for collision detection, and car speakers for drowsy alerts. The car camera uses facial expressions and eye movements to track the driver’s fatigue level, and the vehicle plays alert sounds or auto-pilots to the street side. Arimitsu et al. (2006) use the video camera and the lane deviation sensor on the vehicle to monitor driver drowsiness, and they create a seatbelt motor, which vibrates the seatbelt when fatigue is detected, to stimulate the driver. Both proposals effectively awaken the driver without causing discomfort, and new vehicles are adopting such systems through hardware and software updates. A few vehicle manufacturers, including Ford, Toyota, Volkswagen, and Volvo also have drowsiness detection technologies with eye and head-tracking cameras and steering wheel movement sensors. However, not all owners can afford a major upgrade on the car since the existing anti-drowsy systems are embedded in the vehicle itself. Therefore, we are motivated to design a wearable device, the VIVE headset, that is easy to carry around, detects drowsiness, and keeps the user awake. Due to the device’s high portability, the user context can be expanded to more situations that require concentration but may induce fatigue, such as listening to lectures, working night shifts, or attending long meetings. The VIVE headset has a simple design concept. We aim to use an intervention (independent variable) to decrease drowsiness (dependent variable), which will further improve concentration, performance, and driving safety. The level of drowsiness is measured through suitable physiological indicators, which will be discussed in the next paragraph.
Figure 1. Conceptual Framework
Advertisement
We decide to locate the device on the head for two reasons. First, for drowsiness measurement, substantial evidence has suggested that eyeblink patterns accurately indicate fatigue and drowsiness, with data collection methods much easier than ECG (heart and respiration rate) and EEG (brain activity). Danisman et al. (2010) report that their database, trained using a 320x240 resolution webcam, detects drowsiness with 94% accuracy and a 1% positive rate by monitoring the eyeblink duration changes. Chowdhury et al. (2015) also find that blink frequency, duration, amplitude, and the proportion of time in a minute that eyes are 80% closed (PERCLOS), effectively indicate drowsiness with p < 0.01 among 138 participants. Though most existing studies use cameras to monitor eyeblinks, due to client privacy issues, we plan to use a sensor on the device instead. Located on the upper head, the device is in close proximity to the eyes and can detect eye movements through lightweight infrared, noise, or muscle (EMG) sensors. An algorithm will be trained to recognize different users’ drowsy and non-drowsy blink patterns, setting an appropriate threshold between the two.
Second, for the intervention that awakes the user, thermal stimulation (temperature change) and tactile stimulation (vibration or air-blowing to the skin) have been found to reduce drowsiness without inducing discomfort. Goto et al. (2022) developed an anti-drowsy system with cold and warm skin stimulations, which could change the participants’ autonomic nervous system activity and reveal an improvement in alertness and concentration. Saket et al. (2013) mark that vibrations with 200-600ms gaps, widely used for phone and smartwatch notifications, give users a sense of urgency and alertness while not disrupting others by sound. Since vibration can be simply achieved by small and lightweight electric motors, we decide to provide vibration through multiple areas on the headset that directly touch the skin on the back of the user’s ears, neck, and scalp, which is very sensitive and can cause the best results.

To summarize the device mechanism, it has two main components: the blink detector and the vibrator. The embedded algorithm in the detector keeps monitoring and determines the user’s fatigue level. If it is above the threshold, the vibration will be activated, which alerts the user and decreases drowsiness until below the threshold. Then, the vibration will stop until drowsiness is detected again, creating a feedback loop. In the next section, we provide a method to test this hypothesis: the vibration intervention will decrease drowsiness and change the user’s cognitive status.
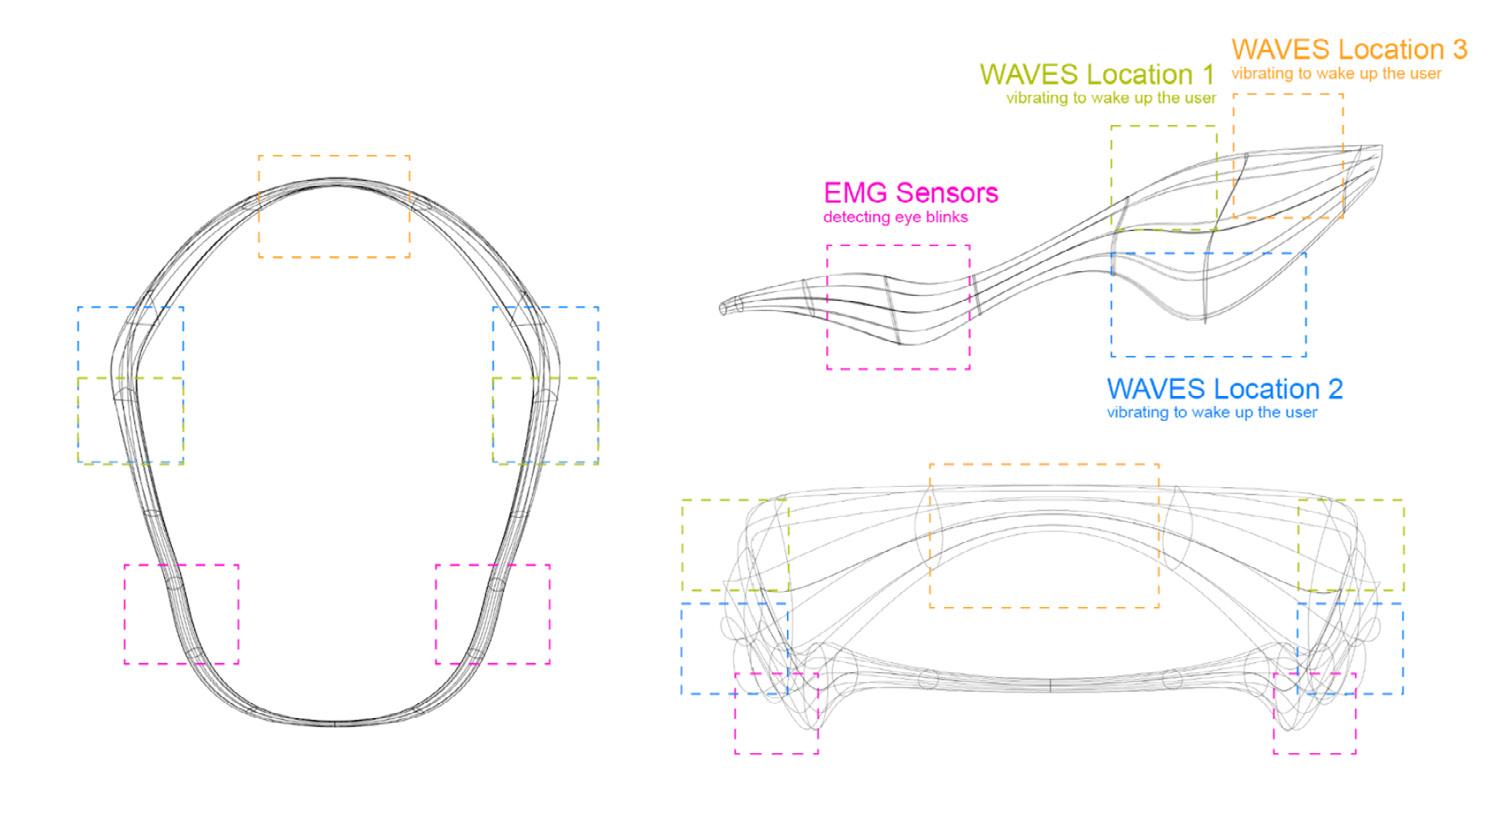
Material and Technology
The VIVE headset comprises three technical units: the muscle detector, the vibration generator, and a chip for analyzing the data. The muscle detector is located near the outer side area of the eyes, detecting mainly the orbicularis oculi muscles’ movements when the user blinks. The data is transmitted to the chip using machine learning to analyze the user’s blinking frequency and characteristics. After studying the user’s abilities, the vibration generator will be therefore activated accordingly when it receives the signal of fatigue. The vibration generator sends strong and concise motions directly to the user’s skin to alert the user without loud sounds and annoyance. The sensibility of the user’s skin and their consequential reaction may vary, therefore we have chosen three different vibration locations to test the adaptations: one above the ears, one under the ears, and the other one on the back head area. The three locations are incorporated into the existing design with enough space for placing the generators as well as structurally hold the weight and stable the wearing. The charging location is on the headset’s inner side, designed to be wireless charging. The battery will be located along with the vibration generator to provide stable electricity to the motor. It will use fewer electrical wires inside the device to avoid redundancy of wires. The material of the shell is selected to be carbon fiber because it has high stiffness, high tensile strength, low thermal expansion, and is lightweight. Thus it could hold the delicacy of the chips inside nicely, and when the overheating of technical components occurs, it will not deform very easily.
Geometry Design Principles
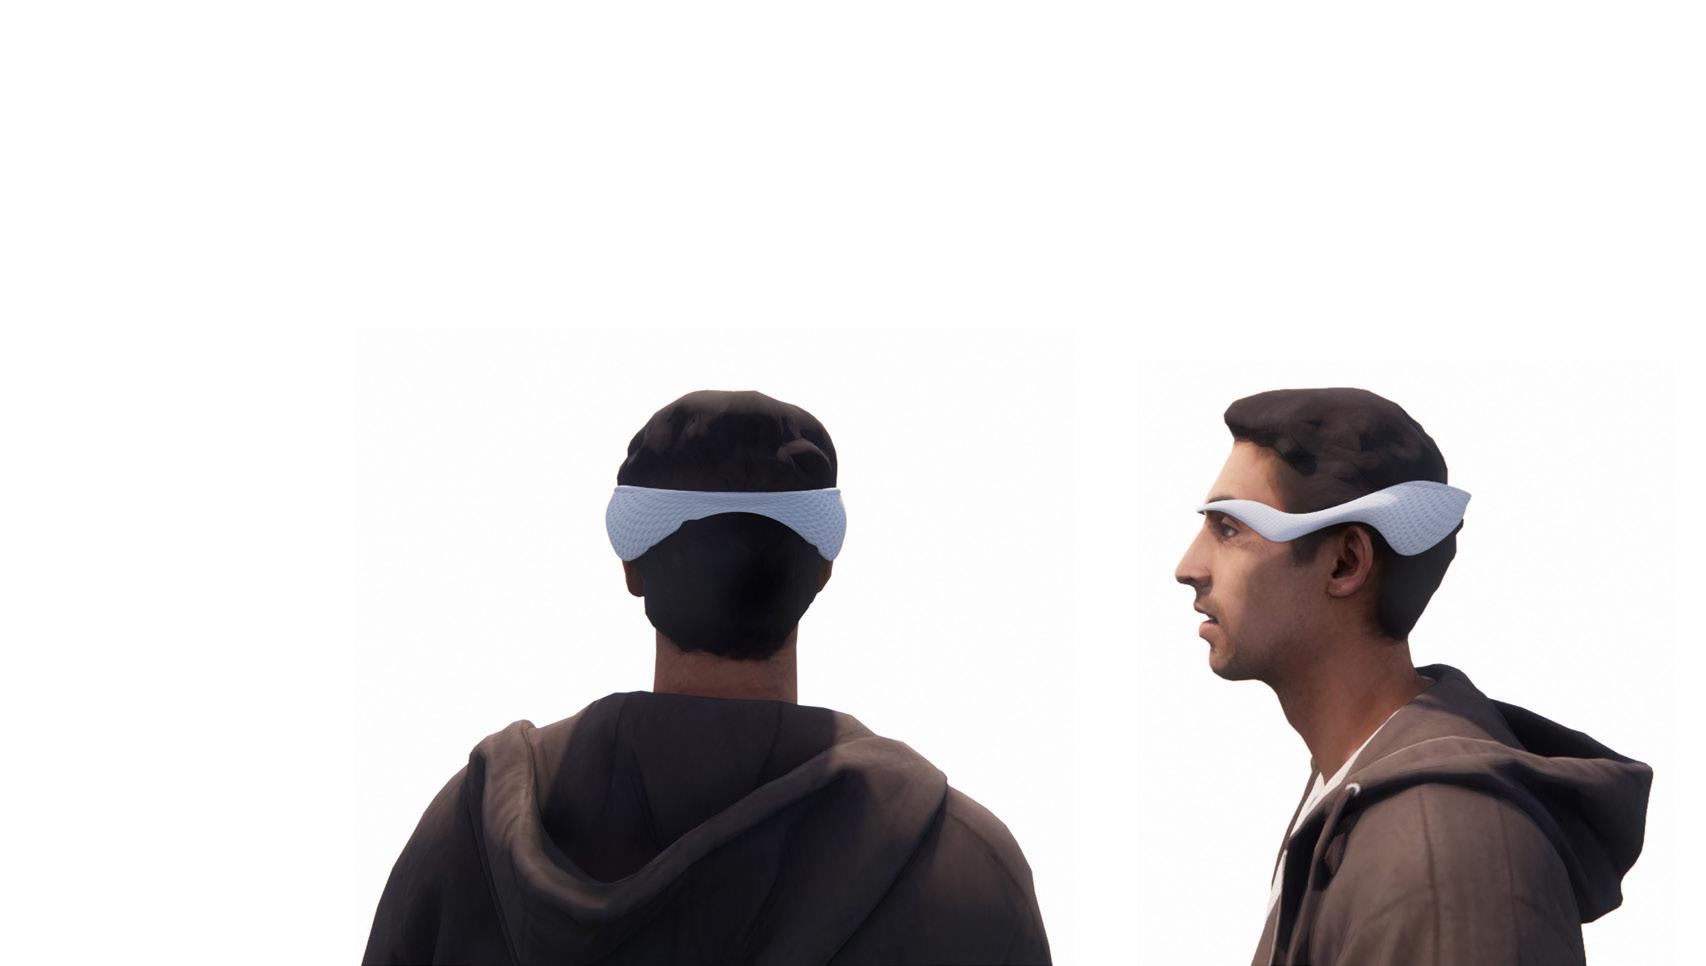
The overall aesthetics of VIVE is inspired by the brain waves chart, especially the Theta wave shape, the one for drowsiness. In the design of the VIVE headset, our team uses one universal head size for the basic dimension: 59 cm in circumference, with two radii of 11.1 cm and 8.2 cm. Along with this dimension, the shape of the device is designed to be aligned with the head geometry, to provide a more comfortable and productive form for the users. Longitudinally, the overall thickness and weight of the headset descend from the back to the front. The weight of the device is expected to be loaded on the backhead area and the area upon the ears. Horizontally, the device is designed in a symmetrical geometry, to structurally balance the weight on both sides and stabilize the wearing. On the upfront area, this device is bridged by the thin tube above the eye area. It is designed to balance the horizontal shearing and avoid blocking the eyesight.

White Carbon Fiber

Carbon fibers are about 5 to 10 micrometers in diameter and composed mostly of carbon atoms. Carbon fibers have several advantages: high stiffness, high tensile strength, high strength to weight ratio, high chemical resistance, high-temperature tolerance, and low thermal expansion.
Muscle Sensor for Detecting Eye Blinks
Arduino-powered, electromyography (EMG) sensor kit

It acts by measuring the filtered and rectified electrical activity of a muscle; outputting 0-Vs Volts depending on the amount of activity in the selected muscle, where Vs signifies the voltage of the power source.
Methods
Due to technology and time limitations, the relationship between blinking patterns and drowsiness will not be our focus. This experiment only aims to test if our intervention with the VIVE headset is able to decrease participants’ drowsiness and aids them in retaining attentiveness.
The experiment is divided into two stages. Stage I focuses on finding the most effective location for the vibration, and Stage II focuses on finding if the device actually impacts one’s performance for tasks requiring continuous attention. Stage II is also separated into two rounds: Round 1 studies the form of the device, and Round 2 studies the vibration function of the device.
Two prototypes are used for this experiment: the shape prototype (Figure 3) and the vibration prototype (Figure 4). The shape prototype is a 3D-printed form of the actual device but without all other functions. The vibration prototype is a vibration device that can be attached to one’s head and can be controlled by the researchers using a remote control from a distance.
Stage I requires 6 participants. We aim to find out the location on the device where the vibration is the most effective for the participants to retain alertness and attentiveness. Therefore, this stage is conducted only with the vibration device. The vibration device will be attached to 3 different locations on each participant’s head/ neck area (Figure 5), and vibration will be activated in each location one by one. After the participant has experienced vibration in all listed locations, the participant shall rank the effectiveness of vibration in the locations based on their own opinion.
Only quantitative data is collected in this stage: the order of the ranking is converted into points, the first place gets 3 points, and the third place gets 1 point. Among all 6 participants, the location with the most points will become the location of vibration for the experiments that use the vibration prototype in Stage II.
Stage II requires nine participants. Since we aim to find out if the device can alter the participants’ performance on certain tasks requiring continuous attention, we set up three different task scenarios for the participants. The participants are divided into three groups, with 3 per each task.
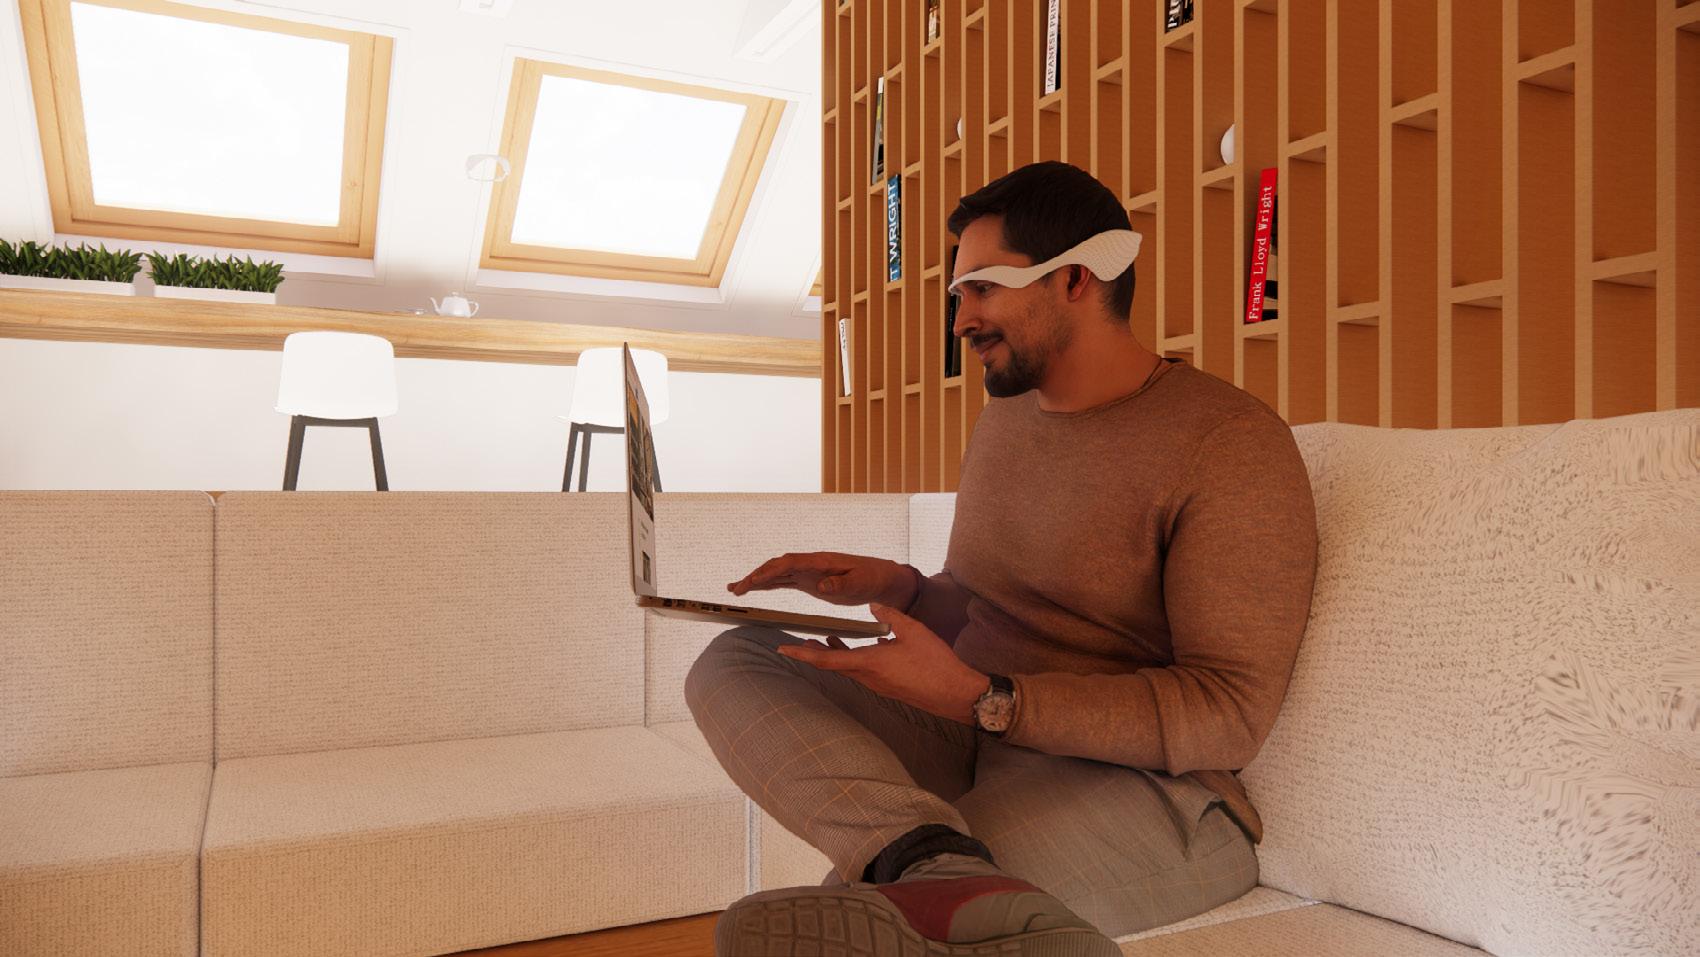
Task 1 requires the participants to recall information from two ten-minute-long TED Talks (one for each round). The TED Talks are provided by us and will be the same for all participants. Participants will be allowed to take notes. At the end of each round, the participants will be asked to summarize the TED Talk in a few sentences.
The impact of the form of our VIVE headset and the vibration function are studied separately: for Round 1, participants are asked to watch TED Talk A while wearing only the shape prototype; for Round 2, participants are asked to watch TED Talk B while wearing only the vibration prototype. The frequency of vibration would be the same for all participants, controlled by us, and the participants would not know exactly when the vibration would be activated.
A special note on this task is that the participant’s performance on the summarization will not be evaluated –the only purpose is to simulate a setting that expects one’s continuous attention, but this information will not be revealed to the participants until they have finished the experiment.
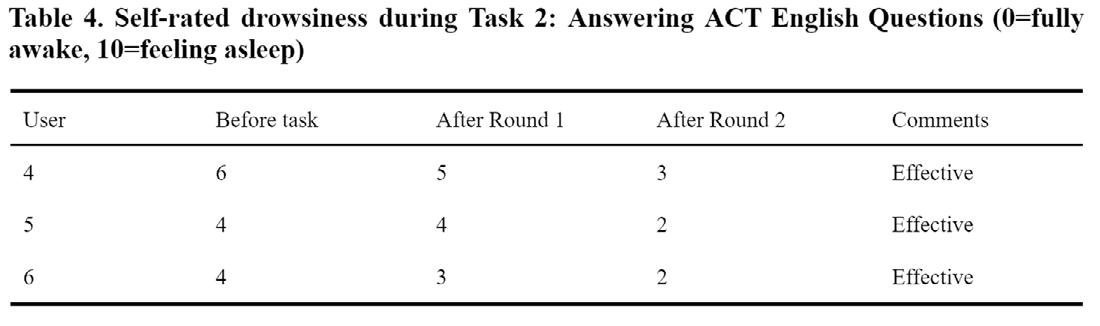
Task 2 requires the participants to work on ACT English question sets for two ten-minute-long intervals (one for each round). The question set is chosen by us and would be the same for all participants, and we would keep track of time and tell the participant to stop when they reach the 10-minute mark.
Similar to Task 1, the participants wear only the shape prototype for Round 1 and the vibration prototype for Round 2. The frequency of vibration is still the same for all participants, controlled by us, and they would not know exactly when the vibration will be activated.
Same with Task 1, the participant’s performance on the question set will not be evaluated – the only purpose is to simulate a setting that expects one’s continuous attention, but this information will not be revealed to the participants until they have finished the experiment.
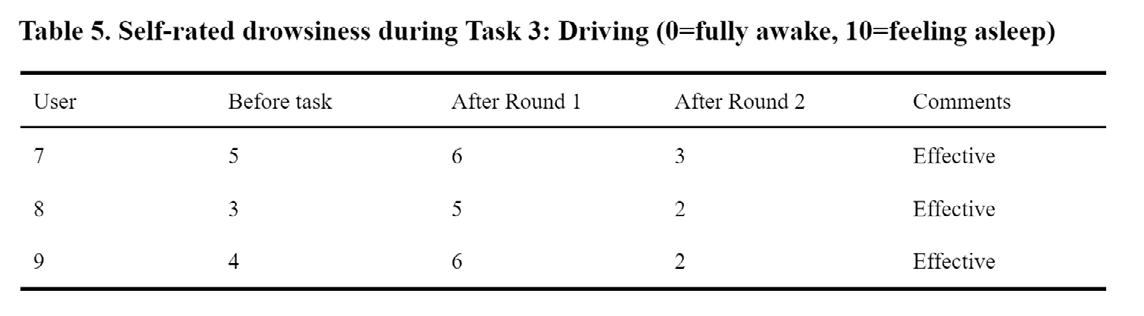
Task 3 requires the participants to drive a vehicle on a route of their choice for two ten-minute-long intervals (one for each round). We let the participants choose the route because we want to minimize possible safety issues throughout the experiment. Although it does not perfectly match our product’s scenario with drowsy driving, we are aware that wearing an unfamiliar device while driving on a route that one is unfamiliar with might increase the risk of traffic accidents. Same with Task 2, we would keep track of time and tell the participant to stop when they reach the 10-minute mark, and the participants would only wear the shape prototype for Round 1 and the vibration prototype for Round 2. The frequency of vibration is still the same for all participants, controlled by us, and they would not know exactly when the vibration will be activated.
Both quantitative and qualitative data are collected for Stage II. For quantitative data, the participant’s current level of drowsiness is collected three times throughout the experiment: prior to the experiment, after Round 1, and after Round 2. The participants will self-rate their current level of drowsiness at that moment, on a numeric scale of 1-10, with 1 being very awake and 10 being falling asleep at any moment. This data is the main evidence to determine whether our intervention with the device has an impact on one’s performance for tasks that require continuous attention.
For qualitative data, we would conduct a post-experiment interview focusing on questions such as:
How do you feel about wearing the shape prototype? Does the shape of the device bother you in any way?
How effective is the vibration on your level of attentiveness? Does the intervention of this device distract you in any way?
These qualitative data would also aid the design of the VIVE headset and the configuration of the vibration function of the device.
Limitations
As stated in the previous sections, we adjusted our experiment proposal and the prototypes due to various time and technology constraints. Along with those, there are also some other limitations that may affect the feedback we get for our device throughout this experiment.
First of all, our most important data that directly indicates the effectiveness of our device, the participant’s current level of drowsiness, is self-rated data. Based on individuals’ own interpretation of the scale, it is likely that each participant has their own standard of how tired/sleepy they are currently experiencing. This can be solved by analyzing this data vertically, only among the individual themselves, and comparing the change in the level of drowsiness for this one person.

Another issue related to the “self-rated level of drowsiness” is that the way we collect this data requires the participants to become conscious of their current drowsiness level, which has a chance of affecting their actual level of drowsiness. Even the act of asking the participants this question may alert them and affect this data. Considering this even further, the ten-minute intervals for all of the task rounds in Stage II may not be long enough for one to become evidently tired. One way to solve this problem would be to increase the task time and use other methods to track the participants’ level of drowsiness, such as observing their body language (such as blinking frequency) or even using an EEG device.
One last issue is that after the participants in Stage II finish Round 1, they might have an expectation of what will happen in Round 2. Although this influence may not be very significant, there is still a chance for this issue to affect the participants’ response to our device, especially since the participants would be completing the exact same task. One way to prevent this is to alternate the different task groups between the rounds, e.g., having Task 1 Round 1 group do Task 2 Round 2; having Task 2 Round 1 group do Task 3 Round 2; having Task 3 Round 1 group do Task 1 Round 2, etc. In this way, the participants will not be doing the same tasks for both rounds, therefore more likely to obtain an unbiased response for the data.
Results and Discussion
Stage 0. Product Assessments:
Due to time limitations, we converted part of the post-experiment interview into another set of quantitative assessments of the wearability of our VIVE headset. After testing real users, we have received the results as follows. We aim to use this test to see if the user could wear the headset with simple instructions and if there are any design flaws. The scale of the results ranges from 0 to 10, rating the wearing from four perspectives: wearable level, comfortable level, eyesight blocking level, and alignment level. The first two categories study if this product is stable and comfortable. And the second two categories study the malfunction of our designated purposes: if the device blocks the users' eyesight, and if the device does not align/fit with the head of the user.

In these results we can conclude that the device has a form that is designed quite successfully----it is very wearable, falls directly to the users’ ears, and does not block the user’s eyesight. However, the alignment levels are not good. Many of the users reported that their head shape does not fit with the headset, some say it is too tight and stiff, and some say the longitudinal length is too long. Some users suggested that the device could be softer to wear, or it could be designed in different sizes, like small, medium, large, extra large, etc.
Stage I. Location Assessments:
The users are tested with the vibration generators activated in 3 locations on their heads. They are asked to rank the locations after they have experienced vibration in each location. Location 1 is the area above both ears, location 2 is the area under both ears, and location 3 is the back head area (Location indicated in Figure 5).
From this assessment, we discovered that location 1 and location 2 had very similar feelings to the participants in terms of sensitivity to vibrations, and location 3 is the least sensitive spot, where many users have thick hair on that area that may block the vibration, especially for female users who have different hairstyles. Therefore, location 3 could be excluded from further prototypes. Furthermore, even though locations 1 and 2 only had 1 point in difference, some users reported that they felt that the up per ear area (location 1) was better than the lower ear area (location 2) because it is near the bone, and bone conduction is easier to transmit the waves of the vibration. Based on this result, location 1 will become the vibration location for Stage 2 and future prototypes.

Stage II. Tasks Assessments:
From this task, we can see a pattern that the user tends to gain drowsiness through the task without the interference of the vibration device, and lose drowsiness after activating the vibration. The users all report the vibration alert helps them to focus in the middle of the talk, where they are starting to lose focus. One user reported that he was feeling really sleepy in the middle and the vibration alerted him in time. Critically speaking, what happens if the user is more comfortable with learning from audio with closed eyes? This is the question we gained from the participant.

Different from Task 1, all participants tend to lose/stay in a same level of drowsiness through the task even without the interference of the vibration. Therefore, even though the drowsiness level continues to decrease in Round 2, we cannot simply conclude that the vibration is the mere cause of decreasing one’s drowsiness level in this case. We figured that this might be because the users are taking the task more seriously because the contents are exam based. Thus, the users are paying more attention and focusing on every question.
The driving task has the most significant result among all tasks that every user reports himself to be effectively alerted and awakened from the tiredness of driving for a while. One user said when driving, his eyes easily stay in one position for a long time and he would feel tired very soon. But the vibration can directly interrupt this sterile period and activate his brain successfully. And statistically speaking, all users were even more awake than the time before driving. Thus the vibration alert is very useful in this scenario.
Conclusion
In conclusion, the VIVE headset had the strongest effect in Task 3 (driving), waking all users in the ten-minute route. It also showed a strong effect in Task 2 (TED Talk) as well since all users reported being alerted by the vibration. But for Task 2 (ACT Test), since the users’ drowsiness level continued to decrease without the vibration device's interference, we cannot draw a causal relationship between the vibration and the level of drowsiness here. However, the overall response of the participants was “Effective,” indicating that the VIVE headset would interfere with the users’ concentration level in a positive direction. Hopefully, with further design and tests, it will help decrease the danger associated with drowsy driving.
Bibliography
- Biswal, A. K., Singh, D., Pattanayak, B. K., Samanta, D., and Yang, M. 2021. IoT-based smart alert system for drowsy driver detection. Wireless Communications and Mobile Computing 2021(1), 1-13.
- Chowdhury, A., Shankaran, R., Kavakli, M., and Haque, M. M. 2018. Sensor applications and physiological features in drivers’ drowsiness detection: a review. IEEE Sensors Journal 18(8), 3055-3067.
- Danisman, T., Bilasco, I. M., Djeraba C., and Ihaddadene, N. 2010. Drowsy driver detection system using eye blink patterns. In 2010 International Conference on Machine and Web Intelligence. Algiers, Algeria, 230-233.
- Drowsy Driving. NHTSA. U.S. Department of Transportation. Retrieved Jan 18, 2023.
- Saket, B., Prasojo, C., Huang, Y., and Zhao. S. 2013. Designing an effective vibration-based notification interface for mobile phones. In Proceedings of the 2013 Conference on Computer Supported Cooperative Work (CSCW '13). Association for Computing Machinery, New York, NY, USA, 149-1504.
- Arimitsu, S., Sasaki, K., Hosaka, H, Itoh, M., Ishida, K., and Ito, A. 2006. Vibration stimulus of seat belt motor retractor for keeping drivers awake. In 2006 2nd IEEE/ASME International Conference on Mechatronics and Embedded Systems and Applications, Beijing, China, 1-6.

- Goto, K., Asano, H., Kajiwara, Y., Bando, S., Mizuno, T., and Nozawa, A. 2016. Comparison of cool and warm thermal stimulations to reduce driver's drowsiness. IEEJ Transactions on Electronics, Information, and Systems, 136 (12), 1815-1820.


