2 minute read
Figure 15: National Parks make up18.5% of the Manning catchment

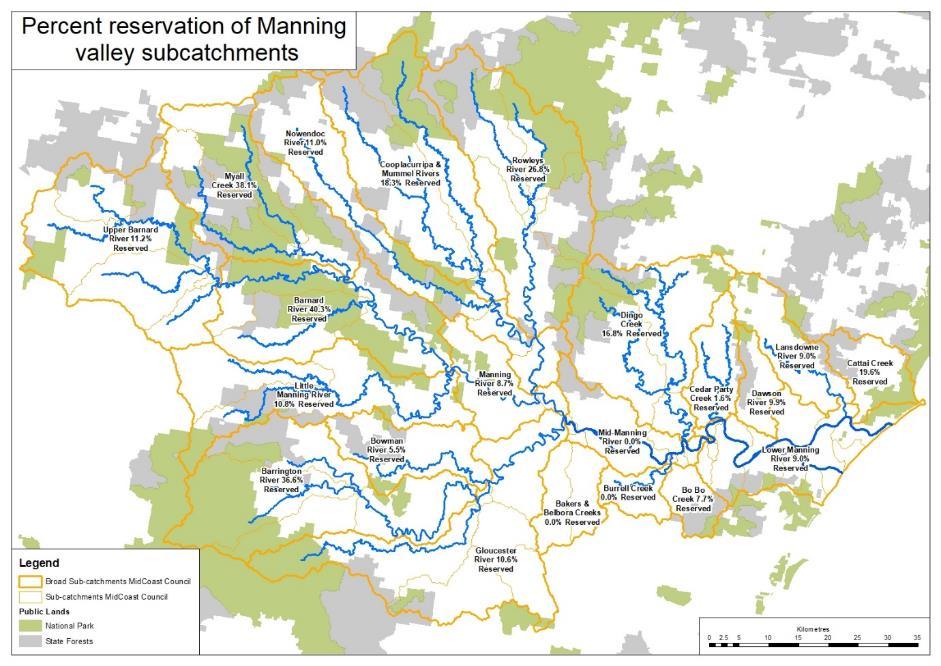
from Draft Manning River Catchment and Estuary and Catchment Management Program 2021-2031 - Main document

Around 18.5% of the Manning River estuary and catchment is protected in the National Park estate. Subcatchments with the highest levels of protection are the middle Barnard River, Myall Creek, Barrington and Rowley’s Rivers. Lower levels of protection through conservation reserves can be seen in the middle Manning River and Burrell, Bakers and Belbora Creeks which have no reservation. Cedar Party Creek and Bowman River also have very low percentages of reserved land. Map 2 shows the percentage of reservation for each of the subcatchments in the Manning valley.
Figure 15: National Parks make up18.5% of the Manning catchment
Significant biodiversity assets occur on private lands. A workshop held in Wingham in February 2020 was attended by 77 landholders from the Manning catchment. In an evaluation survey of the workshop participants, 43% of respondents listed biodiversity conservation as their highest priority, while a further 40% listed a mix of biodiversity and productivity.
4.3 Water Quality
Water clarity in the estuary is strongly influenced by catchment runoff. It fluctuates with extreme weather conditions (drought and flood) and corresponding changes to catchment inputs. Water quality monitoring results show improved clarity during times of drought and high turbidity in flood conditions.
Annual Water Quality Report Card monitoring results suggest that the Manning Estuary is heavily influenced by diffuse source runoff from the catchment, indicated by the response of algal levels to changes from nutrient inputs.
The estuary is acting as a nutrient sink, with consistently high Chlorophyll-a concentrations. Elevated algae concentrations are an ongoing issue throughout the Manning Catchment and will continue to be unless nutrient inputs are managed.
High turbidity levels are evident after periods of rainfall especially in the Middle and Upper Manning Estuary sites showing an increase in sediment inputs from the Catchment.
Freshwater inputs to the estuary have elevated levels of nutrients, sediment and
algae, recorded through long-term water quality monitoring at the Bootawa offtake by MidCoast Council’s Water Services team.
4.3.1 Water quality results in the estuary
MidCoast Council engages the Department of Planning, Industry and Environment (DPIE) to undertake annual water quality monitoring in the estuary, which is made public in the annual Water Quality Report Card.
A healthy waterway can generally be characterised by low turbidity and low levels of algae and provides habitat for a wide range of plants and animals. Therefore, two key indicators of estuary health are monitored independently by DPIE – Chlorophyll-a (the amount of algae in a water sample) and Turbidity (the water clarity).
• 5 sites in the Manning River Estuary are monitored annually from Tinonee southwest of Taree to Farquhar Inlet, as shown in Figure 15.
• 3 of the 5 sites have been sampled each year since 2014 over the spring/summer period, with Dawson River Estuary and Farquhar Inlet added to the monitoring in 2019.
• The data collected in the Manning are compared to reference sites in NSW for similar types of estuaries to grade the condition of the estuary.


