


Department of Regional NSW
regional.nsw.gov.au Check Point Threat Extraction secured this document Get Original
MidCoast Regional Economic Development Strateg y – 2023 Update
Published by the Department of Regional NSW
Title: MidCoast Regional Economic Development Strategy - 2023 Update
First published: February 2023
Acknowledgements
The Department of Regional NSW would like to acknowledge the significant contribution of many stakeholders in MidCoast region to the development of the 2023 REDS Update, with particular thanks to staff from MidCoast Council The Department of Regional NSW also acknowledges the assistance provided by PricewaterhouseCoopers and ProjectsJSA to help deliver the 2023 REDS Update project.
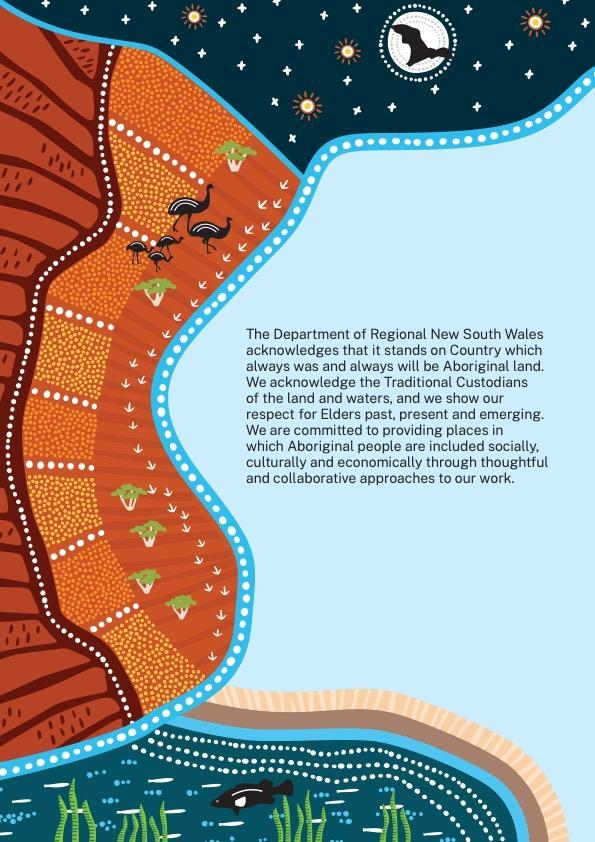
On Country – Artwork by Mumbulla Creative
"On Country" captures the many different countries located within the Department of Regional NSW footprint Only part of the image is shown on the Acknowledgement of Country page The regions included in this partial image are detailed below.
The Far West region of NSW is represented by red earth plains, mallee scrubs and an abundant emu population Freshwater countries are referenced by the expansive network of rivers stretching through the regions. The Riverina Murray region is represented by the roots of a river redgum on the banks of a river, and a large Murray Cod can be seen in the river. The night sky features as it plays an important navigational and story-telling role in traditional life.
Except where otherwise indicated, photo credit for all images is to MidCoast Council Cover image: Bennetts Beach at Hawks Nest.
© State of New South Wales through the Department of Regional NSW 2023. You may copy, distribute, display, download and otherwise freely deal with this publication for any purpose, provided that you attribute the Department of Regional NSW as the owner. However, you must obtain permission if you wish to charge others for access to the publication (other than at cost); include the publication in advertising or a product for sale; modify the publication; or republish the publication on a website. You may freely link to the publication on a departmental website.
Disclaimer: The information contained in this publication is based on knowledge and understanding at the time of writing (February 2023) and may not be accurate, current or complete. The State of New South Wales (including the Department of Regional NSW), the author and the publisher take no responsibility, and will accept no liability, for the accuracy, currency, reliability or correctness of any information included in the document (including material provided by third parties). Readers should make their own enquiries and rely on their own advice when making decisions related to material contained in this publication.
MidCoast Regional Economic Development Strategy – 2023 Update 3
Table of contents .............................................................................................................................................................................................. 4 1. Executive summary .................................................................................................................................................................................. 5 Changes in the MidCoast region since 2018 5 Key themes from local consultation 6 MidCoast REDS - 2023 Update strategies and enablers 7 2. About the 2023 REDS Update .......................................................................................................................................................... 8 3. About the MidCoast region 9 4. The 2018 MidCoast REDS and 2020 Bushfire Addendum .......................................................................................................... 10 5. The big picture: Shocks and trends impacting the MidCoast region since 2018 .................................................................... 12 Significant events impacting major industries 12 MacroƲƧǴǭǴǬǑƧ ĢēƲǭƭĚ ĚǍƋĐǑǭLj ĢǍƲ ēƲLjǑǴǭ’Ě LJĨĢĨēƲ 14 6. Responding to change: Initiatives and investments since 2018 ................................................................................................ 16 Significant investments since 2018 17 7. MidCoast region 2023 economic snapshot .................................................................................................................................. 19 Demographics ................................................................................................................................................................................................................................19 Housing 20 Employment 21 MidCoast region 2023 engine and emerging industries ............................................................................................................................................. 23 MidCoast region 2023 endowments 25 8. Looking ahead: Strategic opportunities for growth, resilience and liveability .......................................................................26 Opportunities and vulnerabilities in engine and emerging industries 26 Key themes in stakeholder consultation ............................................................................................................................................................................30 MidCoast REDS – 2023 Update strategies 30 Key enablers of economic growth 31 9. References ........................................................................................................................................................................................ 33 MidCoast Regional Economic Development Strategy – 2023 Update 4
Table of contents
1. Executive summary
Changes in the MidCoast region since 2018
In 2018, the NSW Government developed Regional Economic Development Strategies (REDS) for 38 Functional Economic Regions (FERs) across regional NSW. Since publication, regional NSW has endured shocks including bushfires, floods, COVID-19 and the mouse plague, and significant new economic opportunities have emerged. The 2023 REDS Update provides an updated evidence base to guide governments in making policy and investment decisions to enhance resilience and drive sustainable, long-term economic growth in regional NSW.
The MidCoast region has seen significant investment delivered since 2018, with additional projects in the planning or delivery stages
Over $150 million invested in road upgrade projects including upgrades to the Pacific Highway, Bucketts Way and Gloucester Road.
Over $20 million has been invested in the Forster Civic Precinct project.
$100 million for the Manning Base Hospital redevelopment Stage 2.
$15 million for infrastructure works to support the Northern Gateway Transport Hub development.
The region has recorded significant population growth since 2018, which brings opportunities and challenges given low housing vacancy rates
+2.8% population growth since 2018.
Housing vacancy rates sit at 1%, with median house prices having risen by 48% since 2018.

The proportion of the population over 55 years has increased 1.1% since 2018.
Unemployment is marginally higher than the NSW benchmark at 3.7% as at June 2022, with job vacancies in the region reaching an all-time high of 4,595 in November 2021.
MidCoast Regional Economic Development Strategy – 2023 Update 5
The region’s key industries (including agriculture, energy, tourism and healthcare) have remained resilient and continue to drive economic growth Agriculture and food manufacturing +7.9% Year-on-Year (YoY) growth from 2011-2020
Key themes from local consultation
Stakeholders from the MidCoast region highlighted equitable and sustainable population growth and enhancing local skills capacity as key priorities for the region.
Sustainable population growth
Stakeholders noted that in catering to meeting the needs of population growth, maintaining liveability for existing residents must also remain a priority.
Local skills training and education pathways
Building local skills capacity and capability was raised consistently by stakeholders as being a key focus area for local industry, particularly through improving access to training and employment pathways for you nger members of the community.
Equitable socioeconomic outcomes


region as part of increased regional migration has highlighted a need to focus on addressing socioeconomic disparity within the rƲLjǑǴǭ’Ě population.

$344 million Gross Value
(GVA)
2020 2,194 jobs supported in 2021
+4.9% YoY growth
$201 million GVA in 2020 363 jobs supported in 2021 Tourism +2.5% YoY growth from 2011-2020 $608 million visitor spend in 2021 7,176 jobs supported in 2021 Healthcare +4.9% YoY growth from 2011-2020 $511 million GVA in 2020 6,600 jobs supported in 2021
Added
in
Energy generation and distribution (including renewables)
from 2011-2020
ŜǍƲ ƋēēǑľƋǦ ǴLJ ‘ĢēƲƲ ƧǍƋǭLjƲēĚ’ Ƌǭƭ ‘ĚƲƋ ƧǍƋǭLjƲēĚ’ Ǒǭ ĢǍƲ
MidCoast Regional Economic Development Strategy – 2023 Update 6
MidCoast REDS - 2023 Update strategies and enablers
Strategies
Strengthen the region’s infrastructure and services offering to attract and retain businesses, residents and visitors.
Enablers
• Leverage recent investment in sporting and entertainment infrastructure and investigate the opportunity for a regionally significant sports sub-hub that complements objectives in the Hunter Regional Sport and Active Recreation Plan.
• Work with council to identify and activate potential areas of demand for urban release, accounting for enabling infrastructure to support council in their delivery of utilities and services.
Invest in workforce development and create opportunities for local businesses to invest and grow.
Actively pursue opportunities to bring investment, businesses and skilled workers to the region.
• Collaborate with education providers and industry, to develop novel, innovative training opportunities, youth development programs and employment pathways.
• Work with local businesses and state government to identify and overcome barriers to business growth, including by identifying gaps in critical enabling infrastructure such as energy transmission and digital connectivity
• Partner with Aboriginal and arts community leaders in the region to build business skills and diversify the visitor economy.

MidCoast Regional Economic Development Strategy – 2023 Update 7
Figure 1: Children play in the snow in the MidCoast LGA
2. About the 2023 REDS Update
In 2018, the NSW Government and local councils developed a series of REDS for 38 Functional Economic Regions (FERs) across regional NSW. FERs are made up of one or more Local Government Areas (LGAs) that work together to create smaller economies with strong economic links.
Supporting the 20-Year Economic Vision for Regional NSW, the REDS set out a place-based vision and framework for economic development for each FER. The REDS identify each FER's endowments, industry specialisations and key vulnerabilities and opportunities, and outline economic development strategies and actions to leverage these strengths.
Since 2018, regional NSW has endured many challenges including drought, bushfires, floods, COVID-19 and the mouse plague. At the same time a range of broader state-wide trends and actions continue to change the economic landscape across regional NSW, including digital transformation, increased remote working and the shift towards net zero. These challenges and trends have altered the landscape of economic development in many regions and created new opportunities for growth.
The 2023 REDS Update provides an updated evidence base to guide governments in making policy and investment decisions to enhance resilience and drive sustainable, long-term economic growth in regional NSW. The objectives of the update are to:
1. Highlight progress: reflect on significant initiatives and investments that have supported progress against the key strategies and actions in the 2018 REDS.
2. Capture major changes: identify and assess the impacts of major changes to regional economies
such as bushfires, droughts, floods, mouse plagues and the COVID-19 pandemic.


3. Identify strategic opportunities : identify key strategic opportunities and vulnerabilities for engine and emerging industries, as well as any changes to local endowments.
4. Set the foundation for the future: review, affirm and/or adjust the 2018 strategies, including consideration of new strategies to meet emerging priorit ies, to ensure they remain relevant.
5. Identify key enablers to guide future action: develop a non-exhaustive list of priority enabling actions that will support the 202 3 REDS Update strategies.
ĚǑǭƧƲ śřŚšƫ ǑǭƧǦĨƭǑǭLj ĢǍƲ ƲLJLJƲƧĢ ǴLJ ēƲƧƲǭĢ ‘ĚǍǴƧǣĚ’
Figure 2: Wallabies on Diamond Head Beach.
MidCoast Regional Economic Development Strategy – 2023 Update 8
Figure 3: A homewares store in the MidCoast region
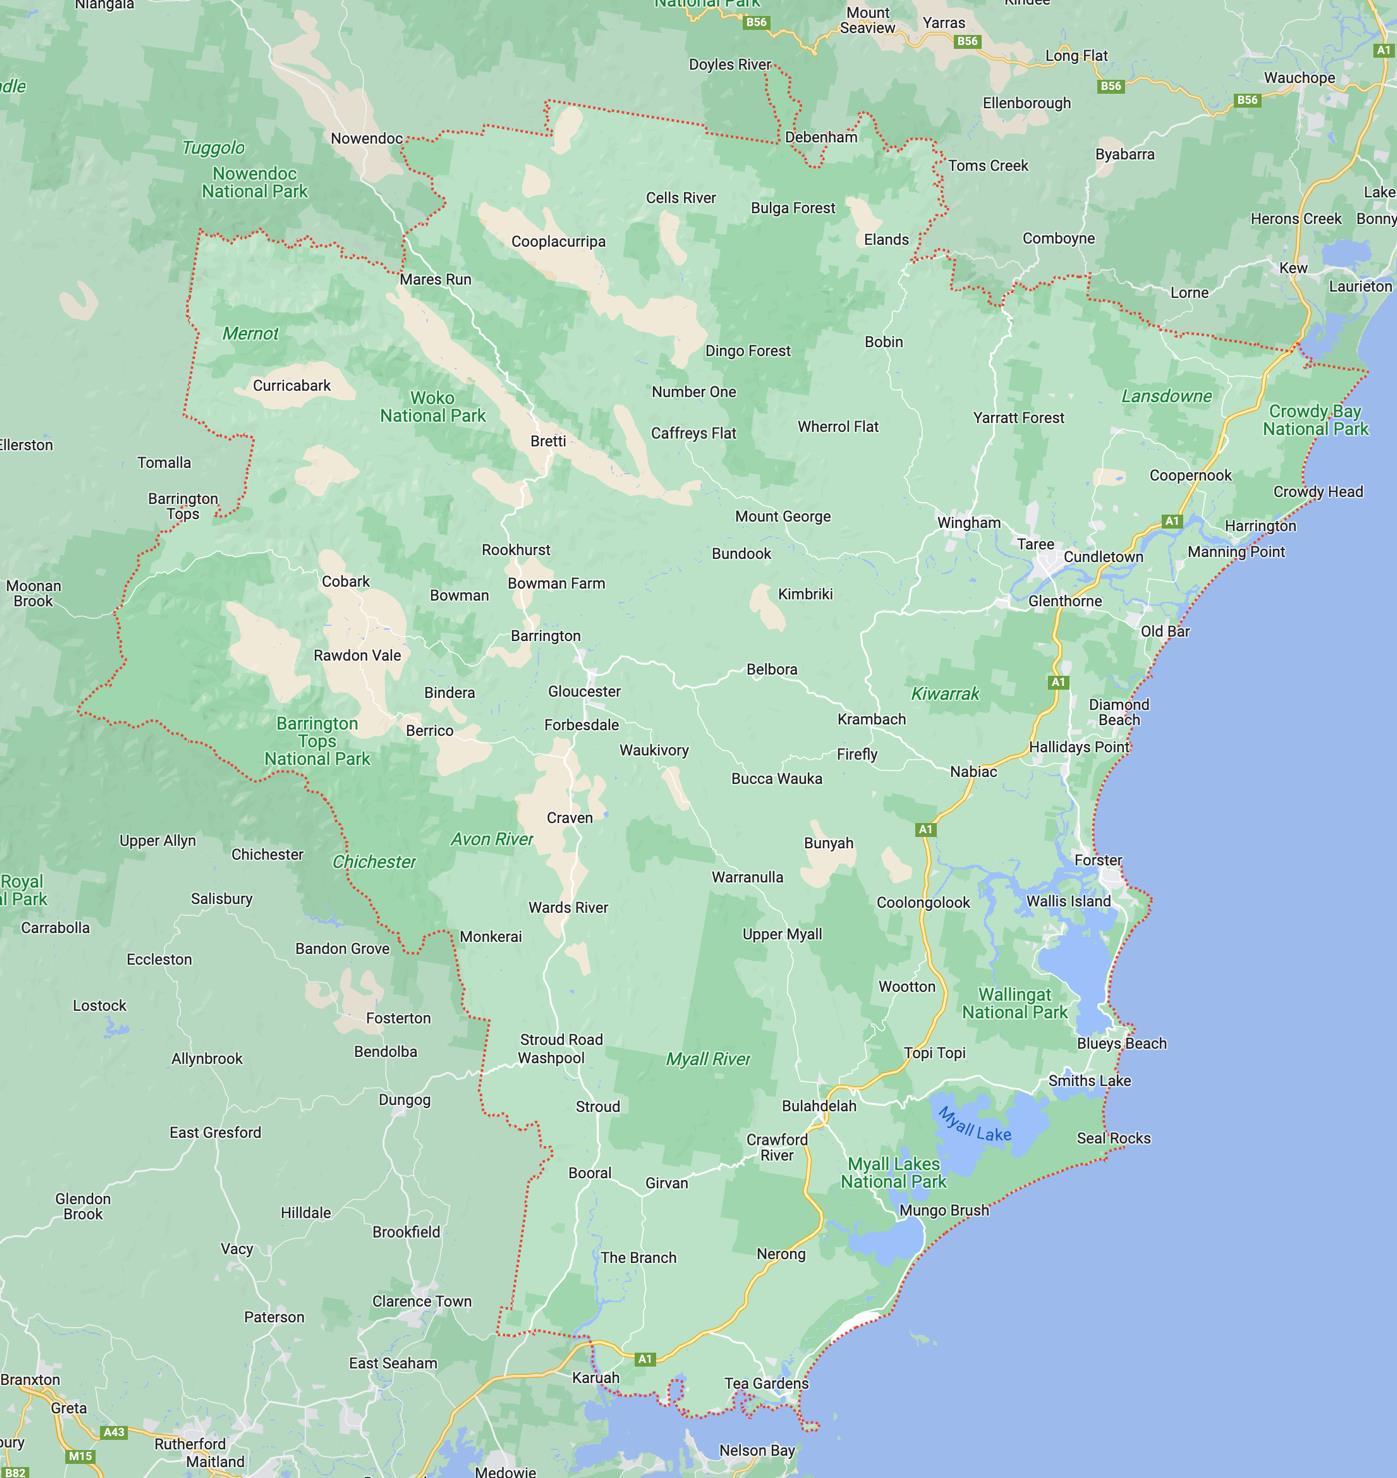
3. About the MidCoast region
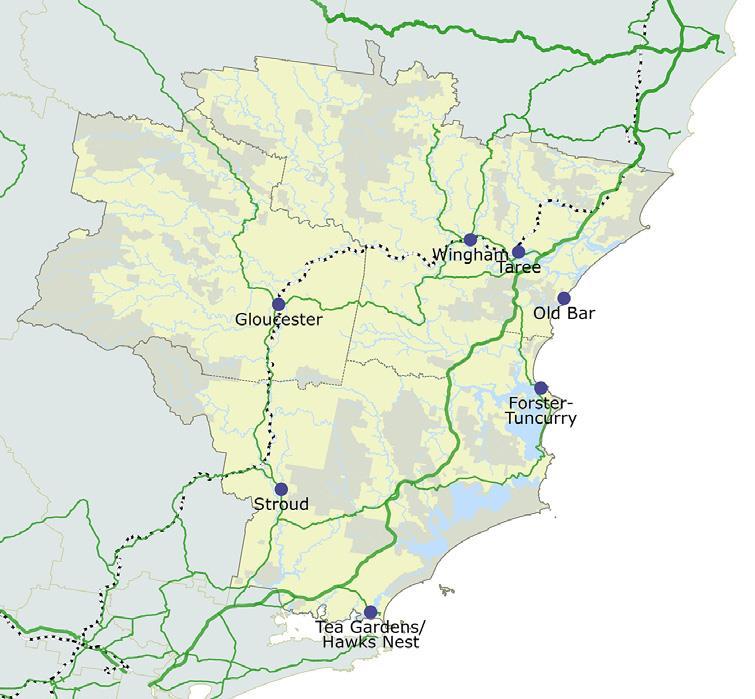
The MidCoast FER incorporates the entirety of the MidCoast Local Government Area, which includes around 195 towns, villages and localities, with the major population centres being Taree and ForsterTuncurry. The region extends from the Pacific coastline in the east to the escarpment of the Great Dividing Range in the west, and includes the Manning River Valley in the north and the Wallis, Smiths and Myall Lakes systems.
Source: ABS (2021) Estimated Resident Population, REMPLAN (2020), ABS Census (2021)
Total area covered (km 2) 10,053 Population (2021) 96,425 Size of the economy (2020) $4.317 billion Total employment (2021) 33,378
MidCoast Regional Economic Development Strategy – 2023 Update 9
Figure 4: Map of the MidCoast Functional Economic Region
4. The 2018 MidCoast REDS and 2020 Bushfire Addendum
In the MidCoast 2018 REDS, the region was actively pursuing growth in its key industry specialisations, particularly tourism and agriculture. Endowments recognised in the document spanned natural, social and infrastructure assets, ma ny of which were central to the sĢēƋĢƲLjŅ’Ě ƋĐĐēǴƋƧǍ ĢǴ enabling economic development for the region. These endowments and specialisations are highlighted in the following pages Following the 2019-2020 bushfires, the NSW Government developed the 2020 MidCo ast Bushfire Impact Addendum, which offered additional areas of strategic focus to support recovery.
2018 MidCoast strategies
Strengthening the region as a location of choice: delivering improved infrastructure and services which will attract skilled workers to the region.
Creating a supportive environment for businesses to invest and grow: supporting programs and initiatives which remove barriers to entry or growth for businesses.
Marketing the MidCoast region: communicating the rƲLjǑǴǭ’Ě strengths to attract investment, skilled workers and new businesses to the region.
In addition to the core strategies articulated in the MidCoast REDS, the 2020 MidCoast Bushfire Impact Addendum set out a series of additional priorities focused on recovery and resilience, including:
• rectifying damaged industry infrastructure and invest in regional infrastructure to improve connectivity, disaster response and resilience


• diversifying and intensifying agricultural development, planning and innovation

• supporting tourism industry development, encourage emergence of industry clusters
• supporting major and emerging industries with appropriate initiatives and infrastructure.


2018 MidCoast specialisations
The primary industry specialisations below were identified as compar ative advantages for the MidCoast region in the 2018 REDS, based on employment concentrations in industry sectors.
Agriculture, forestry and fishing
Non-metallic mineral mining
Tourism
Healthcare and social services
MidCoast Regional Economic Development Strategy – 2023 Update 10
2018 MidCoast endowments
The MidCoast is home to a wealth of physical, institutional, built environment and human endowments. These endowments play a key role in enabling success and growth across its industry specialisations
Endowments
Estuaries around the Manning River, Wallis Lake, Karuah River and Port Stephens
Prime agricultural land
Hardwood and softwood forests (western sections of the region)
Gloucester coal basin
Wingham beef abattoir
Private seafood processing facilities
Saw milling facilities
Mining infrastructure

Pacific Highway
Rail infrastructure (North Coast Line)
Proximity to Sydney and Newcastle (including Port of Newcastle)
Taree Airport
Northern Gateway transport and logistics hub
Availability of land (for employment and non-employment uses)
Coastline and waterways (Manning and Myall Rivers, Wallis, Smiths and Myall Lakes)
Barrington Tops World Heritage National Park
TAFE NSW Taree and Tuncurry facilities
Aged care and disability support services and infrastructure


Relevant 2018 specialisations

MidCoast Regional Economic Development Strategy – 2023 Update 11
5. The big picture: Shocks and trends impacting the MidCoast region since 2018
Significant events impacting major industries
A sustained period of drought, followed by bushfires and flooding has had sev ere environmental and economic implications for the MidCoast. COVID-19 related movement restrictions further challenged local industry, with particular impacts on the ēƲLjǑǴǭ’Ě
. Since 2018, the region has received $22.9 million in disaster recovery grants. Continuing to recover from the impacts of these events and developing both industry and community resilience represents a key priority for the region.
Drought
The MidCoast region experienced intense drought conditions in 2019, with water restrictions in place for a period of 5 months and 20 days. Throughout this period, all 4 of the
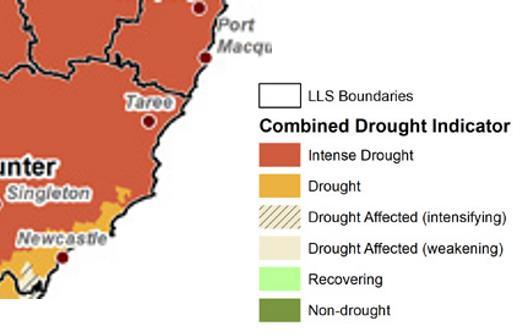

supply rivers were severely impacted, and local dam levels dropped to approximately 30%.[1]
This had implications not only for household quality of life and amenity, but also restricted productivity for industries such as agriculture and manufacturing, which are both important sectors in the local economy.
Figure 5: Mountain bike riding in the MidCoast LGA.
ľǑĚǑĢǴē ƲƧǴǭǴǬŅ
ƲLjǑǴǭ’Ě
r
MidCoast Regional Economic Development Strategy – 2023 Update 12
Figure 6: Combined drought indicator, 12 months to 31 December 2019 (Department of Primary Industries (DPI), 2022)
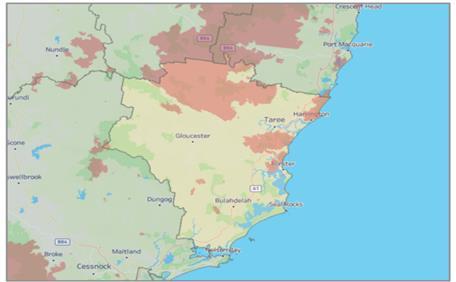
Bushfires
The MidCoast region was impacted by the 2019-2020 bushfires, with approximately 24% of the region burnt in this event.[2]
The fires had significant implications for industry, with tourism visitation facing a sharp decline during the peak summer period . Firms in the agricultural industry lost assets, impacting productivity and output. Local residents were also affected by disruptions to infrastructure, including major highway damage and closures, while digital connectivity infrastructure was also lost or damaged.[2]
COVID-19

Fire affected Figure 7: 2019-20 bushfire impacted areas in the MidCoast region
The COVID-19 pandemic had a significant impact on businesses in the MidCoast region, with 51% of local businesses reporting that COVID-19 negatively affected their operations.[3] While the visitor economy felt direct impacts on visitation due to movement restrictions, the implications were more widespread with the local manufacturing industry (a specialisation for the area) f acing substantial reductions in employment (an estimated 33% drop from November 2020 to February 2021).[4] Beyond industry impacts, community wellbeing was affected with jobseeker recipients rising by 42% and health care card recipients by 26% from March to June 2020.[5]
Floods
The region experienced a number of significant flood events across 2021 and 2022. In March 2021, many parts of the region experienced record level floods , with total estimated damage related to public facilities alone of around $20 m illion.[6] A year later, significant flooding and storm damage across the MidCoast region occurred during the March 2022 floods, with infrastructure damaged and access to goods and services disrupted. [7]
Following these flood events, the MidCoast region had a relatively high proportion of disaster relief grant claims from small businesses compared to other flood affected areas of the state. [8]
In March 2022, 47% of businesses reported that natural disasters were having negative impacts on their business, indicating that the impact of the shock was widely felt in the region.[3]
MidCoast was also severely impacted by storms and floods in early July 2022 with extensive damage to roads, bridges, infrastructure and outdoor areas [9]
MidCoast Regional Economic Development Strategy – 2023 Update 13
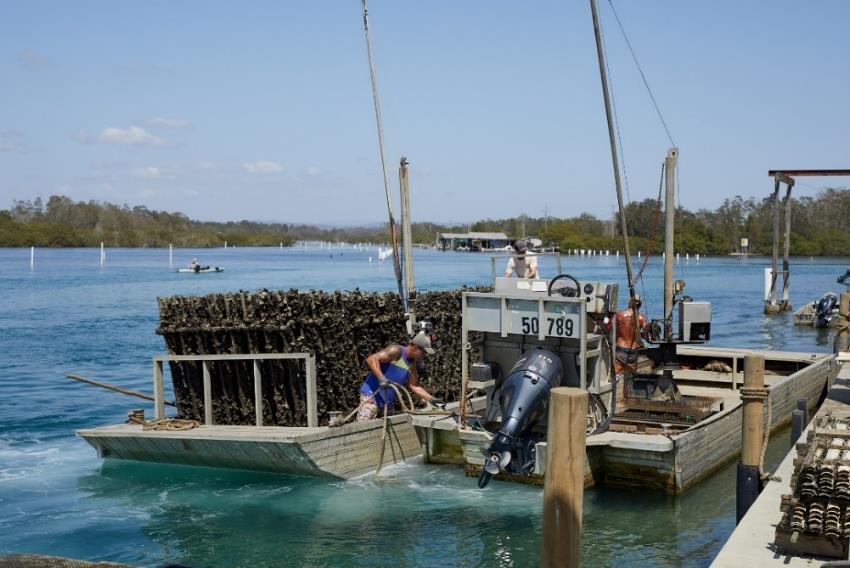
Figure 8: Oyster farming in the MidCoast region
Macroeconomic trends shaping the rƲLjǑǴǭ’Ě LJĨĢĨēƲ
The MidCoast has been impacted by an environment of increasing economic uncertainty in recent years, with successive natural disaster events and the global COVID -19 pandemic having significant impacts on the regional economy and communities. Shifting migration patterns have been particularly evident in the region, with increased opportunities for remote working changing the socioeconomic characteristics of the MidCoas t population.
Trend Opportunities and risks
Digital transformation
The recent COVID-19 pandemic has accelerated the digital economy in Australia, with increased uptake of remote working arrangements as well as online services such as education and telehealth. [10]

However, the rƲLjǑǴǭ’Ě
has been identified as being a significant constraint to maximising opportunities presented by online employment and business, with digital blackspots remaining an issue.
Addressing blackspots offers opportunities for local business growth and efficiency.
Improving the availability of health care services for residents may be aided through continued growth of the rƲLjǑǴǭ’Ě telehealth offering.
Changing migration patterns
Population growth in the MidCoast region accelerated from 2020 because of substantial internal migration to the region (see Page 19). This is evident in the population shift in 2020-21, with regional NSW gaining an additional 26,800 residents while Sydney declined by 5,200. [11]
Population growth has seen remote workers relocating from metropolitan areas to the Midcoast region, which has brought about increased demand on infrastructure and services.
Stakeholders also expressed concerns around those moving to the region being in a higher income bracket than the local pre COVID-19 average because of their metro-based employment. This has brought about concerns around cost-of-living pressures, housing affordability and increasing socioeconomic gaps.
Pressure on housing availability and affordability brought about by a growing population may constrain the ability of local businesses and service-providers to attract workers. If innovation and entrepreneurship among local businesses can be supported, the skills of a new cohort of professionals otherwise working remotely may be leveraged to grow knowledge-intensive sectors.
ƧǴǭǭƲƧĢǑľǑĢŅ ǑǭLJēƋĚĢēĨƧĢĨēƲ
MidCoast Regional Economic Development Strategy – 2023 Update 14
Towards net zero
Net zero targets and related policies are likely to have an impact on the economic future of the MidCoast region. Primary production sectors remain important co ntributors to the regional economy, with the mining sector adding $181 million in 2020, while agriculture and valueadd food manufacturing act as key specialisations for the region. These industries face direct challenges in coming years in adapting practices and processes to decarbonise and meet emission reduction targets, as well as changing supply cha in and consumer preferences related to improving sustainability.
From an energy perspective, the MidCoast is located between the New England and the Hunter-Central Coast Renewable Energy Zones (REZs), so the region could potentially play an important role in establishing transmission corridors between REZs and energy grids within coastal markets.
Opportunities and risks
Repurposing of mining infrastructure may provide an opportunity for industrial growth in the region.
Rising uncertainty
Since 2018, the MidCoast region has been subject to drought, fires, and floods, demonstrating the impacts of climate change and growing uncertainty around future weather patterns. The ĦǑƭCǴƋĚĢ’s significant endowments and specialisations across aquaculture and other water based industries are particularly susceptible to climate variations.
Similarly, while the region has attracted significant public and private investment in the visitor economy, this sector was particularly hard-hit during periods of restricted movement. Ongoing supply chain issues and rising costs caused by events, such as the war in Ukraine, may have implications for the feasibility, cost and timelines associated with delivery of major projects in the region.
Investing in enhancing the resilience of infrastructure assets will reduce the recovery cost and economic burden associated with future shocks.

Continuing to support diversification of the r
forestry and fishing industry specialisation will aid in building the ĚƲƧĢǴē’Ě
the face of future shocks.

Trend
ƲLjǑǴǭ’Ě ƋLjēǑƧĨǦĢĨēƲƫ
MidCoast Regional Economic Development Strategy – 2023 Update 15
ēƲĚǑǦǑƲǭƧƲ Ǒǭ
Since 2018, MidCoast Council, the NSW Government and other key orga nisations have delivered new and updated key strategic documents and plans that help guide economic and community development in the region. These documents support the development of local enabling actions that contribute towards progress against key REDS priorities and strategies.
Strategies and plans

The Hunter Regional Plan 2036 sets out a 20-year blueprint for the future of the region focussing on land-use planning. This is supported by the MidCoast Local Strategic Planning Statement, which sets out a vision for land use planning across the LGA to accommodation future population growth.
The Draft MidCoast Community Strategic Plan 2022 -2032 sets out a plan to build a more resilient, connected community supported by a strong , diverse economy.
The Draft MidCoast Rural Strategy establishes a plan for how land and water resources outside of population centres will be used in the coming decades.
The MidCoast Council Housing Strategy considers opportunities and constraints facing the r

and affordability.
The MidCoast Cultural Plan 2036 aims to build the social and economic capital of the region through supporting and celebrating local arts, culture and c reativity.
Recognising the already growing circular economy capabilities in the reg ion, the Hunter and Central Coast Circular Economy Roadmap 2022 seeks to set a path for accelerating investment and collaboration in the sector.

Relevant 2018 strategies
6. Responding to change: Initiatives and investments since 2018
ƲLjǑǴǭ’Ě ǍǴĨĚǑǭLj ǬƋēǣƲĢ Ƌǭƭ ĐēǴĐǴĚƲĚ ǬƲƧǍƋǭǑĚǬĚ LJǴē ǑǬĐēǴľǑǭLj ĚĨĐĐǦŅ
MidCoast Regional Economic Development Strategy – 2023 Update 16
The North Coast Destination Management Plan 2018 -2021 identifies priority
s visitor economy. This aligns with the MidCoast Destination Management Plan , which seeks to maximise opportunities presented by increased domestic visitatio n and support high-value visitation.
The Greater Hunter Regional Water Strategy
water needs over the next 30 years, considering existing and near -future risks to water security.
Significant investments since 2018
As shown in Figure 10 above, since 2018 the region has received significant local, state and federal funding. These investments are at varying stages of progress, with som e delivered, some underway, and some investments still in the planning stage. Investments have largely focused on significant transport infrastructure upgrades, community amenity and cultural infrastructure, and major education and health facility upgrades. Grant funding has played a key role in delivery of many of these projects.
ĚĢēƋĢƲLjǑƲĚ ĢǴ ƭēǑľƲ ĢǍƲ LjēǴĿĢǍ ǴLJ ĢǍƲ ēƲLjǑǴǭ’
ǑĚ ƭƲĚǑLjǭƲƭ ĢǴ ǬƋǭƋLjƲ ĢǍƲ ēƲLjǑǴǭ’Ě
3 1 4 2 7 5 8 6 10 9 11
Figure 10: Investment in the MidCoast region Map data ©2023 Google
MidCoast Regional Economic Development Strategy – 2023 Update 17
Major public investment since 2018

*This project was funded by a combination of club raised funding and a grant from the NSW Government Regional grant programs


The region has received $51.86 million in Regional NSW grant funding since 2018. Key programs in the region have included the Stronger Country Communities Fund, with $15.98 million committed to deliver a number of community infrastructure projects.
Note: Total grant funding outlined above only includes programs managed by the Department of Regional NSW, accurate as at Jan uary 2023.
1 M a n M a n F M a n
Investment Estimated total project value Relevant 2018 strategies 1 Manning Entertainment CentreBeryl Jane Fleet Studio >$3 million 2 Tuncurry Recreation Precinct Not available 3 Safety upgrades to the Pacific Highway $40 million 4 Forster Civic Precinct Project $20.9 million 5 Manning River Rowing Club rebuild * $1.6 million 6 Northern Gateway Transport Hub $15 million 7 Taree Universities Campus >$5.5 million 8 Road upgrades including Bucketts Way, Harrington-Coopernook overpass and Gloucester Road $100 million 9 Manning Base Hospital redevelopment Stage 2 $100 million 10 The Iron Arena $8.2 million 11 Fixing Country Bridges projects including Cedar Party Creek Bridge $27.5 million
Grant category Approved funding Community $22.46 million Economic $6.5 million Disaster recovery $22.9 million
MidCoast Regional Economic Development Strategy – 2023 Update 18
7. MidCoast region 2023 economic snapshot
The rƲLjǑǴǭ’Ě ĐǴĐĨlation is growing, but a high proportion of retirees creates challenges for the workforce
Although the MidCoast region has seen its population grow since 2018, the rƲLjǑǴǭ’Ě ƧĨēēƲǭĢ demographic structure demonstrates that future growth strategie s need to focus on incentivising or encouraging movement to the region by those in the working age population to help address an ageing population profile.
Population growth
The MidCoast region saw relatively consistent population growth between 2018-2021, with an average annual population growth rate of 0.9%. This translated to a net increase in population from 93,784 to 96,425 residents (an additional 2631 people from 2018-2021)
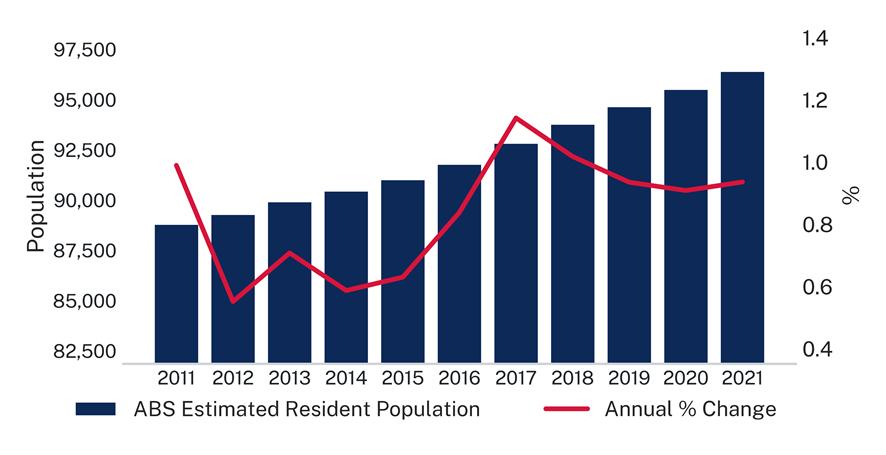
Despite a slight slowing in population growth between 2017 and 2020, an uplift in the growth rate has been observed since 2020, likely reflecting increased pandemic-related movement to the regions.
Demographic profile
Almost half (49.2%) of the rƲLjǑǴǭ’Ě population is over the age of 55, while just 44.8% is under the age of 49, lower than the NSW rate of 64.2% (see Figure 12) As a result, the MidCoast region has a significantly smaller proportion of the population in the prime working age cohort. This demographic structure highlights a key challenge for the MidCoast region is attracting and retaining a productive workforce
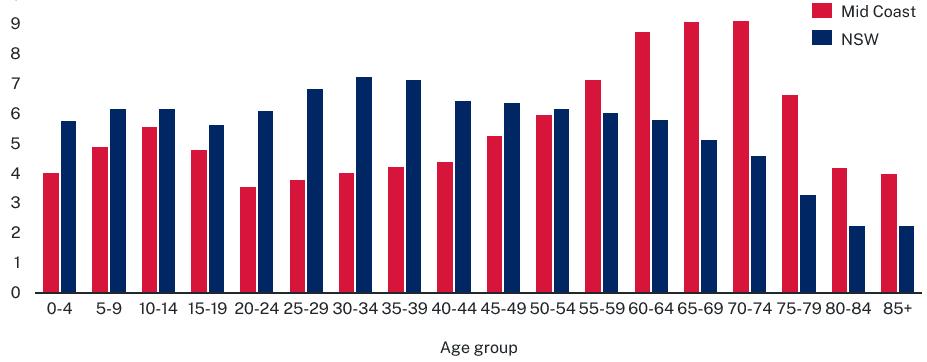 Figure 11: Population growth in the MidCoast FER (ABS ERP, July 2022)
MidCoast Regional Economic Development Strategy – 2023 Update 19
Figure 12: Population by age in the MidCoast FER (ABS ERP, July 2022)
The pandemic saw housing availability fall below 1% and significant increases in house prices in the MidCoast region
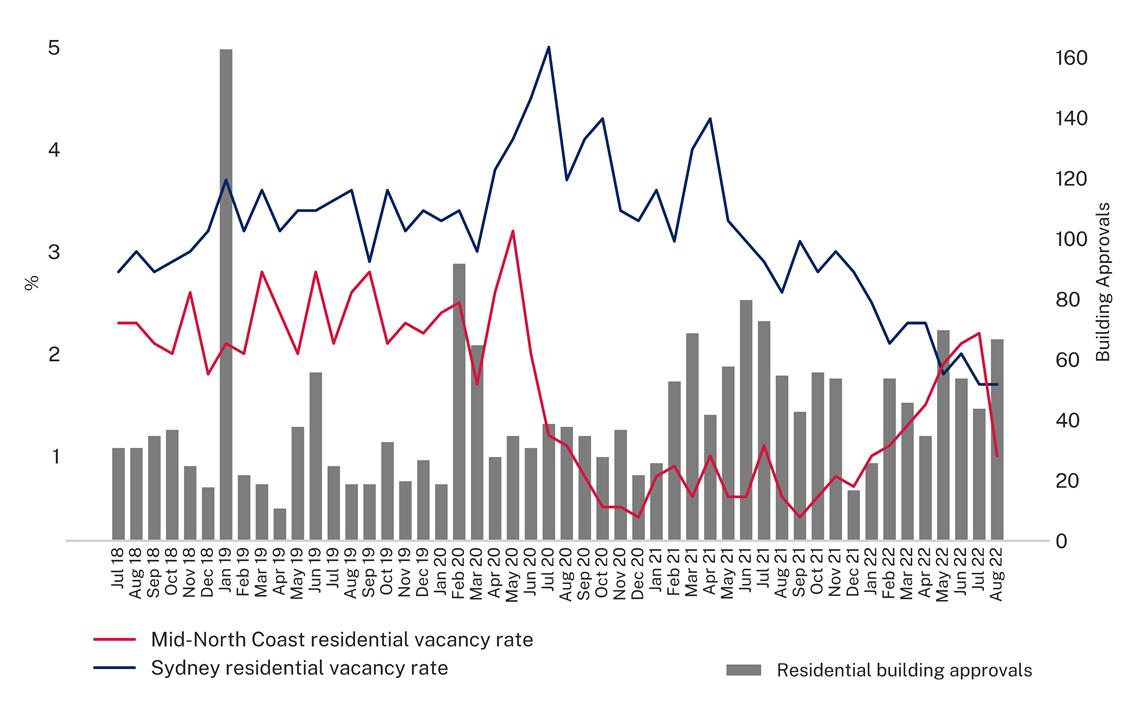
Residential vacancy rates in the MidCoast region have remained consistently below 1% since September 2020, with accelerated population growth due to COVID -19 related migration likely playing a role in exacerbating this shortage. While building approvals have remained comparatively high in 2021, indicating a supply-side response to this demand, the persistently low vacancy rate and a steep rise in median dwelling prices in the region over the past 3 years indicate that further action is needed.
Housing availability
Residential vacancy rates in the region have declined from 3.2% in early 2020 to 1% in August 2022 (see Figure 13) Increased internal migration is likely a key factor. While there is always a degree of lag between supply and demand for housing, there is a need to ensure that state and local planning systems (and other land development enablers such as infrastructure pr ovision) are appropriately calibrated to keep pace with projected demand for housing.
Housing affordability
Supply levels of housing not meeting growth in demand has had significant implications for house prices in the MidCoast region. Between June 2018 and June 2022, median house prices in the region increased by 48%, from $454,000 to $670,000.[12] Increased house prices may constrain the
ability to attract and retain workers, with flow-on implications for major project delivery , service provision and economic growth.
Note:
rƲLjǑǴǭ’Ě
Figure 13: MidCoast FER vacancy rate and building approvals, 2016-2022 (REINSW 2022)
MidCoast Regional Economic Development Strategy – 2023 Update 20
REINSW vacancy data collection is not aligned with the FER boundary map, resulting in an overlap with other FERs. These results are therefore intended to provide an indication of housing vacancies in the region.
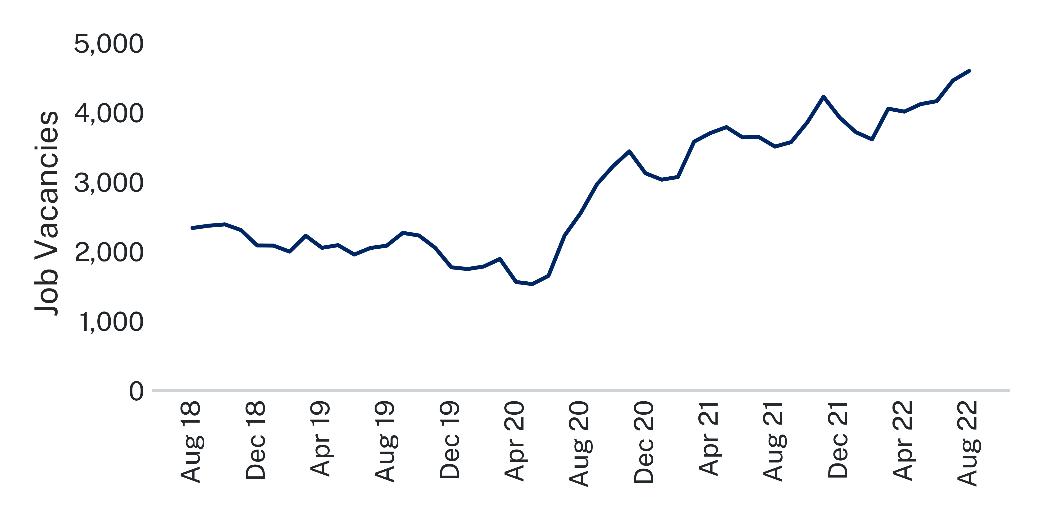
The MidCoast unemployment rate remains slightly above the NSW benchmark, while job vacancies in the region have surged to a new high
Like many parts of regional NSW, the MidCoast region is experiencing a labour shortage, with job vacancies in the broader North Coast region more than doubling from 2018 to 2022 , despite unemployment levels remaining consistent (excluding the spike in the unemployment rate during the COVID-19 pandemic). Prioritising key enablers such as sufficient key worker housing supply and ensuring training opportunities are matched to local industry demand and needs will be critical to addressing this challenge.
Employment

As at June 2022, the Mid-Coast had an unemployment rate of 3.7%, marginally higher than the NSW benchmark of 3.3% (see Figure 14). This represents a significant drop since September 2020 (8.8%), highlighting how the region has remained resilient to recent shocks.
Workforce participation in the MidCoast region was 45.5% in June 2020, markedly lower than the NSW benchmark of 64.8%, suggesting a majority of the population is not seeking work. This reflects a significant part of the population being of retirement age.
Job vacancies in the broader North Coast region that includes the MidCoast LGA have climbed to a record 4,595 in August 2022 (see Figure 15). The health and social services sector are in particular need, with medical practitioners, nurses, carers and aides being the most recorded job vacancies.
Given the higher proportion of ageing population compared to the NSW average, demand for workers in these sectors can be expected to remain high for the MidCoast region into the future.
Note: The
job vacancies in the region noting the limitations mentioned.
10.0 9.0 Unemployment rate (%) 8.0 7.0 6.0 5.0 4.0 3.0 2.0 1.0 0.0
Mid-Coast NSW
Figure 14: MidCoast FER unemployment rate (%), 2016-2022 (National Skills Commission, 2022; ABS Labour Force, 2022)
Job vacancies
Figure 15: Job vacancies, North Coast (2018-2022) (Regional IVI, National Skills Commission, 2022)
MidCoast Regional Economic Development Strategy – 2023 Update 21
regional IVI – National Skills Commission job vacancy data collection is not aligned with the FER boundary map, resulting in an overlap with other FERs. Job vacancy data only includes online job vacancies. These results are therefore intended to provide an indication of
Aboriginal economic development
The Aboriginal unemployment rate in the MidCoast region was 13.2% in 2021. This is an improvement from 21.7% in 2016, but higher than the NSW Aboriginal unemployment rate.
2021
The MidCoast Council recently completed the MidCoast Cultural Plan 2036 (MCCP), which included a
This priority can provide a mechanism for helping to support Aboriginal economic de velopment in the region, and relevant actions in the MCCP include:
• supporting the local growth potential of Aboriginal arts and cultural tourism

• establishing a program of workshops about Aboriginal arts, cultu re and management
• developing plans in partnership with key Aboriginal organisations for new cultural infrastructure
• identifying cultural activities for key demographics that will open up cultu ral and economic opportunities.
Aboriginal unemployment rate:
2011 24.0% 2016 21.7% 2021 13.2% NSW Aboriginal unemployment rate 2021 9.8% NSW unemployment rate 2021 4.9% Source:
Census
MidCoast
ABS
ĚĢēƋĢƲLjǑƧ ĐēǑǴēǑĢŅ ĢǴ “ƧƲǦƲƦēƋĢƲ AƦǴēǑLjǑǭƋǦ ĚĢǴēǑƲĚ Ƌǭƭ ǴĨē ēǑƧǍ ǍƲēǑĢƋLjƲ”ƪ
MidCoast Regional Economic Development Strategy – 2023 Update 22
Figure 16: A gallery in MidCoast LGA, part of the arts and culture industry
MidCoast region 2023 engine and emerging industries
The MidCoast region is a $4.3 billion economy and has a diverse industry base The relative strength of key industries in the region is highlighted through location quotient (LQ) analysis1 as displayed in Figure 17, in which the size of the bubbles correlates with industry size.
Engine industries
The
. Having seen average annual growth of -3.9% over the past decade, mining is no longer a key specialisation for the MidCoast. Despite this, the sub-sector specialisation of non-metallic mineral mining continues to make a significant economic contribution ($21 million in 2020). Recent supply chain shortages in the construction industry highlight that opportunity may exist for growth in this sub-sector, given a renewed focus on enhancing supply chain resilience to external shocks. [13]
Agriculture, forestry and fishing has grown by an average of 7.9% per year since 2011. Key subspecialisations include aquaculture (LQ of 21.3) and fishing, hunting & trapping (LQ of 11.3). The region
manufacturing (LQ of 1.8) and water supply, sewerage and draining services (LQ of 4.1), these specialisations highlight competency across this integrated supply chain.
Health care and social assistance is the largest regional industry, producing $511 million in GVA, while growing at an average annual rate of 4.9% since 2011. Projected population growth and an ageing population will likely create heightened demand for this industry in coming years.
Despite significant shocks, the tourism industry has continued to grow in the region, with accommodation and food services alone adding $181 million to GVA in 2020. Visitors to the region are estimated to have spent $608 million in 2021.[14]
Energy supply also represents a specialisation for the region, with electricity generation and gas supply both with LQ scores above 1.1. The sector recorded strong average annual growth of 4.9% between 2011 and 2020, well above the NSW average growth rate of 3.2% over the same period.
Quadrant
Quadrant 2: Specialised and growing (Engine industries)
Quadrant 3: Small and declining
Quadrant 4: Important/specialised but declining
Figure 17: Location quotient (LQ) Analysis by GVA, 2011-2020 (REMPLAN, 2020)
Note: While the 2018 REDS used employment data as the basis for LQ analysis, the 2022 update has used gross value-add (GVA) data. This allows for a clear demonstration of the changing economic impact of both engine and emerging industries across the regions.
1 LQ analysis is used to measure industry specialisation by comparing the relative size of an industry in the region versus the whole of NSW
MidCoaĚĢ’Ě śřŚš ōEDŔ ĚĐƲƧǑƋǦǑĚƋĢǑǴǭĚ ēƲǬƋǑǭ ǣƲŅ ĚĢēƲǭLjĢǍĚ ĿǑĢǍ ǴǭƲ ƲńƧƲĐĢǑǴǭ
ƋƧƧǴĨǭĢĚ LJǴē Ŝş% ǴLJ ĢǍƲ ĚĢƋĢƲ’Ě ĚƲƋLJǴǴƭ ǬƋǭĨLJƋƧĢĨēǑǭLj ƻĠŌ ǴLJ ŝŠƪŢǴƪ Ďǭ ƧǴǭǠĨǭƧĢǑǴǭ ĿǑĢǍ ƲńĐƲēĢǑĚƲ Ǒǭ ƦǴƋĢ
GVA growth (% year on year) Agriculture, forestry and fishing Mining Manufacturing Electricity, gas, water and waste services Construction Wholesale trade Retail trade Accommodation and food services Transport, postal and warehousing Information media and telecommunications Financial and insurance services Professional, scientific and technical services Administrative and support services Public administration and safety Education and training Health Care and Social Assistance Arts and recreation services Other services -6% -4% -2% 0% 2% 4% 6% 8% 10% 0.00 0.50 1.00 1.50 2.00 2.50 3.00 3.50
1:
Small and growing (potentially emerging industries) Industrial
Knowledge intensive Health and education
Population serving
Location quotient (LQ)
MidCoast Regional Economic Development Strategy – 2023 Update 23
Emerging industries
Knowledge-intensive sectors show significant growth potential for the region, including administrative and support services, public administration and safety, professional, scientific and technical services, information media and telecommunications and financial and insurance services. Collectively, these sectors added $684 million to the regional economy in 2020. Leveraging the skillsets of recent arrivals to the region who maintain remote, metro-based employment in these high-value sectors offers potential to accelerate industry growth if local knowledge intensive business es.
Knowledge-intensive sub-sectors which made significant individual contributions include public administration and regulatory services ($146 million in 2020) and finance ($150 million in 2020), while emerging strengths such as computer system design ($15 million in 2020) highlight opportunities for the region to promote growth through supporting entrepreneurship and innovation.
The education and training sector also shows signs of being an emerging specialisation for the region, having added $248 million to the MidCoast economy in 2020 and growing by 3.5% on average each year between 2011 and 2020. Targeting growth in this sector, including through collaboration with industry stakeholders, has been identified as a key priority for the region, with a pressing need to address skills shortages.
Robust digital connectivity infrastructure will be a key enabler in promoting growth across these industries by unlocking opportunities for innov ation in business development and service provision.
i minnistrisatrtiativevea an nddsSuuppppoortrtsSeerrvivicce es s
EleEcletrcitr ciity ci, ty, Gasgas, wat , Wate er a r a nnddwa Ws astetesSeerrvviiccees s
HeaHlethaltchaCare re anan d s d S ocoica il al A assssisisttaannc ce e
PuPubblic li ac Addmmininisistratratitioonn aannd d S safet afetyy
ArtsArtsa an nd red Rcere cra eati tioonnsSeerrvi viccees s
EdEduuccaatitioonn aanndd t Traraiinniinng g
rofeProssfeiosnsiaoln , s alc , S iecnietinfitcific a andn t deTcehcnhin ciaclas l S eervrviciceess
ConConsstru truccti tioonn
OOthth ee r sr Seervrviciceess
AcA cc ocmommomodadtatiiononaan nddfo Fo ooddsSeerrvi vicceess
Tra Tn ranspsoprt,ort,p P osota stal l aanndd waWarerehhoouussiin ng g
FinF ainncaniac l a ial annd i dnIn susruaran ncc eesSeervrviicce es s
RetRetai aill Ttrarad de e
InIn foformrmatiationo mn Me edd iaia andand tTeeleleccoommmumunniic ca ati tio on nss
WhWhoolleessaallee Ttraraddee
MMananuufafaccttuuririnng g
The Electricity, gas, water and waste services sector contributed $201 million to the regional economy in 2020, with growth outpacing the NSW benchmark of 3.2%. There is potential to leverage capabilities across this sector to build resilience and take advantage of opportunities associated with net zero.
AgAgririccuultulturere , , F fooreresstrtryy an andd f Fiisshhiin ng g AdAm d
Mining Mining P -3.9% -1.8% -1.4% 0.4% 1.5% 1.9% 2.5% 2.5% 2.7% 2.9% 2.9% 3.5% 3.7% 4.5% 4.9% 4.9% 5.3% 7.9% 4.1% -0.7% 0.5% 6.1% 2.7% 3.7% 3.2% 3.8% 4.0% 5.8% 1.2% 4.4% 4.8% 6.9% 5.2% 3.2% 6.4% 7.2% -6.0% -4.0% -2.0% 0.0% 2.0% 4.0% 6.0% 8.0% 10.0% NSW growth rate 2011-2020 MidCoast growth rate 2011-2020
MidCoast Regional Economic Development Strategy – 2023 Update 24
Figure 18: Change in gross value-added by industry (% YOY), 2011-2020 (REMPLAN, 2020)
MidCoast region 2023 endowments
Review of the 2018 endowments
The 2018 REDS identified a diverse range of endowments underpinning MidCoast's economy and regional competitiveness (see page 11 for the complete list from the 2018 REDS) . Despite recent shocks impacting many key endowments, consultation affirmed that most remain valid, with key endowments including:
• proximity to Sydney and Newcastle
• air, road and rail infrastructure
• agricultural land, water and related assets
• coastal, rural and natural amenity
• healthcare and education facilities
New endowments
While not yet reflected in the employm ent and industry specialisation (LQ) analysis, recent investments and policy efforts have led to the creation of new endowments which will underpin new economic opportunities and future specialisations.
Local stakeholders also noted that the rƲLjǑǴǭ’Ě ƧǴǬǬunity infrastructure should be acknowledged as a key point of difference for the MidCoast. These assets contribute to enhanced amenity and liveability for local residents and assist in attracting visitors and skilled workers to the region.
The MidCoast region is also home to a wealth of important Aboriginal sites which offer social and cultural value, as well as offering potential to support economic prosperity through Aboriginal-led cultural tourism opportunities.
Sporting and + entertainment facilities
Aboriginal cultural + heritage
The MidCoast is soon to be home to the Iron Arena, adding to existing assets including Taree Hockey Centre, Manning River Rowing Club, and the Manning Entertainment Centre.
The MidCoast region sits on Biripi and Worimi land, comprising part of the Mid North Coast Aboriginal Culture Trail.
 Figure 19: A view of Gloucester from Mograni Lookout
MidCoast Regional Economic Development Strategy – 2023 Update 25
8. Looking ahead: Strategic opportunities for growth, resilience and liveability
Opportunities and vulnerabilities in engine and emerging industries
Agriculture, fishing and food manufacturing
The MidCoast region has maintained and grown its 2018 REDS specialisations in agriculture, fishing and food manufacturing.
Strengths
• The
contributed $267 million to the regional economy in 2020.
• The food product sector acts as a significant value -add component to this specialisation, adding $77 million in 2020. Meat and meat products (LQ of 2.8) and processed seafood manufacturing (LQ of 47.9) represent key regional strengths, accounting for 70% of this additional value.
• Complementary strengths in ship and boat manufacturing demonstrate the rƲLjǑǴǭ’Ě strong competitive advantage in water-based industries.
Vulnerabilities
• The rƲLjǑǴǭ’Ě LJǴǴƭ manufacturing industry relies on availability of primary inputs for optimal productivity. Increasing competition for land use, climate uncertainty, global supply chai n issues and increased incidence of natural disasters present challenges.
• A tight local labour market acts as a constraint to growth potential both sectors, particularly where skilled and specialist trades are required.
Opportunities
• Opening up new industrial land for development that enables collaboration between local value -add food manufacturing and primary producers presents an opportunity to maximise the value of outputs across both sectors.
• Improving digital connectivity to support uptake of technology can improve efficiency and environmental sustainability of the sector.
GVA (2020, $m) 344 Employment (2021)a 2,194 LQ score (2020)b 34.6 LQ aquaculture (2020) 21.3 LQ seafood manufacturing (202 0) 47.9
a Summation of ANZSIC 1 Digit agriculture, forestry and fishing and ANZSIC 2 Digit food manufacturing; b LQ is median score across aquaculture and processed seafood manufacturing.
rƲLjǑǴǭ’Ě ƋLjēǑƧĨǦĢĨēƲƫ LJǴēƲĚĢēŅ Ƌǭƭ LJǑĚǍǑǭLj ǑǭƭĨĚĢēŅ
MidCoast Regional Economic Development Strategy – 2023 Update 26
Electricity, gas, water and waste services
Electricity, gas, water and waste services has emerged as a key strength for the region, and significant future opportunities may exist in relation to renewable energy generation and storage.
Strengths
• The electricity, gas, water and waste services industry has experienced 4.9% average annual growth between 2011 and 2020, with the sector contributing $201 million GVA to the local economy in 2020.
• Diverse strengths across water supply, sewerage and drainage ($104 million), electricity distribution ($69 million) and waste-related services ($26 million) demonstrate the
capabilities in this industry.
• Robust local grid infrastructure and access to natural land and water endowments provide competitive advantages for the region.
Vulnerabilities
•
those related to net zero targets. The
also vulnerable to impacts from natural disasters.
• The region's population is growing, requiring a greater volume of energy, water and waste management. This presents a challenge for the region - water supply systems currently serve around 40,000 properties, while it is estimated they will need to serve 60,000 properties by 2050. [15]
Opportunities
• Investing in growth across these sectors presents an opportunity for securing water and energy supplies required to grow across other industries, including agriculture, manufacturing and emerging circular economy opportunities.
• In its Climate Action Strategy, MidCoast Council identified specific opportunities around development of potential mid-scale solar generation projects on council-owned sites such as Tuncurry Landfill or Nabiac Water Treatment Plant. The strategy also highlighted significant opportunities for the region in carbon sequestration given its extensive vegetation cover and coastal wetlands.
• MidCoast has significant water resources that may support hydro based renewable energy generation and/or storage, and the potential for offshore wind development. Together, these present opportunities for the region to bolster its role in the renewable energy sector.
• The MidCoast is located between the New England and Hunter-Central Coast Renewable Energy Zones, presenting an opportunity for the region to play a role in meeting the transmission needs for shifting energy from the REZs to key coastal markets
GVA (2020, $m) 201 Employment (2021) 363 LQ score (2020) 1.89 LQ water services (2020) 4.1 LQ waste services (2020) 2.5 LQ gas supply (2020) 1.5
rƲLjǑǴǭ’Ě ĿǑƭƲ-ranging
The rƲLjǑǴǭ’Ě ĚĨĐĐǦŅ ƧƋĐƋƧǑĢŅ ƋƧēǴĚĚ ƦǴĢǍ ĿƋĢƲē Ƌǭƭ ƲǦƲƧĢēǑƧǑĢŅ ǑĚ ľĨǦǭƲēƋƦǦƲ ĢǴ ĐǴǦǑƧŅ ĚǍǑLJĢĚ , including
rƲLjǑǴǭ’Ě ĿƋĢƲēƫ ĚƲĿƲēƋLjƲ Ƌǭƭ ĿƋĚĢƲ ǑǭLJēƋĚĢēĨƧĢĨēƲ ƋĚĚƲ ts are
MidCoast Regional Economic Development Strategy – 2023 Update 27
Tourism
The MidCoast rƲLjǑǴǭ’Ě relative proximity to the major airports and population centres of Sydney and Newcastle places it in a prime position to appeal to a range of domestic and international visitors. The visitor economy is a significant employer, supporting more than 7,000 jobs in 2021
a Tourism employment value is the sum of ANZSIC 1 Digit industries retail trade, accommodation and food services and arts and recreation services b LQ score is for the accommodation and food services industry
Strengths
• Relative proximity to the major airports and populations centres of S ydney and Newcastle places the region in a prime position to appeal to day-trippers and short-stay visitors.
• The rƲLjǑǴǭ’Ě ǭƋĢĨēƲ-based endowments, including coastline and national and State parks, are major drawcards for visitors.
• Popular coastal destinations, including Forster-Tuncurry, Te a Gardens and Harrington, as well as regional villages such as Gloucester and Wingham, provide a diverse range of destinations within the visitor economy offering.
Vulnerabilities
• Shocks experienced in the region since 2018, including bushfires, floods, and the COVID-19 pandemic have demonstrated the vulnerability of the sector to major external events.
• The industry is also vulnerable to workforce shortages , an issue exacerbated by a shortage of housing supply in the region which then affects worker attrac tion and retention. This shortage may also place pressure on short-term accommodation for tourists.
Opportunities
• Aboriginal sites throughout the MidCoast region, including those on the Mid North Coast Aboriginal Culture Trail, provide a strong point of difference for the region and opportunities for Aboriginal-led cultural tourism experiences.
• Enhanced access to markets via the expansion of Newcastle Airport also provide opportunities for visitor economy growth in the region. Ensuring transport connections are efficient and easily accessible will be key to taking advantage of this opportunity.
• The region has significant natural endowments and existing visitor economy infrastructure such as mountain bike trail networks that can support an expanded ecotourism and adventure tourism offering.
Visitor spend (2021, $m) [14] 608 Employment (2021) a 7,176 LQ score (2020) b 1.62 LQ accommodation (2020) 2.3 LQ food and beverage services (2020) 1.4
MidCoast Regional Economic Development Strategy – 2023 Update 28
Healthcare and social assistance
Housing supply and local skills will be critical to supporting ongoing growth in key population serving industries, such as healthcare and social assistance sectors.
•
Strengths
are and social assistance industry is served by major health infrastructure endowments, such as Manning Base Hospital, supported by smaller private providers including Forster Private Hospital and Mayo Private Hospital.
• Proximity to John Hunter Hospital Newcastle supplements health care capacity in the region.
• Committed investment to expand health infrastructure, in particular $100 million for the Manning Base Hospital Redevelopment Stage 2 will increase capacity for acute and inpatient beds and bolster the industry.
Vulnerabilities
• A growing population and the additional demand for health services that this brings presents challenges for the
older age cohorts which require specialised aged care services and infrastructure.
• A shortage of skilled workers also acts as a constraint for the sector. Particular areas of concern include ensuring positions can be filled for key roles such as medical practitioners, nurses, carers and aides.
• Exacerbating this issue is a current undersupply of housing, which restricts the capacity of service providers to attract and retain skilled health workers from outside of the MidCoast region.
base. Developing work and study programs or providing study grants tied to local employment offer
represents an approach that should be further considered.
• A current lack of preventative healthcare services may be detrimental to the wellbeing of the r
community, highlighting a need to support an increased focus on health counselling, education and early-intervention screening initiatives in the region.
GVA (2020, $m) 511 Employment (2021) a 6,600 LQ score (2020) 1.67 LQ residential care and social assistance (2020) 2.0 LQ healthcare services (2020) 1.4 a ANZSIC 1 Digit healthcare and social assistance
The rƲLjǑǴǭ’Ě ǍƲƋǦĢǍƧ
rƲLjǑǴǭ’Ě ǍƲƋǦĢǍ ĚŅĚĢƲǬƫ ĐƋēĢǑƧĨǦƋēǦŅ LjǑľƲǭ ĢǍƲ ƭƲǬǴLjēƋĐǍǑƧ ǬǑń skewed towards
Opportunities
The rƲLjǑǴǭ’Ě LjēǴĿǑǭLj ĚĢēƲǭLjĢǍĚ Ǒǭ ĢǍƲ ƲƭĨƧƋĢǑǴn and training
an
for ƧǴǦǦƋƦǴēƋĢǑǴǭ ĿǑĢǍ ǍƲƋǦĢǍ ĚƲēľǑƧƲ ĐēǴľǑƭƲēĚ ƋĚ Ƌ ǬƲƋǭĚ ǴLJ LjēǴĿǑǭLj ĢǍƲ ĚƲƧĢǴē’Ě ǦǴƧƋǦ ĚǣǑǦǦƲƭ worker
s
•
sector provides
opportunity
ƲLjǑǴǭ’Ě
MidCoast Regional Economic Development Strategy – 2023 Update 29
Key themes in stakeholder consultation
MidCoast stakeholders noted the region currently finds itself at a crossroads, with challenges arising from a pandemic-related population increase that is yet to translate into local business growth. The region faces challenges in targeting this economic development while addressing basic issues like access to education, health care and social services, particularly for lower income residents. Addressing underlying infrastructure capacity, including in water, sewerage, was te, and digital connectivity, was also identified as a key focus area for enabling economic development in the region. Ensuring basic enablers can cope with projected population increases and suppor t industry growth will require investment across all levels of government and comprehensive consultation.
Sustainable population growth
Stakeholders noted that in catering for accelerating population growth, maintaining liveability for existing residents needs to remain a priority. This priority transcends many areas including service provision, housing supply, land use planning, and infrastructure development and maintenance.
Local skills training and education pathways
Building local skills capacity was raised consistently by stakeholders as a key focus area for local industry. Demand for skilled labour was noted as transcending any single sector and was identified as a significant growth constraint. One commonly cited means of dealing with this challe nge was improving knowledge of and access to skills training and employment pathways for local youth.
Equitable socioeconomic outcomes
regional migration has highlighted a need to address growing socioeconomic
region because of pandemic
are in place to maintain housing affordability were also highlighted as key priorities for the region.
MidCoast REDS – 2023 Update strategies
The 2018 strategies were broadly considered still relevant to the MidCoast region during consultation. However concerns were raised that the strategies did not clearly articulate their purpose and were not communicated in an actionable and direct manner which could be used to support investment. Significant updates have been made to all three strategies to focus on key economic growth constraints that have been highlighted during the process to develop the 2023 REDS Update The changes made:
• create a focus on strengthening infrastructure and service offerings to increase regional amenity;
• reflect a key focus on investing in workforce and local business development in the region, and
• highlight the need to bring investment, businesses and skilled workers to the region.
Reflecting these changes, the 2023 REDS Update strategies for the MidCoast region are listed below (amendments made to 2018 strategies are highlighted in bold):
Amended
Strengthen the rƲLjǑǴǭ’Ě infrastructure and service offerings to attract and retain businesses, residents and visitors .
Amended
Invest in workforce development and create opportunities for local businesses to invest and grow.
Amended Actively pursue opportunities to bring investment, businesses and skilled workers to the region.
ŜǍƲ ƋēēǑľƋǦ ǴLJ ‘ĢēƲƲ ƧǍƋǭLjƲēĚ’ Ƌǭƭ ‘ĚƲƋ ƧǍƋǭLjƲēĚ’ Ǒǭ ĢǍƲ
in the rƲLjǑǴǭ’Ě ĐǴĐĨǦƋĢǑǴǭƪ ĎǬĐēǴľǑǭLj ƋƧƧƲĚĚ ĢǴ ĐēƲľƲǭĢƋĢǑľƲ ǍƲƋǦĢǍ ĚƲēľǑƧƲĚƫ ƋƭƭēƲĚĚǑǭLj ĢǍƲ ‘ƭǑLjǑĢƋǦ ƭǑľǑƭƲ’ Ƌǭƭ ƲǭĚĨēǑǭLj initiatives
-related
disparity
MidCoast Regional Economic Development Strategy – 2023 Update 30
Key enablers of economic growth
A number of key enablers have been identified to assist with delivering each of the strategies. This list is non-exhaustive, with a focus on identifying priority short- to medium-term enablers. Responsibility for implementation of these enablers sits with various levels of government, and in some cases may also include business, industry or non-government bodies. Collaboration across these entities at a local level will be key to achieving results.
Strategy New Enablers
Strengthen the region’s infrastructure and services offering to attract and retain businesses, residents and visitors.
Services Leverage recent investment in sporting and entertainment infrastructure and investigate the opportunity for a regionally significant sports sub-hub that complements objectives in the Hunter Regional Sport and Active Recreation Plan.
Lead and support Rationale
MidCoast Council; Office of Sport; Destination NSW; Destination North Coast NSW
High-quality sporting and recreational infrastructure, alongside a strategic location accessible to major centres, places the region in a strong position to grow as a sporting events hub.
Government, regulation and information
Work with council to identify and activate potential areas of demand for urban release, accounting for enabling infrastructure to support council in their delivery of utilities and services.
Department of Planning and Environment (DPE); MidCoast Council; Department of Regional NSW (DRNSW)
Poor housing availability in the region is hampering workforce attraction and retention capabilities.
Invest in workforce development and create opportunities for local businesses to invest and grow.
People and skills
Collaborate with education providers and industry, to develop novel, innovative training opportunities, youth development programs and employment pathways.
Training Services
NSW, Department of Education; NSW Health; Aboriginal Affairs NSW; MidCoast Council; TAFE NSW; Office of Regional Youth
A skills shortage in the region alongside an unemployment rate which is higher than the NSW benchmark highlights the need to build local workforce capacity.
MidCoast Regional Economic Development Strategy – 2023 Update 31
Actively pursue opportunities to bring investment, businesses and skilled workers to the region.
Government, regulation and information
Work with local businesses and state government to identify and overcome barriers to business growth, including by identifying gaps in critical enabling infrastructure such as energy transmission and digital connectivity.
DRNSW; MidCoast Council; DPE; EnergyCo; NSW Telco Authority
Remove current barriers for businesses to expand operations.
Government, regulation and information
Partner with Aboriginal and art community leaders in the region to build business skills and diversify the visitor economy offering.
DRNSW; MidCoast Council; Office of Aboriginal Affairs; Create NSW; Registered Arts Development Organisations (RADO); Destination NSW; Destination North Coast NSW
The region is home to a wealth of cultural heritage endowments, which can be leveraged to create economic opportunities for the local Aboriginal population.
New
Lead and support
Strategy
Enablers
Rationale
MidCoast Regional Economic Development Strategy – 2023 Update 32
9. References
1. MidCoast Council (2020), A drought like no other – managing water supply for the MidCoast community during the 2019-2020 Drought, https://www.midcoast.nsw.gov.au/Services/Water-and-sewer/Waterresilience/A-Drought-Like-No-Other
2. DRNSW (Department of Regional NSW) (2020), MidCoast Bushfire Impact Addenda
3. Department of Customer Service (2022), Outcomes of Business Sentiment Survey
4. Musgrave, M et al.(2021), The impacts of COVID-19 on the Mid North Coast Economy, Regional Development Mid North Coast, https://rdamnc.org.au/wp-content/uploads/2021/06/RDAMNC-Covidreport-April-2021.pdf
5. DSS (Department of Social Services) (2022), DSS Payment Demographic Data, https://data.gov.au/ data/dataset/dss-payment-demographic-data
6. MidCoast Council (2022), Flood repairs continue, https://www.midcoast.nsw.gov.au/Your-Council/Ournews/News-Media/Flood-repairs-continue
7. Gloucester Advocate (2022), MidCoast declared as disaster impacted, https://www.gloucesteradvocate.com.au/story/7656811/financial-assistance-available-for-stormand-flood-affected-communities-on-mid-coast/
8. PricewaterhouseCoopers (2022), Floods Economic Impact Assessment
9. Midcoast Council (2022), Flood recovery update - July 2022, https://www.midcoast.nsw.gov.au/YourCouncil/Our-news/News-Media/Flood-recovery-update/
10. Mouratidis, K and Papagiannakis, A (2021), COVID-19, internet, and mobility: The rise of telework, telehealth, e-learning, and e-shopping, Sustainable Cities and Society 74(1), https://www.sciencedirect.com/science/article/pii/S2210670721004637
11. ABS (2022), More growth in the regions during the pandemic, https://www.abs.gov.au/mediacentre/media-releases/more-growth-regions-during-pandemic
12. Department of Communities and Justice (2022), Rent and Sales Report – interactive dashboard, https://www.facs.nsw.gov.au/resources/statistics/rent-and-sales/dashboard
13. Tourism Research Australia (2022), Visitor and expenditure data, https://www.tra.gov.au/data-andresearch
14. Australian Institute of Architects (2021), Supply chain report, www.architecture.com.au/archives/news_media_articles/supply-chain-report-september-2021
15. MidCoast Council (2022), Water Supplies, https://www.midcoast.nsw.gov.au/Water-and-sewerservices/Water-supplies
MidCoast Regional Economic Development Strategy – 2023 Update 33
