MIDCOAST ROAD STRATEGY

Acknowledgement of Country
We acknowledge the traditional custodians of the land on which we work and live, the Gathang-speaking people and pay our respects to all Aboriginal and Torres Strait Islander people who now reside in the MidCoast Council area. We extend our respect to Elders past and present, and to all future cultural-knowledge holders.
MidCoast Roads Strategy 3 Table of Contents MidCoast Road Strategy 1 Executive Summary & Recommendations 9 Introduction & Background 16 Context 18 Linkage To Other Strategies & Community Outcomes 19 The Mayoral Minute 21 Brief History of Roads in NSW and the MidCoast 22 Social & Economic Benefits of Good Roads...........................................................................26 Road Maintenance Funding Gap (“A National Problem”) 27 Legislative & Technical Frameworks 29 Ownership of Roads & Liability...............................................................................................29 Road Classifications and Funding Arrangements 32 The MidCoast Road Hierarchy 35 Road Segments 37 Road Asset Components 38 Road Inspections....................................................................................................................39 Benchmarking Comparisons 41 Current State Analysis 48 Transport Asset Inventory 48 Transport Asset Condition 50 Transport Capital Funding 2018/2019 – 2023/2024 59 Transport Asset Renewal .......................................................................................................61 Transport Maintenance Funding 67 Transport Maintenance Income Sources................................................................................69 Road Safety & Crash Statistics 72 Community Satisfaction 77 Customer Requests................................................................................................................78 Transport Maintenance Intervention Levels 80 2022/2023 Performance.........................................................................................................84 Strategic Risk Review 86 Current State Summary 87 Desired Future State 90 Asset Condition 91 Maintenance Funding 93 Network Deterioration Modelling.............................................................................................95 Backlog 99 Transport Asset Strategic Business Plan 101 Customer Experience Strategy – Road Defect Customer Journey Map 103 Service Levels 106
MidCoast Roads Strategy 4 Climate Change Risks, Adaptation & Net Zero by 2040 108 Transport Infrastructure Improvement Opportunities............................................................109 Future Desired State Summary 116 Options 117 References 118 Related Links 120 Appendix A – Strategic Action Plans 122
MidCoast Roads Strategy 5 List of Figures Figure 1 - The MidCoast Local Government Area 16 Figure 2 Road Strategy Link to the Integrated Planning and Reporting Framework 18 Figure 3 - 2026 Road Safety Plan - Safe Systems Approach (TfNSW) 19 Figure 4 – Roads Classifications 33 Figure 5 – The MidCoast Road Network 34 Figure 6 - Urban Road Hierarchy 35 Figure 7 - Rural Road Hierarchy 35 Figure 8 - Typical Example of an Urban Road Network Layout 36 Figure 9 - Road Segmentation 37 Figure 10 - Road Componentisation 38 Figure 11 - Asset Condition Rating Framework (adapted from IPWEA Guidelines) 39 Figure 12 - LGP (PWC) Coastal Councils Comparison - Population Density 42 Figure 13 - LGP (PWC) Coastal Councils Comparison - Road Network Length 42 Figure 14 -LGP (PWC) Coastal Councils Comparison- Bridge Length 42 Figure 15 - Total Length of Road by All NSW Councils 43 Figure 16 - Comparison of The Length of Road Maintained Per Capita - OLG Group 5 Councils 44 Figure 17 - Comparison of the Average Residential Rates by all NSW Councils 45 Figure 18 - Rates Revenue Per Kilometre of Road - OLG Group 3-6 Councils 46 Figure 19 - Distribution of Roads by Type 48 Figure 20 – Sealed & Unsealed Road Condition by Gross Replacement Cost (2022) 50 Figure 21 - Typical Examples of Condition Ratings 50 Figure 22 - Sealed Road Condition Ratings by Road Segment 51 Figure 23 - Sealed Road Condition Ratings by 10m Averaged Results (to 2 significant figures) 51 Figure 24 - Distribution of Measured Condition Data – Sealed Roads 52 Figure 25 - Bridges Asset Condition Table & Graph 54 Figure 26 – Footpath & Cycleways Condition Graph & Table 56 Figure 27 - Kerb & Gutter Condition Graph & Table 58 Figure 28 - Annual Expenditure FY2022/2023 by Road Type 59 Figure 29 - Transport Capital Funding (source – Adopted DPOPs) 59
MidCoast Roads Strategy 6 Figure 30 - Internal Revenue Source Funding for the Transport Capital Works Program 60 Figure 31 - Required Vs Actual Renewals - Urban Roads 61 Figure 32 - Required Vs Actual Renewals - Rural Road Rehabilitation 61 Figure 33 - Required Vs Actual Renewals – Sealed Road Re-surfacing (Urban & Rural Roads) 62 Figure 34 - Relationship Between Pavement Condition & Intervention Costs (Galehouse et. al.) 63 Figure 35 – Required Vs Actual Renewals – Bridges 64 Figure 36 - Required Vs Actual Renewals – Footpaths/Cycleways 65 Figure 37 - Required Vs Actual Renewals – Kerb & Gutter 66 Figure 38 – Operations North & South Maintenance Budget Comparison 67 Figure 39 – Financial Assistance Grant – MidCoast Council Local Roads Maintenance Component 69 Figure 40 - Regional Roads Block Grant - MidCoast Council 71 Figure 41 - Types of Crashes 2018-2022 72 Figure 42 - Crashes By Road Surface Type 2018-2022 72 Figure 43 - Crashes by Road Classification 2018-2022 72 Figure 44 – Factors Contributing Crashes 73 Figure 45 – Crashes by Movement Type 73 Figure 46 - MidCoast Crash Data by Severity - Excluding State Roads/Highways 74 Figure 47 - Comparison of Community Survey Results - Satisfaction v's Importance for Roads 77 Figure 48 - Total Customer Service Requests by Month - Operations North & South 78 Figure 49 - Risk Prioritised Works Management Model & Request Prioritisation/Escalation 79 Figure 50 - Defect Evaluation - Road Hazard Risk Factors 82 Figure 51 - Road Risk Ratings & Response Timeframes 83 Figure 52 - Transport Operations 2022/23 Maintenance Budget (before audit & end of year processes) 85 Figure 53 - Transport Operations 2022/23 - Maintenance Budget Vs Expenditure 85 Figure 54 - Relationship Between Early Intervention & Deferral of Future Rehabilitation (World Road Association) 88 Figure 55 - Road Strategy Goals 90 Figure 56 - Road Pavement Condition Index (PCI) Deterioration & Intervention Costs Model (Galehouse Et. Al.) 91
MidCoast Roads Strategy 7 Figure 57 - MCC Road Asset Condition Overlayed on Deterioration Model 91 Figure 58 - Crisis/Reaction/Apathy Cycle 92 Figure 59 - Impacts of Failing to Meet Maintenance & Renewal Ratio Benchmarks on Asset Deterioration 92 Figure 60 - Simplified Asset Condition Vs Maintenance - Overlayed with MCC's Current Position 93 Figure 61 – Sealed Road Network Condition Modelling Results By Funding Scenario (ARRB) 95 Figure 62 - Tabulated Sealed Road Network Condition Modelling Results by Funding Scenario (ARRB) 96 Figure 63 0 Modelled Future Pavement Condition Index - Base Case Scenario (Current Budget $26M) 97 Figure 64 - Analysis of Funding Gap to Sustain Current Condition 98 Figure 65 - Visual of Cost To Bring To Satisfactory (Backlog Ratio Calculation) 99 Figure 66 - Count of the 10m Road Sections Accumulated Above the Trend in Condition 5 100 Figure 67 - Transport Asset Strategic Business Plan and the IP&R Framework 101 Figure 68 - Transport Assets Strategic Business Plan - Key Strategic Initiatives 102 Figure 69 - Current Maintenance Service Output Levels & Proposed Levels (subject to additional funding) 107 Figure 70 - Destroyed Stormwater Inlet Pit Lintel (<2 years old) 114 Version Purpose of Document Reviewed by Date 0.1 Initial Draft Robert Scott Dec 2023 1.0 Final Draft Robert Scott Jan 2024 2.0 Peer Reviewed Final Document Warren Sharpe Robert Scott April 2024
Preamble
Across the MidCoast Region, our local roads form an essential web that links our community with friends, services and businesses that supply their daily needs. Every community member interacts with the road network in one way or another on a daily basis. Our roads are an essential element of a modern connected community.
Our transport network has evolved as the MidCoast area has developed. It was initially based on the well-worn routes of the traditional custodians of the land. Expansion then came in waves or campaigns, momentarily catching up with development before lagging again We recognise the historical pattern of expansion of the road network, the impact it has had over time and the continuing challenges and opportunities associated with further growth. This strategy is about breaking the crisis cycle between campaigns, ensuring that we are constantly working to improve our management of the network with a clear pathway to the required future state at the heart of everything we do
We seek to ensure our actions meet the expectations of the current community and to ensure our generation carries its fair share to avoid passing on a larger debt to our children.
Road crashes are avoidable. We recognise that our community can spend longer driving between locations than other areas. As a result, local residents are at more risk of being involved in a crash The impact of road-related trauma extends deeply into the community through the network of family, friends and work. We empathise with those who have been impacted by a crash on our road network. Providing better quality and safer infrastructure reduces risk, will benefit everyone and is a key part of the safe systems approach to lowering road trauma.
Around 60% of workplace deaths in Australia involve workers injured by moving plant of one form or another. Many of these are on roadwork sites. We are committed to providing a safe workplace to all staff and contractors who work on our roads.
We recognise the dedication and commitment of the staff working on our roads. They are affected by weather extremes, be it hot or cold, wet or dry. Being visible at the front of our service, they often bear the brunt of the community's frustration or dissatisfaction. Despite physical and practical limitations, they continue to be there for our community. They are there 24 hours a day, 365 days a year, in any condition, doing their best to keep our roads safe.
We also acknowledge the vital role local roads play in keeping communities connected and protected, and heed the many lessons learnt from recent natural disasters. We must be better prepared and know that if we act pro-actively, what we do every day can help prepare our network to keep our community, first responders, workers and early recovery personnel safer during and immediately post natural disasters.
We know that skills and capacity within the Local Government and construction sectors is stretched, that this is impacting services delivered to communities across regional Australia and that without positive action, this situation will worsen. This challenge presents perhaps the most exciting opportunity to create a positive impact on the employment, development and retention of the workers needed, including addressing the very high youth unemployment within our Local Government Area.
This strategy plots a path towards a better future where our roads better meet the community’s needs, where safety and resilience are improved and where our resources better align with the community's expectations. It’s how we will be Better Every Day!
MidCoast Roads Strategy 8
Executive Summary & Recommendations
This Road Strategy outlines what would be required to improve our road network's condition and meet the community's expectations. It identifies the current state of our roads, future desired states, challenges, and improvement opportunities.
Currently, we face resource constraints due to external factors like rate pegging. This limits our ability to deliver the desired or lowest lifecycle cost level of service. We rely heavily on external funding to maintain the current performance, which is typical for many NSW councils. Despite these challenges, road users expect better safety, resilience and comfort outcomes.
Our road network spans over 3600km, with roughly equal parts sealed and unsealed roads. Regional Roads make up 10% of the network. The condition of our road network affects the community's perception of its safety as well as the perception of Council’s overall performance Residents in our area are at a greater risk of being involved in road crashes resulting in death than those in metropolitan areas.
The current state of our road network is not meeting the community's expectations. Residents have consistently identified the need for improvement and have little appetite for lower service levels. We struggle to maintain the existing road networks, which fuels requests for sealing, widening, and upgrading roads. MidCoast residents have consistently rated the condition of local roads as needing improvement.
Our Roads
Unfortunately, more than a third of the assets across the road network have deteriorated. Although 70% of the road surface is in good condition or better, a high proportion of the road surface is beyond the intended treatment intervention level. This means that the poorest portions of the road significantly impact our network's overall condition and we can no longer maintain the network at the lowest lifecycle cost.
Timely pro-active road maintenance and renewals are essential to ensure that the road assets achieve their intended useful life while providing the adopted level of service. Unfortunately, there has been an increase in the number of sections rated 'very poor'. The individual sections identified as failed are likely to influence the perceptions of our network's overall condition significantly.
MidCoast Council should seek to establish a much more sustainable model that allows a strategic and pro-active approach to management and care of the road network over the short and longer term.
Many bitumen seals on our sealed roads are well beyond the desirable age, with a high proportion in 'poor' or 'very poor' condition. Bitumen seals, when resealed at appropriate and more frequent intervals, offer protection to the underlying structural road pavements and reduce susceptibility to potholing and other pavement defects. A consequence of the current low resealing rates is the high proportion of roads with high roughness and more than a quarter of the sealed road network showing significant cracking, indicating pavement stresses exceed the structural pavement’s capacity.
In good condition, bitumen seals also provide the skid resistance needed between the road surface and the tyres of motor vehicles to stop vehicles from sliding off the road and being able to stop when required. As bitumen seals become worn, this skid resistance reduces, exposing the community to higher rates of road crashes and road-related trauma. The MidCoast area has a relatively high incidence of single-vehicle crashes, which may be indicative of the historically poor resealing frequencies
MidCoast Roads Strategy 9
It is, therefore, essential that we address the current inadequate levels of bitumen resealing across the sealed road network as a priority action. This should be achieved by fully funding the required resealing cycle annually, adjusted for growth in the network and the rising cost of the work
If this is not done, the cumulative impact over the medium term will significantly increase the backlog of resealing works and the condition of our sealed roads will get much worse
Our Bridges
Our bridges are a vital part of our transportation infrastructure, providing safe and convenient crossings over waterways in the Council area. Our network currently has 669 bridges, of which 425 are concrete and 159 are timber.
Since 2019, 28 timber bridges have been replaced. All of these have been supported by grant funding under Fixing Country Bridges (90%), the Timber Bridge Renewal Program (50%) and Natural Disaster Recovery Funding (100%). A further 11 replacement projects are in progress with another 4 being on hold.
We have been replacing timber bridges with modern, durable structures on a prioritised basis at a pace slightly ahead of that rate. As a result, there are now 159 timber bridges left to replace. Funding and completing renewals ahead of deterioration remain significant challenges. However, both federal and state governments provide substantial financial support.
Infrastructure Backlog
The network has gradually declined over the decades, resulting in a continual increasing backlog estimated at $180 million. Without a substantial renewal and maintenance funding increase, the backlog will continue to grow. The current funding constraints are preventing proper or efficient maintenance and renewal.
Maintaining seal integrity is the highest priority action area. Damaged pavement from failed seals leads to higher-cost rehabilitation treatments. Maintaining a good quality surface is crucial to prevent accelerated pavement deterioration and premature road failure by renewing the surface several times over the life of the pavement.
Required Funding to Stop Conditions Deteriorating Further
The estimated annual funding shortfall for transport infrastructure renewal is $26.35 million. A further $8.5 million of additional maintenance funding is required each year to initiate preventative maintenance programs that will allow us to realise the value of our assets
Projected Asset Conditions Based on Current and Expected Future Funding
Road condition modelling suggests that if we continue, our roads will have deteriorated by an estimated $158 million in the next ten years. This will equate to a 25% relative condition reduction and almost doubling the backlog that is currently estimated at $180 million, totalling $338 million within the next ten years
Options to Revert to Satisfactory Standard
Council is not obligated to choose the lowest life cycle costs when setting the level of service. We could accept a level of service lower than this like we currently are. However, this is not recommended over the medium to long term as the future burden on the community will only increase. This would also pass our debt for assets we’ve consumed to our children and future generations. Section 8A - 2c of the Local Government Act 1993 requires councils to ‘consider the long term and cumulative effects of actions on future generations
MidCoast Roads Strategy 10
Priority should be given to initiatives like targeting particularly bad areas with heavy patching ahead of an expanded resealing program. Crack sealing table drain cleaning and shoulder grading are other initial priority activities to improve the resistance of existing roads.
Increasing rates to generate more income to fund renewals is the most realistic option. However, there needs to be a trade-off against the potential this has to exacerbate existing levels of socioeconomic disadvantage in the community. Improvements to operations and management will increase efficiency, however, the scale of the task vastly outweighs what can be achieved through this approach. Increasing cyclic renewals will provide a more pro-active approach and mitigate further deterioration.
Our Strategic Risks
• We are heavily reliant on external funding from state and federal sources
• Cost increases for resources and materials continue to outstrip inflation and rate-pegging
• Population Growth and associated increases in our asset base further exacerbate the challenges ahead
• Community expectations are growing in relation to traffic, safety and comfort
• All local road networks have pre-existing legacy issues where roads and bridges were built to past standards and/or budget constraints and now do not meet current needs.
• Natural Disasters & Climate Risks threaten parts of the road network, requiring immediate and future mitigation action
• Skills and capacity across the Local Government sector are below that required to sustain services over the short to medium-term
Our Recommendations
Following the investigation and development of this strategy, the following recommendations have been made to continue the process of improving and developing greater maturity in the systems, processes and actions that guide our approach to managing Transport Assets.
Asset Reconditioning & Preventative Maintenance Actions
1.1 Implement an expanded heavy patching program in conjunction with an increased resealing program
1.2 Develop and implement a guardrail renewal and safety fencing compliance upgrade program
1.3 Implement an expanded resealing program
1.4 Develop and implement a crack sealing program as part of increased planned maintenance
1.5 Develop and implement a Bus Shelter renovation and replacement program
1.6 Develop and adopt performance standards for inspections, defect intervention levels and maintenance response times as part of the extension on existing service levels, together with additional detail added to the quarterly operations report
1.7 Develop and implement a cutting widening program to improve road alignments for safety and to generate material for embankment widening and gravel road resheeting
1.8 Develop and implement a footpath replacement program
1.9 Investigate the opportunity to expand the quality, safety and environmental management systems used for work on state roads (R2 Prequalification) to all work undertaken across the network (regional and local roads).
1.10 Develop and implement a program to improve and replace guideposts and linemarking on roads to aid delineation
1.11 Develop and implement a signage replacement program
1.12 Develop and implement a culvert replacement/rehabilitation program
MidCoast Roads Strategy 11
Asset Management Improvement Actions
2.1 Undertake an automated footpath condition assessment and defect assessment to inform a future repair and renewal program
2.2 Revise the Kerb & Gutter condition and implement an annual renewal program
2.3 Consider road program management at the sub or part-segment level and how this can be accommodated within current asset and accounting frameworks.
2.4 Review current trends in Higher Mass Limit Vehicles and Performance Based Standards with respect to our design and construction specifications and existing road network, recommending changes and a program of works to provide long-term community benefits
2.5 Compare and contrast the treatment unit rates used for the ARRB Condition Monitoring and the AEC Financial Sustainability Review and validate them against actual rates delivered by MidCoast Council.
2.6 Conduct a performance audit on representative samples of works completed by both Council and developers over the last 20 years and recommend changes to the design and construction specifications to improve asset performance and optimise community value.
2.7 Investigate existing unsealed roads to determine those that would be cheaper over their lifecycle to be sealed and develop a prioritised program with estimates for future funding considerations
2.8 Develop data on pavement thickness and material quality for sealed roads and remaining gravel depth for unsealed roads to inform future decision-making and strategies around renewal.
2.9 Compile the observations and impacts from recent natural disasters into lessons learnt and improvement opportunities to incorporate into future designs
2.10 Review the current maintenance activities to ensure that renewals or rehabilitation work is being properly capitalised
2.11 Complete a traffic study into current and future traffic along collector and distributor roads to determine current deficiencies and future needs with recommendations to address these
2.12 Increase the number of technical staff trained in road safety audits and use them to work with asset inspectors recording roadside hazards
Growth, Climate Change & Infrastructure
Resilience Recommendations
3.1 Undertake asset criticality assessment to identify the relative levels of importance for transport network assets. Consult with critical infrastructure providers, Local Emergency Management Committee and Zone Bushfire Management Committee
3.2 Undertake a network resilience study and develop an asset improvement plan that reflects what was learnt from recent experiences with a greater focus on keeping critical routes accessible during and immediately after events.
3.3 Undertake a climate change adaptation study to identify the infrastructure at risk, options to mitigate the risk and costs. Finalise with a Climate Change Adaptation Strategy
3.4 Conduct a network wide assessment of Road Clear Zones and compile a list of prioritised works to address high-risk deficiencies
3.5 Expand roadside vegetation program to improve access and resilience of infrastructure during emergencies
3.6 Develop a shoulder/embankment widening program as an alternative to disposal of spoil from road work sites
3.7 Complete a strategic review of future growth needs in relation to transport infrastructure and prepare an overall MCC Transport Infrastructure Growth Plan to service future development. This will incorporate the previous work done for historical DAs and rezonings into a single current transport growth strategy, ensuring the infrastructure required by new development and growth is proportionally funded from S711 charges
3.8 Investigate the extent, generation and magnitude of Scope 3 emissions generated from operation, maintenance of the public road network
MidCoast Roads Strategy 12
3.9 Revise the project delivery framework to incorporate an assessment of Climate Change and Greenhouse Gas Emissions in the planning and execution phases, capturing and reporting any identified benefits.
3.10 Investigate actions to encourage the expansion of EV charging facilities in the road reserve through appropriate lease arrangements or Council ownership that is beneficial to the community and assists in the reduction of greenhouse gas emissions
Advocacy Plan Recommendations
4.1 Advocate for a change to the funding and management arrangements between local, state and federal governments.
4.2 Advocate for greater focus on preventative road safety actions rather than historical accident statistics
4.3 Advocate for the Block Grant and Roads to Recovery programs to be indexed by the road construction cost index (or at least CPI or the NSW rate peg) each year.
4.4 Continue membership and support of the NSW Roads & Transport Directorate and in particular, the initiatives in the annual NSW Local Roads Congress Communique
4.5 Support NSW Roads & Transport Directorate’s Asset AI project through early adopter involvement in Beta trials.
4.6 Revise the Community Strategic Plan, Delivery Program and Operating Plan to be more wholistic of the challenges faced by Council and the community in relation to the transport network
4.7 Develop an annual budgeting and reporting tool that demonstrates the application of funding from different sources to particular projects
Risk Management Action Plan
5.1 Roll up the existing strategic risk registers for the Transport & Engineering function and finalise a risk management plan at the Transport & Engineering functional level.
5.2 Undertake training and capacity uplift in the implementation of Best Practice defect and risk management.
5.3 Audit and improve existing systems and practices to provide protections under the Civil Liability Act
5.4 Develop and implement service levels and reporting
5.5 Undertake a lateral branch clearing program for collector and arterial roads to reduce ongoing corridor risk to staff and community during storm and emergency events.
5.6 Implement a program to identify and rectify non-conforming pram ramps and other priority remedial works required by the Disability Discrimination Act
5.7 Benchmark the Strategic Risk Register and Risk Management Plan for Transport & Engineering against the 2023 IPWEA Road Management Assessment (pg73 IPWEA 2023)
5.8 Benchmark the Strategic Risk Register and Risk Management Plan for Transport & Engineering against the 2023 IPWEA Timber Bridge Management Assessment (pg51 IPWEA 2023)
5.9 Prepare a network-wide Road Safety Plan using the Roads & Transport Directorate’s guide
5.10 Review Council’s policy statements for administration, management and maintenance of the transport network.
5.11 Undertake an audit of existing disability car parking spaces against current standards and identify the remedial works necessary to comply, or other options for more appropriate disabled car parking provisions.
5.12 Systematically revise parking and pedestrian access provisions in high activity CBD zones to plan for future improvements, including streetscaping upgrades
5.13 Undertake an AusRAP assessment of regional, collector and distributor roads
5.14 Prepare a road renewal and maintenance plan for regional and significant local roads to prioritise resources for resealing and maintenance of high-speed, high-traffic and high-
MidCoast Roads Strategy 13
risk roads to address the relatively high proportion of single vehicle accidents on these roads
MidCoast Roads Strategy 14
INTRODUCTION AND BACKGROUND
Introduction & Background
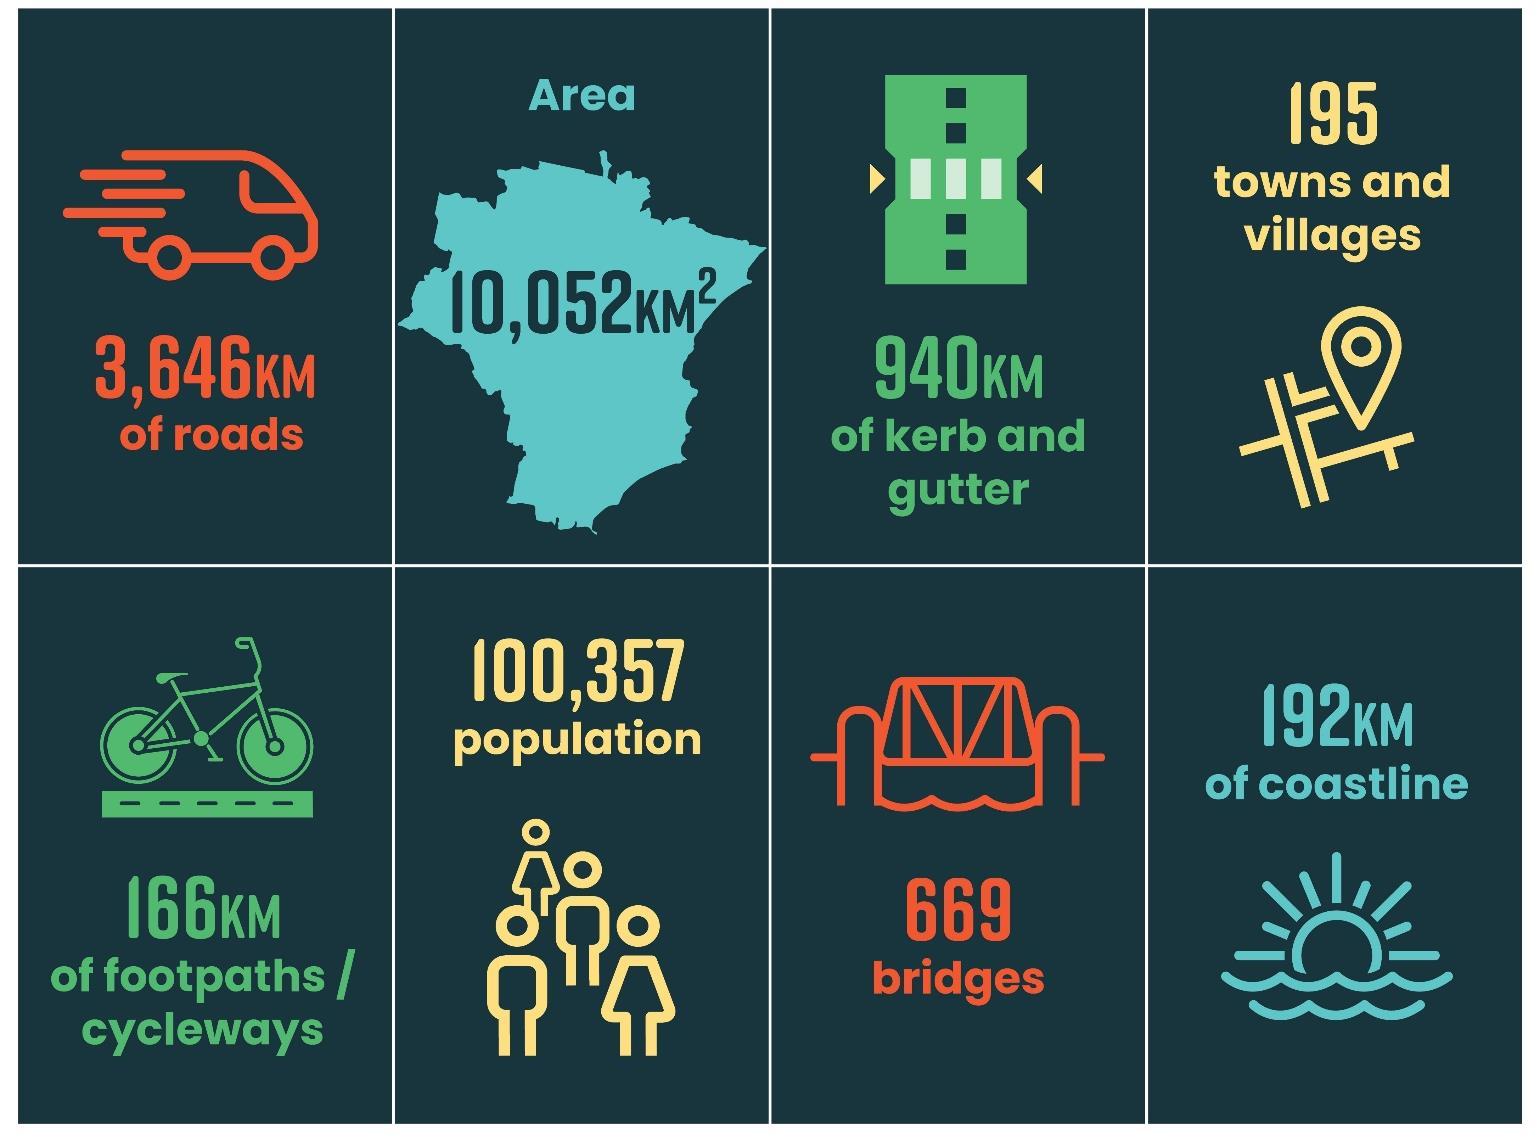
Home to around 95,000 people spread across 195 towns and villages, the MidCoast region offers our diverse community a wide range of lifestyle opportunities.
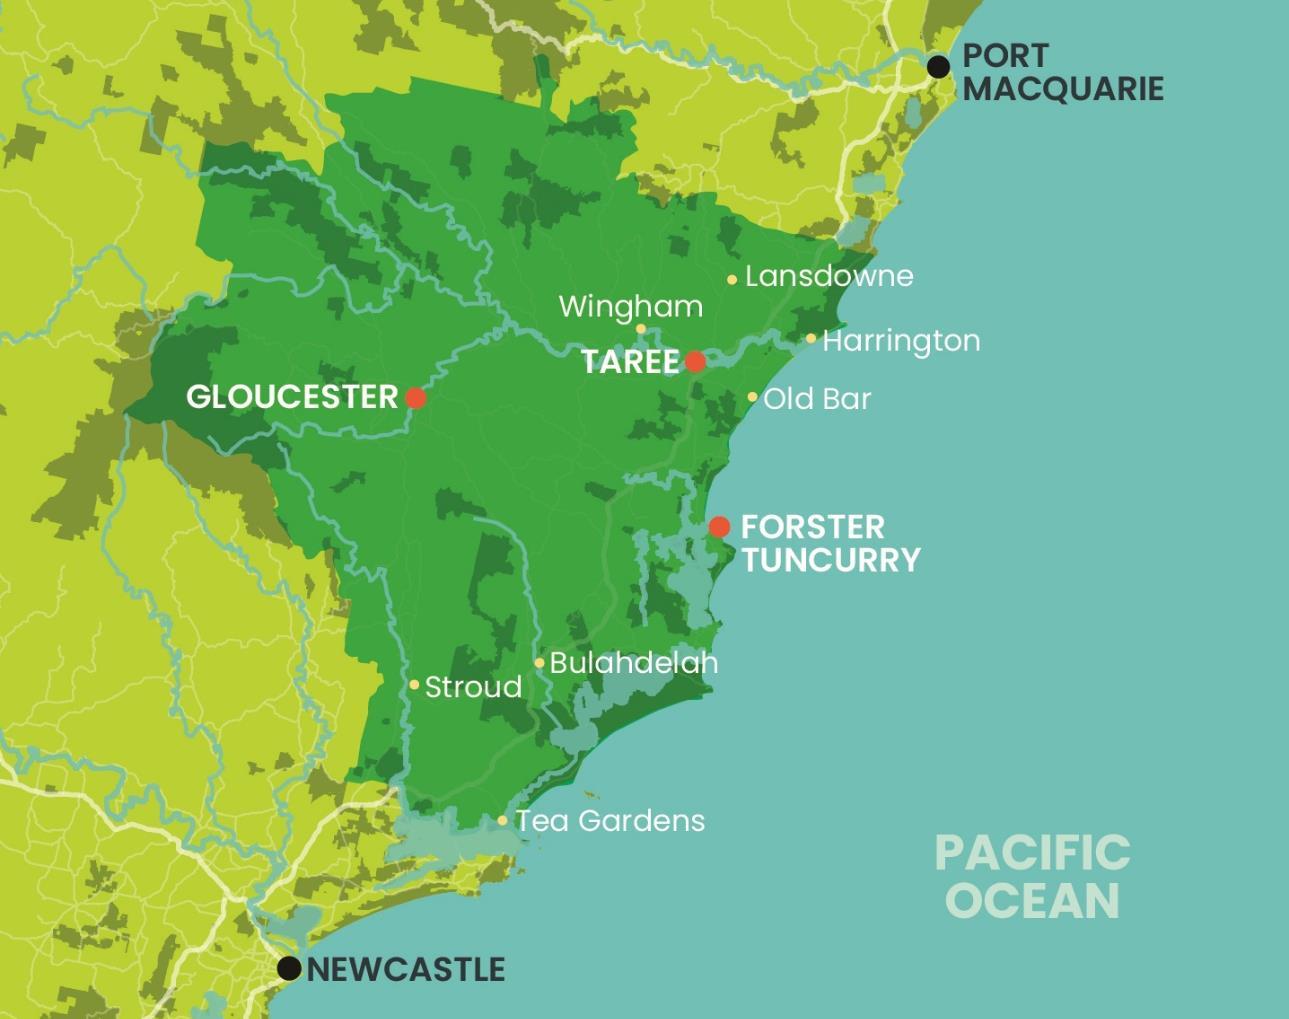
Located on the mid-north coast of NSW, the geographical area covers more than 10,000km2 and extends from the coastline west to the escarpment of the Great Dividing Range. It encompasses the major centres of Taree and Forster/Tuncurry and their surrounds, as well as the regional hubs of Wingham, Gloucester and Tea Gardens
The region is well known for its natural beauty and is a key holiday destination that attracts many tourists and visitors throughout the seasons. The area spans from sparkling beaches on the coast to mountains in the hinterland, with expansive national parks and green spaces in between.
Our road network extends for over 3,600km, approximately the same distance as Taree to Perth. It is the second longest public road network of any council in NSW. It equates to around 1.8% of the NSW roads, servicing only 1.2% of the state’s population.
The split between sealed and unsealed roads is almost 50/50, with the total length of sealed roads slightly more than that of unsealed roads. Regional Roads account for 10% of the road network length, with the balance classified as Local Roads
The network also includes 669 bridges, 166km of footpaths/cycleways and 940km of kerb & gutter.
The total asset value is $2.8bn, with annual depreciation estimated at $30.8m as at 30 June 2023.
MidCoast Roads Strategy 16
Figure 1 - The MidCoast Local Government Area
MidCoast Roads Strategy 17
Context
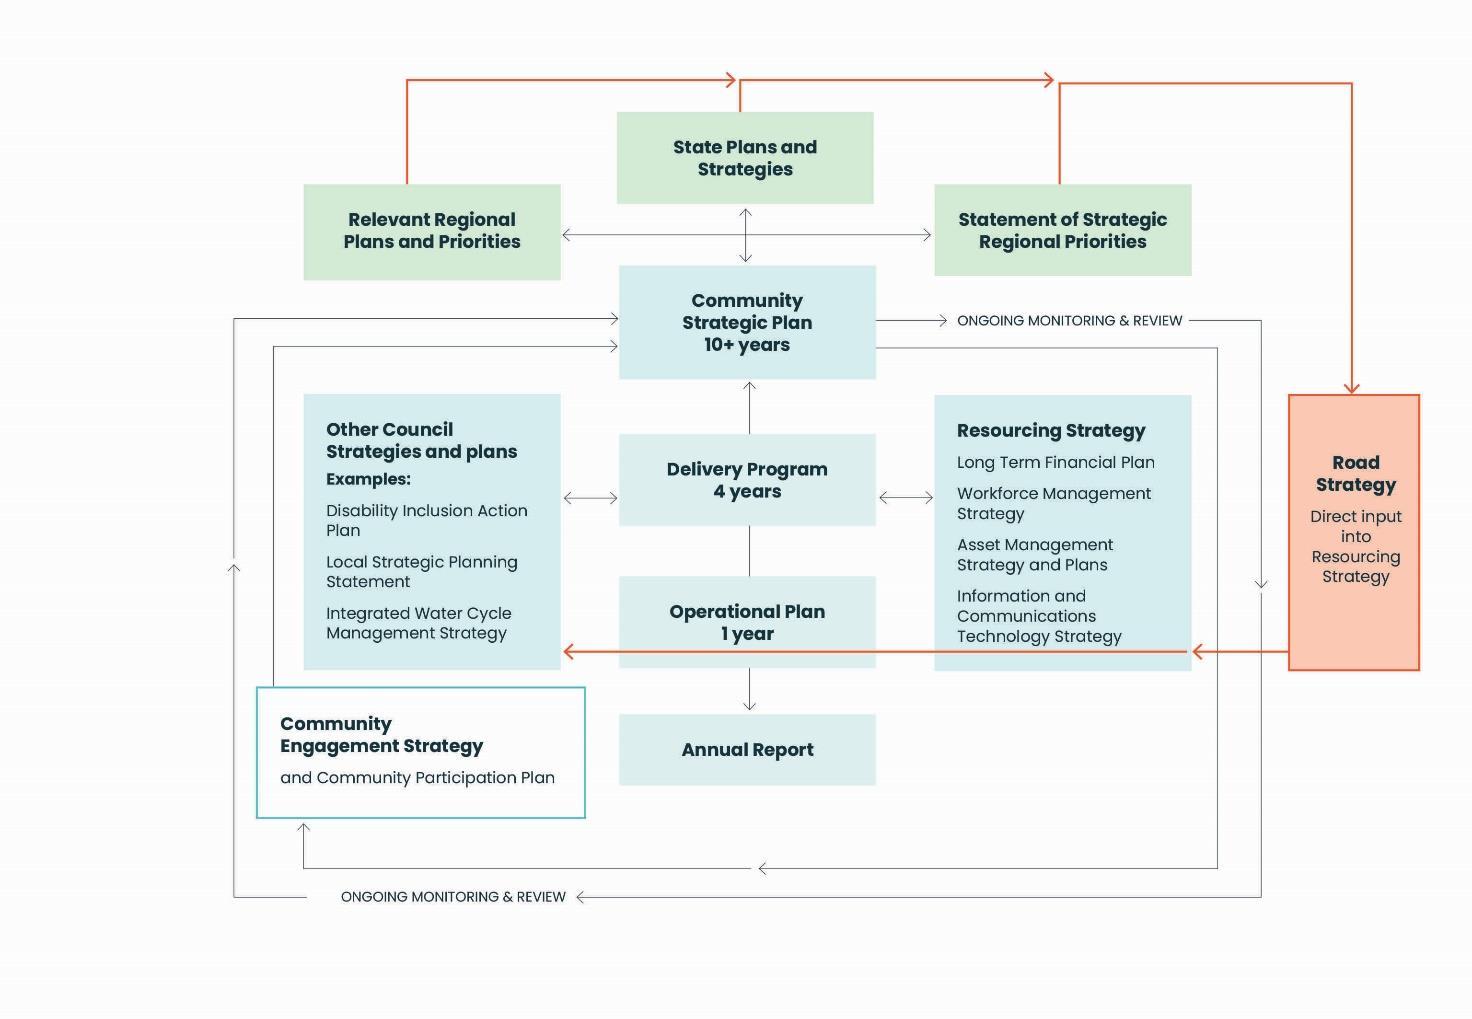
This strategy is one of many documents that make up MidCoast Council’s Integrated Planning and Reporting Framework as described in Figure 2 below
The Road Strategy informs the resourcing strategy, identifying the actions necessary to prevent further deterioration of the road network and the options to revert it to satisfactory condition over time. It establishes future goals and targets as well as the opportunities to maximise the value from current funding by improving how we are managing the road network. It also identifies links to other strategic work that is being undertaken for MidCoast, the broader region or the state. It draws on relevant State and Regional Plans to influence MidCoast strategies.
The Road Strategy informs the level of ongoing funding required in the Long-Term Financial Plan (LTFP) and specific actions in the Asset Management Strategy and Asset Management Plans. It will also become one of the key strategies that informs the development of the Delivery Program.
MidCoast Roads Strategy 18
Figure 2 Road Strategy Link to the Integrated Planning and Reporting Framework
Linkage To Other Strategies & Community Outcomes
The following section details some of the broader strategic links that exist between this Strategy and other strategic initiatives both within and external to MidCoast Council.
2026 Road Safety Action Plan - TfNSW
The condition of our road network has a direct influence on the perception that our community has of safety of our network. Almost two thirds of fatal crashes on NSW roads happen in regional or country NSW where a third of the population lives. This means that residents in our area are more than 4 times more likely to be impacted by an accident on our road network resulting in a death than those in metropolitan areas.
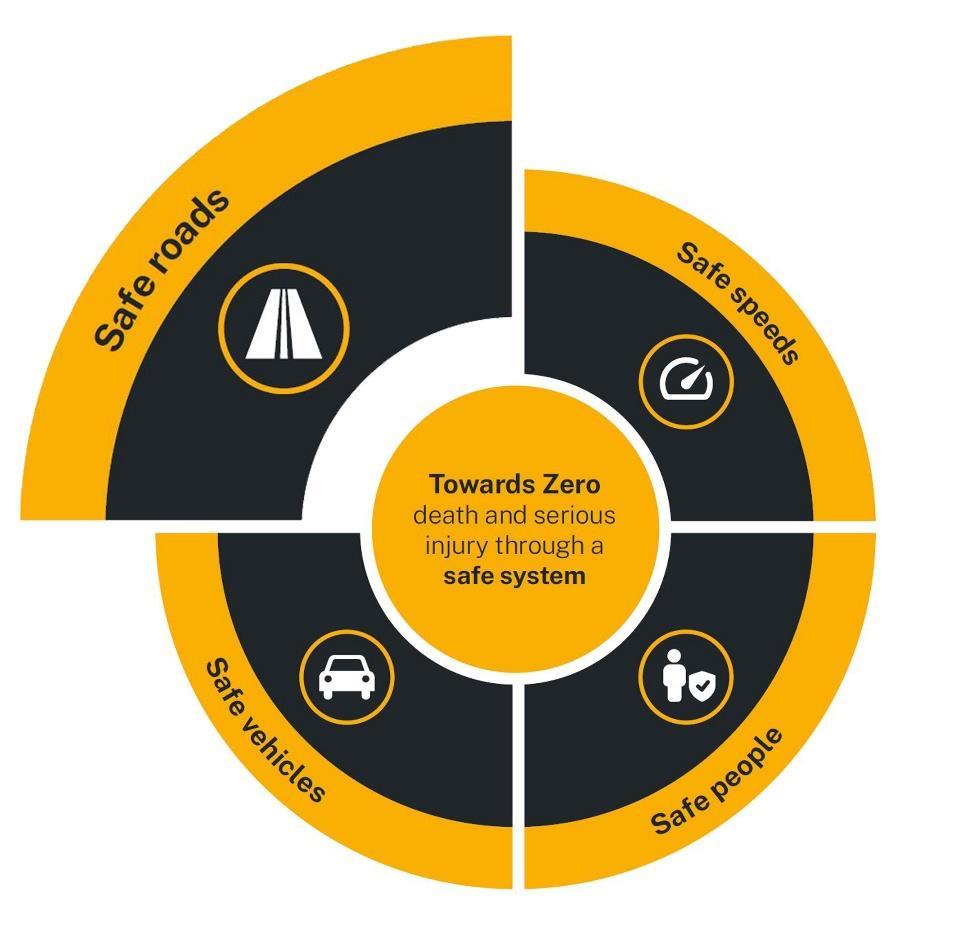
The Road Strategy links to the NSW Government’s 2026 Road Safety Action Plan – Towards zero trauma on NSW roads primarily through the Safe Roads system element by:
• Setting short and long-term targets so the condition of our road network will not deteriorate.
• Provide options to consider for improvement in the condition of our roads over time.
• Setting the goal of integrating road safety into all improvement works and new development
• Increasing the use of delineation and line marking to improve road safety and the effectiveness of common safety measures in modern vehicles.
• Improve signage to eliminate the proliferation of old and outdated signage that is no longer effective and provide new modern signage in appropriate strategic locations
• Encourage further improvements to streetscaping in the CBD areas of our towns and villages to reduce vehicle speeds and safely cater for high pedestrian activity.
• Support and advocate for a proactive model to improve road safety rather than the current reactive approach.
MidCoast Roads Strategy 19
Figure 3 - 2026 Road Safety Plan - Safe Systems Approach (TfNSW)
Future Transport Strategy – TfNSW
The Road Strategy links to the NSW Future Transport Strategy through local implementation of the Safe System approach (C4 - Our Transport networks are safe) and particularly by halting the gradual decline in the condition of the local road network, resulting in safer roads. It also works to optimise existing infrastructure and address financial sustainability (E4 The transport system is financially sustainable).
National Roads Safety Strategy 2021-2030
Our Road Strategy supports the Safer Roads initiatives contained in the National Road Safety Strategy 2021-2030.
MidCoast Financial Sustainability Strategy
The Road Strategy is both complimentary to and informed by the Financial Sustainability Strategy. There is an element of consistency between the objectives of both strategies. This means that the information presented in the strategies may not be the same, however, the meaning and conclusions demonstrate consistency and alignment.
Regional Economic Development Strategy
The MidCoast Regional Economic Development Strategy (REDS) is a platform for our community and businesses to drive economic growth. A transport system that ensures connections are efficient and easily accessible is key for delivering strategic opportunities in the areas of growth, resilience and livability. The Road Strategy is fundamental to achieving the REDS objectives.
MidCoast 2032: Shared Vision, Shared Responsibility (Community Strategic Plan 2022-2032)
The current Community Strategic Plan (CSP) is supported by the roads strategy primarily through the achievement of Community Outcome #3 – A Thriving & Strong Economy Secondary links exist to Community Outcome #1 – A Resilient and Socially Connected Community and Community Outcome #4 – Strong Leadership and Good Governance
This is principally through providing a transport network that allows access to a wide range of services and activities that contribute to community well-being and economic wealth
Primary Strategies
• 3.3.1 Plan, provide and advocate for safe and efficient regional transport networks.
• 3.3.2 Design, construct and maintain safe and efficient local transport and mobility networks
Secondary Strategies
• 1.2.1 Provide accessible and safe local community spaces and facilities (multiple modes of transport enabling access)
• 1.2.2 Deliver services and facilities to support the ageing population and people with disabilities (Pedestrian Access & Mobility Plan & implementation of supporting actions)
• 4.2.3 Council manages our services and infrastructure in a sustainable manner to balance community need and expectations
MidCoast Roads Strategy 20
The Mayoral Minute
At the 25 May 2022 Ordinary Meeting of MidCoast Council, the elected body considered a Mayoral Minute calling for a strategic plan to be developed for our road network.
The Mayoral Minute noted the gradual decline of the network over decades, resulting in a continually increasing level of backlog. It recognised that unless something was to address the decline, the cumulative impact will create a significant burden on future generations. It also acknowledged that there is no fast or easy fix and may take decades to remediate the damage that has already been done.
After consideration of the matter, the unanimous resolution of the Council was:
That Council notes the Mayor has called on staff to:
1. Prepare a Transport Asset Strategic Plan that:
a. Describes the current condition of MidCoast transport assets, including roads,
b. Explains the funding since merger to reduce the infrastructure backlog,
c. Identifies the current transport assets (including roads) infrastructure backlog,
d. Projects the changes in asset conditions over time based on the current and projected levels of transport assets funding,
e. Breaks these amounts into operational and capital costs for each of the various categories of roads, separated by funding source,
f. Proposes options for reverting the roads to a satisfactory standard,
g. Proposes appropriate ongoing road maintenance and renewal budgets to ensure, Council’s roads assets do not continue to deteriorate faster than they are renewed, and
h. Identifies possible funding options and timelines for this work.
2. Provide this Report to a Council meeting in December 2022 with an interim report on progress in September 2022, noting the extensive work that will be required to prepare the report
3. Amend the current budget and expenditure reporting format and timing to enable Council to:
a. approve clearly defined annual budgets for transport assets (including roads), broken down into maintenance, renewal and new capital projects,
b. enable quarterly monitoring of expenditure against those budgets, and c. provide annual reports of the progress in reducing the transport assets backlog.
4. Commence this budgeting and reporting schedule by December 2022.
Progress was formally reported to the Ordinary Council Meetings on 28 September and 14 December 2022, as well as 28 June and 25 October 2023. Regular updates were provided in the weekly Councillor bulletins, as well as workshop presentations on 7 December 2022 and 1 March, 6 September, 18 October and 8 November 2023
MidCoast Roads Strategy 21
Brief History of Roads in NSW and the MidCoast
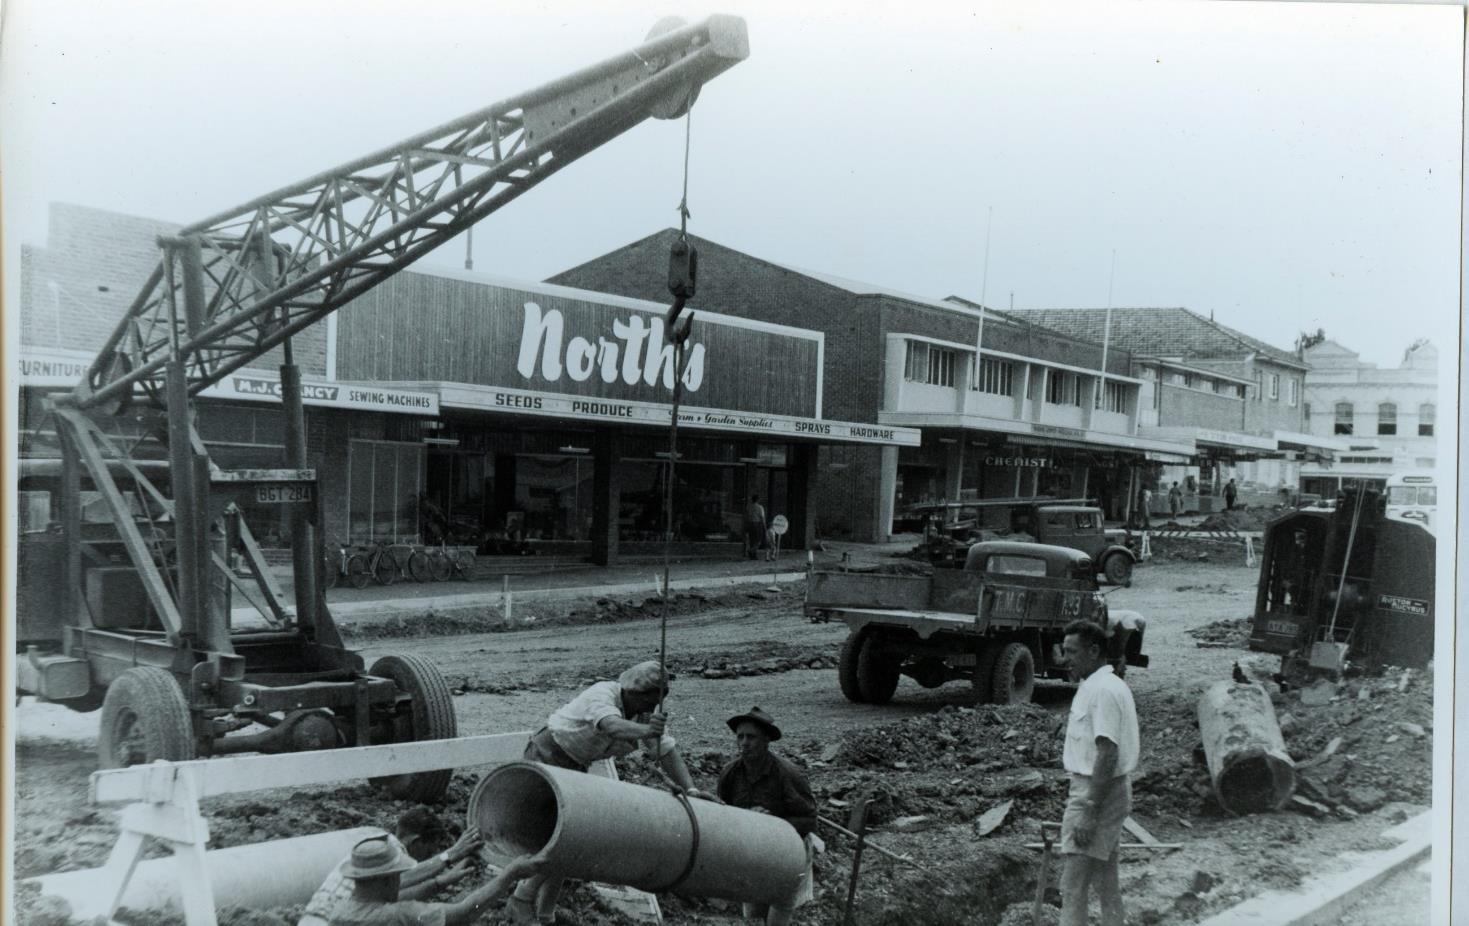
In NSW, roads were rarely laid out ahead of development. From colonisation, the provision of roads came after settlement, mainly improving tracks that had developed along Aboriginal routes or emerged from travellers seeking the easiest route to their destination.
Governor Lachlan Macquarie constructed the first main roads in New South Wales in the early 1800s. They were financed mainly by tolls. Even in the early days, NSW roads were recognised as poorly funded and most were in a state unsuitable for the volume and types of traffic they carried.
In 1840, the colonial government passed responsibility for the upkeep of local roads to local landholders. Road trusts were constituted to maintain roads. They could levy a rate on local landowners and fix tolls to pay for road works. This was the first attempt at local government in NSW.
In 1858, the Municipalities Act made the creation of local government authorities possible. While these were intended to look after local roads in their areas, the Act didn't provide entities large enough to collect adequate rate revenues to do this and undertake the wide range of functions and services expected by communities. As a result, local roads suffered.
Bridges built by the Public Works Department from the 1850s onwards were mainly erected using local hardwoods due to their strength and the high cost of imported iron or steel. Since the best hardwoods often grew on the coast where the problems of crossing rivers were most significant, using locally grown timbers allowed considerable economies in bridge construction.
On the Mid North Coast, the broken topography of the coast with numerous rivers ensured that roads took second place to coastal shipping for many years. This continued until the construction of the Main North Railway. Completing the Hawkesbury River Rail Bridge in 1889 opened new opportunities to move heavy goods by rail, eventually surpassing shipping. Road networks continued to focus primarily on serving shipping or railway nodes rather than long-distance travel.
MidCoast Roads Strategy 22
In 1886, Public Works Department Engineer, John A McDonald improved the existing truss design used on bridges since the 1860s. Percy Allan adapted existing British and American bridge design methods to Australian conditions. By 1893, he had developed a new truss design which was 20 per cent cheaper whilst carrying 50 per cent higher loads. Bridges constructed using the McDonald or the Allan truss improved hazardous river crossings, allowing higher and longer bridges to be built, reducing the significant delays experienced at some river crossings. The remaining examples of these considerable structures are heritage-listed.
In 1906, road responsibility was devolved to councils under the new Local Government Act. The Public Works Department remained responsible for road works in areas developed for settlement, such as those in the Manning Valley in the 1910s.
When motor vehicles came into general use following World War 1, a lot of the main road north from Newcastle consisted of earth formation, creating a dust nuisance in dry weather and quagmires in wet weather. The construction of the North Coast Railway between 1911 and 1923 slowed the early development of the Pacific Highway.
With roads under the care of councils, reports of neglect, particularly along the state highways, were common. Legislation seeking to establish a Main Roads department with ownership of the state highways was narrowly defeated in the parliament year after year until the end of World War 1. The success of several Commonwealth-controlled road projects after the war and lobbying by the NRMA and other automobile associations, finally resulted in the formation of a Main Roads Board on 10 November 1924.
An immediate observation made by the new Board was that many local councils did not have the equipment or level of skill to maintain roads properly. Around 1927, the early forerunner to the Financial Assistance Grant began establishing the concept of road classifications.
On 7 August 1928, the newly formed Main Roads Board proclaimed the main North Coast Road, running from Hexham through Gloucester, Taree, Port Macquarie and further north to Tweed Heads, State Highway No. 10 and named it 'North Coast Highway'. It was renamed the 'Pacific Highway' on 29 May 1931.
During the Great Depression, road funding was substantially reduced as fines, registrations and the like were directed to other departments to cover their costs. Under these circumstances, road building and reconstruction virtually came to a halt. Despite this, some significant bridges were constructed, including ones across the Manning River at Taree (1938), the Dawson River at Taree (1933) and the Lansdowne River at Coopernook (1938).
Bridge building slowed after the Depression, firstly due to war and then the post-war materials and labour shortages. Steel was still the material of choice for larger bridges and several major steel truss bridges were opened – including those across the Karuah River at Karuah (1957) and the Wallamba River at Nabiac (1959) before the Department of Main Roads stopped making steel bridges in 1966.
On 22 March 1932, main roads, railways and tramways were transferred to the NSW Transport Commission. This new system only lasted a couple of months. The Premier at the time was removed from office by the Governor due to his efforts to redirect federal government road funding to general revenue. By the end of that same year, the Department of Main Roads (or DMR) was established with Hugh Newell appointed Commissioner. Mr Newell had previously refused to comply with the former Premier's directive to transfer all cash from Main Roads to Treasury's consolidated revenue.
The new Department almost instantly began a mission to improve road safety and congestion. In 1933, the first traffic signals were commissioned. In 1938, centreline marking became standard for all sealed main roads.
MidCoast Roads Strategy 23
From 1933 to 1939, roadwork provided unemployment relief during the Depression. During this time, the focus was on projects that needed muscle power (rather than machinery), including the Pacific Highway and Main Road 110 near Bulahdelah.
In March 1934, a developmental road scheme commenced for the Upper Manning River to provide an access road and enable development The scheme was part of a long-range scheme to link the coast with Walcha, Scone and Tamworth. A smaller scheme was also instituted at Gloucester, allowing the development of dairy farms.
Timber still had to be used to construct many bridges on local roads in the 1950s due to steel shortages. Modern traffic resulted in the loosening of timber planking on older bridges. Most timber bridges had the decking laid transversely across multiple girders along the bridge. Where the decking was placed longitudinally, not only did it last longer, the timbers didn't loosen as quickly. This is why many older bridges now have longitudinal planking (or running planks) over older transverse decking.
On 10 August 1952, the section of highway between 12 Mile Creek and Purfleet (4km south of Taree), now known as The Bucketts Way, was decommissioned. In its place, a new route was declared, passing through Karuah, Bulahdelah, Wootton, Coolongolook and Nabiac. This improved topographical conditions for a major road and served areas distant from the railway. Significant construction followed this to bring the new route of the Pacific Highway up to the required standard.
Due to the poor quality of existing roads between 12 Mile Creek and Bulahdelah and the need to bridge the Karuah River, the Department decided to seal the road between Booral and Bulahdelah for use as an interim route for highway traffic until construction of the new route could be completed. The section between Bulahdelah and Wang Wauk, through O'Sullivan's Gap, was sealed by 1955. Reconstruction and sealing as far as Purfleet was completed in April 1958. The new Pacific Highway was officially opened on 24 December 1963 in time for Christmas holiday traffic.
It was during the 1960s that the most significant advancements occurred on NSW roads. The length of proposed expressways increased and roads were winning the transport battle against railways and tramways. On 20 May 1960, a redesigned, four-lane section of the Pacific Highway near Mt White, south of Gosford, became the first motorway proclaimed in NSW.
Reports from the 1970s regarded this as the high point in creating a modern road system in NSW. Significant progress had been made on expressways and financial support for the roads program was greater than ever. This slowed towards the latter part of the decade due to conflict with other urban planning ideologies and priorities like environmental protection and pollution control. In 1977, significant changes were made to the transport strategy by the Wran government, cancelling major projects, upgrades and deviations.
Development of NSW roads stagnated into the early 1980s following a reduction in commonwealth public works funds. From August 1981, the federal government decreed that all construction works on national highways should be tendered out to private contractors. This led to the slow conversion of the DMR to the Roads & Traffic Authority (RTA).
In September 1983, road building was reignited with significant investment from the NSW State and Commonwealth Governments, partly funded by a motor fuel and diesel excise surcharge. By 1988, the transition to the RTA was complete. Funding priorities changed towards economic rather than social needs, which means that expenditure was directed towards heavily trafficked routes at the expense of rural and regional areas.
In July 1989, ongoing road improvements were 'user-pays' funded through the establishment of the 3X3 Accelerated Road Improvement Program. The government collected 3 cents from every litre of petrol sold, allowing projects to be advanced by up to 2 years, with bitumen sealing, road rehabilitation and bridge replacement given priority. Significant public support saw the program continue until 1992.
MidCoast Roads Strategy 24
In 1991, the Greiner government identified the North Coast corridor between Hexham and the Queensland Border as one of the fastest-growing areas in NSW. The Pacific Highway was no longer just a through route to Brisbane; it was now key to the growth of an economic region 700km long and 100km wide.
The fragmented economy and high unemployment in this region increased the road's importance, leading to the current Pacific Highway Upgrade program. When the Coffs Harbour Bypass is complete, the dual carriageway will extend from Raymond Terrace to the NSW-QLD Border nearly more than a decade after its promise.
The most significant change of the 1990s was that governments finally acknowledged that continual road system expansion was neither economically viable nor environmentally sustainable without considerable change. Despite lots of 'jockeying' by successive governments, the challenges faced by local governments still largely exist today.
Government funding, or government policy shifts and the catalyst effects of significant milestone land developments, has resulted in sporadic expansion of the transport network. This meant we had relatively large changes in the asset base over short periods. Post World War 2, various schemes saw the rapid expansion of the asset portfolio without increasing the capacity to maintain the new infrastructure The development of asset management through the second half of the 20th century signalled attempts by governments to deal with the growing asset liability
Over time, the demands on the network from road transport have increased dramatically, both in volume and in the size and weight of modern trucks now using and consuming our road network.
Ironically, one of the significant drivers behind the merger of the three former councils and the creation of MidCoast Council in 2016 was the inability to manage infrastructure maintenance and renewals sustainably. The expansive MidCoast road network is around 80% of the burden. This problem started at the time of European colonisation and has regularly plagued all levels of government since then. The intention behind this Strategy is to be a catalyst for change by mapping a path that finally overcomes this challenge for the future benefit of the MidCoast area.
Since 2016, the local road network within the MidCoast LGA has grown by a further 13km or approximately 0.4% Along with rising costs continually outstripping rate pegging, this growth has added to the extent of the road network MidCoast Council needs to fund and manage.
Now, there is a need for a greater focus on maintaining, renewing and progressively improving our existing road infrastructure to meet current and future needs, and to meet our obligation to provide intergenerational equity. The intention behind this Strategy is to be a catalyst for change by mapping a path that finally overcomes these challenges for the future benefit of the MidCoast Area.
MidCoast Roads Strategy 25
Social & Economic Benefits of Good Roads
In 2021, Roads Australia Commissioned BIS Oxford Economics to update previous studies into the value of Australia’s roads. They concluded that roads collectively add $236bn across the nation to Gross Domestic Product (GDP). They support 1.4M jobs, and for every $1M invested in roads, the economic output increases by $2.9M, while $1.3M is added to the GDP value.
Considering MidCoast has 50% more roads per person on average than the rest of NSW, the economic benefits from investing in roads are likely proportionally higher than the national average. Every $1M invested in roads could increase economic output to $4.35M and nearly $2M in GDP across the MidCoast region.
Maintaining and renewing our road network is not just about the engineering associated with the lowest lifecycle cost management Our road network:
• Forms the veins and arteries that connect personal, social, economic, environmental and governance infrastructure to form modern communities. A good road network positively enhances the benefits derived from everything else.
• Enables trade and commerce, providing a platform for business innovation and the backbone for our economy required for everyday life
• Improves the competitiveness of our region and promotes recreation and tourism opportunities.
• Provides access or integration to other modes of transport (ie railway)
• Is needed to keep people connected and safe during natural disasters and other emergencies.
In summary, roads are not only vital for access, but they are also essential for the economic and social prosperity of our community, helping to build the quality of life we value and aspire to achieve
MidCoast Roads Strategy 26
Road Maintenance Funding Gap (“A
National Problem”)
Councils and other road managers across Australia consistently report growing maintenance costs and increasing backlogs. In addition, Australia’s road network faces rapid changes in freight patterns and vehicle size, technological disruptors, increasing frequency of natural disasters and an overall increase in demands from population growth. The total vehicle kilometres travelled was reported to have grown by 1.95% per annum between 1998 and 2018. The overall size of the network is also increasing with the expansion of existing roads and the construction of new ones.
There is very little to tie funding for road services to the actual use of roads, with most road authorities vying for a larger share of indirect tax revenue rather than self-generated revenue. This creates an even more significant challenge for maintenance, particularly where capital expenditure is funded and future maintenance requirements still need to be met.
The 2019 Australian Infrastructure Audit identifies an underspend on historical maintenance, short budgetary/funding cycles, a lack of data and incentives and inadequate reporting as contributing to maintenance backlogs. It also flagged the inconsistency of maintenance data, lack of service levels, difficulty determining them and the absence of metrics to assess maintenance, renewal, or rehabilitation levels.
Locally, MidCoast shares the same barriers as other road authorities across Australia regarding the systematic implementation of best-practice asset management for transport assets. The lack of industry-wide consistency or guidance needs to be addressed and is one of the challenges identified in the audit (#53, page 295).
MidCoast Roads Strategy 27
LEGISLATIVE AND TECHNICAL FRAMEWORKS
Legislative & Technical Frameworks
The legislative provisions for public roads make the transport infrastructure asset class unique when compared to other asset classes managed by Council. Council itself does not ‘own’ public roads like other real property.
Ownership of Roads & Liability
All councils in NSW are the default Road Authority for land designated as ‘public road’. Council has care, control and management of public roads to administer the Roads Act 1993. Division 1 of the Act addresses the general functions concerning public roads. In particular, Section 146 of the Act reads (emphasis added):
146. Nature of ownership of public roads
(1) Except as otherwise provided by this Act, the dedication of land as a public road
(a) does not impose any liability on the owner of the road that the owner would not have if the owner were merely a person having the care, control and management of the road, and
(b) does not affect the rights or liabilities of any person under any easement or under any Act or law, and
(c) does not affect any rights of any person with respect to minerals below the surface of the road, and
(d) does not constitute the owner of the road as an occupier of the land, and
(e) does not authorise the owner of the road to dispose of any interest (other than an easement or covenant) in the land, and
(f) does not prevent any lands that were previously considered to be adjoining lands for the purposes of the Land Acquisition (Just Terms Compensation) Act 1991 from continuing to be so considered.
Therefore, Council does not ‘own’ public roads like a person owns a house or a property. In the case of private land, the owner and/or the occupier can be liable for harm caused to others on that land. Public roads are effectively owned by the people of NSW, allowing anyone to travel along a public road for any purpose at any time. There is further legislation that regulates traffic, speed, heavy vehicles, etc. These regulations establish expectations for the use of public roads, allowing enforcement by various entities (including Council).
Each Council may determine the level of service provided for a public road and the standard to which it is constructed (i.e. when it is to be maintenance graded or whether it is sealed or unsealed). The expectation is that the level of service or standard of construction links to the Council’s financial capacity to be sustainable in the long term. Even though Council is the Road Authority for public roads, Council is not automatically obligated to adopt a particular level of service for a section of public road.
Until the late 1990s, road authorities were protected from liability under the concept of nonfeasance, otherwise known as the ‘Highway Rule’. Non-feasance meant that a road authority could
MidCoast Roads Strategy 29
not be liable for anything it didn’t do to address hazards on the road network. Liability only arose if something the road authority physically did was negligent.
This rule was overturned and replaced by an onus on road authorities to manage risks within resource and budget capability.
Under the Civil Liability Act (2002), road authorities have protections if they can demonstrate that they have minimised the risk to the public road network within the limits of the resources that are made available. Part 5 (sections 40 - 46) of the Act relates to the liability of public authorities such as Council (and other road authorities). Owing to the nature of ownership of roads and how they are used, it would not be practical to expect road authorities to protect users from all of the hazards that may give rise to risks.
Section 42 of the Act reads (emphasis added):
42. Principles concerning resources, responsibilities etc of public or other authorities
The following principles apply in determining whether a public or other authority has a duty of care or has breached a duty of care in proceedings for civil liability to which this Part applies
(a) the functions required to be exercised by the authority are limited by the financial and other resources that are reasonably available to the authority for the purpose of exercising those functions,
(b) the general allocation of those resources by the authority is not open to challenge,
(c) the functions required to be exercised by the authority are to be determined by reference to the broad range of its activities (and not merely by reference to the matter to which the proceedings relate),
(d) the authority may rely on evidence of its compliance with the general procedures and applicable standards for the exercise of its functions as evidence of the proper exercise of its functions in the matter to which the proceedings relate.
This clause places the onus on the road authority to demonstrate that it has met or exceeded the test for reasonableness It also means that decisions made to allocate resources or funding to or away from road maintenance or construction cannot be challenged. It provides a general defence with the burden of proof on the Council to demonstrate reasonableness.
MidCoast Roads Strategy 30
Section 45 excuses a road authority of liability if it was unaware of the hazard. It also defines that having actual knowledge of a risk does not automatically invoke a standard to which it should be treated. In contrast with Section 42, Section 45 requires the plaintiff to demonstrate that the authority knew the particular risk. If the plaintiff cannot demonstrate actual knowledge then there is no liability.
Section 45 reads (emphasis added)
45 Special non-feasance protection for roads authorities
(1) A roads authority is not liable in proceedings for civil liability to which this Part applies for harm arising from a failure of the authority to carry out road work, or to consider carrying out road work, unless at the time of the alleged failure the authority had actual knowledge of the particular risk the materialisation of which resulted in the harm.
(2) This section does not operate
(a) to create a duty of care in respect of a risk merely because a roads authority has actual knowledge of the risk, or
(b) to affect any standard of care that would otherwise be applicable in respect of a risk.
Therefore, councils may determine the standard to which a road is constructed or maintained. In doing so, a council is not automatically liable for any harm that results unless they can’t demonstrate that they have managed the risks according to the capacity they have to do so.
Hence, as a road authority, Council may set the standard for the construction or maintenance of any public road within the network and this standard should relate to the level of resources reasonably available. Just because Council is the road authority, doesn’t mean there is an obligation to take any specific action.
MidCoast Roads Strategy 31
Road Classifications and Funding Arrangements
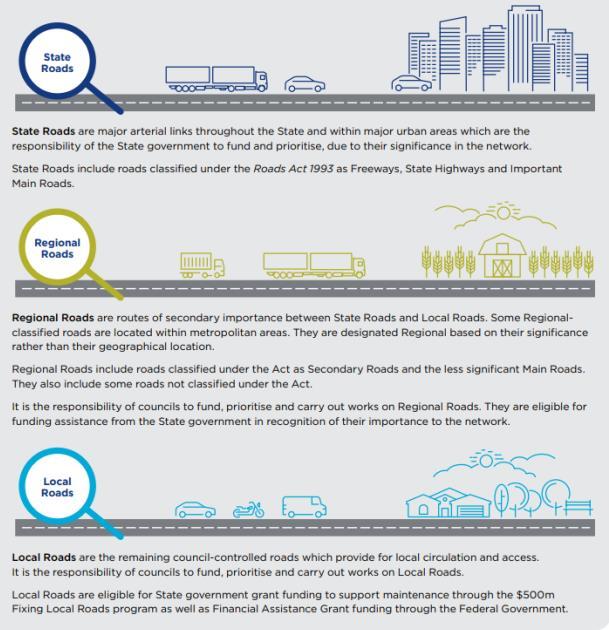
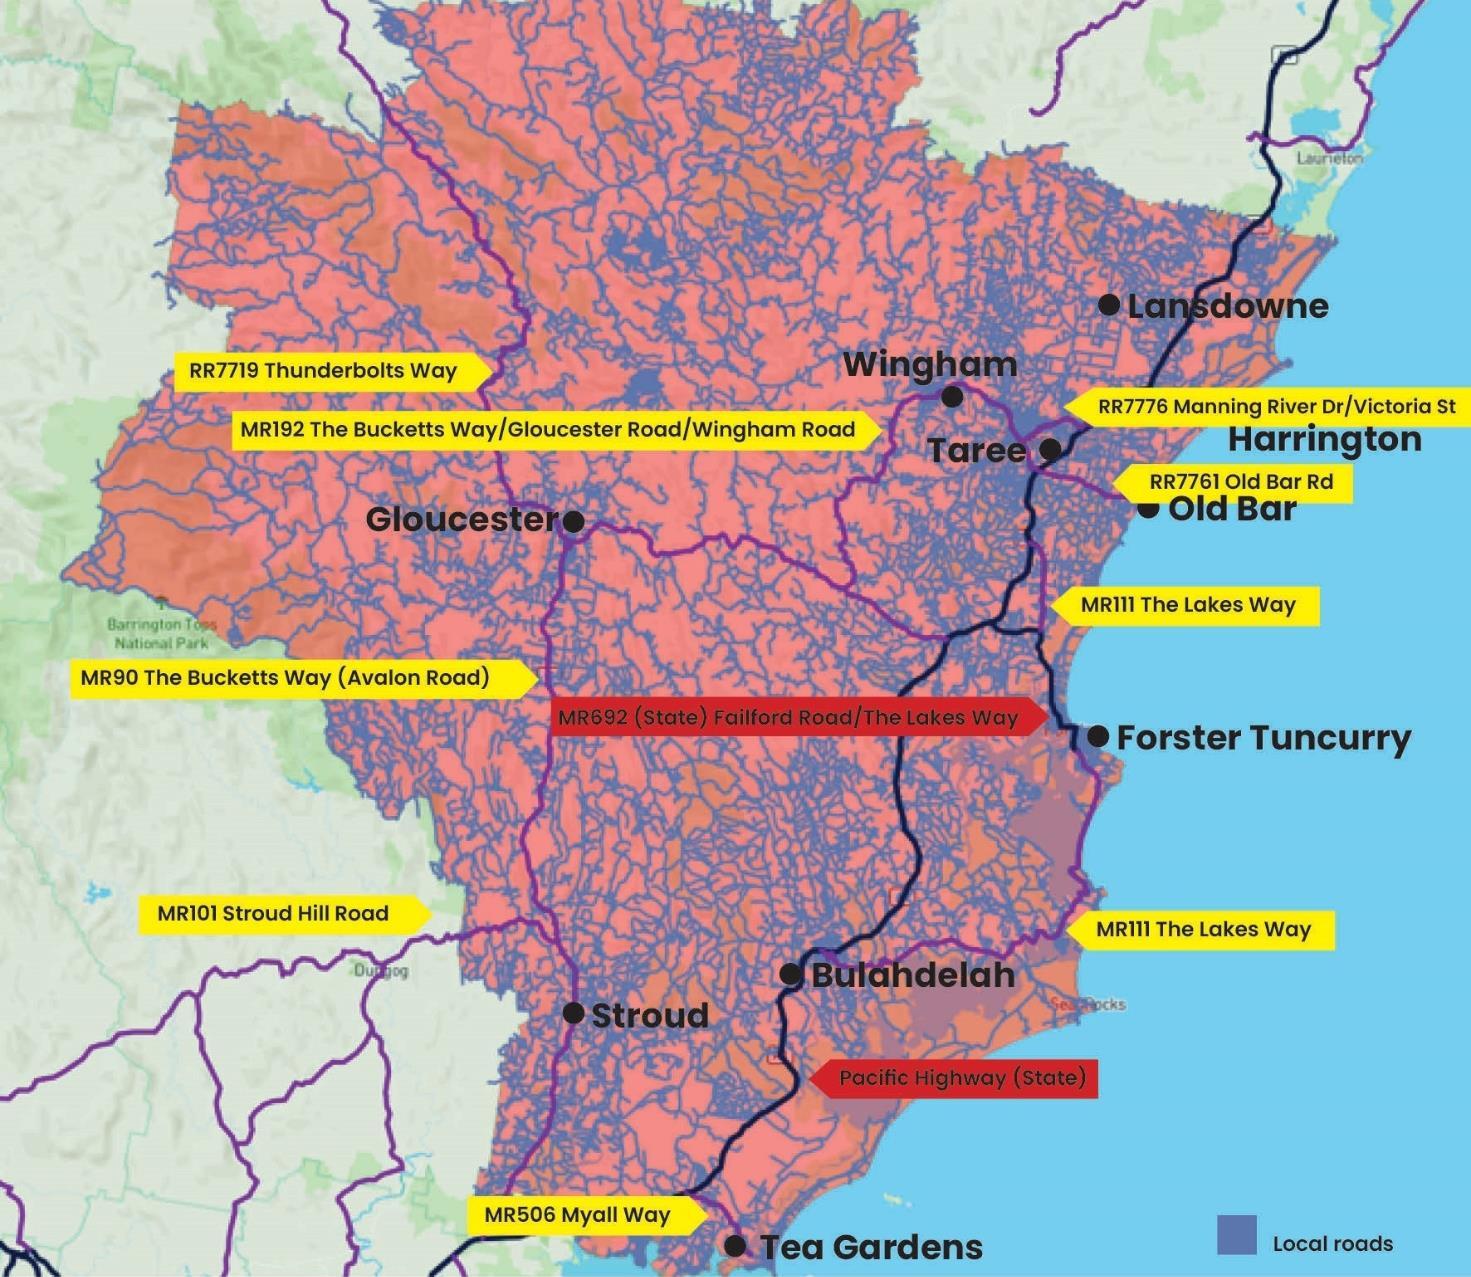
Public roads are classified under the Roads Act 1993 according to responsibility and the function the road has in the NSW network. Local roads are separated into either rural or urban subclasses. Rural roads are further separated into sealed or unsealed (gravel) roads
• State Roads - Managed and operated by Transport for NSW (TfNSW) including;
o The Pacific Highway (TfNSW)
o Failford Road - full length
o The Lakes Way - Failford Road to Breese Parade
Council does work on Failford Road and The Lakes Way on behalf of TfNSW under the Road Maintenance Council Contract (RMCC). Under this contract, our management system for this work meets the requirements for R2 Prequalification under TfNSW contractor management systems
• Regional Roads - Managed by Council
TfNSW contributes towards the ongoing maintenance/replacement under the block grant program. There is also funding available occasionally under various grant programs such as the REPAIR program. The $100M program and The Bucketts Way and Thunderbolts Way Corridor Upgrade Programs are examples of one-off grants that can sometimes apply to this road category
• Local Roads - Managed and operated by Council
These can be rural/urban, sealed/unsealed. Several grant funding programs can be available for this category of roads, including both Federal programs (such as Federal Assistance Grants – Roads Component, Road to Recovery, Safer Local Roads and Infrastructure Program, Disaster Ready Fund), and State programs (such as Fixing Country Bridges and Fixing Local Roads). Generally, local roads are funded by councils Funding local roads is a primary responsibility of councils.
• Crown Roads – Managed and operated by The Crown
The Department of Crown Land is the road authority for all Crown Roads in the same way that Council is the default road authority for public roads. Stevens Close at Wang Wauk is a recent example where it was proposed to transfer a Crown Road to Council as a public road
MidCoast Roads Strategy 32
MidCoast Roads Strategy 33
Figure 4 – Roads Classifications
MidCoast Roads Strategy 34
Figure 5 – The MidCoast Road Network
The MidCoast Road Hierarchy
In addition to formal road classifications, we use a hierarchy to differentiate between different standards of roads across the network.
The hierarchy typically represents the level of vehicle use (vehicles per day). Other factors such as vehicle types, speed, connectivity and bus routes are sometimes considered when categorising specific roads or sections of roads. This allows us to define expected standards for construction/maintenance and prioritise road segments for future programming and budgeting.
It also allows for different useful lives to be used for the components of a road asset depending upon the importance of the road in the hierarchy and its respective level of use to more effectively manage risks
Current trends from TfNSW are placing greater emphasis on movement and place, treating the entirety of the road reserve road as a public asset, with a focus on getting the best value from use of the space. This trend is likely to see a shift in how road hierarchies are defined in the future.
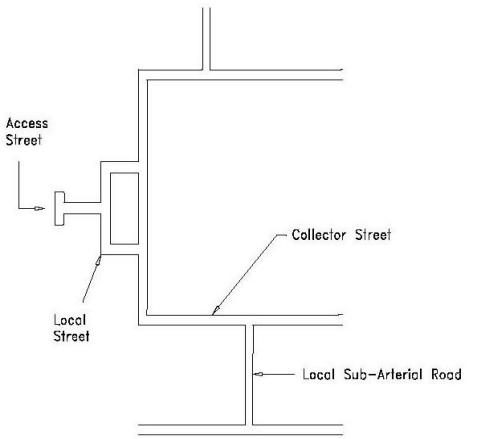
Our hierarchy is shown in the tables below:
URBAN ROADS
MidCoast Roads Strategy 35
Road Class Shareway Access Street Local Street Collector Street Distributor Road Arterial Road Road Class # NA 1 2 3 4 5 Properties Served 1 to 3 2 to 30 30 to 100 100 to 500 >500 NA Nominal Traffic (VPD) <60 <400 400 to 2,000 2,000 to 8,000 8,000 to 15,000 >15,000
Figure 6 - Urban Road Hierarchy
Road Class Access Street Local Street Collector Street Distributor Road Road Class # 1 2 3 4 Properties Served <5 5 to 30 NA NA Nominal Traffic (VPD) <50 50 to 200 200 to 500 >500
RURAL ROADS
Figure 7 - Rural Road Hierarchy
MidCoast Roads Strategy 36
Figure 8 - Typical Example of an Urban Road Network Layout
Road Segments
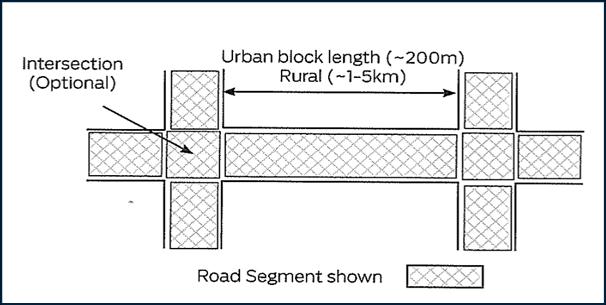
Roads are divided into segments to effectively manage large, long road network assets. This allows each segment to be managed appropriately to include maintenance, financial considerations and eventual renewal. As noted above, different segments of the same road may have different classifications in the hierarchy
Segments are intended to represent uniform sections of road that have:
• the same type of surface seal (bitumen, asphalt, concrete, etc)
• relatively similar or the same pavement (depth and materials)
• uniform width and alignment
• approximately the same age of construction
• similar condition
• consistent level of usage/traffic
This approach is consistent with both the RMS ROADLOC Road management system and guidance by the IPWEA Condition Assessment & Asset Performance Guidelines (Practice Note 9 2015).
MidCoast Roads Strategy 37
Figure 9 - Road Segmentation
Road Asset Components
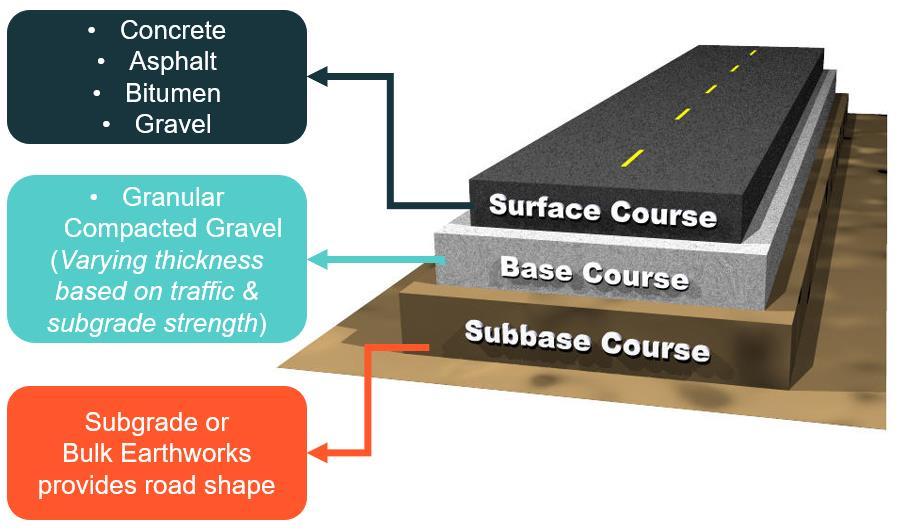
Roads are complex assets. To simplify the financial accounting, they are separated into components generally reflecting the different functional layers of the road.
The different types of road surfaces are separated from the structural pavement layers of the basecourse. For sealed roads, the performance of the basecourse is heavily dependent upon the integrity of the surface layer. When the surface deteriorates to the extent that moisture penetrates the pavement layers, potholes, shoves and other defects will quickly form.
The surface has a much shorter effective life than the basecourse and therefore, must be renewed several times over the life of the underlying structural pavement to prevent accelerated deterioration of the pavement and premature failure of the road.
The third asset component of a road is the subgrade or the earthworks. Typically, this component is not depreciated. The earthworks required to build the road don’t usually change with age and therefore, will remain in the same condition whilst ever the need for a road in the locations remains. Practical evidence of this can often be seen where roads have been upgraded and the old road subbase formation still exists
MidCoast Roads Strategy 38
Figure 10 - Road Componentisation
Road Inspections
Assets Officers undertake routine inspections of the range of transport assets to enable prioritisation of asset renewals. Key road assets (pavement and seal components) are the largest group of assets with a current replacement cost of just above $2B.
Road segments are currently inspected and prioritised routinely for the development of annual and long-term renewal works programs.
The inspection process is currently undertaken in general accordance with IPWEA Condition Assessment & Asset Performance Guidelines (Practice Note 9 2015) – Road pavements (Visual assessment). Council’s asset staff have been formally trained to undertake inspections in accordance with the manual.
The guide applies the universally accepted ‘1 to 5’ criteria and can be applied to virtually any asset group and associated components. Each asset or component is separately assessed in terms of its value, remaining life and condition
MidCoast Roads Strategy 39
Figure 11 - Asset Condition Rating Framework (adapted from IPWEA Guidelines) Condition Rating Condition Descriptor Guide Residual life as a % of total life Mean % residual life 1 Excellent An asset in excellent overall condition. Normal maintenance required >86 90 2 Good An asset in good overall condition with some possible early stages of slight deterioration evident, minor in nature and causing no serviceability issues. Normal maintenance plus minor repairs required (to 5% or less of the asset) 65 to 85 70 3 Satisfactory An asset in fair overall condition with some deterioration evident, which may be slight or minor in nature and causing some serviceability issues. Significant maintenance and/or repairs required (to 1020% of the asset) 41 to 64 50 4 Poor An asset in poor overall condition, moderate to high deterioration evident. Significant renewal required (to 20 - 40% of the asset) 10 to 40 30 5 Very poor/Failed An asset in extremely poor condition or obsolete. The asset no longer provides an adequate level of service and/or immediate remedial action is required to keep the asset in service in the near future. Over 50% of the asset requires renewal <10 10
In 2022 an automated inspection and condition survey was undertaken on the road network. This method uses a vehicle fitted with a range of sensors to collect data whilst driving the network. The process results in an immense volume of data, with continuous reading averaged at 10-15m intervals and aggregated to each road segment. Multiple CCTV cameras capture imagery, allowing condition ratings to be verified remotely after the inspection via trained console operators. The information is also available for Council’s asset staff to use in future.
This type of inspection is repeatable. It allows comparison of data collected over time to be compared, showing a true indication of the change in the network over time.
MidCoast Roads Strategy 40
Benchmarking Comparisons
Across NSW, there is a significant variance between councils. One thing that nearly half of councils in NSW have in common is an inability to fund adequate renewal of infrastructure. The NSW Audit Office found that in 2020-2021, 53 councils or approximately 42%, reported operating result deficits. This is now being considered by the inquiry into the ability of local governments to fund infrastructure and services1
The opportunities that councils have to influence the current outcomes are:
• Reduce service levels across the network and maintenance/intervention.
• Improve efficiency (deliver more output for the same or a lower cost).
• Increase income through rates and other fees.
If the recent experience has provided anything, the community has little appetite for lower service levels. Councils struggling to maintain their existing road networks are constantly fielding requests from residents for sealing, widening or upgrading roads.
While there is an opportunity to leverage newer technology or use improved equipment, techniques and materials, experience suggests that this will increase efficiency in relatively small increments yearly. Minor incremental improvements are unlikely to fill the current funding gap.
Increasing income through rates can be a blunt mechanism based on a concept where those who own more valuable land contribute proportionally more towards the provision of infrastructure and services. Whilst increasing rates would reduce the funding gap, it also risks exposing other demographic inequities and exacerbating socioeconomic disadvantage. There needs to be a better way of increasing road funding that does better to equalise the rating effort between communities to provide one of the most basic services, such as roads.
Some observations between NSW councils based on the 2021 comparison data:
• The length of road per capita varies from <1m to >150m (MCC = 38m/per person)
• The total length of the road network managed by councils varies from 56km to nearly 4,000km (MCC = 3,638km, 2nd highest)
• The average rainfall varies between coastal regions with ~1,400mm/year and inland areas with ~400mm/year. (MCC ~ 1,159mm/yr)
• The average residential rate varies from $150 to $1,950 per year (MCC $1,367)
• The level of rates revenue per kilometre of road varies widely between approximately $375,000 - $5,000 (MCC $23,047)
• The rate peg for MidCoast for 2023/24 is 3.7% yet the cost indices for road materials and construction have been trending well above 7% pa for over 12 months
Comparisons with NSW Coastal Councils commissioned by Local Government Professionals (LGP) and conducted by Price Waterhouse Cooper (PWC) Local Government Performance Excellence program, further demonstrate the variances between councils and the quantum of the challenge faced by MidCoast Council.
1 Ability of local governments to fund infrastructure and services (nsw.gov.au)
MidCoast Roads Strategy 41

12 - LGP (PWC) Coastal Councils Comparison - Population Density
The population density in the MidCoast is around 40% or 2/5th of the average for participating councils

Figure 13 - LGP (PWC) Coastal Councils Comparison - Road Network Length
The road length for MidCoast is around 2.6 times the average for participating councils

Figure 14 -LGP (PWC) Coastal Councils Comparison- Bridge Length
The bridge length for MidCoast is almost 3 times the average for participating councils
MidCoast Roads Strategy 42
Figure
The following graphs further highlight the significant variation in councils' capacity to manage their road networks adequately based on the OLG Council Comparison Time Series Data 2021/2022.
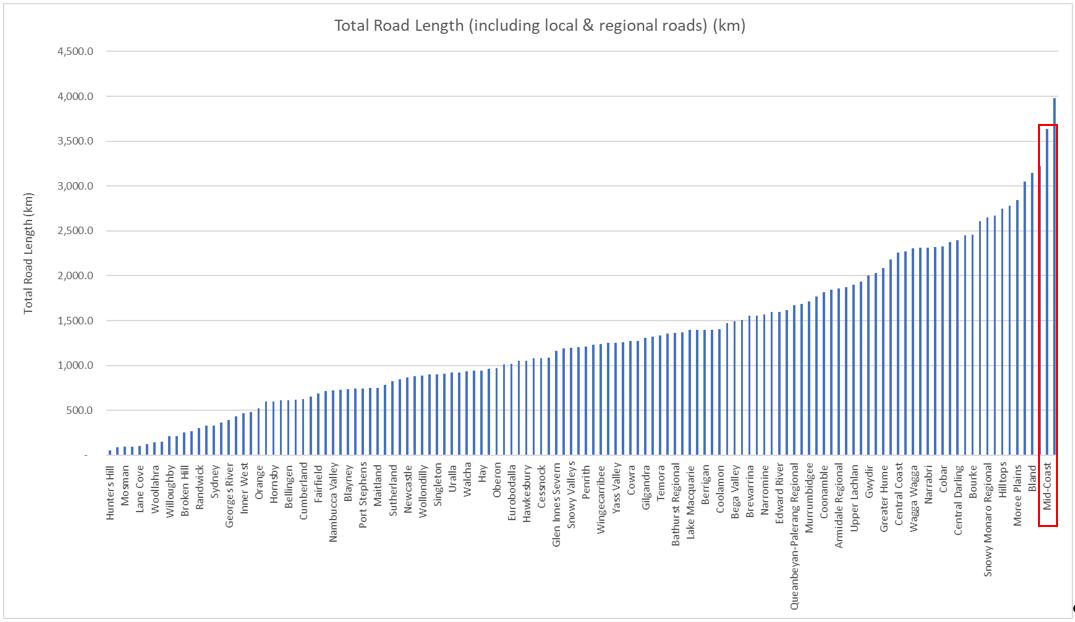
-
The MidCoast road network is the second longest in NSW behind Lachlan Shire Council
MidCoast Roads Strategy 43
Figure 15
Total Length of Road by All NSW Councils
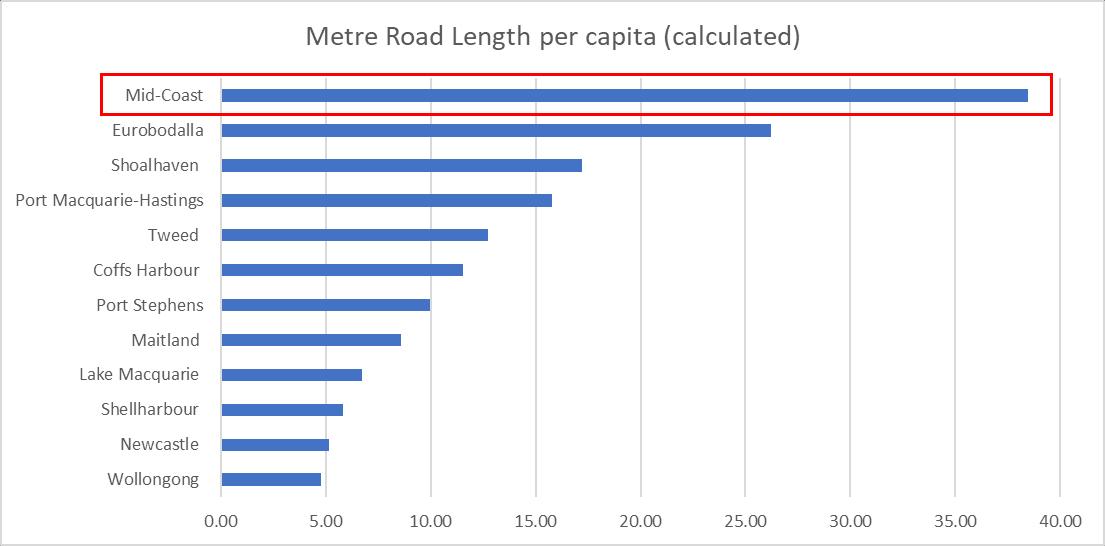
16 - Comparison of The Length of Road Maintained Per Capita - OLG Group 5 Councils
Compared to the group of similar councils (OLG Group 5), the length of road per capita in the MidCoast is more than three times the group average and more than double that of other comparable councils. Maintaining similar road conditions would consume a larger proportion of MidCoast's operating income, meaning less is available to support the infrastructure and services required for larger communities like MidCoast.
MidCoast Roads Strategy 44
Figure
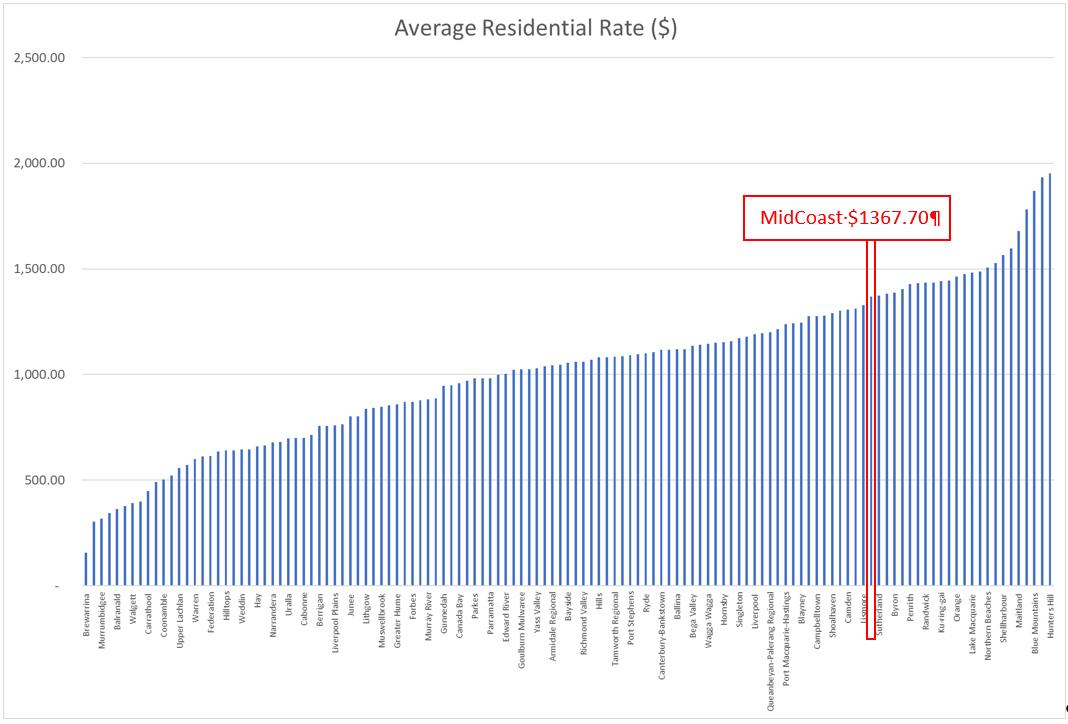
MidCoast Council is in the upper quartile across the state for average residential rates indicating that the level of rating effort for residents is not quite as relatively significant as the burden of the expansive asset network Based on this, the issues around roads should not be surprising; residents pay less on average than many other councils leaving a similarly proportional level of funding to achieve comparable service levels on a large road network.
MidCoast Roads Strategy 45
Figure 17 - Comparison of the Average Residential Rates by all NSW Councils
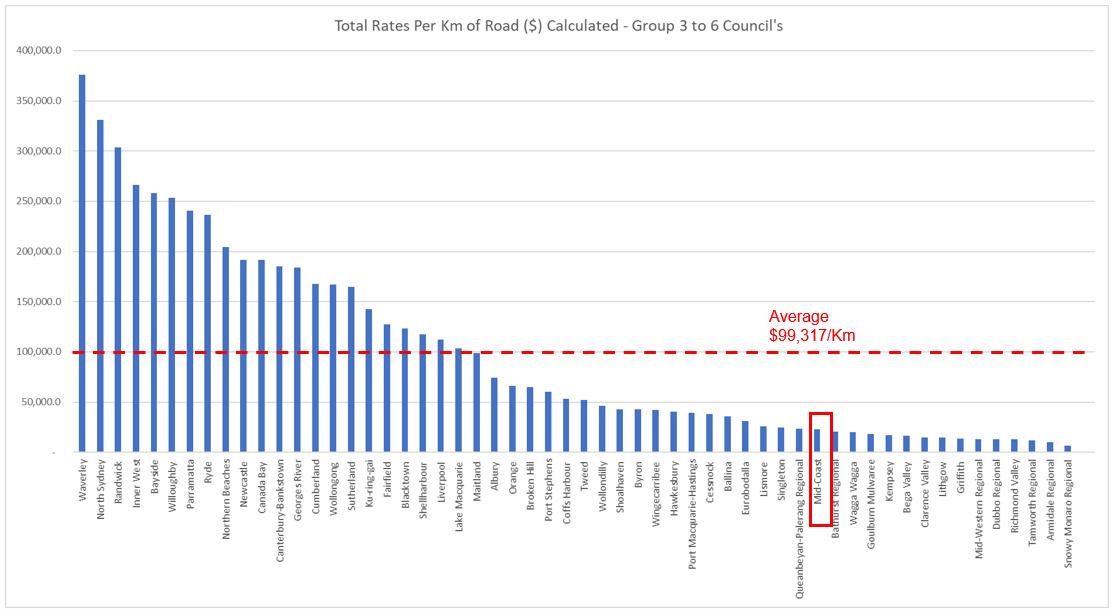
18 - Rates Revenue Per Kilometre of Road - OLG Group 3-6 Councils
MidCoast Council is in the lower quartile for rate revenue per kilometre of road, reflecting the size of the network relative to the resident population.
Further benchmarking information is available in Section 4 (pages 20-23) of The AEC Financial Sustainability Review 2023. Similarly, the AEC concluded that MidCoast Council when compared to other OLG Group 5 Councils, generally has lower residential, farm and business rates with less rating effort being applied relative to the value of land.
MidCoast Roads Strategy 46
Figure
CURRENT STATE ANALYSIS
Current State Analysis
This section draws on the information that is currently available to define the current state of our road network and how our community interacts with it to inform the future desired state.
Transport Asset Inventory
In addition to sealed/unsealed/rural/urban roads, we also have bridges, kerb & gutter, footpaths, traffic devices (medians, etc), signage and line marking. At present, we don’t account separately for traffic devices, signage and line marking. These components are treated as part of the overall road asset with renewal being part of the asset maintenance program.
Roads
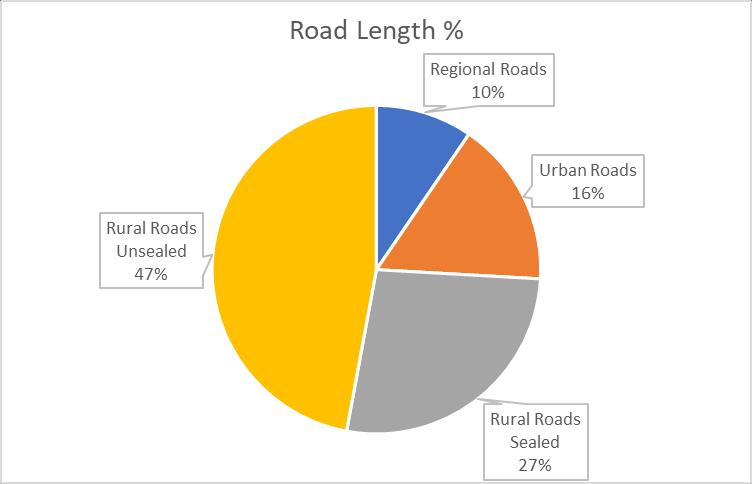
• 347 km of Regional Roads
• 595 km of Urban Roads
• 983 km of Rural Sealed Roads
• 1,713 km of unsealed roads
Total 3,638km of Public Roads Replacement Cost (Non-Depreciable $1,071,748,000 Replacement Cost (Depreciable) $1,578,862,489 Depreciated
MidCoast Roads Strategy 48
Replacement Cost $975,328,976 Depreciation (annual) $26,070,593
Figure 19 - Distribution of Roads by Type
Bridges
• 436 Concrete Bridges
• 27 Steel Bridges
• 159 Timber
• 47 Composite Bridges
Total 669 Bridges
Replacement Cost (Depreciable)
$199,816,181
Depreciated Replacement Cost $145,555,075
Depreciation (annual) $2,109,505
Footpaths/Cycleways
• 166km of footpaths/cycleways
Replacement Cost (Depreciable) $47,668,071
Depreciated Replacement Cost $33,172,969
Depreciation (annual) $499,938
Kerb & Gutter
• 909km of kerb & gutter
Replacement Cost (Depreciable) $202,783,187
Depreciated Replacement Cost $117,846,759
Depreciation (annual) $2,027,832
Total Transport Network Assets
Replacement Cost (Depreciable)
$2,029,129,928
Depreciated Replacement Cost $1,271,903,779
Depreciation (annual) $30,707,868
A total of 34% of the total transport asset value has been financially depreciated. This reflects the condition-based valuation of our assets, meaning that across the network, over a third of the condition of all assets has been used up or consumed and no longer has service value
MidCoast Roads Strategy 49
Transport Asset Condition Roads
The current condition data for roads was collected in 2022 using an automated inspection and condition survey method. The condition of the network is graphed below for sealed and unsealed roads according to the cumulative proportion of asset value by condition rating
Road Condition
20 – Sealed & Unsealed Road Condition by Gross Replacement Cost (2022)
Visual representations of road condition ratings are provided below.
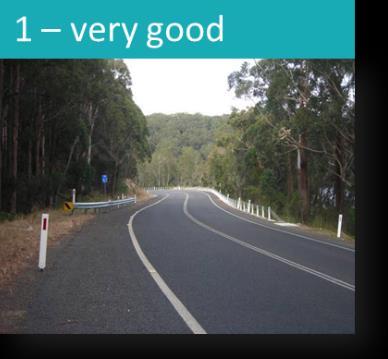
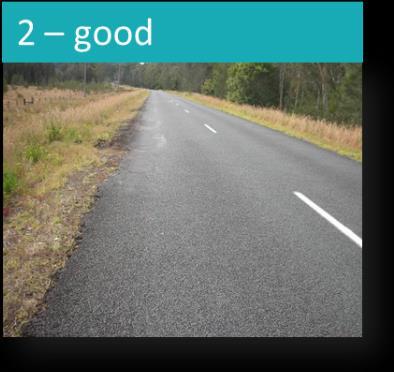
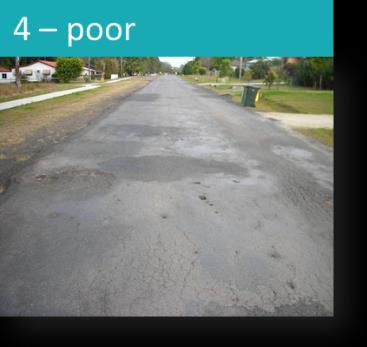
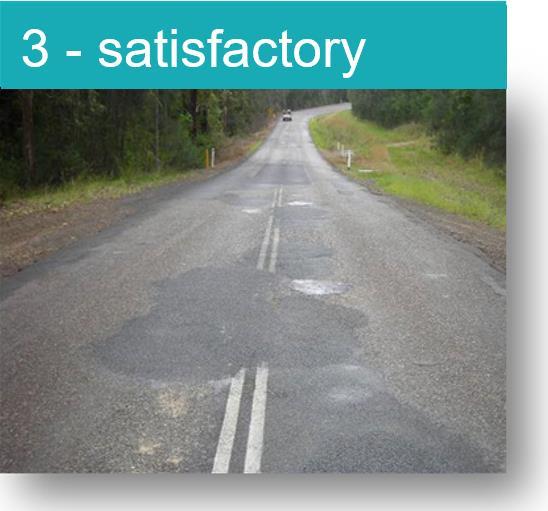
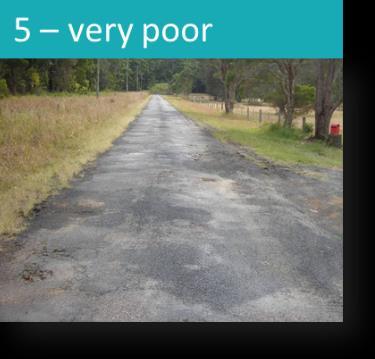
MidCoast Roads Strategy 50
Figure
1 2 3 4 5 Sealed 13.2% 38.9% 31.2% 14.3% 2.4% Unsealed 12.4% 28.3% 56.8% 2.1% 0.5% 0.0% 10.0% 20.0% 30.0% 40.0% 50.0% 60.0%
Figure 21 - Typical Examples of Condition Ratings
The graph below shows the data for sealed road condition (rounded) by road segment. A total of 72% of segments are considered satisfactory or better. However, 28% more than a quarter of segments are in poor or very poor condition.
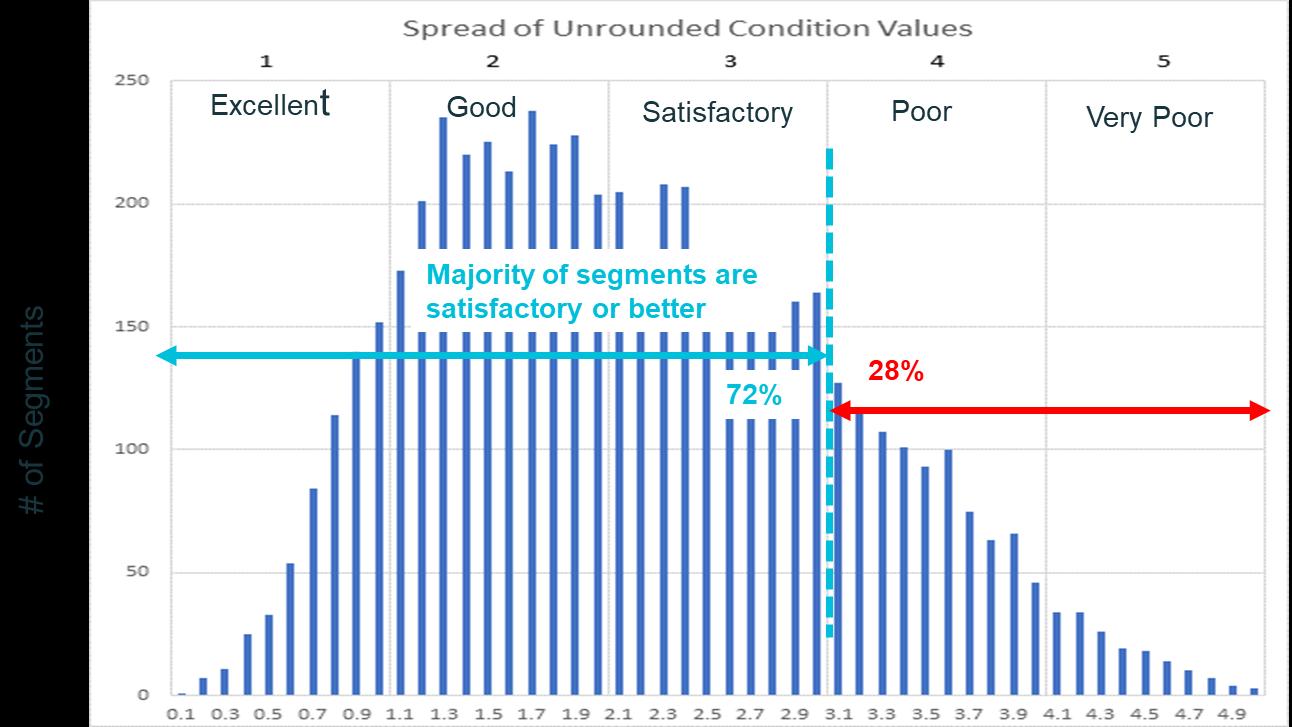
Looking at the sealed road condition data for the averaged 10m increments (or the recorded measurement frequency) provides an interesting contrast to the results at the segment level.
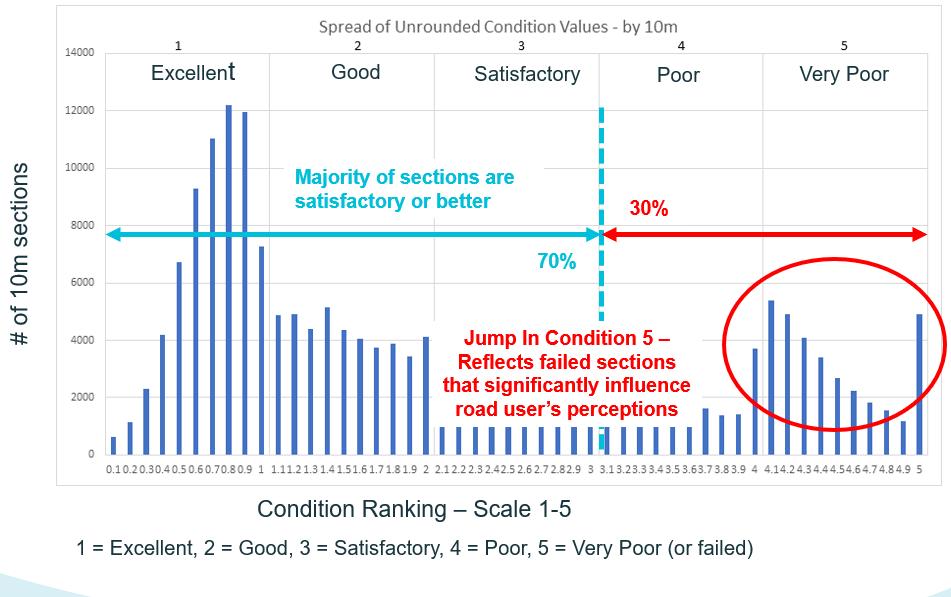
23 - Sealed Road Condition Ratings by 10m Averaged Results (to 2 significant figures)
The graph above shows a proportion of the data points to be in excellent condition. After the initial drop in the number of results that fall within the excellent condition rating, there appears to be a relatively consistent pattern of results for good, satisfactory and poor condition.
MidCoast Roads Strategy 51
Figure 22 - Sealed Road Condition Ratings by Road Segment
Figure
The results with a ‘very poor’ condition rating (greater than 4) display a different pattern from the rest of the graph. The relatively high number of results at condition rating 4.1 or above (the righthand end of the scale) is the aggregate of results that mathematically exceed 5. Therefore, these results are grouped at the limit of the rating scale, which is 5.
The data demonstrates a level of variation within segments where portions have deteriorated relatively more than the rest of the segment. This suggests that treatment or intervention could be improved through considering data at the sub or part segment level
Whilst 70% of the results are rated as satisfactory or better, at face value, this doesn’t align with the community’s perception. The fact that 30%, or nearly a third of the entire road surface, is poor or very poor is far too high to be acceptable to road users. Even worse, road deterioration accelerates over time without intervention where roads are in poor condition.
This information suggests that a targeted heavy patching program would be beneficial Particularly bad areas of pavements could be repaired with isolated heavy patching prior to an expanded resealing program. This would provide a greater benefit for the effort and value expended
The following graphs demonstrate the distribution of results for pavement condition, surface age, roughness, cracking and rutting. The results are grouped into the respective condition ratings
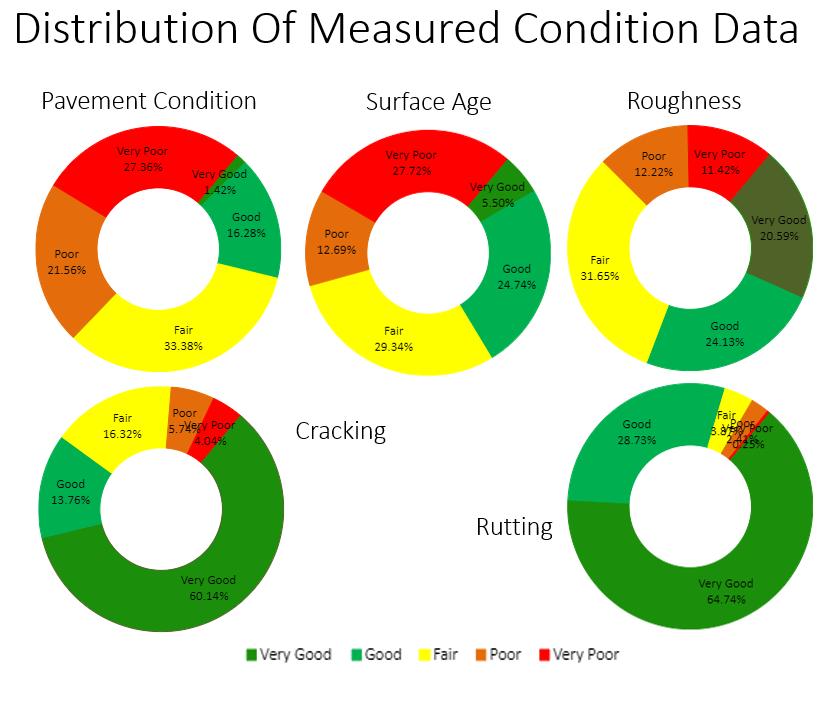
MidCoast Roads Strategy 52
Figure 24 - Distribution of Measured Condition Data – Sealed Roads
These graphs provide the following observations:
• The relatively high proportion of surface age in ‘poor’ and ‘very poor’ condition is a critical indicator. This shows that the current situation of inadequate resealing has led to deterioration of the pavement condition and poor surface roughness. The surface age will provide low levels of surface friction, adding to the crash risk
• Almost a quarter of the network surface has poor or very poor roughness Less than half the network has a good level of roughness. This suggests that the age of the seal is not being maintained resulting in a range of defects (that require patching) or shoving This adds to the level of crash risk exposure and increases the wear and tear or damage to vehicles.
• The level of failure through rutting is low across the network. This indicates that the subgrade components are not suffering extensive deformation despite the poor surface condition, surface age, and roughness It also shows that deformation may be relatively isolated within large sections of other defects
• Cracking is a significant issue prevalent across 25% of the network. A crack sealing, heavy patching and a sustainable resealing program will help to contain the impact of cracking on existing pavements in good condition.
• There is limited historical data on pavement depths. Inadequate pavement depth could be contributing to the poor results as the premature failure is being patched or repaired, only to fail again prematurely
The data reinforces what has been widely known: with a historically low resealing frequency, it has been too long between treatments As a result, the condition of road seals is now less than adequate, allowing moisture to penetrate and compromise the granular pavements. It highlights the urgent need to rapidly expand the level of resealing done each year to minimise the impact of accelerated deterioration of the rest of the road network in reasonable condition. If this does not occur, then we can expect road conditions to deteriorate exponentially faster than they have in the past and efforts to intervene will become increasingly futile.
The data also demonstrates a road network in severe distress, with defects extending over more than half of it due to the poor seal condition. Unless this is addressed, the other conditions measures are expected to rapidly increase.
Regular resealing is the key to optimising the asset value returned to the community from roads. It is widely recognised as the single most effective action to achieve the lowest lifecycle costs In a high rainfall coastal area (like much of the MidCoast), it is even more critical.
Using automated visual condition data for unsealed roads gives a limited perception of conditions based on what is observed. It reflects the frequency of maintenance grading, where operators rectify defects in the surface superficially. More information should be collected on the remaining gravel thickness, rates of loss and the condition of the formation shape, transverse and longitudinal drainage.
MidCoast Roads Strategy 53
Bridges
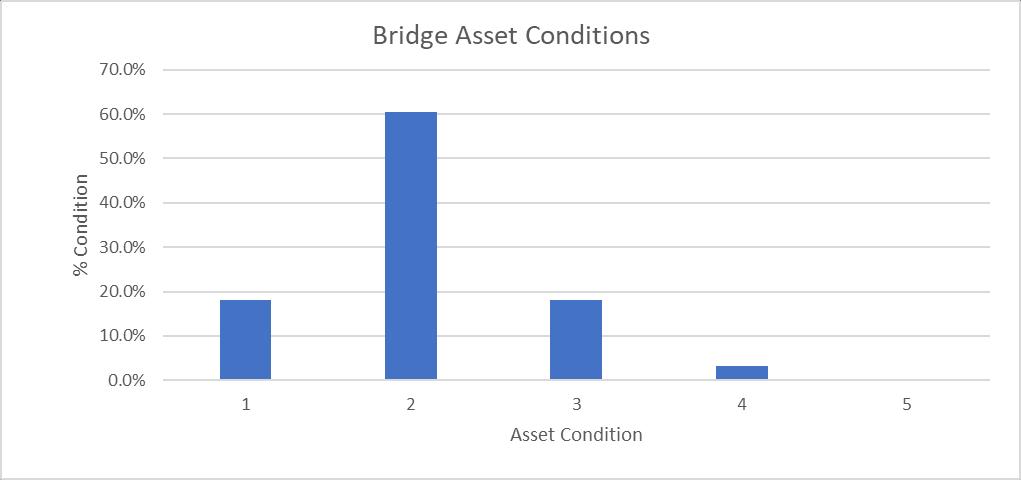
While this data can be segregated for different groups based on the bridge length or the construction materials such as concrete, steel, timber or various composite arrangements, the aggregated data based on bridge size is presented
Most of our bridges (436) are concrete. Concrete bridges are more expensive than other material types. Based on the design standards and loadings, they are predicted to have long asset lives with effective maintenance There are smaller numbers of steel (27) and composite (47) bridges. A favoured strategy at one stage was to replace timber decks with reinforced concrete. As a result, a number of our bridges in the Gloucester area consist of older timber sub-structures supporting a reinforced concrete deck.
Whilst we have 159 timber bridges, they are generally in poor to fair condition. We should be planning to replace all our timber bridges in the next 20 years as they reach the end of their life and maintenance/rehabilitation options are no longer cost effective.
MidCoast Roads Strategy 54
Condition 1 2 3 4 5 Culvert bridge (greater than 6m) 16.03% 38.44% 44.70% 0.83% 0.00% Long span bridge (more than 120m) 0.00% 100.00% 0.00% 0.00% 0.00% Major bridge (more than 60m) 7.34% 75.57% 11.48% 5.61% 0.00% Minor bridge (between 6m – 60m) 18.88% 57.06% 18.43% 5.36% 0.28% (blank) 83.88% 0.00% 6.06% 1.68% 0.00% Grand Total 18.64% 59.99% 16.12% 4.63% 0.18%
Figure 25 - Bridges Asset Condition Table & Graph
We currently have 15 bridges with load limits due to their overall asset condition. There are very few bridges in condition #5 – failed, as intervention actions such as maintenance, repair, rehabilitation or replacement are generally implemented if load limiting is insufficient to extend the life of the bridge. Alternatively, bridges that are no longer capable of carrying loads would be closed to traffic before they would be knowingly allowed to fail.
As a result, it is not surprising that most bridges are in fair to good condition. The relative number and value of newer concrete and steel bridges is reflected in the data The importance of bridges and consequence of failure have historically driven their effective asset management
Our situation and the challenges we face are reflected by the responses of other NSW Councils who participated in the 2023 Road Asset Benchmarking Project undertaken by the IPWEA –Timber Bridge Management Report. However, MidCoast is responsible for around 13% of timber bridges remaining in NSW. This is disproportional to the relevant population of the MidCoast Progress in relation to Bridges should be monitored closely in the coming years.
Flooding experienced in recent years has highlighted the need to consider the ability of the abutments, especially embankments, to withstand impact. Further work is necessary to consider where additional measures are required to protect the bridge and road approaches from impacts during flooding.
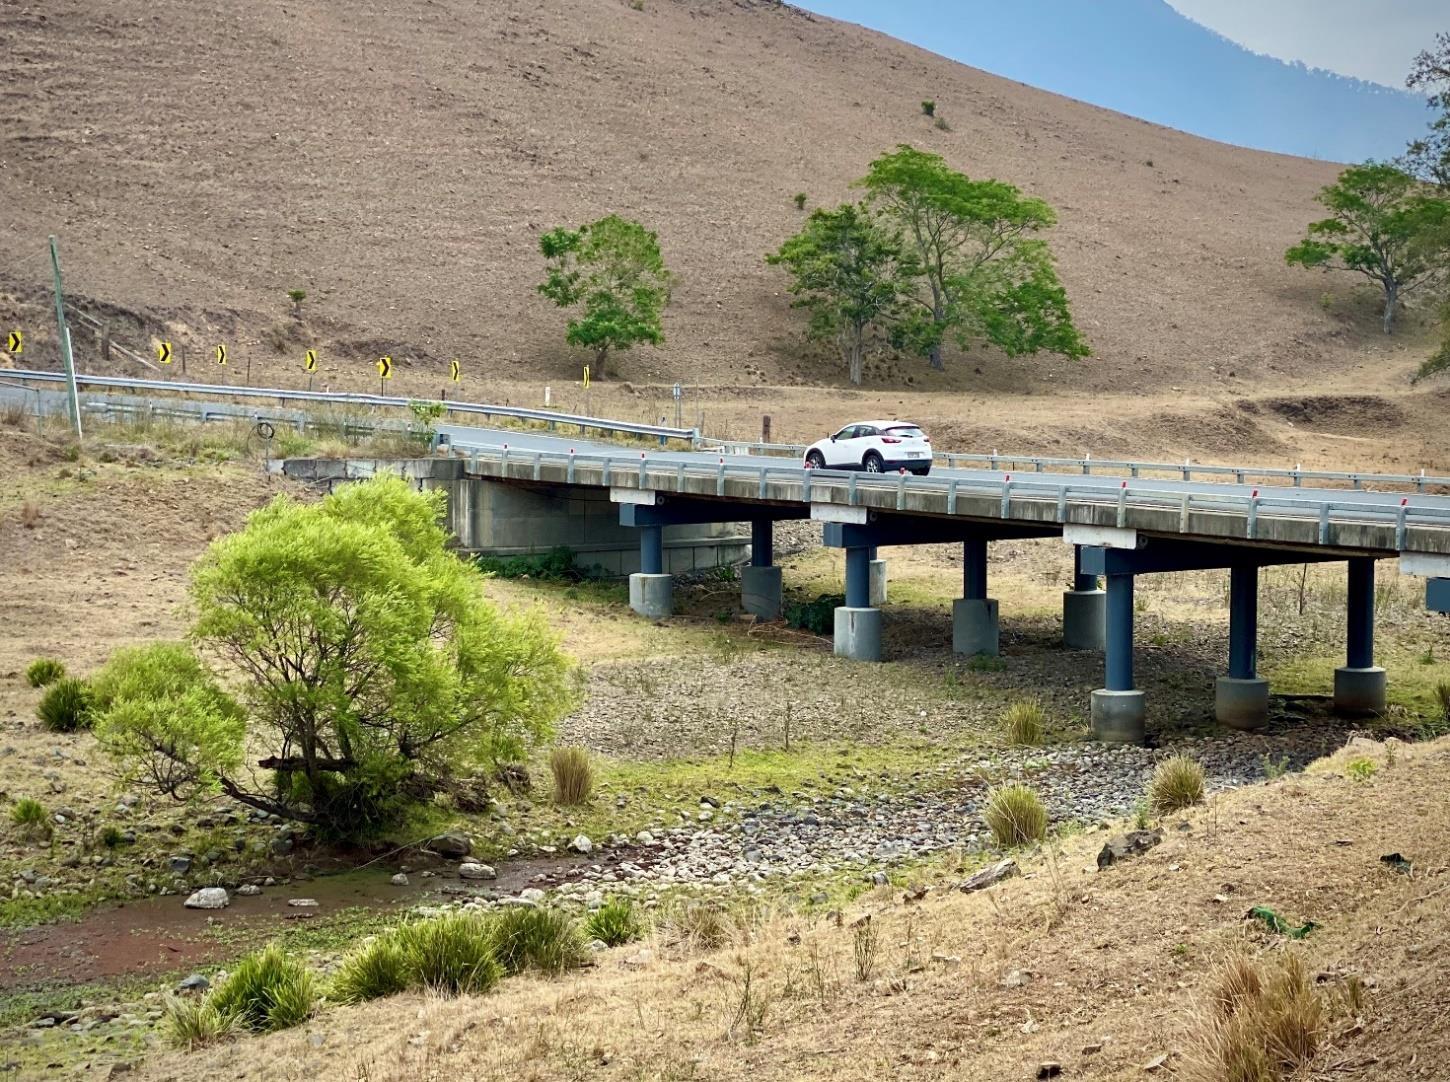
MidCoast Roads Strategy 55
Footpaths & Cycleways
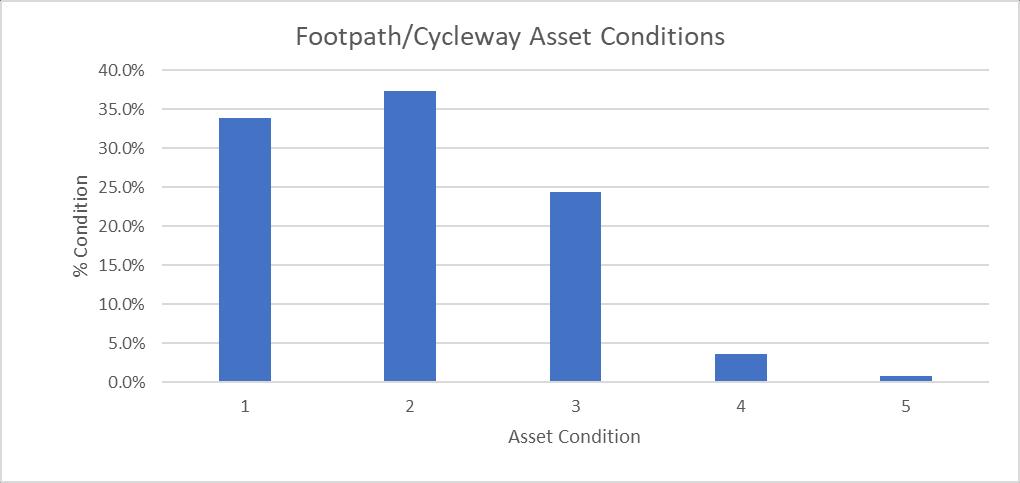
Figure 26 – Footpath & Cycleways Condition Graph & Table
Properly constructed footpaths and cycleways are long-lived assets that remain in good condition throughout most of their life, requiring minimal maintenance.
Unfortunately, some of our older footpaths were constructed using unreinforced concrete, laid as segmental slabs with no interconnection. This construction technique makes them prone to cracking and differential settlement, which can create significant trip hazards.
The highest risks tend to occur when offset heights are between 5mm and 20mm. Relatively minor variations like this are difficult for users to identify and lift their feet higher while walking to compensate. Older, mobility-impaired, impaired and younger people are particularly vulnerable to this risk and will tend to trip more frequently.
MidCoast Roads Strategy 56
Asset type 1 2 3 4 5 Standard – On Ground Pathway 33.2% 35.2% 27.4% 3.4% 0.7% StructuralFootbridge 29.3% 53.1% 17.7% 0.0% 0.0% StructuralBoardwalk 47.7% 49.0% 3.3% 0.0% 0.0% StructuralRamp 100.0% 0.0% 0 0% 0.0% 0.0% StructuralStairs 28.1% 68.6% 0.0% 3.3% 0.0% Grand Total 27.4% 29.0% 40.7% 2.4% 0.5%
Older footpaths tend to be 1.2m wide (or narrower) making it difficult for some users, particularly those with mobility aids or who regularly have to pass other users going in the opposite direction without having to step off the path
Further work is needed to review the condition of our footpath network, identify defects and implement a targeted renewal program and an annual inspection and trip hazard grinding program The poor condition sections could be considered for removal from the network. Particular attention should be focussed on the condition of structural stairs due to the potential risks related to premature failure.
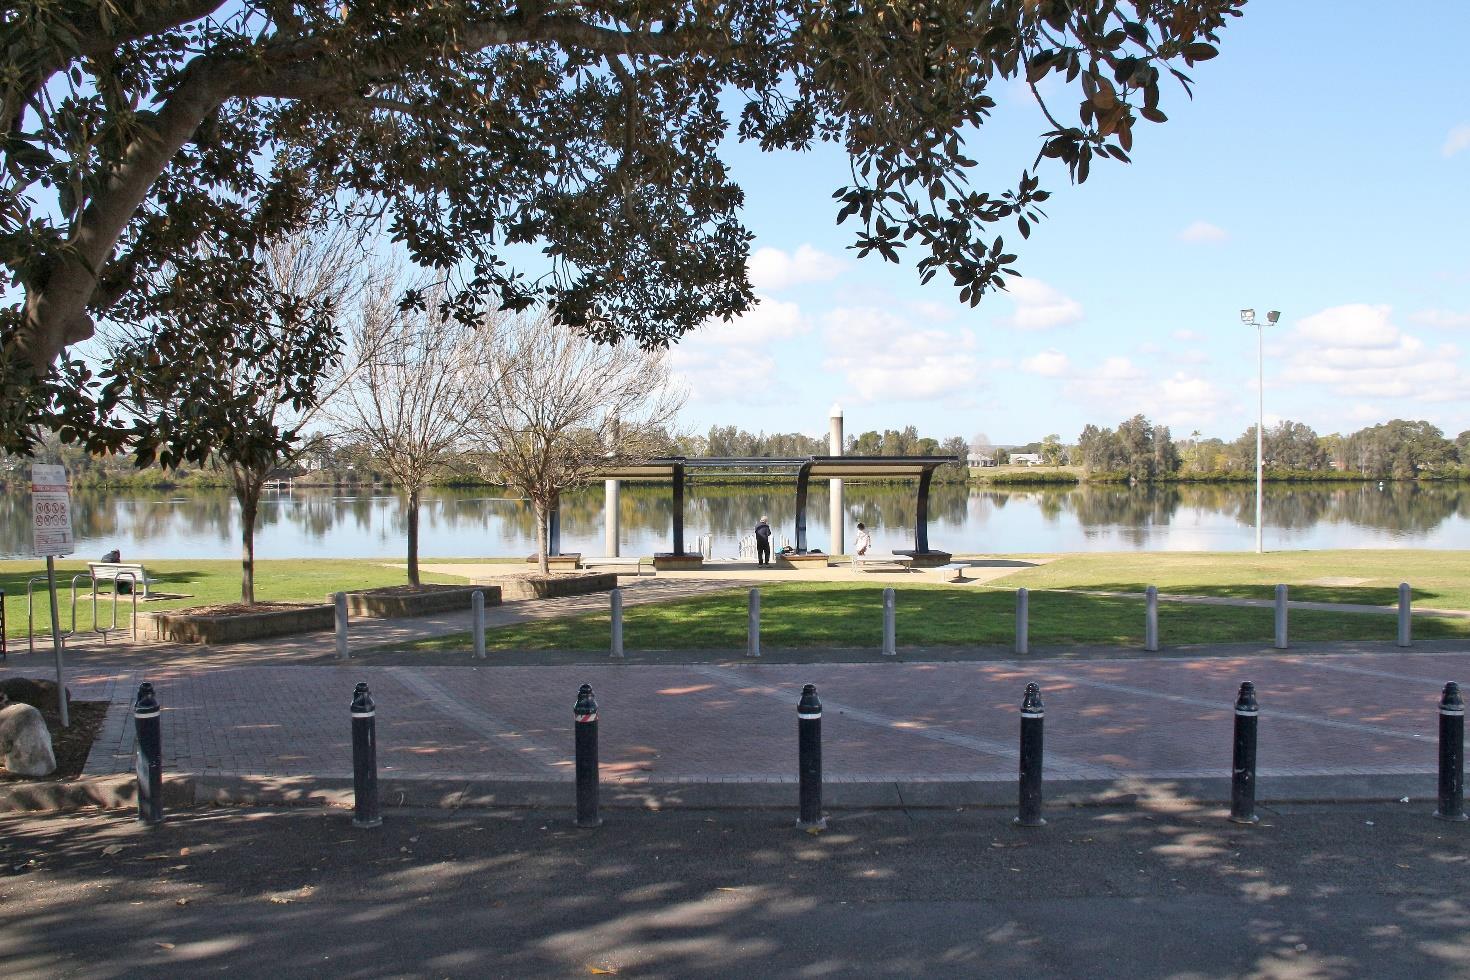
MidCoast Roads Strategy 57
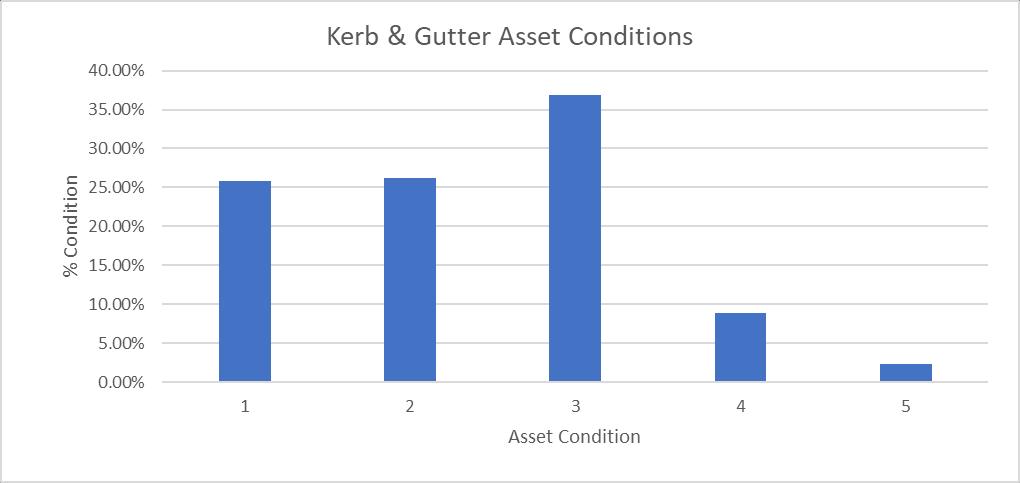
(% by replacement cost)
Figure 27 - Kerb & Gutter Condition Graph & Table
Many of the current kerb & gutter assets were constructed in the 1950s and 1960s within areas already developed for residential housing. The kerbs show signs of rotating or differential settlement in these areas as the natural subgrade material lacks the strength to support the kerb & gutter. This can also be due to the combined impacts of an inadequate road pavement, heavy vehicles such as garbage trucks tracking close to the kerb and groundwater intrusion. The movement of the kerb & gutter leads to premature failure and moisture ingress into the pavement. In the worst cases, vehicles cannot access driveways due to the resulting deformation which is an unacceptable outcome for local residents
Many of these older pavements were built to the standard of the day, without sub-surface drainage to take ground moisture away from the road pavement. At that time, garbage services were much less frequent and typically involved vehicles running centrally in the road pavement, so the initial design did not anticipate multiple trips per week by larger modern waste collection vehicles immediately adjacent to the kerb.
What often looks like a minor kerb and gutter repair can quickly become a substantial pavement failure, requiring full reconstruction of not only the kerb & gutter but also the adjoining road. Fixing sections of the kerb early in the failure process and providing sub-surface drainage will save costs in the long term. However, it often confuses residents who may feel the money could be better spent elsewhere
The current condition shows that 11.2% or just over 100km of kerb and gutter has either failed or is deteriorating to the point of failure. As the kerbs fail, they obstruct property access and create significant trip hazards. Failure to address this in the short term will generate increasingly aggressive customer complaints. Property owners personally affected by these situations do not accept deferral of repairs due to the personal impact it has on them, their family, friends and visitors.
MidCoast Roads Strategy 58
Condition 1 2 3 4 5 Kerb & Gutter 25.80% 26.20% 36.80% 8.90% 2.30%
Kerb & Gutter
Transport Capital Funding 2018/2019 –
2023/2024
Since being formed, MidCoast Council has acknowledged the significant infrastructure challenges across the local government area. A geographically dispersed community spread across 10,000 square kilometres has resulted in the MidCoast Road network being the 2nd longest in NSW. We maintain approximately 38m of road per person, more than three times the average of comparable councils and more than twice that of the nearest similar council
After the merger, we allocated initial savings to capital road renewal projects. We have received significant grant funding over the last five years
The last analysis identified that most transport funding (77%) goes to the regional road network. Regional roads equate to 10% of the network, representing the most significant risks due to the level of use (particularly heavy vehicles) and higher vehicle speeds.
The graph below shows the annual Transport Capital Program by funding source, as approved in the annual Operating Plan. We are unlikely to continue receiving the same level of grant funding in future. However, there will be some ongoing grant funding. The challenge is to reflect this accurately in our long-term financial planning
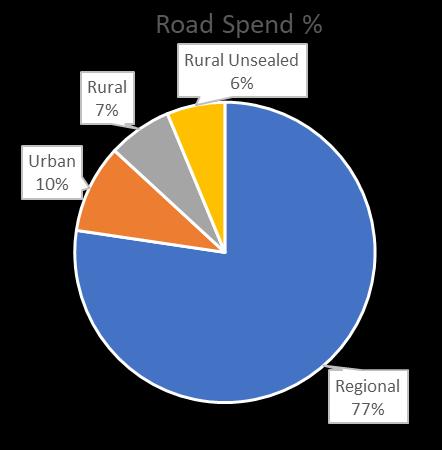
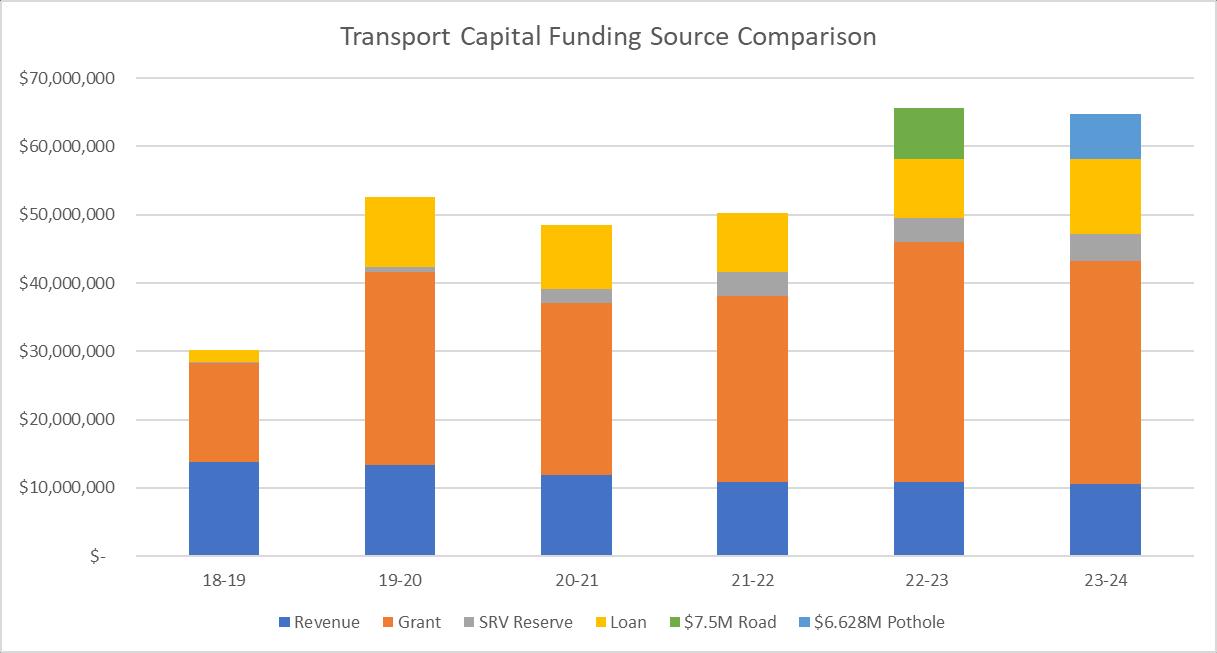
MidCoast Roads Strategy 59
Figure 29 - Transport Capital Funding (source – Adopted DPOPs)
Figure 28 - Annual Expenditure FY2022/2023 by Road Type
Since 2018-2019 revenue funding for capital programs has reduced from nearly $14.5M to $10.6M. This is offset by the introduction and gradual increase of funding from the Special Rate Variation (SRV) Reserve. In 2023/2024 the SRV contributed $3.97M to the capital program.
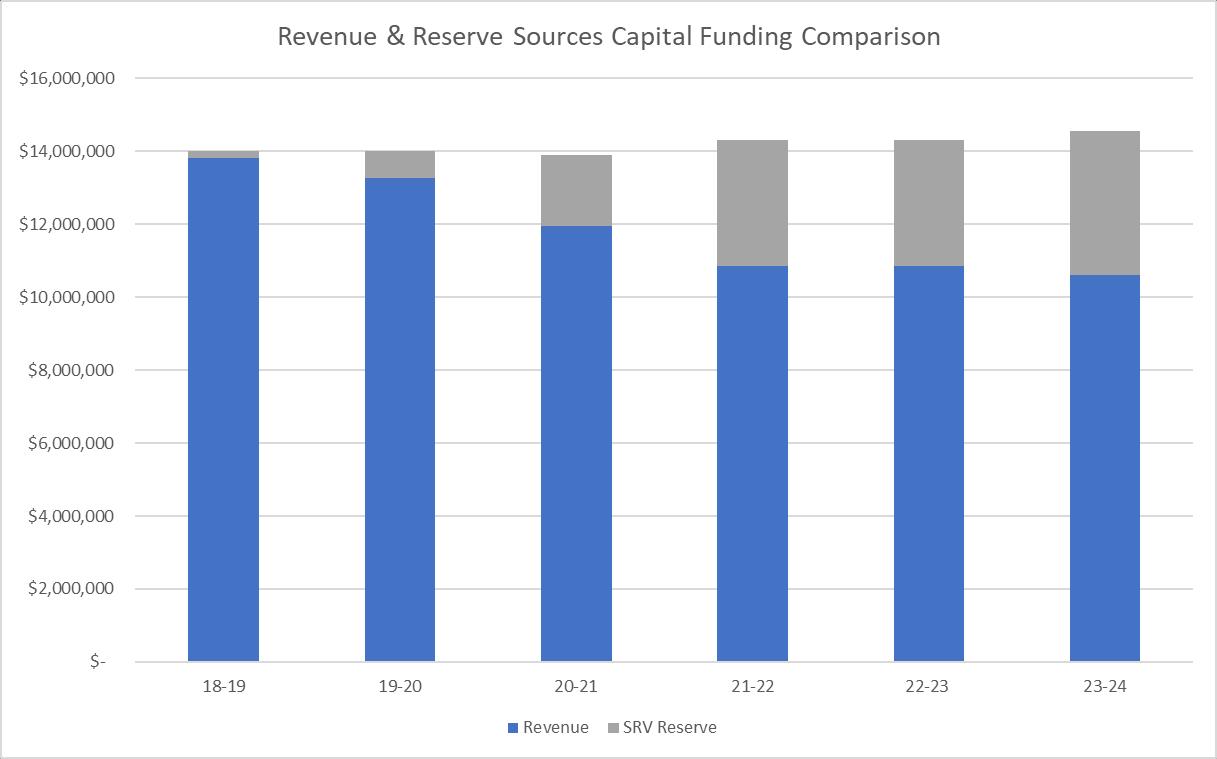
Figure 30 - Internal Revenue Source Funding for the Transport Capital Works Program
In 2022/2023, the Council resolved to apply a one-off amount of $7.5M to the capital program for road rehabilitation and major maintenance work. In 2023/2024, $6.618M and $9.29M were granted to Council from the NSW Government for pothole repairs and rehabilitation work. This additional unbudgeted funding was on top of all the other grant and natural disaster recovery funding that Council received. The full amount was used to undertake capital renewal projects, including insitu stabilisation, edge remediation and major heavy patching.
In general, the amount of funding from revenue or reserve sources has not kept pace with the inflation rate or relevant cost indexes. As a result, we rely more on external funding to meet our asset renewal needs. Last year, this support was sufficient to return positive renewal ratios on both Local and Regional Roads. However, the level of grant funding (of all types) received in that year dramatically exceeds anything we have previously seen. This will not continue and, therefore, should not be relied upon
MidCoast Roads Strategy 60
Transport Asset Renewal
Roads
Urban Roads
On average, we renew 39% of the urban roads that we should each year. Each year, the renewal shortfall is around $7m. As roads aren’t renewed, they require an increasing level of attention. Once the maintenance requirement is beyond what is considered routine, the road will deteriorate at an accelerated rate. In 2022/2023, the jump in renewals expenditure was due to the additional funding from both Council and grant sources. It had a positive impact on renewals, but they are still well below what is required
The 5-year average expenditure on rural road rehabilitation and resheeting is $3M of an expected need of $13M per year. This means that 69% of intended works cannot be undertaken Each year, the renewal shortfall is around $10M. Like urban roads, increased expenditure on rural roads in 2022/2023 due to unexpected external funding improved the situation but still needs to catch up to what is required over the longer term
MidCoast Roads Strategy 61
Figure 31 - Required Vs Actual Renewals - Urban Roads
Rural Roads (Sealed & Unsealed)
Figure 32 - Required Vs Actual Renewals - Rural Road Rehabilitation
Sealed Road (Urban & Rural Road Surfaces)
The average level of resurfacing on sealed roads is 48%. Each year there is a shortfall of $5.6M in capital renewal or just over half of what should be done The seal’s capability to prevent moisture from getting into a pavement is a critical factor in the lifecycle of road assets.
Without an effective sealing surface, the remainder of the pavement layers will quickly deteriorate. Not keeping up with the required level of resealing increases the magnitude of road rehabilitation required, further exacerbating the situation.
The condition of the road surfacing also directly impacts the skid resistance, ability to stop and safety of driving on the road. This is because the surface of the stone wears with time, progressively becoming smoother. This reduces the ability of drivers to keep their vehicles on the road, particularly in wet weather or in frosty conditions.
Therefore, the priority for immediate action must be to address the annual shortfall in resealing
Resealing roads is fundamentally critical in optimising the lifecycle cost of transport assets. As the bitumen ages, it oxidises and loses the ability to seal the road pavement against moisture. Once moisture can enter the pavement, potholes and other defects form rapidly. The impact of extended periods of wet weather in 2021 and 2022 is anecdotal evidence of the impact of historical underinvestment in resealing.
Resealing of bitumen roads is widely recognised as the single most important activity over the life of the road. This has been established through numerous research programs over decades. For comparison, resealing a road typically costs $6 – $8 per square metre. The cost to rehabilitate a road once the seal has failed is at least 10 times more than this. The figure below demonstrates this relationship. Whilst closing the annual renewal gap is important for all categories, resealing is an immediate priority which must be addressed.
The Council should immediately implement an ongoing program of resealing sealed roads equivalent to the average annual funding need. This should be adjusted annually to account for the actual cost increases in undertaking this work, with a further annual increase to allow for additions to the size of the network.
MidCoast Roads Strategy 62
Figure 33 - Required Vs Actual Renewals – Sealed Road Re-surfacing (Urban & Rural Roads)
A full cycle of resealing will remove the entire backlog of resurfacing works in one cycle over approximately 15 years.
This is the most cost-effective strategy to vastly improve the sealed road network to mitigate accelerated deterioration of the underlying structural road pavement and, most importantly, to reduce road-related trauma and save lives.
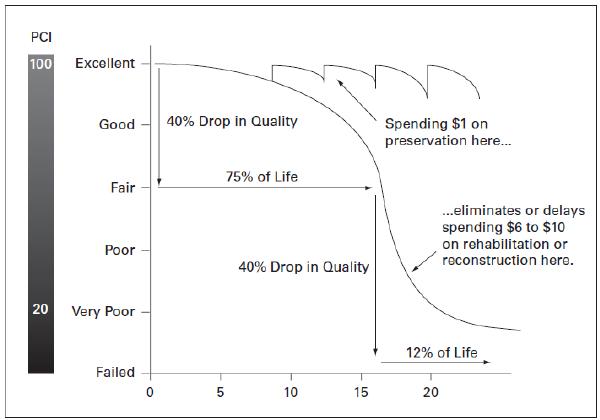
MidCoast Roads Strategy 63
Figure 34 - Relationship Between Pavement Condition & Intervention Costs (Galehouse et. al.)
Bridges
On average we have been replacing bridges 82% faster than they have been deteriorating. This is a good result. It reflects the risk and consequence of bridge failure and demonstrates that Council has a low-risk appetite for bridge failure. It also reflects that specific grant funding from the state and federal governments has been available for bridge renewals over the last decade to offset historic low replacement levels.
Since 2019 we have replaced 28 bridges, all of them with at least 50% grant funding and the majority of them with 90% or 100% grant funding. A further 11 renewal projects are in progress with four more being deferred in order to re-allocate limited grant funding to the replacement of Cedar Party Creek Bridge ($38M), Council’s largest remaining timber (trestle) bridge. Cedar Party Creek Bridge also poses very high risks, being on one of the busiest regional road links between Wingham and Taree and a B-Double access route for some of the region’s largest employers.
We still have 159 timber bridges to replace in the next 20 years Bridge replacement remains one of our key challenges.
MidCoast Roads Strategy 64
Figure 35 – Required Vs Actual Renewals – Bridges
Footpaths/Cycleways
We are only replacing 7% of footpaths at the rate we should. This is consistent with some of the concerns raised about poor-condition footpaths as part of our PAMP and Community Conversations. Most renewals occur where it is necessary in conjunction with road work projects for efficiency and positive community perception.
Footpaths are generally considered lower priority infrastructure compared to roads. They are longlived assets requiring minimal maintenance. Nearly 60% of footpaths are in good or very good condition. They are relatively younger assets in reasonable condition not requiring widespread renewal.
This leaves 2.9%, or approximately 4.8km, in poor or very poor condition requiring renewal. At the current rate of renewal, it will take 33 years to replace these sections. In that time, the percentage of footpaths in poor or very poor condition is likely to increase tenfold. The low level of renewals needs to be addressed in order to minimise future insurance claims.
Further work is necessary to understand the level of current defects and develop a program to ensure they are actively managed and not deferred
High pedestrian activity areas within our village and town CBDs are lacking in infrastructure or have very poorly designed footpaths and access arrangements that do not meet current standards, making it difficult for anyone with access and mobility limitations to use these areas. Further work is necessary to understand the areas where existing footpaths are not compliant or unable to meet the community's needs.
MidCoast Roads Strategy 65
Figure 36 - Required Vs Actual Renewals – Footpaths/Cycleways
Kerb & Gutter
On average we are only replacing 4% of the kerb & gutter we should be each year.
Like Footpaths/Cycleways, Kerb & guttering is generally considered low risk compared to the condition of the road network. However poor condition kerb & guttering will typically accelerate road pavement failure leading to greater impacts on the community and increased costs to rectify
37 - Required Vs Actual Renewals – Kerb & Gutter
Current kerb & gutter renewals are coordinated with the urban road rehabilitation program. It would not be worthwhile to rehabilitate the road pavement without properly fixing a source of moisture ingress into the pavement.
Over 100km of kerb and gutter is in a poor or very poor (failed) condition. In the worst examples, the underside of the kerb is visible, as the kerb has rotated almost 90 degrees since it was originally constructed. At the current rate of replacement, it will take over 250 years to replace these sections
An annual program needs to be developed and implemented to address this shortfall and reduce the impact this is having on road pavements. Failure to do so will lead to increasing numbers of irate residents who live with the impact of failed kerb and gutter and exposure to damage claims.
MidCoast Roads Strategy 66
Figure
Transport Maintenance Funding
Maintenance funding has been consistent, except for an increase of approximately $1.32M in 2023/2024. The budget increase was in response to recent cost increases that were particularly high in the transport sector. However, it remains approximately $1.5M below relevant benchmarks and $0.5M below the rate peg increases over the same period
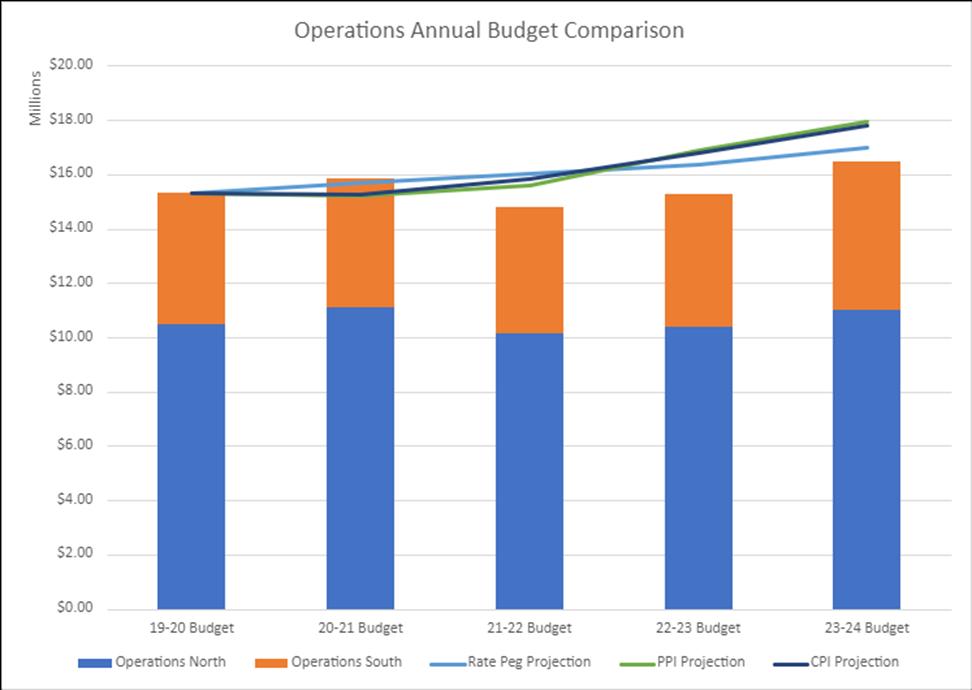
Figure 38 – Operations North & South Maintenance Budget Comparison
Despite an increase in 2023/2024, the budget is well below the increases in the rate peg or other relevant industry cost indices over the last five years. The physical volume of work that our maintenance team can achieve now is less than what they could do in 2019/2020. Therefore, the effort that we can put into maintenance is becoming increasingly constrained over time
To further exacerbate this situation, the length of the road network has grown by approximately 0.4% in this time through new and developer-provided assets. Whilst the new assets will have low maintenance demands for the first few years, continuing to ignore the expansion of the network with proportional increases in the budget will result in the new infrastructure being undermaintained (like the rest of the network), risking accelerated deterioration. A further $60,000 annual budget allocation is required to account for the additional network length.
Increases in population growth result in increased vehicle traffic on roads, leading to faster deterioration and greater maintenance demands. New growth provides additional rates income. A proportion of this income should be systematically directed towards road maintenance each year to counter the impacts of additional road length and traffic impacts.
This situation reflects the reality that maintenance funding has historically been limited by what is affordable or what can be funded from Council’s overall income. Rather than being driven by a series of work programs optimising asset life and responding to customer needs, our maintenance is trimmed to meet the available budget. Instead of being proactive, our maintenance program is becoming increasingly reactive. Considering the length of time that this has been occurring, it will take significant effort to rectify, as it is firmly entrenched in the operational staff culture.
The quarterly Transport Operations performance reporting demonstrates the level of funding that is reallocated from maintenance of low-risk areas/defects (like footpaths, carparks and drainage) to
MidCoast Roads Strategy 67
road surfaces, potholes or higher risk issues This is not desirable: without maintenance, the other asset classes will not last as long as they should and Council will be exposed to higher levels of risk
Cost projections continue to increase and a further budget increase will be required again next year to maintain the same maintenance outputs. Alternatively, we could reduce our service levels commensurate with the savings necessary to meet the available budget. However, recent experience demonstrated that reducing the level of service may not have broad community acceptance Unless this is resolved, the funding for maintenance will be increasingly prioritised, reducing proactive maintenance and efficiency.
The gap between what we can physically do and what we should be doing reduces the morale of our operational staff, who see firsthand the deterioration of the road network coupled with lower levels of relative funding. They know what they used to be able to do and what now needs to be done, yet their ability to do it continues to decline. They receive escalating customer requests amidst the increasing community expectations and often bear the brunt of the community's frustrations. The 2023 staff satisfaction survey is evidence of the impact of the current situation on our teams and the individual staff within them.
Incomplete, missed, delayed or deferred maintenance increases the rate of deterioration in asset condition, making the situation worse.
These are major psychosocial risk factors. We must align the maintenance expectations with what is reasonable for the available budget. We should be monitoring and reporting our performance against these expectations.
MidCoast Roads Strategy 68
Transport Maintenance Income Sources
In addition to general revenue from rates and fees/charges attributed to the road network care and management, NSW Councils receive the annual Federal Assistance Grant – Local Roads Component, the Roads to Recovery Program and the Regional Road Block Grant
The Federal Assistance Grant (FAG) – Local Roads Component
The ‘FAG’ grant (local roads component) is distributed through the NSW Grants Commission based on a funding formula that considers the length of the sealed and unsealed roads, number of bridges and culverts, rainfall, population, traffic levels and socio-economic disadvantage. To help sustain the local road network, Council needs to use these funds on roads maintenance, renewal and/or capital works
MidCoast Council receives the largest FAG Local Roads Component of any council in NSW (MidCoast - $6.8M), approximately $1.2m more than the next council (Central Coast Council$5.48M and Tamworth Regional Council - $5.35M). The higher grant level reflects our expansive road network, large number of bridges, challenging terrain, high rainfall and areas of high socioeconomic disadvantage
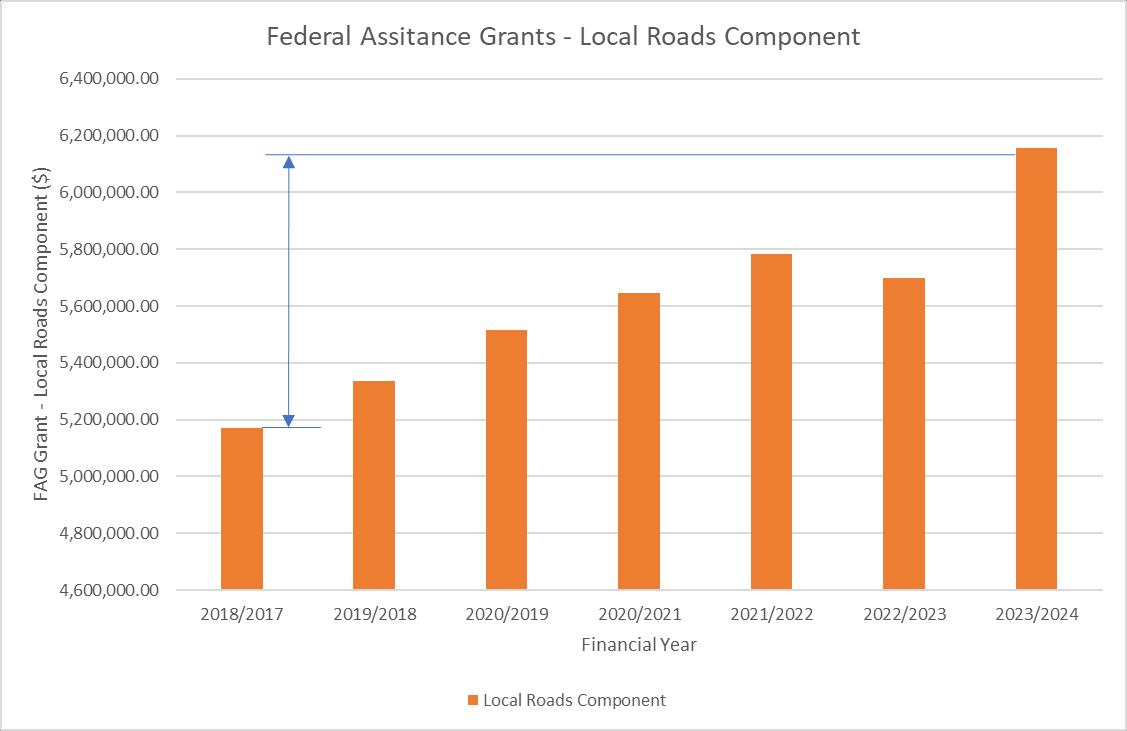
Since 2018, the FAG Grant – Local Roads Component for MidCoast Council has increased by approximately $980,000. This increase represents most of the $1.32M increase in the operations budget over the same period. As a result, the proportion of the budget funded from the FAG grant has increased from 36% to 38%
Council has supported the push by the Australian Local Government Association for FAG grants to be increased to 1% of national GDP and indexed annually. This is especially important in a road context where cost increases exceed CPI.
MidCoast Roads Strategy 69
Figure 39 – Financial Assistance Grant – MidCoast Council Local Roads Maintenance Component
Roads to Recovery
MidCoast Council received $16,962,314 under the Australian Government’s Roads to Recovery Program for the period 2019-2024 (or around $3.4M per year). There has been no annual adjustment to this allocation over the last 5-year period, meaning the value we can deliver is substantially less than five years ago.
These funds must be used on the local road network. MidCoast Council currently utilises its Roads to Recovery allocation for road rehabilitation projects to minimise the administrative burden of accounting and reporting the grant expenditure.
The new Roads to Recovery Program is expected to commence in 2025, with funding to double to $1B per annum across Australia by the end of the program in June 2029. This is a positive change which at least addresses the maintenance of funding levels in real dollar terms. We are yet to understand what that means for MidCoast Council.
The funding agreement for Roads to Recovery requires that all councils maintain or increase their own source funding. Based on our previous funding allocations, this is a risk that needs to be managed.
The Block Grant for Regional Roads
NSW Councils also receive a proportion of the funding pool for ‘preservation, restoration and enhancement works on regional roads, based on the relative length of regional roads in each local government area
Whilst preservation refers to maintenance, funding can also be directed towards capital renewal such as resealing and pavement rehabilitation or improvement at the discretion of the Council, provided a net community benefit is demonstrated. Overall, it is a source of funding intended to assist councils with the burden of managing regional road assets.
Similar to the FAG ((Local Roads Component) MidCoast Council received the largest allocation in NSW during 2023/2024 at $5.039M. This is around $1 million more than Clarence Valley Council ($4.04M) and Central Coast Council ($3.97M) The Block Grant is made up of the following components:
• Roads Component
• Supplement Component
• Traffic Component*
• Total (MidCoast Council)
$4,281,000
$323,000
$435,000
$5,039,000
* The traffic component may be spent on traffic management work on either regional or local roads
The overall maintenance budget for regional roads is $1.935 million. The Block Grant covers this, with the balance of $2 346 million of the Roads Component allocated to capital renewal works, including resealing and pavement rehabilitation and resealing.
MidCoast Roads Strategy 70
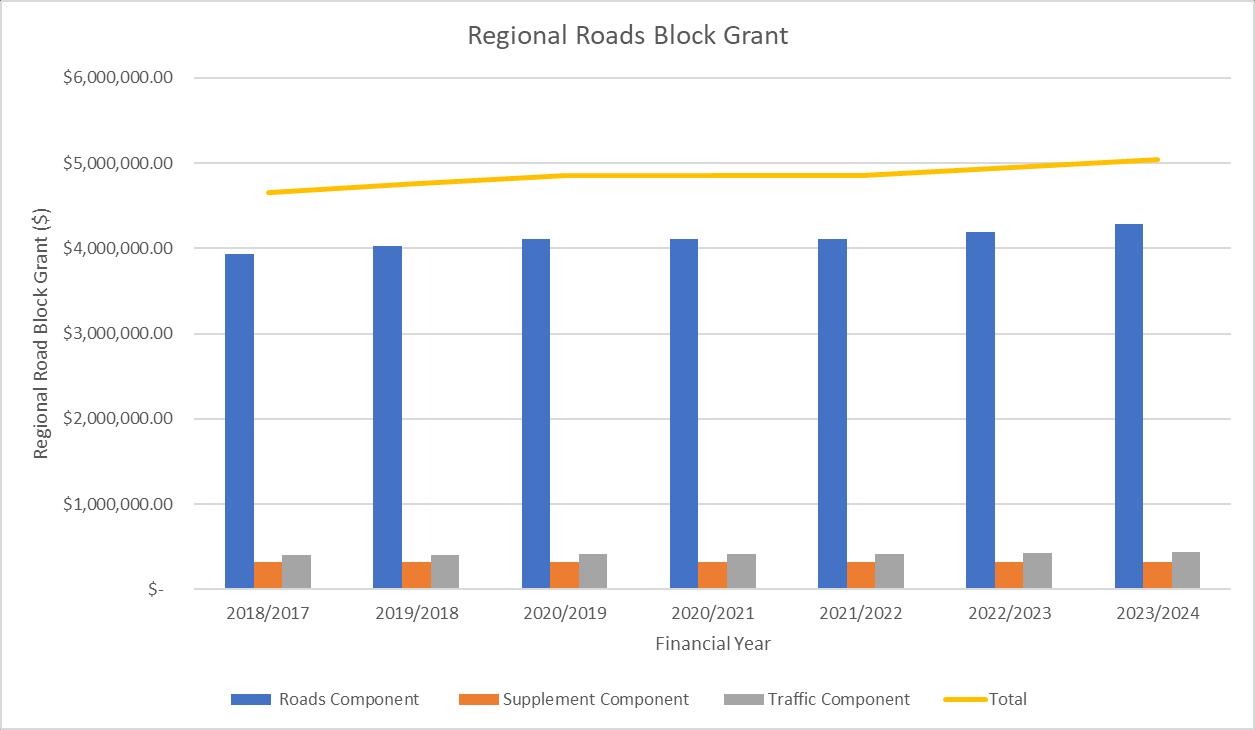
Since 2018, the Block Grant for regional roads has increased by $382,000 or 7.58%. This increase represents around half of the increase in the rate peg over the same time-period and even further below actual cost increases over the same period. Council should be lobbying for the block grant to be increased by the construction index (or at least the rate peg as a minimum).
Despite regional roads only making up 10% of the overall MidCoast road network, 43% of all crashes occurring on Council’s network, occurred on our regional roads.
These same higher order roads are more critical to servicing future growth, economic needs and to ensuring resilience during periods of wet weather and natural disasters.
This means that Council must develop specific maintenance and capital renewal and upgrade programs for our regional roads aimed at reducing this high level of road related trauma and improving resilience.
An important part of this planning must be establishing the required future state (or standard) for these higher order roads so that all efforts are working toward achieving that longer term goal. Additionally, linking these goals with the potential grant funding sources is key to attracting the optimum amount of external funding, including from new programs such as the Australian Government’s Disaster Ready Program.
MidCoast Roads Strategy 71
Figure 40 - Regional Roads Block Grant - MidCoast Council
Road Safety & Crash Statistics
The transport network connects 195 towns and villages via an expansive network of roads. Many road users travel long distances for work, shopping and leisure. They often travel alone as the driver and regularly at night, especially during the winter months
The distances and frequency of driving alone have resulted in the MidCoast area being overrepresented in statistics such as single-vehicle crashes. Our results are double the NSW average. The following information has been produced based on crash data available from the NSW Centre for Road Safety.
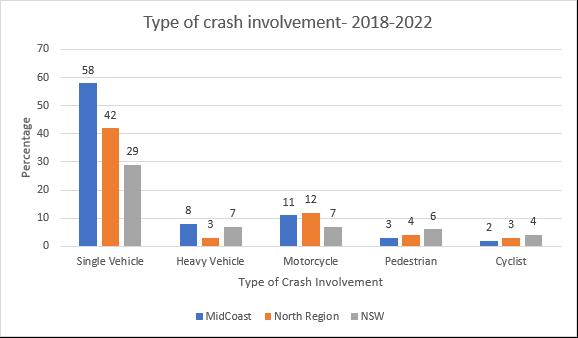
Crashes on the regional road network are also over-represented compared to the North Region and all of NSW. Renewal programs have focused on the regional road network as these are often the higher speed / higher volume roads forming the arterial network to our towns and villages. The majority of grant funding is typically received for regional roads. Crashes on unsealed roads are double the Northern Region and NSW state figures.
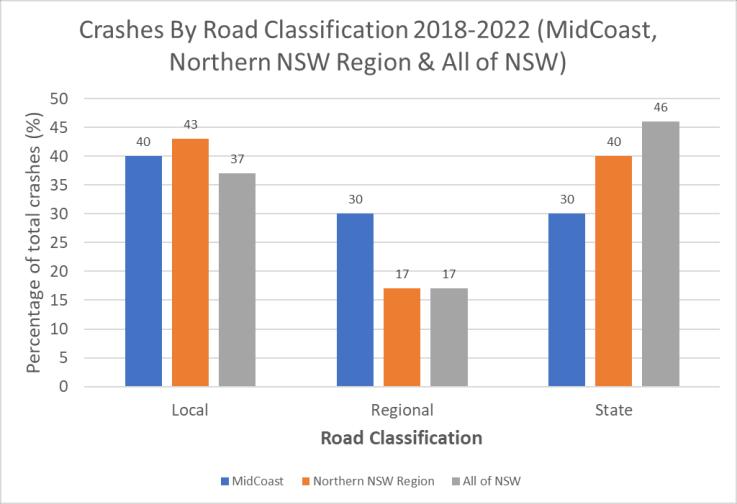
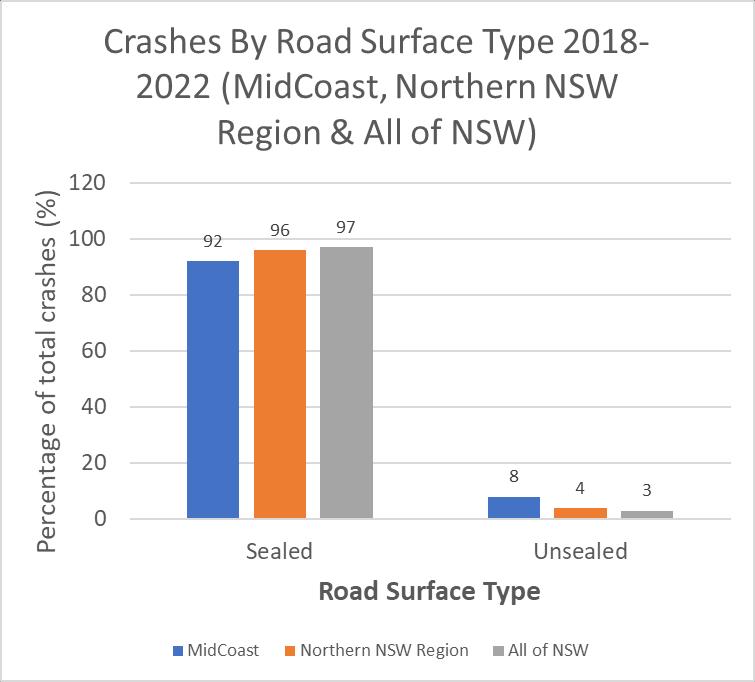
Of the crashes occurring on roads managed by MidCoast Council:
• 30% occur on regional roads which make up just 10% of Council’s network
• 40% occur on local sealed roads
• 8% occur on the unsealed road network
MidCoast Roads Strategy 72
Figure 41 - Types of Crashes 2018-2022
Figure 43 - Crashes by Road Classification 2018-2022
Figure 42 - Crashes By Road Surface Type 2018-2022
Maintenance, renewal and upgrade of these roads can influence the frequency and severity of road crashes. Council should therefore develop its own road safety plan using the safe systems approach, including specific actions on infrastructure under Safer Roads.
Excessive and inappropriate speed for the driving conditions is the highest contributing factor to road crashes in the MidCoast LGA. Speeding-related behaviour increases the likelihood and severity of crashes. Speeding contributed to 36% of crashes. This proportion is 33% more than the Northern Region and double that of NSW The condition of the road can adversely impact the frequency and severity of speed-related crashes
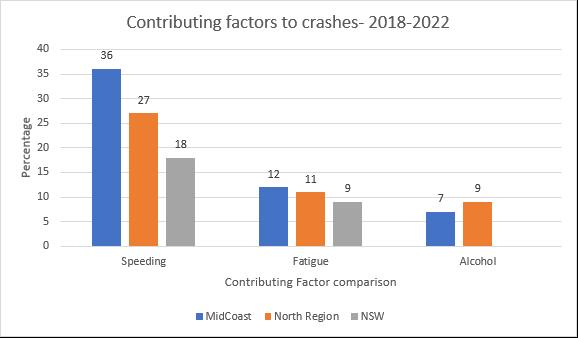
Off road crashes (on straight or curved road sections) account for 48% of our crashes. This crash type, combined with the other factors of speeding, single-vehicle crashes, and over-representation on the regional road network, highlights the challenges faced by our network. These types of crashes can be adversely impacted by seals in poor condition. Conversely, improving the condition of the seal has been shown to reduce run-off road crashes, particularly on curved alignments.
Crashes at intersections and rear-end collisions appear unusually low compared to other areas.
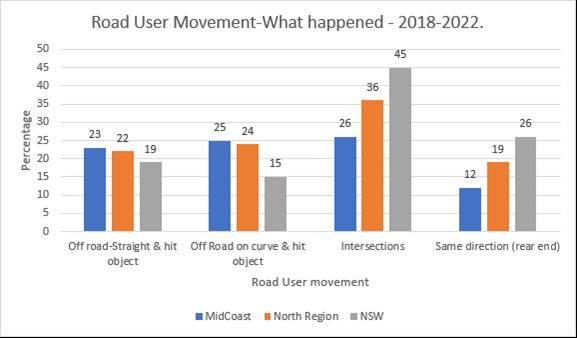
MidCoast Roads Strategy 73
Figure 44 – Factors Contributing Crashes
Figure 45 – Crashes by Movement Type
In the five years from 2018 to 2022, a total of 1,105 accidents were recorded on local and regional roads in the MidCoast area. Of these accidents 22 involved fatalities. Except for 2020 (data influenced by COVID lockdowns) the numbers and relevant proportions of accidents appear consistent across the five-year timeframe.
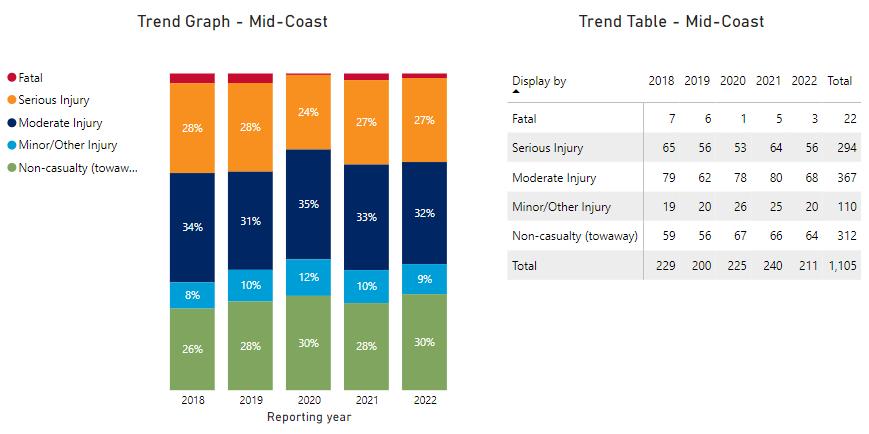
TfNSW's 2026 Road Safety Action Plan supports the four pillars of the Towards Zero - Safe Systems Approach. The four pillars of this approach are Safe Roads, Safe Vehicles, Safe Speeds and Safe People.
Being responsible for an extensive road network, MidCoast Council plays a primary role in delivering safe roads. The safe roads concept includes the sustainable maintenance, renewal and progressive enhancements to road infrastructure, such as wider sealed shoulders and the provision (or upgrading) of roadside safety barriers. This is in addition to safer road alignments that typify traditional road safety actions. The intention is to create a sympathetic roadside environment that reduces the likelihood of harm for road users.
The NSW Audit Office published the 2023 Performance Audit for Regional Road Safety findings. The audit found that:
• Regional NSW is four times more likely to have fatal road crashes than in Greater Sydney.
• Around 50% more severe injuries occur in regional NSW than in Greater Sydney.
• Regional areas have fewer transport options and the safety standard of vehicles is generally lower.
• Speed is the primary causal factor in crashes, more than any other factor.
• Road trauma cost regional communities $13.7 billion between 2016 and 2020, with 9,776 people killed or seriously injured.
The audit's conclusions were critical of road safety in NSW, citing that one-third of the state's population lives in regional areas. Yet, they make up two-thirds of the deaths reported in the state's road toll, a statistic that is almost the same as it was ten years ago.
The NSW Road Safety Strategy 2012–2021, the NSW Road Safety Plan 2021, and the NSW Road Safety Action Plan 2022–2026 acknowledge disproportionate road trauma on regional roads. Of people who died on roads between 2012 and 2022 in regional areas, 70% of these were local residents of those areas.
MidCoast Roads Strategy 74
Figure 46 - MidCoast Crash Data by Severity - Excluding State Roads/Highways
TfNSW has state-wide responsibility for managing road safety outcomes and partners with local councils through the Local Government Road Safety Program. The audit recommended that a regionally focused implementation plan be developed, which TfNSW has accepted.
In 2023, The Commonwealth Government published their response to the Joint Select Committee on Road Safety report, Driving Reform: Final Report for the Inquiry into Road Safety. The report and the Government's response reflect the issues raised above and echo the need for all levels of government to collaborate and lift the focus on road safety in regional areas.
At a local level, further work is necessary to shift the focus from being almost wholly asset condition-centric towards being proactive for road safety. The reliance on accident statistics to determine investment priorities must change. Safer roads, by definition, are also more resilient roads.
The NSW Roads and Transport Directorate (a partnership between LGNSW and IPWEA NSW/ACT) has developed guidelines for councils to develop their own road safety plan. These guidelines recommend that councils adopt a safe systems approach to road safety consistent with both the NSW and Australian frameworks. It is recommended that any council road safety plan clearly outlines those actions that fall to Local Government and those that do not. For instance, determining programs for state highways, speed zoning and general policing are all the responsibility of the NSW Government.
Through the recovery from both bushfires and floods, the quality of our rural roads, particularly collector roads, was consistently raised as a concern by the community. Having a safe road connecting rural areas to larger towns is a significant factor influencing a community's resilience. Further, roads with better alignments, wider cleared verges and properly sealed shoulders are safer for road users in all conditions. They are also less likely to suffer damage during a natural disaster and easier to repair.
The preparation of our roads can also have a significant impact on the safety of our first responders and workers, especially during and immediately following natural disasters. Additionally, it is far safer to undertake works in a pro-active planned manner than in response to call-outs often in the middle of the night, or when the roadway has been significantly impacted.
One of the most prominent factors is the condition of the existing delineation controls or their absence on some roads. Centreline marking guides drivers, helping them stay on the right side of the road. Where collector roads are unmarked, drivers tend to creep across the middle of the road to improve rideability through curves or avoid rougher edge sections. Where one vehicle meets another, there are often near misses attributed to the fault of one driver or the other.
Further, studies worldwide have shown a significant reduction in accidents where edge line marking is implemented. A review by the Texas Transport Institute found the benefit-cost ratio (BCR) of adding edge lines to two-lane rural roads (500 vehicles per day) is around 17:1. Higher traffic levels generated significantly greater BCRs.
For MidCoast, line marking is often only undertaken as part of new work. More often, it is not replaced as the road surface condition is poor. Guideposts are installed with new work and only replaced if missing from high-risk locations and reported or separately identified as being dangerous
A line marking renewal and guidepost replacement program should be commenced immediately with a further review of situations warranting edge marking or using raised reflective pavement markers (RRPMS) to improve delineation of the road surface in all weather conditions
Development of a specific Road Safety Plan for MidCoast Council is recommended.
MidCoast Roads Strategy 75
It is also recommended that Council undertake an AusRAP assessment of regional, distributor and select collector roads. This assessment will provide a Star rating of the existing major road network to assist in identifying appropriate treatments to improve overall road safety.
It is important that any decisions regarding road safety improvements are integrated to consider other objectives such as road renewal activities, route resilience, capacity, freight movement and in urban areas, liveability objectives
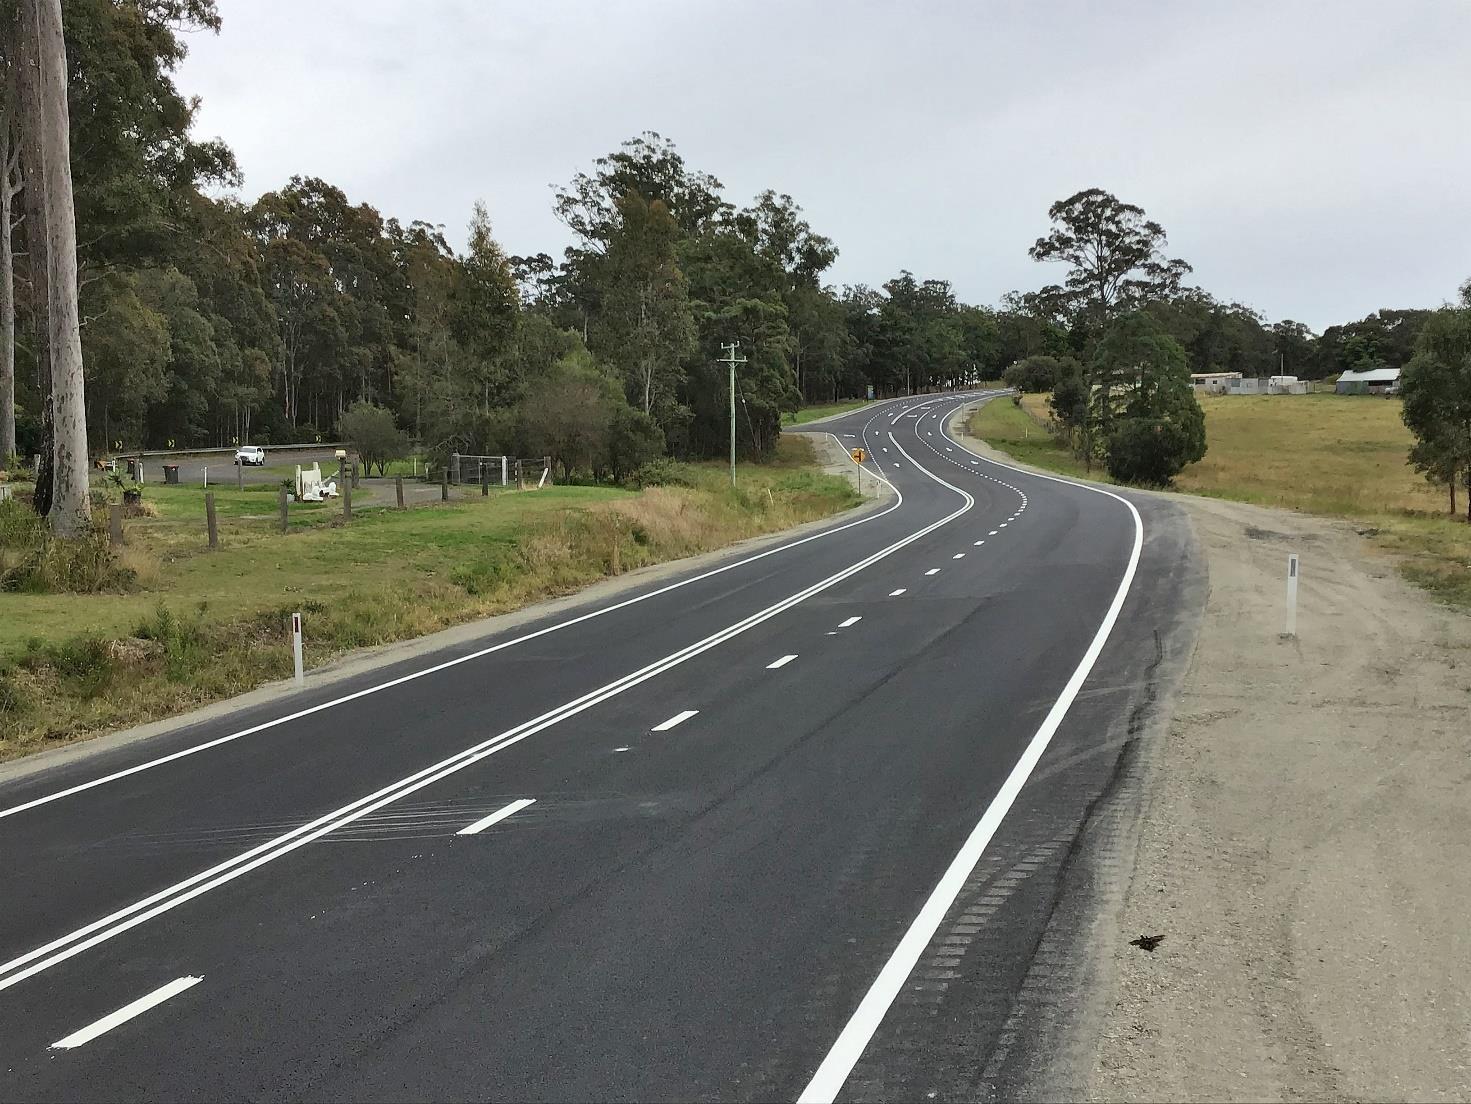
MidCoast Roads Strategy 76
Community Satisfaction
MidCoast residents have consistently rated the condition of local roads poorly compared to the other services. Council implemented the $100M Roads Program following initial feedback after the merger to address these concerns. Council has also received other significant grant funding over the last four years.
Initially, the additional funding for renewal across the regional road network provided benefits. However, the continued lack of investment in maintaining or renewing local roads (the roads closest to resident’s homes) has strongly influenced the survey results. In the most recent 2023 survey, the impact of unusually wet weather over the previous two years across a road network in poor condition has dramatically impacted satisfaction levels
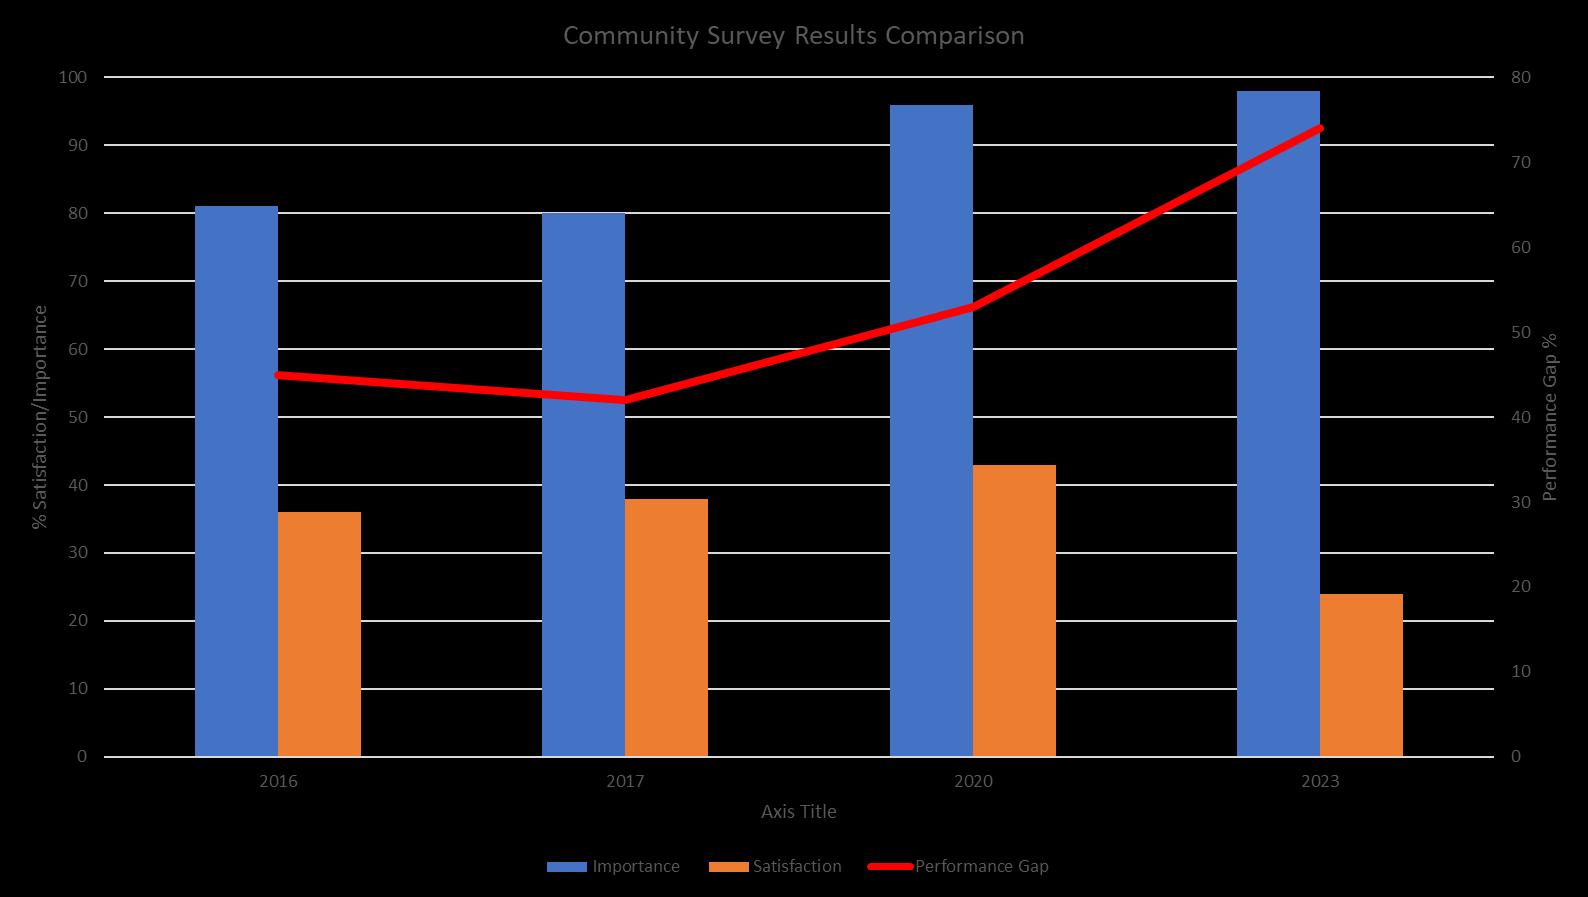
These results suggest that further effort is necessary on the local road network to address the growing dissatisfaction. Community concern over roads and transport assets dominated the 2020 and 2023 surveys with high importance and low satisfaction. Between 2016 and 2023, the gap between importance and satisfaction widened from 42% to 72%. This gap is significantly higher than any other function measured in the survey.
The areas identified for improvement included:
• Maintaining local roads
• Overall condition of the local sealed road network
• Maintaining local bridges
• Maintaining footpaths
• Stormwater Drainage
Notably, the 2023 survey identified roads as one of the significant barriers to community satisfaction. Practical evidence of this exists on Council's social media channels, where negative comments relating to road issues are added to totally unrelated posts
MidCoast Roads Strategy 77
Figure 47 - Comparison of Community Survey Results - Satisfaction v's Importance for Roads
Customer Requests
Road maintenance requests are essential to ensure a safe and efficient road network. Since January 2021, we have recorded and managed requests in our corporate system. While this shows the overall number of requests, we cannot analyse it to any significant degree because of how the data is structured.
Our reconfigured system went live on 4 December 2023 and over the next twelve months, we should be able to derive more significant insights into the types and frequency of requests. We are also working on a major project to uplift the whole transport asset function into the system for defect management while bringing field mobility and crew management functions online.
The table below shows our data for Operations North and South. These requests include anything from pothole repairs to road resurfacing or drainage issues
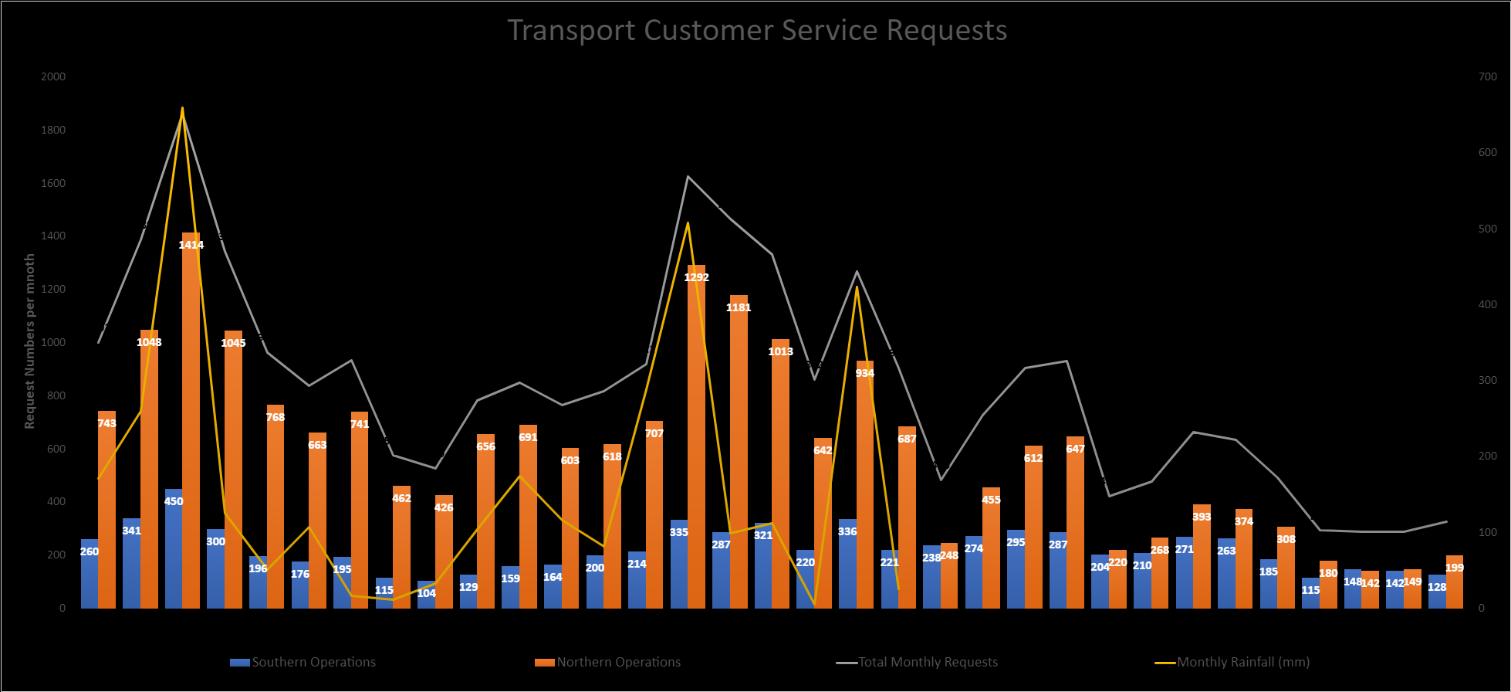
It is not surprising that there is a strong trend between rainfall and requests. The condition of our roads is highly vulnerable to rainfall due to renewals not keeping pace with the deterioration of the network. When it rains, moisture enters the road pavement, quickly forming potholes and other defects.
Both 2021 and 2022 were particularly wet years with several major flooding events, including a 1% Annual Exceedance Probability (AEP) event in March 2021 (commonly referred to as a 1 in 100 year event). We also recorded the highest amount of rainfall in a day in July 2022
We do not currently have a defined set of service levels that demonstrates our response standards or intervention levels. Each request is assessed for risk and considered against our other priorities. This is how we have continued to operate in an environment where the resource limits continue to tighten with consistent annual budgets and significantly increasing costs.
Prioritising responses within available resources and funding provides a defence against liability but has adverse customer outcomes. When a customer is dissatisfied with the time taken to rectify an issue, they will generate new requests, often with an increasing frequency. Alternatively,
MidCoast Roads Strategy 78
Figure 48 - Total Customer Service Requests by Month - Operations North & South
requests escalate through the Mayor, Councillors, General Manager or Director. Whilst this should have no bearing on the priority, a common outcome is that we fix non-critical issues simply because staff wish to avoid causing any more concern at higher levels.
There are examples of customers using repetitive requests or escalating their requests to intimidate staff into acting and then promoting other residents to do the same. The impact of this behaviour is increasing psychosocial risks in our workplace.
Overall, the current situation makes the organisation more reactive, reducing proactive maintenance planning, increasing customer dissatisfaction and increasing inefficiency. Further work is necessary to determine the achievable intervention levels with the available funding and resources.
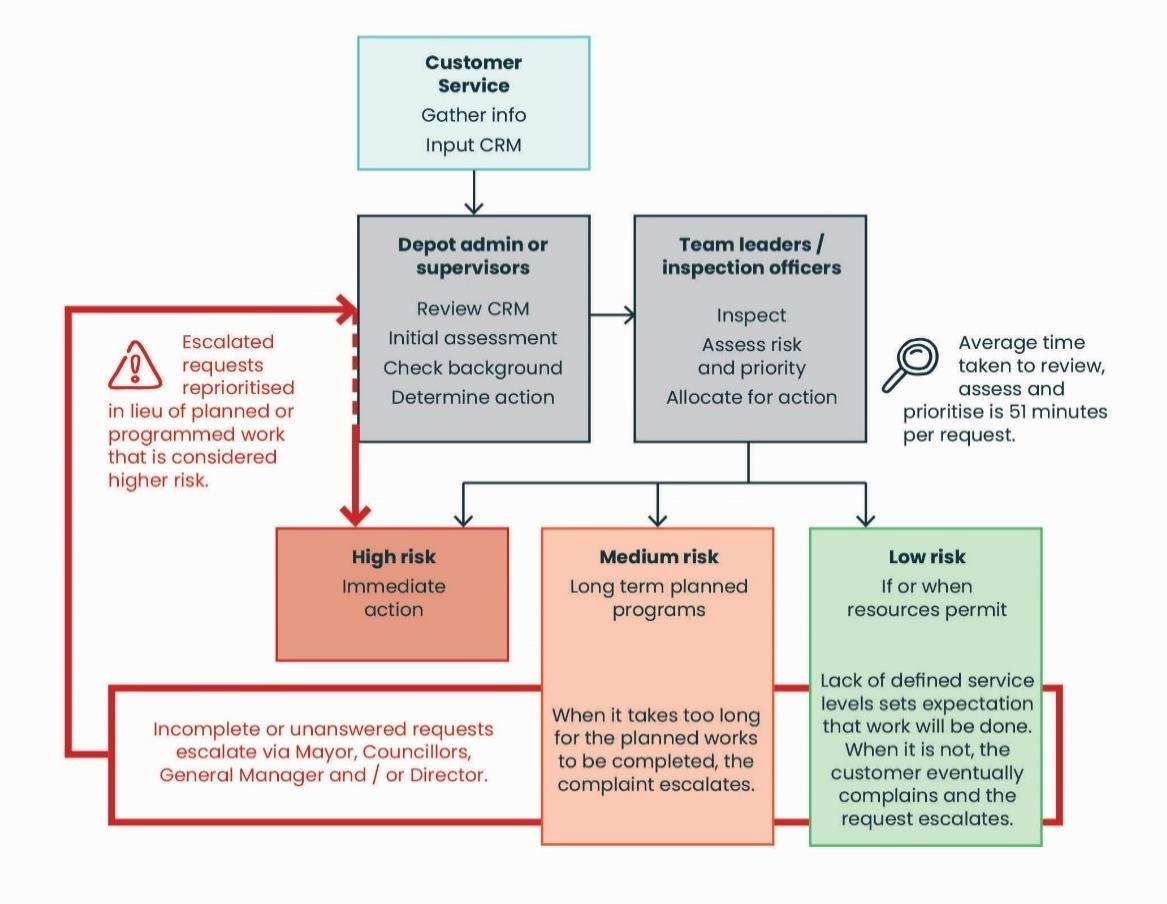
Significant work has gone into the Customer Experience strategy, particularly around journey mapping for transport customers. The comprehensive action plan that underpins the strategy and journey map will provide a basis for improvement in this area. The rise and use of artificial intelligence have the potential to revolutionise how we manage and respond to customer requests completely. Implementation of both these initiatives is strongly supported
It is recognised that the use of AI to identify defects creates a challenge for councils, as the hazard is then known to Council. Therefore, Council’s risk policies, systems, work prioritisation and quality of repair must be implemented diligently and matched to the available resources to mitigate potential public liability under the Civil Liabilities Act 2002.
MidCoast Roads Strategy 79
Figure 49 - Risk Prioritised Works Management Model & Request Prioritisation/Escalation
Transport Maintenance Intervention Levels
The level of maintenance funding allocated in previous years has been the primary factor in determining how we respond to defects in the system. The work done or managed per year matches the budget allocated. As the budget has not increased in line with costs over a long period, proactive maintenance programs have been scaled back or ceased. Urgent work remains prioritised, with low-risk work only being done if it escalates to senior management or Councillors.
There is a need to set performance standards for inspections, defect intervention levels and maintenance response times to support public safety, protect road infrastructure assets and ensure appropriate protection against civil liability claims.
Council’s maintenance budget is insufficient to meet current best practice guidelines developed by our insurer, Statewide Mutual.
To meet best practices, we must determine the standards for inspection, maintenance, and repair of public roadways, pathways, road infrastructure and road-related infrastructure assets. Council can set the performance standards for the following operational functions in public roads, paths, and ancillary areas:
• Inspection program.
• Defect intervention level; and
• Response time.
Proactive Inspections
Proactive road inspection programs are undertaken to identify defects and obtain condition data on the road infrastructure. The information gained from these inspections is used to prioritise maintenance activities and to develop future capital works programs. Collector and arterial roads tend to be inspected regularly. Local access roads are inspected if a defect is reported, and even then, inspections can be sporadic. Most inspections are unplanned and linked to external customer requests.
It is recommended that all roads are formally inspected on a scheduled basis, including at least once per year for lower hierarchy roads (such as local urban and unsealed roads). This inspection should include transverse drainage structures.
Intervention Levels
Intervention levels are trigger points in determining whether repair work needs to be done. As a general practice, intervention levels are constantly monitored to reflect changing conditions and the remaining budget. Early in the year, backlog works from the previous year are completed. As the financial year progresses, intervention levels are progressively raised to restrict expenditure and meet the budget.
Response Times
Initial response times following a reported hazard or identified failure of an asset reflect the immediate risk to road users. Dangerous conditions are inspected within 24-48 hours. Less significant issues are inspected when staff are next in that area or within 10 working days (as detailed in the MidCoast Council Customer Charter). Previously reported requests that were initially responded to may not be actioned for two to three weeks unless the risk has substantially increased. This should be measured and reported as part of the monthly reporting.
MidCoast Roads Strategy 80
The inspection process involves:
• An assessment of risk and, if required, installation of temporary control measures such as barricades and signs.
• Determining whether repair works are to be carried out.
• Organise immediate repair works where necessary or schedule repairs with other planned work.
• Listing of the low-risk defect for monitoring in future inspections and consideration of repairs if funding allows.
Defect Evaluation
We collate defect information to enable a comparison of the risk level posed. The risk ranking prioritises what we maintain within the resources available.
Defects are assessed against three criteria addressing:
• The location of the damage within the road (shoulder, median, lane, whole)
• The road hierarchy, whether an urban or rural road, and
• The hazard type is assessed for sealed pavements, unsealed pavements, or signage and roadside furniture.
Common hazards have an adopted risk factor, which, together with the location and hierarchy level, allow the Road Risk Rating (RRR) to be calculated for the defect. Risk factors for typical hazards are shown in the table below
The RRR is calculated:
MidCoast Roads Strategy 81
Road Risk Rating (RR) Location Factor Road Hierarchy Factor Rating (RR) Hazard Category (1-5)
Description of Hazard
Obstructions and substances on road
Small sized object with a maximum dimension of < 100mm
Medium sized object with a maximum dimension between 100 and 200mm
Large sized object with a maximum dimension of greater than 200mm X
Spilled materials on roads
Moderate spills of granular materials X
Large spills of granular materials, any spills of oil or other slippery substance X
Large spills of oil, wet clay or other slippery substance X
Potholes
Pothole diameter 200mm to 300mm and/or depth of 50mm to 75mm X
Pothole with diameter > 300mm and/or depth > 75mm
Shoving and/or rutting
Deformations 50mm – 100mm deep and > 4m long
Deformations > 100mm deep and > 4m long and/or ponding hazard X
Edge drop and pavement joints
Drop 50mm to 75mm and > 5m long X
Drop 75mm – 150mm and > 5m long X
Drop > 150mm and > 5m long
or in a critical location
and safety fencing
or in a dangerous condition or location
Longitudinal line markings, transverse markings, pavement symbols and pavement markers
Missing or illegible or in a non-critical location
Missing or illegible or in a critical location
MidCoast Roads Strategy 82
Category 1 2 3 4 5
X
X
X
X
X All other signs
X Missing
X ROADSIDE
Guideposts In poor condition X Missing X In a dangerous
location X Delineation In poor
X Missing
X
X
X
X Missing or illegible
In poor condition
or illegible
FURNITURE
condition or
condition
Guardrail
In poor condition
Missing
ROAD MARKINGS
X
X
Figure 50 - Defect Evaluation - Road Hazard Risk Factors
The action taken is based on the calculated Road Risk Rating (RRR) as detailed in the table below
10 to 14
15 to 18
Figure 51 - Road Risk Ratings & Response Timeframes
MidCoast Roads Strategy 83
Road
Priority Control Mechanism MCC Response Time
Low No further action Not
Risk Rating
9 or less
applicable
Medium Scheduled
into maintenance works program As resources permit
High Inspect by competent person
make safe Effect repair Within 5
Within
Urgent Inspect by competent person and make safe Effect repair Within 48 hours Within 4 weeks
and
days
6 months >18
2022/2023 Performance
Our performance was formally reported to Council with the following providing a brief summary.
Asset Performance Ratios
Local Roads Renewal Ratio - 1.52
Local Road Backlog Ratio – 8.21
*Local roads influenced by the $7.5m, part of the $6.6m, LRCI, FLR and ND Resilience projects
This was the first year that the renewal ratio for local roads exceeded the benchmark of >1. The positive result reflects the one-off funding through various grant programs and the Council’s $7.5M program, which was funded from general revenue. The LTFP does not project this level of funding in the future as this level of external funding will not continue. The positive result this year was primarily due to external funding. We are heavily reliant on external funding
The local road backlog is concerning. It is four times greater than the benchmark of <2, indicating that we would need to maintain a renewal rate greater than 1.5 for more than 10 years to reduce the backlog to near the backlog benchmark level. Typically, we renew less than a third of the amount we did this year, which is well short of what is required to stop the network deteriorating further.
Regional Road Renewal Ratio – 9.07
Regional Road Backlog Ratio – 4.73
The results for regional roads reflect the level of external funding available for these roads through one off programs like the $100M, as well as recurrent annual funding like the Regional Road Block Grant and Repair Grant Hence, they have performed significantly better than local roads on renewal and backlog ratios This level of renewal will not continue as the current level of grant funding reduces in future years.
Bridge Renewal Ratio – 3.59
Bridge Backlog Ratio – 1.14
Similarly to regional roads, significant state and federal funding for bridge renewals has provided good results, with both the renewal and backlog ratios exceeding the benchmarks. This also reflects the low-risk appetite for the failure of these assets. Typically, the renewal ratio has been around 1 in the past.
Maintenance Outputs
The following outputs were recorded by our operations teams:
• Unsealed Road Maintenance Grading – 1,327km (~ 75% of the unsealed network)
• Unsealed Road Gravel Patching – 27,000 Tonnes
• Unsealed Road Gravel Resheeting – 111.25km (~ 6.31% of the unsealed network)
• Unsealed Road Shoulder Mowing/Slashing – 455km (~ 25% of the unsealed network)
• Sealed Road Shoulder Mowing/Slashing – 811km (45% of the sealed network)
• Roadside Weed Spraying – 407.8km
• Signage Repairs & Installation – 740 accomplished jobs
• Sealed Road Pothole Patching – 4062 Tonnes (~ 35,361m2 or 5 lineal Km)
• Sealed Road Heavy Patching – 33,410m2 (dig out/replace or insitu-stabilise
This provides a benchmark to compare with future years and also a starting point for developing our levels of service. We still need to refine what the outputs mean in terms of both routine and preventative network maintenance. Further work is required to gather and analyse more information before intervention levels can be set.
MidCoast Roads Strategy 84
Budget Expenditure
The final expenditure, excluding commitments, exceeded the budget by $349,771 or 2.3%. To control the budget expenditure, non-essential maintenance was delayed during the second half of the year. Despite the best efforts of our teams, we were not able to defer or prioritise maintenance works to avoid over-expenditure Over-expenditure remains a risk for 2023/2024, even with an increase in the budget, due to the magnitude of price increases over the last two years, the previous deferral of maintenance and the lower level of natural disaster and emergency road repair grant funding.
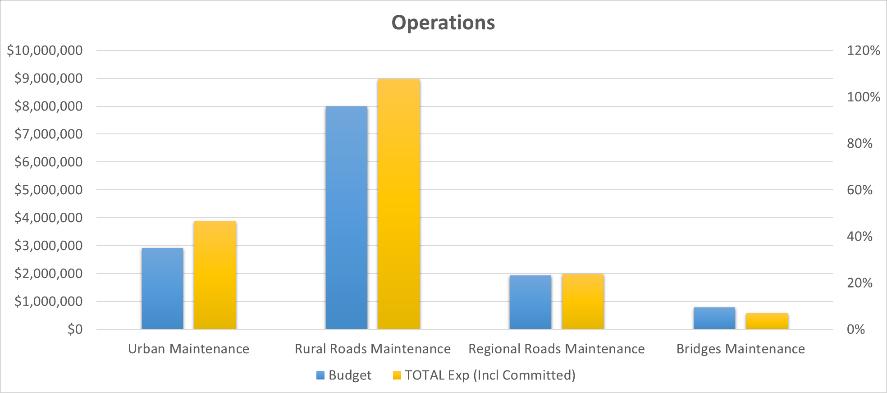
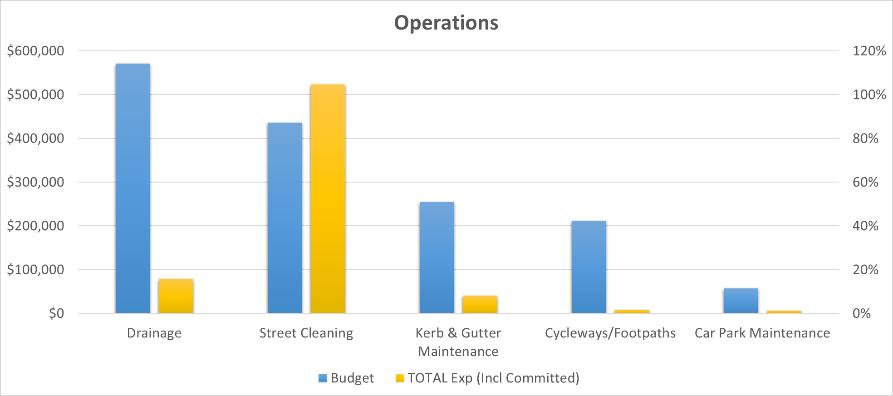
Over-expenditure is greatest on road maintenance, partly offset by under-expenditure on drainage, kerb and gutter, footpaths/cycleways and carpark maintenance. This situation adds to increasing future risk, as normal maintenance is not being done on some transport assets.
MidCoast Roads Strategy 85
Figure 52 - Transport Operations 2022/23 Maintenance Budget (before audit & end of year processes)
Figure 53 - Transport Operations 2022/23 - Maintenance Budget Vs Expenditure
Operations Original Budget Monthly Movements Budget YTD Actual YTD Comitted TOTALExp (Incl Committed) Funds Available % Spent UrbanMaintenance $2,678,046 $237,000 $2,915,046 $3,742,593 $124,686 $3,867,279 -$952,233 133% RuralRoadsMaintenance $8,218,167 -$222,500 $7,995,667 $8,713,866 $255,186 $8,969,052 -$973,385 112% RegionalRoads $1,935,000 $0 $1,935,000 $1,851,712 $129,124 $1,980,836 -$45,836 102% BridgesMaintenance $784,284 $0 $784,284 $573,737 $4,085 $577,822 $206,462 74% Drainage $576,100 -$5,000 $571,100 $72,121 $6,620 $78,741 $492,359 14% StreetCleaning $442,500 -$7,000 $435,500 $513,974 $9,211 $523,186 -$87,686 120% Kerb&GutterMaintenance $256,007 -$2,000 $254,007 $34,008 $6,520 $40,528 $213,479 16% Cycleways/Footpaths $211,800 -$500 $211,300 $0 $8,007 $8,007 $203,293 4% CarParkMaintenance $57,000 $0 $57,000 $6,665 $0 $6,665 $50,335 12% TOTALBUDGETVS EXPENDITURE $15,158,904 $0 $15,158,904 $15,508,675 $543,439 $16,052,114 -$893,210 106%
Strategic Risk Review
We have completed comprehensive risk reviews as part of MidCoast Council’s Risk Management Policy and Framework across each of our departments. We found that, whilst some risks were specific, several key risks were common throughout the departments. They fell into the following categories:
• Inability to deliver transport asset renewals in the medium to long term due to underfunding.
• Community expectations increasing while funding to deliver is not keeping pace with costs (in real terms).
• Rate pegging continues to hold revenue growth below the cost increases for asset delivery (maintain, repair, renewal).
• Failure to adequately identify and prioritise defects in accordance with available resources
• Natural disaster events negatively impact existing programs, budgets and resource availability
• Agreed Capital Works Program not delivered in accordance with allocated budget and timeframes
• Failure to deliver maintenance works within the allocated budget and timeframes
• Inadequate IT system implemented to support maintenance management (programming, delivery and recording of maintenance)
• Staff and contractor incidents and injuries
• Climate change impacts are poorly understood, with the risk of unexpected impacts realised (Heat, solar radiation, sea level, temperatures etc
• Community expectations increasing outside of historical areas for delivery, including active transport, micro mobility and road safety
Further work is necessary to finalise a Strategic Risk Management Plan for the Transport and Engineering function that includes actions to mitigate the identified risks across the section, rolled up from the work already done across the four individual management areas
MidCoast Roads Strategy 86
Current State Summary
The current state of our transport assets contains some positive aspects that have been overshadowed by low historical levels of renewal and particularly resealing. We have inherited challenges from the historical way our road network has expanded, where multiple campaigns delivered a lot of new assets over relatively short time periods. These assets are now in their first renewal cycle
We have experienced growth in the demand for and use of roads well beyond what was originally envisaged. Traffic numbers and loads have outstripped what our older roads were designed for as has the frequency and intensity of heavy vehicles. Waste collection with larger vehicles, multiple weekly collections and the shift to left hand drive, single driver operation has been one of the most significant changes. The rate of change will continue, with higher mass limit vehicles challenging fixed infrastructure to move more freight with less.
The road condition data shows that 28% of the sealed road segments are in poor or very poor condition, while 25% of the network surface is affected by cracking. The relatively high proportion of surface age results in the ‘poor’ and ‘very poor’ categories is a critical indicator. This shows that the current situation of inadequate levels of resealing has led to the deterioration of pavement conditions and high levels of roughness. This will be contributing to the above average levels of single vehicle accidents on our roads.
The total replacement cost of transport assets is $2,029,129,928, with a depreciation cost of $30,707,868 per year. The fact that 34% of the total transport asset value has been depreciated indicates that over a third of the condition of all assets has deteriorated, which is beyond the range for optimal management of road assets. There is a need for ongoing maintenance and upgrades to ensure road safety and community satisfaction.
Additionally, the results suggest that targeted heavy patching programs could help improve the network's condition. Targeted cyclic capital renewal programs need to be implemented to address specific areas of concern, such as the surface age.
Another strategy that can be employed is to implement a crack sealing program. This program would help contain the impact of cracking on existing pavements in good condition and prevent further deterioration of the pavement condition.
Improving road safety should be a priority. Little improvement has been achieved in the past. Further analysis of the transport network is required together with a specific road safety plan for the MidCoast regions with suitable actions. Resealing existing sealed roads is an important road safety measure to ensure good skid resistance and lower numbers of hazards due to surface defects.
The maintenance budget has not kept up with cost increases Greater funding is needed for cyclic capital renewals and basic asset intervention programs before the situation gets worse and the backlog increases any further.
Maintenance budgets, inspections, intervention levels and service standards require alignment. Whilst there is quarterly reporting, this needs to be adjusted as more data becomes available Inspections and defect management need auditing against StateCover’s Best Practice Guide and the polices adopted by council.
Recent experiences through successive natural disasters need to be considered. Whilst funding arrangements are in place for repairs, waiting for design, approvals and repairs can have a substantial impact on residents. Further analysis is required of the damages, root causes and potential preventative actions. This would inform strategies to build resilience into future projects and strategies.
MidCoast Roads Strategy 87
Further work is required to complete a strategic risk review across Transport Assets to ensure risks are being actively managed. Considering the current projections for renewal and maintenance funding, managing risk through prioritising resources will be Council’s only defence against the likely increase in claims and community dissatisfaction.
We need to continue driver engagement, education and awareness programs, improving road infrastructure, encouraging active transport, prioritising maintenance/upgrades, implement targeted maintenance programs and embrace new technology to help improve the transport network's efficiency, safety and sustainability.
It is widely recognised, including by the World Road Association, that frequently resurfacing and reconditioning roads leads to the lowest life cycle cost and improves safety and community satisfaction. The more we can afford to spend now the less it will cost us in the future.
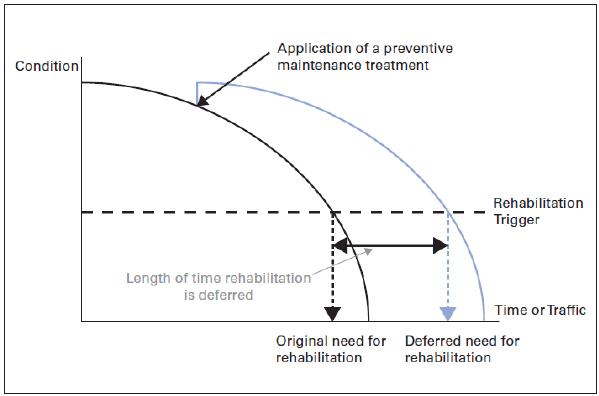
MidCoast Roads Strategy 88
Figure 54 - Relationship Between Early Intervention & Deferral of Future Rehabilitation (World Road Association)
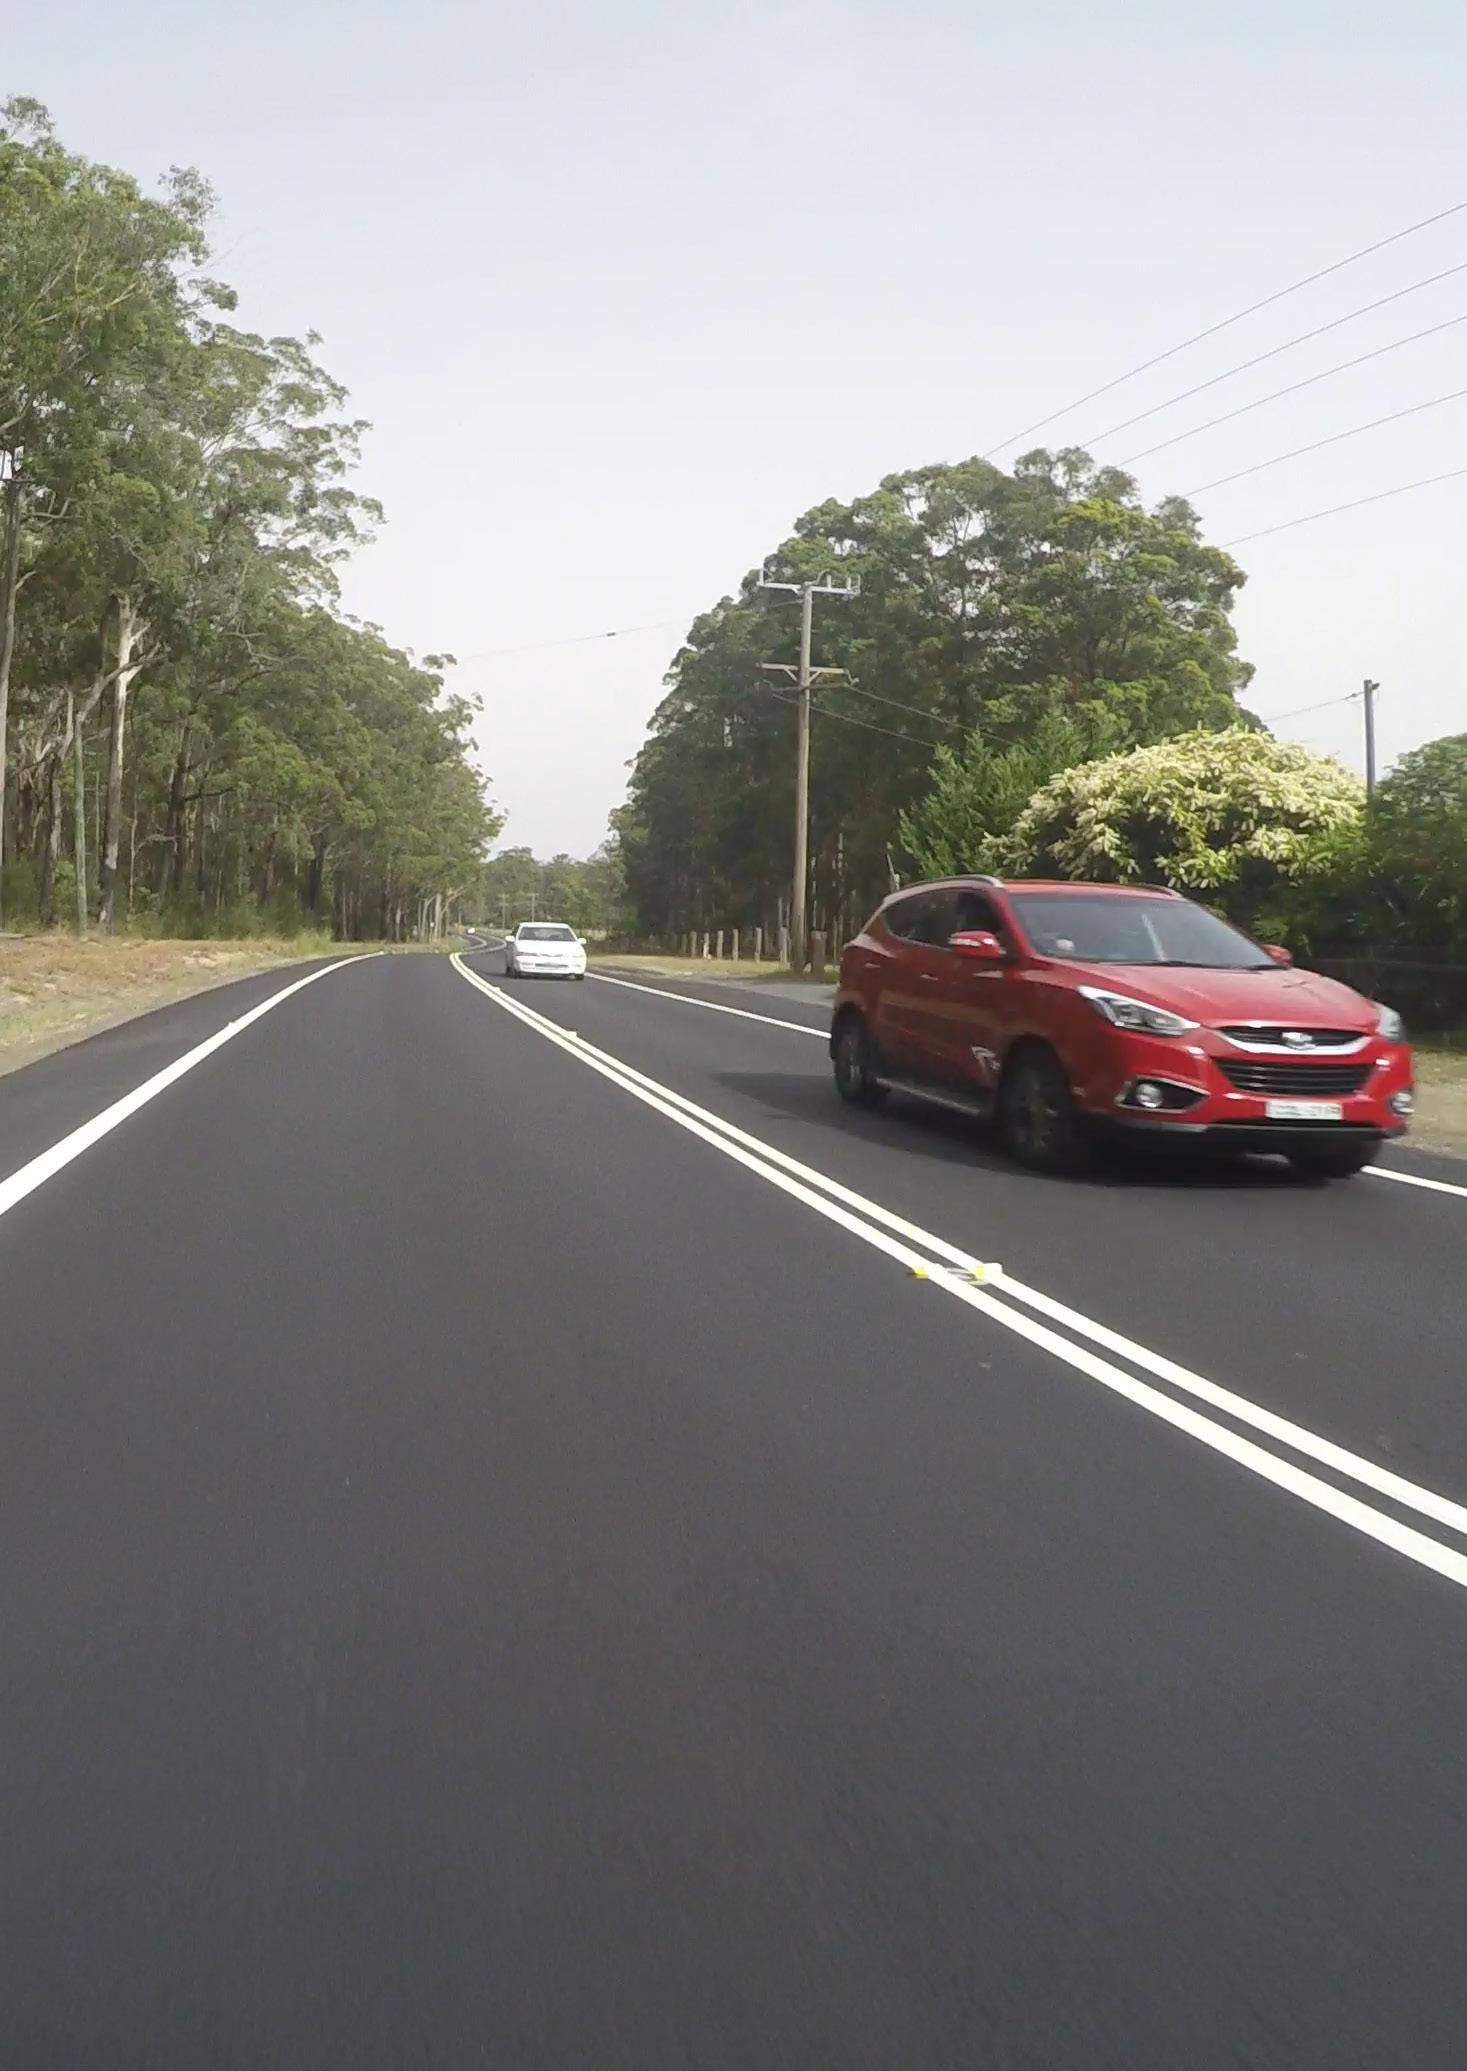
DESIRED FUTURE STATE
Desired Future State
The intention of this strategy is to prevent the road network from deteriorating faster than we can renew it and provide options to revert the network to an acceptable condition over time. As evidenced in the current state analysis, it is not just about increasing funding for renewals. There is a substantial improvement program to accompany increases in renewals and maintenance funding This improvement program includes actions to drive realisation of a better future state for transport assets
The strategy intention is shown diagramatically below on a typical Asset Deterioriation Model. The solid dark line resembling a ‘sawtooth’ pattern shows the ideal profile based on regular renewal at the optimum frequency. The dotted curve projects the decline in asset condtion for roads; intially slow, increasing to a steep decline before leveling out to trend towards zero The dotted lines represent the optimum service point and MidCoast’s current point at 34% deteriorated
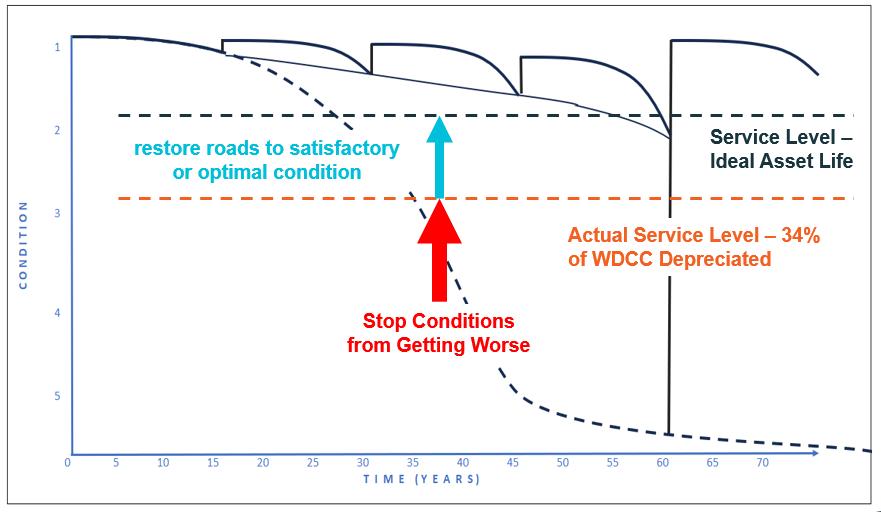
55 - Road Strategy Goals
The Red arrow denotes the first priority which is to stop the network conditions from getting worse. The Blue arrow shows the longer-term objective to shift towards a more acceptable level which is likely to be close to the optimum or ideal asset service life point.
MidCoast Roads Strategy 90
Figure
Asset Condition
The current state analysis describes increasingly poor asset outcomes for transport assets over time The most significant barrier to overcoming this is the fact that the network condition has deteriorated past the optimal service point where the lowest lifecycle costs can be achieved.
Research and studies from major road agencies across the world support the concept that regular intervention treatments prolong the life of road pavements and provide for the lowest life cycle costs. The figure below depicts this concept. Pavement Condition Index or PCI is shown on the Yaxis scaled from 100 (perfect, brand new) to zero (failed).
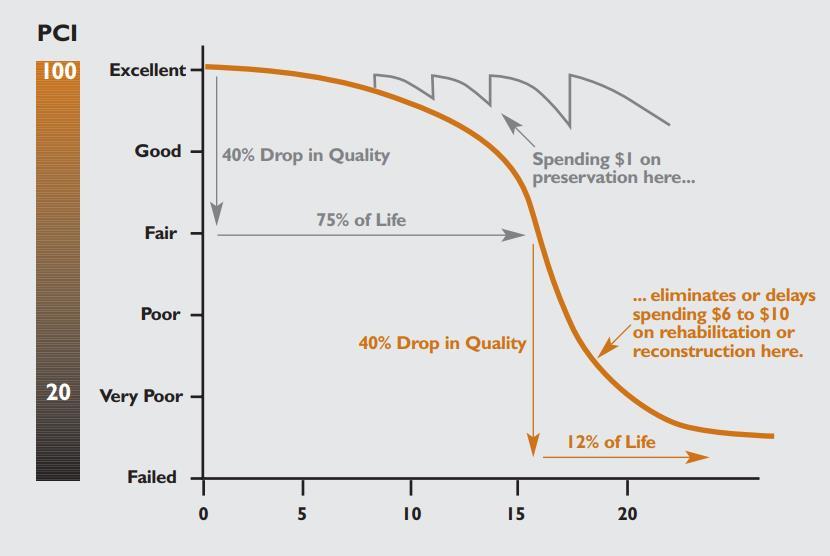
We can overlay the current condition of our roads on this theory as shown below.
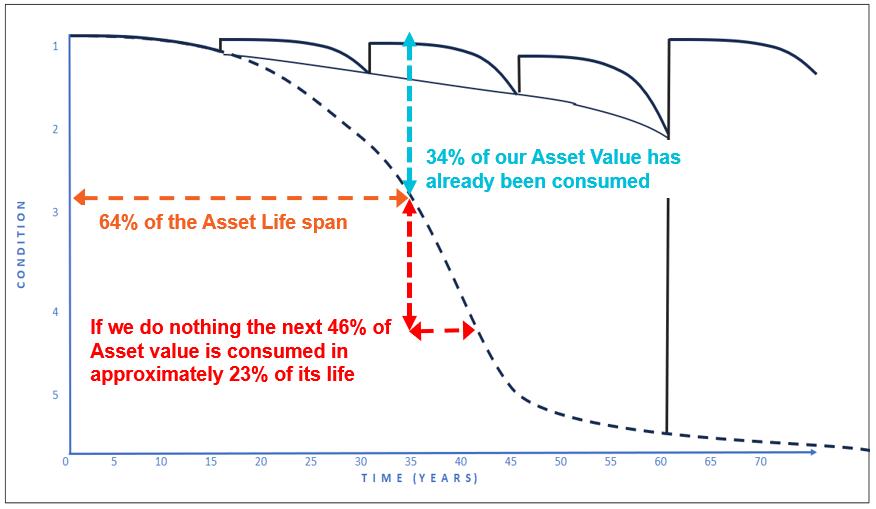
Applying the deterioration model, just over a third (34%) of the network condition has deteriorated, equating to nearly two-thirds (64%) of the typical asset lifespan. If we do nothing to address this, then we can expect far greater deterioration (46%) in a much shorter period of time.
Before now, the rate of deterioration has been slowly increasing year on year Like most road authorities, the cumulative impacts of this are easy to miss when it comes to budgeting each year.
MidCoast Roads Strategy 91
Figure 56 - Road Pavement Condition Index (PCI) Deterioration & Intervention Costs Model (Galehouse Et. Al.)
Figure 57 - MCC Road Asset Condition Overlayed on Deterioration Model
The crisis, reaction and apathy cycle has repeated itself historically since colonisation. That is, roads have always lagged behind what is needed with cycles of improvement followed by periods of inaction. This cycle is described in the adjacent figure
Every year we fail to renew our infrastructure at the same rate (or more than) it is deteriorating and the overall network condition reduces. In addition to this, we know that we are not keeping up with maintenance. Planned maintenance has been cut to prioritise responses to high-risk defects. This adds to acceleration of the network deterioration.
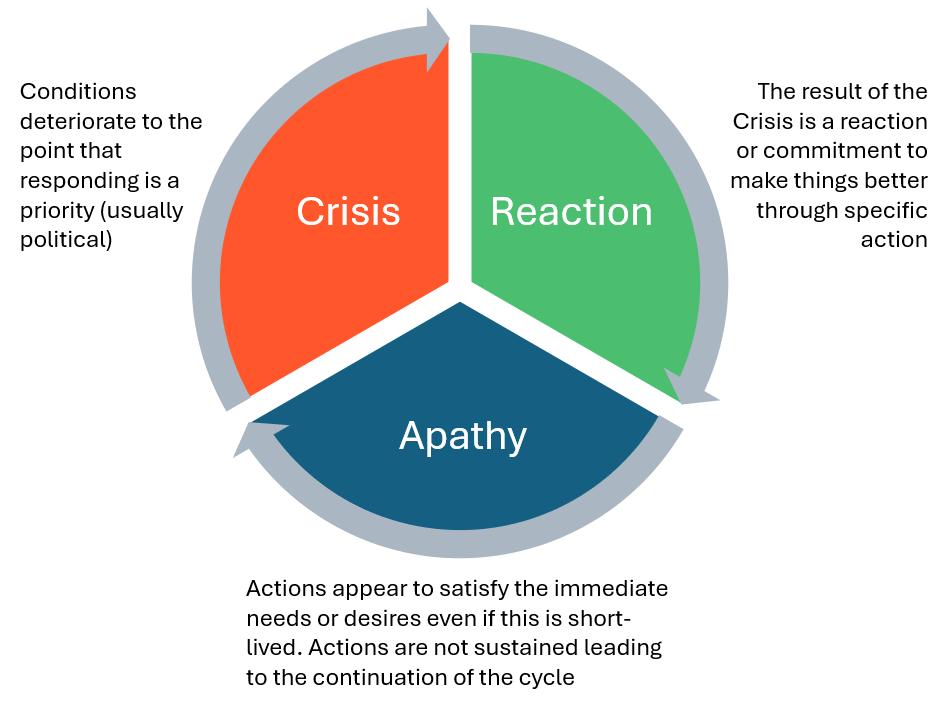
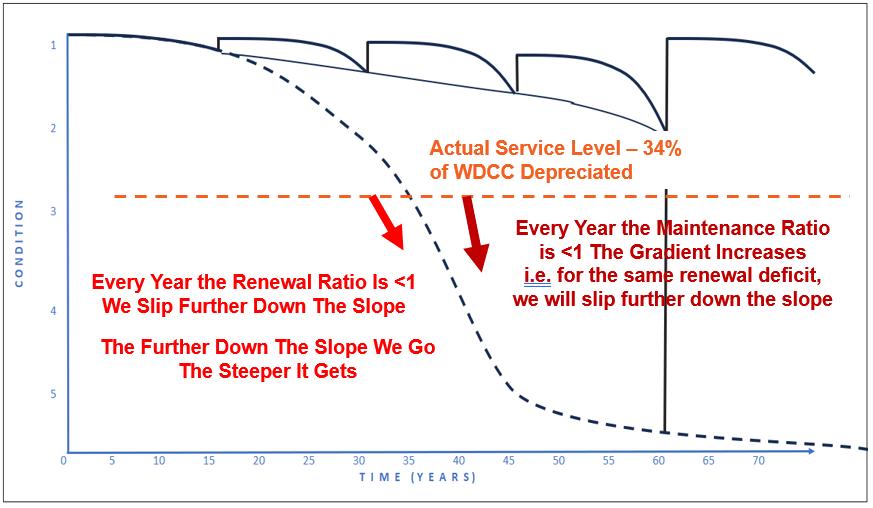
If this is not addressed, the problem is left to compound each year until it ultimately must be addressed by future generations. It runs against the principle of intergenerational equity to allow the current generation to continue to have the benefit of most of the life cycle achieved by our road assets value whilst leaving an accumulating backlog of poorer condition roads for future generations to fix.
MidCoast Roads Strategy 92
Figure 59 - Impacts of Failing to Meet Maintenance & Renewal Ratio Benchmarks on Asset Deterioration
Figure 58 - Crisis/Reaction/Apathy Cycle
Maintenance Funding
The level of maintenance needed is a direct consequence of the inadequacy of one of the many components that make up a road in addition to asset ‘wear’. Often, these issues will continue to cause an accelerated rate of deterioration until they are subject to capital improvement or renewal with modern materials. Some examples of this are:
• A road with poor geometric design (high axle loading)
• Construction with local materials of substandard quality
• Inadequate surface or subsoil drainage
• Non-compliant construction methods
• Failure to undertake an effective resealing program.
These issues will result in much greater maintenance demands than one designed and built according to best practice. Deficiencies like this must be avoided where possible or remedied as resources become available.
The current state identified that maintenance budgets are historically set based on the available funding. They do not relate to the actual condition of the road network, or the preventative maintenance required to keep assets in optimum condition. Where maintenance shortfalls are identified, funding is reallocated from lower priority/risk areas. This makes the situation worse in the long term.
The diagram below shows the simplified correlation between the declining asset condition (green) and increasing maintenance requirements (orange). As assets age, they require more maintenance. The maintenance budget (purple) has remained relatively constant, leaving a gap between the budget and what is needed depending on the asset condition (red). The shortfall in maintenance leads to increasing risk, decreased customer satisfaction and increased psychosocial risk for staff
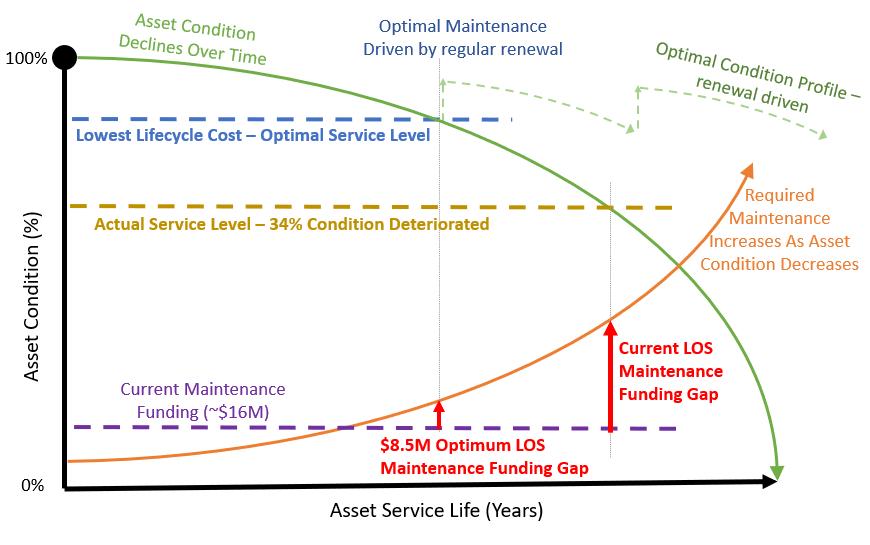
MidCoast Roads Strategy 93
Figure 60 - Simplified Asset Condition Vs Maintenance - Overlayed with MCC's Current Position
If we were renewing the road network at the optimal level of service, we estimate the maintenance budget shortfall to be $8.5 million This is the extra funding required over and above the current maintenance funding to recommence preventative maintenance programs such as edging/drainage, vegetation management and crack sealing
At the current asset condition (34% consumed), we recognise that the required maintenance funding would be much higher than $8.5 million. However, without more data it is not possible to estimate this figure. There is a point at which higher maintenance becomes counterproductive This is where the accumulated maintenance costs for a particular asset exceeds the cost of rehabilitation or renewal In this situation, continuing to increase the maintenance effort would be counterproductive and an inefficient use of public funds. Therefore, it is not warranted to analyse the level of maintenance funding required for the current situation; any additional funding proposed above the optimum LOS ($8.5M) would be better spent on renewals.
MidCoast Roads Strategy 94
Network Deterioration Modelling
ARRB has modelled our transport network to determine how the network will perform over the next ten years. The model includes the current network condition, age profile, traffic volumes, road hierarchy, renewal costs and intervention levels. It can only model sealed roads which represent most of the value of our road assets.
ARRB's model allowed us to examine the outcomes from different funding scenarios. The scenarios we modelled include the current budget ($21M) and the budget required to sustain the current condition of the network ($41M). We also included two intermediary budgets ($26M and $34M) as well as an ideal or unlimited budget option. The outputs of this scenario modelling include work programs and the expected condition profile each year over the next ten years The graph below shows the outputs for each scenario projecting the change in the overall network condition at the end of the next ten years
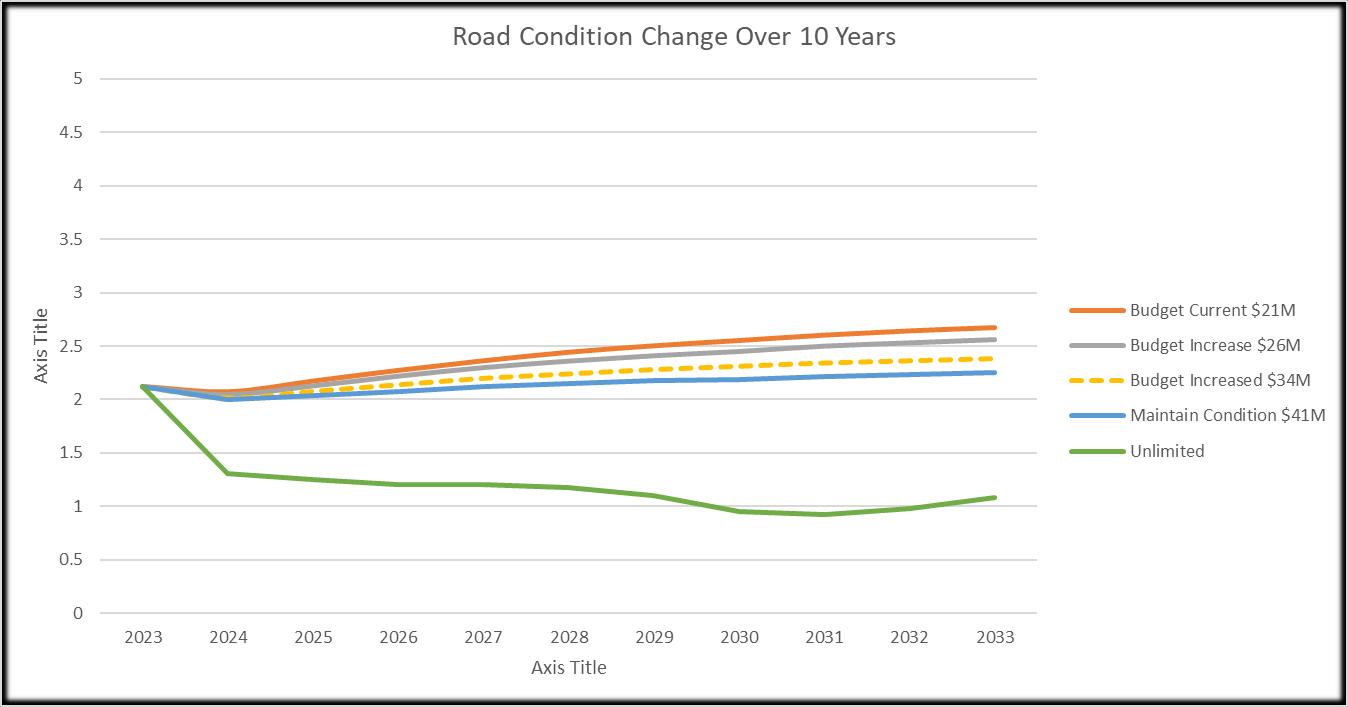
All scenarios show the impact of the extraordinary funding levels from recent grants and other sources on the sealed network condition in the initial years. All the scenarios initially improve and then deteriorate proportionally, reflecting the budget.
The unlimited budget scenario reflects a $239M renewal investment in the first year to address current network conditions. With a further annual expenditure of around $100M to maintain the average condition at 1 over the rest of the period While the unlimited budget scenario is practically unrealistic for several reasons, it is helpful to give an idea of the quantum of the backlog using a method completely different to what we have previously done. This scenario won’t be discussed in detail further
The $41M scenario sustains the average network condition close to current levels. Under this scenario, the backlog grows from 757km to almost 900km. Therefore, the backlog must be addressed in addition to maintaining current sealed road network conditions.
MidCoast Roads Strategy 95
Figure 61 – Sealed Road Network Condition Modelling Results By Funding Scenario (ARRB)
The table below shows the numerical values of the modelling output, colour-coded using the traffic light system (green = good) The condition rating is based on Council’s standard 1-5 system with 1 being very good, 2 being good, 3 being satisfactory or fair, 4 being poor and 5 being very poor.
62 - Tabulated Sealed Road Network Condition Modelling Results by Funding Scenario (ARRB)
The Base Case Scenario – Current Budget $26M
The $26m expenditure scenario is considered the baseline current budget. This value incorporates known grant funding and a conservative estimate of future competitive grant funding. If we do not change what we are currently doing, the modelling predicts that the average condition index of the network will shift from 2.1 to 2.6 over the next ten years.
Numerically, this change may not appear significant; however, it reflects a shift in the average of nearly 25%. The proportion of roads in poor condition will nearly halve as the existing poorcondition roads deteriorate rapidly and add to the group of roads in very poor condition. The number of roads in good and very good condition will also reduce by around a third. The proportion of roads in very poor condition will more than double.
Likewise, the backlog length will balloon from 757km to more than 1100km. We would also lose more than $158M in the value of community assets That equates to an annual loss in value of $16M. These figures are present values and will only increase in line with construction costs that have typically been much higher than CPI indices.
The graph below demonstrates the modelling outputs from this scenario and the net impact on the Pavement Condition Index.
MidCoast Roads Strategy 96
Figure
Year Budget Current (lower grants) $21M Budget Current (higher grants) $26M Budget Increased $34M Maintain Condition $41M Unlimited Funding 2023 2.1 2.1 2.1 2.1 2.1 2024 2.1 2.1 2.0 2.0 1.3 2025 2.2 2.1 2.1 2.0 1.3 2026 2.3 2.2 2.1 2.1 1.2 2027 2.4 2.3 2.2 2.1 1.2 2028 2.4 2.4 2.2 2.2 1.2 2029 2.5 2.4 2.3 2.2 1.1 2030 2.6 2.5 2.3 2.2 1.0 2031 2.6 2.5 2.3 2.2 0.9 2032 2.6 2.5 2.4 2.2 1.0 2033 2.7 2.6 2.4 2.2 1.1
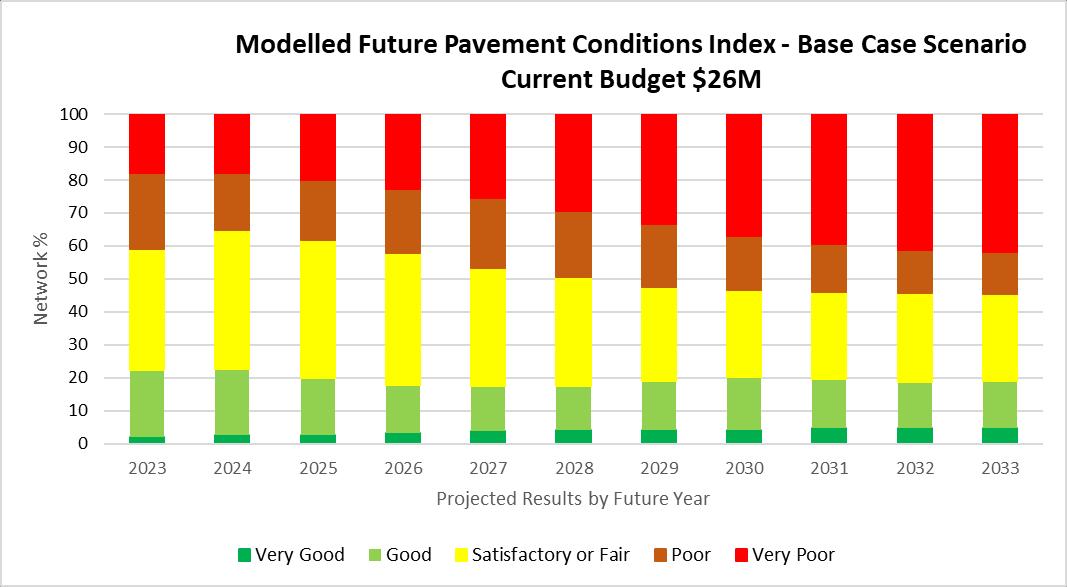
This scenario is not recommended based on the level of organisational risk that it presents and the unfair burden it would place on future ratepayers. It would also lead to increased complaints and diminishing community satisfaction with Council The attractiveness to employees would also reduce and we can expect to lose good staff to other organisations where the long-term outlook is more attractive. This is why Council is currently focusing on developing a Financial Sustainability Strategy in addition to the Roads Strategy.
Maintain Network Condition - $41M Budget (Sealed Roads)
From a renewal perspective, the expenditure required to sustain the sealed transport network in the same condition over the next ten years is $41.7m/year. The cost to sustain the unsealed network in the same condition over the next ten years is estimated at an additional $4.4m/year. Notably, a significant proportion of this expenditure must be directed to local roads, as they are typically excluded from traditional grant programs. As previously mentioned, the backlog does grow; hence, further additional funding would be required to address this over time.
MidCoast Roads Strategy 97
Figure 63 0 Modelled Future Pavement Condition Index - Base Case Scenario (Current Budget $26M)
Transport Network Component Required Capital Renewal Expenditure Current Capital Renewal Expenditure or Budget Gap Regional Roads $9.2m Reseal $2.8m + Rehab $6.4m $10.7m Nil1 Urban Roads $16m Reseal $4.6m + Rehab $11.4m $6.5m $9.5m Rural Roads (sealed) $16.5m Reseal $3.5m + Rehab $13m $6.3m $10.2m Rural Roads (unsealed) $4.4m $2.5m $1.9m Bridges Nil Line Marking (3) $460K Nil $0.46M
(3)
64 - Analysis of Funding Gap to Sustain Current Condition
Notes:
1. Co-contribution is a typical requirement for regional road grant programs which reduces the capacity to fund reseals on the regional road network.
2. The $7.5m Council program, Regional and Local Road Repair Program, Betterment Program and the Regional Road Emergency Repair Fund have provided non-repetitive additional funding which impacts the gap figure.
3. Figures consistent with program values for AEC Financial Sustainability Strategy
Based on the modelling and the estimates completed for the AEC Financial Sustainability Strategy, the shortfall of funding for all transport asset renewal to sustain the current average condition level is $26.35M
The draft Financial Sustainability Strategy found renewal funding across the same assets of approximately $37M would sustain the transport network This is based on logic derived from known data and assumed standard rates from AEC’s experience with other councils. The figures in the table are consistent for the minor asset types with the major variation related to road renewals. In determining the renewal rates the AEC are not able to factor in the starting condition of the network being different to other areas they have been working.
Further work is required to compare the unit rates adopted for selected treatments and validate the rates based on local results. This will improve the level of confidence in both results However, we know that we need to be replacing our existing infrastructure considerably more frequently than we currently are, especially resealing of roads.
MidCoast Roads Strategy 98 Guideposts $100K Nil $0.1M Guardrail
$800K Nil $0.8M Signage $200K Nil $0.2M Kerb & Gutter (3) $1.5M $200K $1.3M Bus Shelters (3) $40K Nil $0.04M Footpath/Cycleways
$850K Nil $0.85M Culverts
$1M Nil $1M TOTAL $51.05m $26.2m $26.35m
(3)
(3)
Figure
Backlog
The term ‘backlog’ has various meanings. It is often used without clarification of the intended meaning. The broader definition is ‘an accumulation of uncompleted work or matters needing to be dealt with’ In an asset sense, it should be a term used to describe the work that needs to be done to maintain the desired outcome or service, which is not currently planned to be done (often due to funding limits or affordability).
In financial statements, the term refers to the value calculated to theoretically return assets in poor or very poor condition to an acceptable condition. This is also known as the cost to bring to satisfactory. The diagram below uses simplified straight-line depreciation from the Fit For Future Infrastructure Ratio Explanation (IPART, 2015)
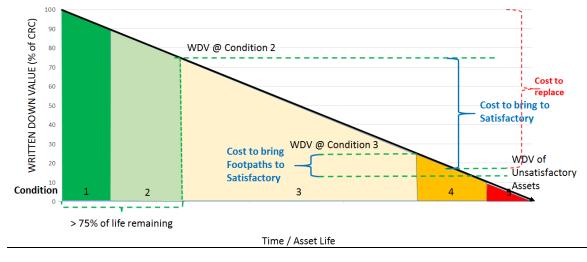
Figure 65 - Visual of Cost To Bring To Satisfactory (Backlog Ratio Calculation)
The exact calculation has varied over time in response to changes in accounting practice or as a result of adopted internal accounting policies It is not a realistic value as it is not practical to replace an old asset with anything other than a new asset Further, some assets may not need replacing at the end of their life and, therefore, should not be included in a calculation However, it can be useful to show the proportion/value of assets that have deteriorated below an acceptable condition in a given timeframe
The backlog ratio is calculated by dividing the Estimated Cost To Bring To Satisfactory by the total asset replacement cost. The benchmark is <2 or less than 2% of the value of the network. While it shows the relative change in backlog over time, it is not considered to be a true indicator of the level of backlog
The ARRB modelling identified a potential link to the real backlog that exists. In the unlimited budget scenario, expenditure in the first year was $239 million. This represents the quantum of work initially required to get the network back to a good condition and hence, has relevance to the backlog concept. If the value of annual renewals required to maintain the network condition was excluded from the total amount, the backlog appears to be around $200 million.
Using condition data, we considered that the backlog is the variation in the pattern of assets falling into and accumulating in condition 5, above an assumed base level. This can be observed by the uplift (or tail) in the condition data previously highlighted
MidCoast Roads Strategy 99
Across a well-managed network there should always be sections in poor condition. If there wasn’t, then it may be that assets are being replaced prematurely without returning the maximum value to the community. The failed assets become part of the renewal program For the backlog to stay the same, assets will be moving into condition 5 at approximately the same rates as those being renewed (i.e. the assets are not accumulating in condition 5)
Calculating the replacement value of the sections accumulated in condition 5, using the condition data at 10m intervals gives a measure of the backlog. The number of sections or ‘counts’ outside the smoothed trend is shaded on the graph below.
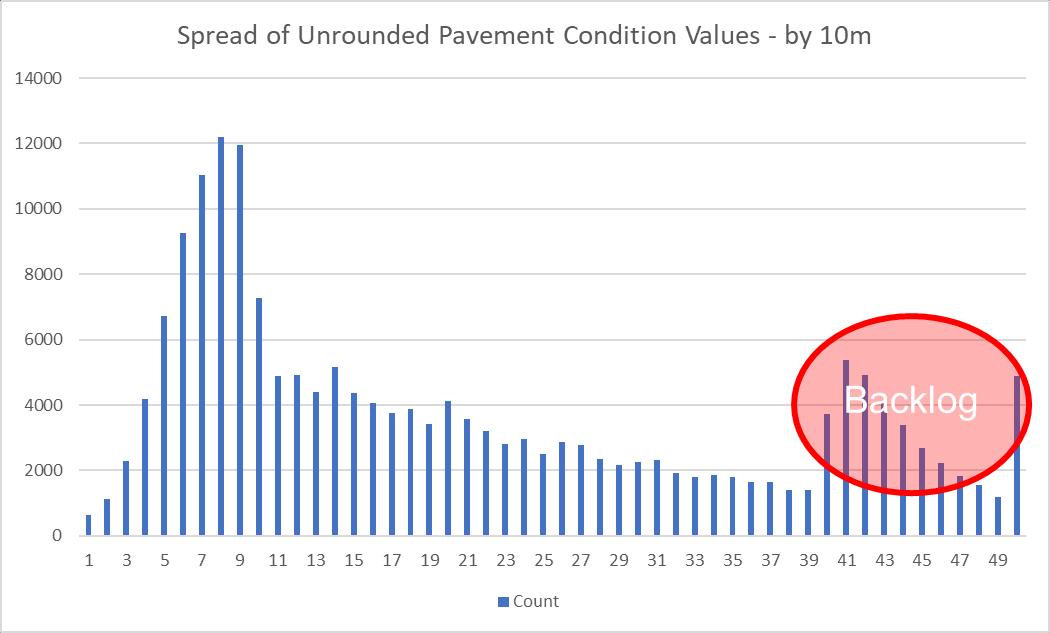
Approximately 28,700 individual 10m interval ‘counts’ have been identified as falling outside the expected trendline and hence form the backlog. The replacement value of these sections is approximately $180M.
We need to monitor the change in asset condition over time to get a better understanding of the actual level of backlog. The repeatability of the ARRB condition rating process allows for this.
It should be noted that assets in condition 4 typically require substantial renewal and are likely to have inherently higher risks due to their condition. Therefore, these assets must be maintained more regularly and ideally renewed as soon as finances permit once this condition is reached.
MidCoast Roads Strategy 100
Figure 66 - Count of the 10m Road Sections Accumulated Above the Trend in Condition 5
Transport Asset Strategic Business Plan
In addition to the Road Strategy, we have commenced preparing a Strategic Business Plan for Transport Assets. The business plan will provide the strategic actions necessary in our operations to support and complement the delivery of improved outcomes for the community through the Road Strategy.
Within the IP&R Framework, it will become one of the other Council Strategies and Plans that inform the Delivery Program and annual Operating Plan. This relationship is shown in the diagram below.
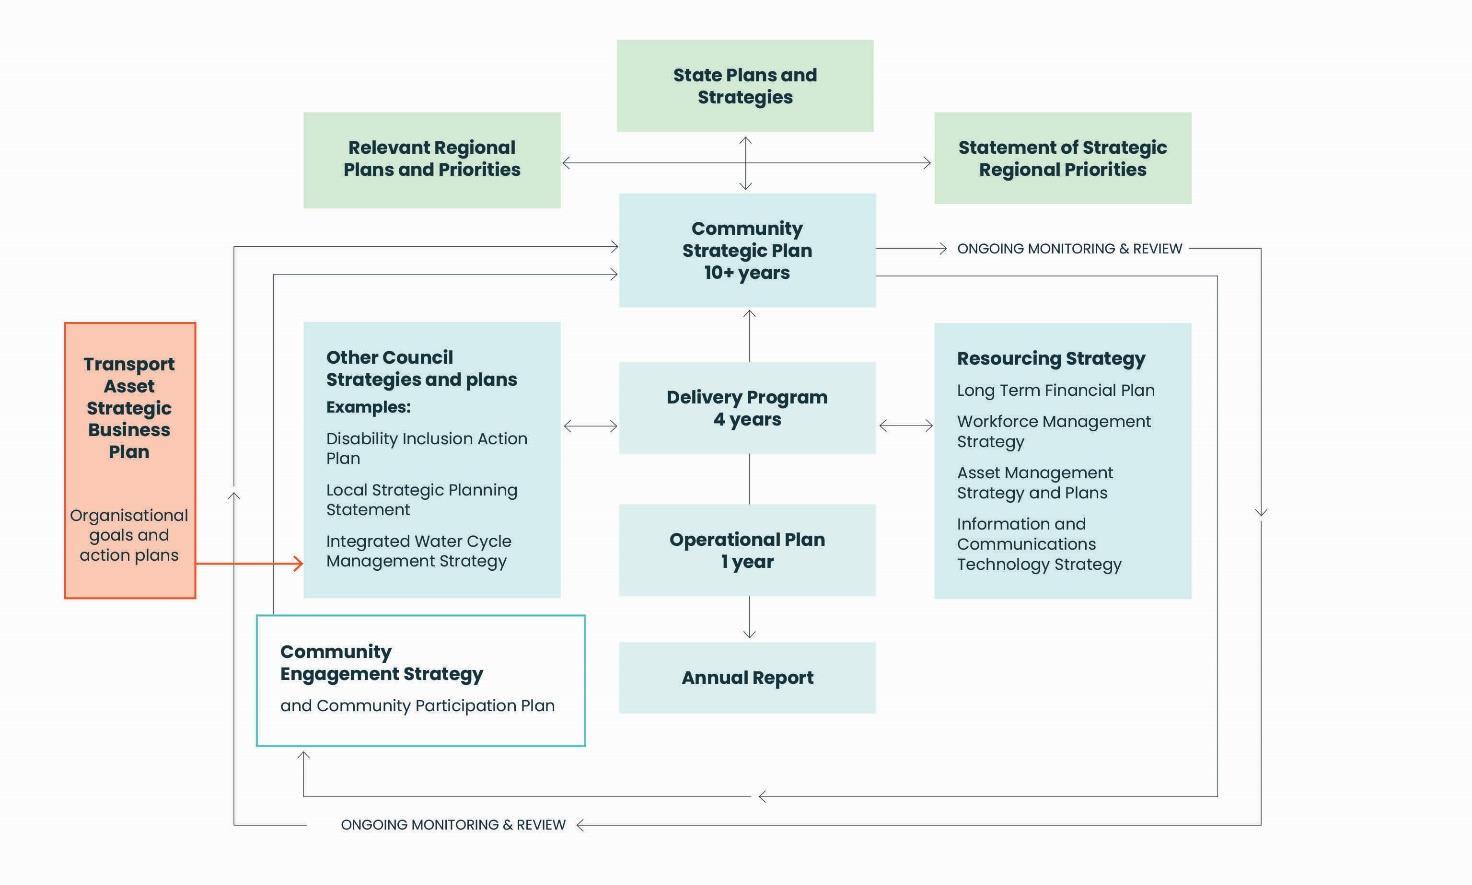
The plan has six strategic objectives covering quality and safety, service levels, processes, culture and community, people and finance. These are summarised over the page.
The key strategic initiatives are divided into groups to maintain the best of what we do, improve where we have opportunities and grow where we can have the most significant impact
Performance measures are included so we can track progress of the business plan.
The business plan needs to be finalised, adopted and progressively implemented.
MidCoast Roads Strategy 101
Figure 67 - Transport Asset Strategic Business Plan and the IP&R Framework
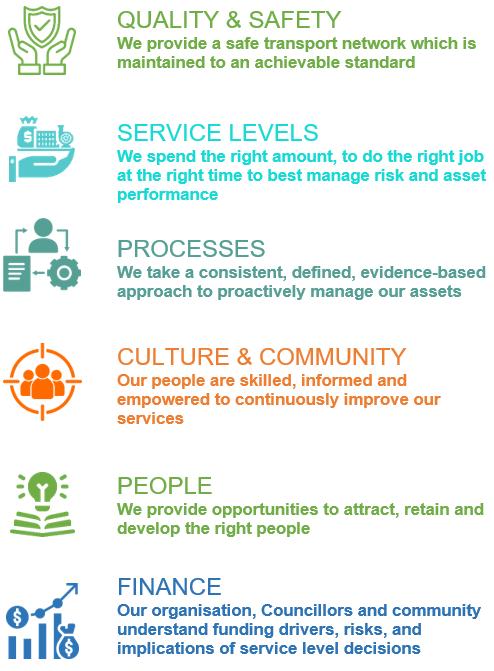
68 - Transport Assets Strategic Business Plan - Key Strategic Initiatives
MidCoast Roads Strategy 102
Figure
Customer Experience Strategy – Road Defect Customer Journey Map
Improved customer service is a key goal of Council’s Business Transformation Program. An early priority, Council launched an upgraded Customer Request Management (CRM) System as part of upgrading our corporate IT system, Technology One, Enterprise Resource Planning (ERP) platform. Complimenting this is the Customer Experience Strategy and Road Defect Journey Map
The customer journey map was developed based on customer feedback, internal staff workshops and in-depth interviews with typical example customers. The insights acquired through this engagement process allowed 5 personas to be developed, covering key customer groups.
The journey map consists of five stages; identify, report, monitor, resolve and ongoing. Within each stage, the activity, communications channels, key moments, enablers and supporting actions are identified. The journey map is contained on the following page.
The journey map is supported by 15 actions in the following table:
J1.1 Tailored Responses
J1.2 Interactive Mapping
J1.2 Report & Track via Portal
J1.4 Consistent System Usage
J1.5 Notification
J1.6. AI Feasibility Study
Provide customers with tailored responses based on assessment of the defect using tailored templates integrated into the CRM System
Allow customers to visually pinpoint the location of the road defect on a map whilst reporting a defect online
Allow customers to take and upload an image of the road defect when submitting a request and track their request though the web portal
Ensure consistency in internal system usage by staff Ongoing
Provide customers with outbound notifications via email or SMS to keep customers informed of their request status. In Progress
Conduct feasibility study and business case to leverage Artificial Intelligence (AI) to improve proactive asset maintenance.
(See Asset AI)
J1.7. Proactive Asset Maintenance
J1.8. Redefine Service Levels
J1.9. Proactive Weather Communications
J1.10. Visual Process Communication
Improve proactive asset maintenance to optimise road maintenance.
Review service levels communicated to customers to ensure they serve as an accurate guide for both the community and staff in clearly defining expectations
Provide proactive notifications to customers when anticipating or following significant weather events Not Started
Provide clear and visual process flowcharts regarding council process managing road defects. Not Started
MidCoast Roads Strategy 103
Action Description Current Status
Not
Started
Complete
Complete
Complete
Not Started
In Progress
Action Description
J1.11. Customer Education
J1.12. Update Website
J1.13. Engaging Videos
J1.14. Publication of Road Construction Program
J1.15. Transparent Performance Reporting
Create educational resources to improve customer knowledge of roads and road maintenance.
Deliver improvements to the website to make it a first port of call for customers to find the information they need. ensure ongoing accuracy.
Create and publish engaging videos and behind the scenes content that raises awareness of how council workers maintain safe community roads.
Publicise the road construction program, including upcoming works in the next fortnight and past road works.
Not Started
Not Started
Not Started
Not Started
Communicate with the community the volume of road defects resolved, and/or metrics around cost, value, or volume In Development
MidCoast Roads Strategy 104
Current Status
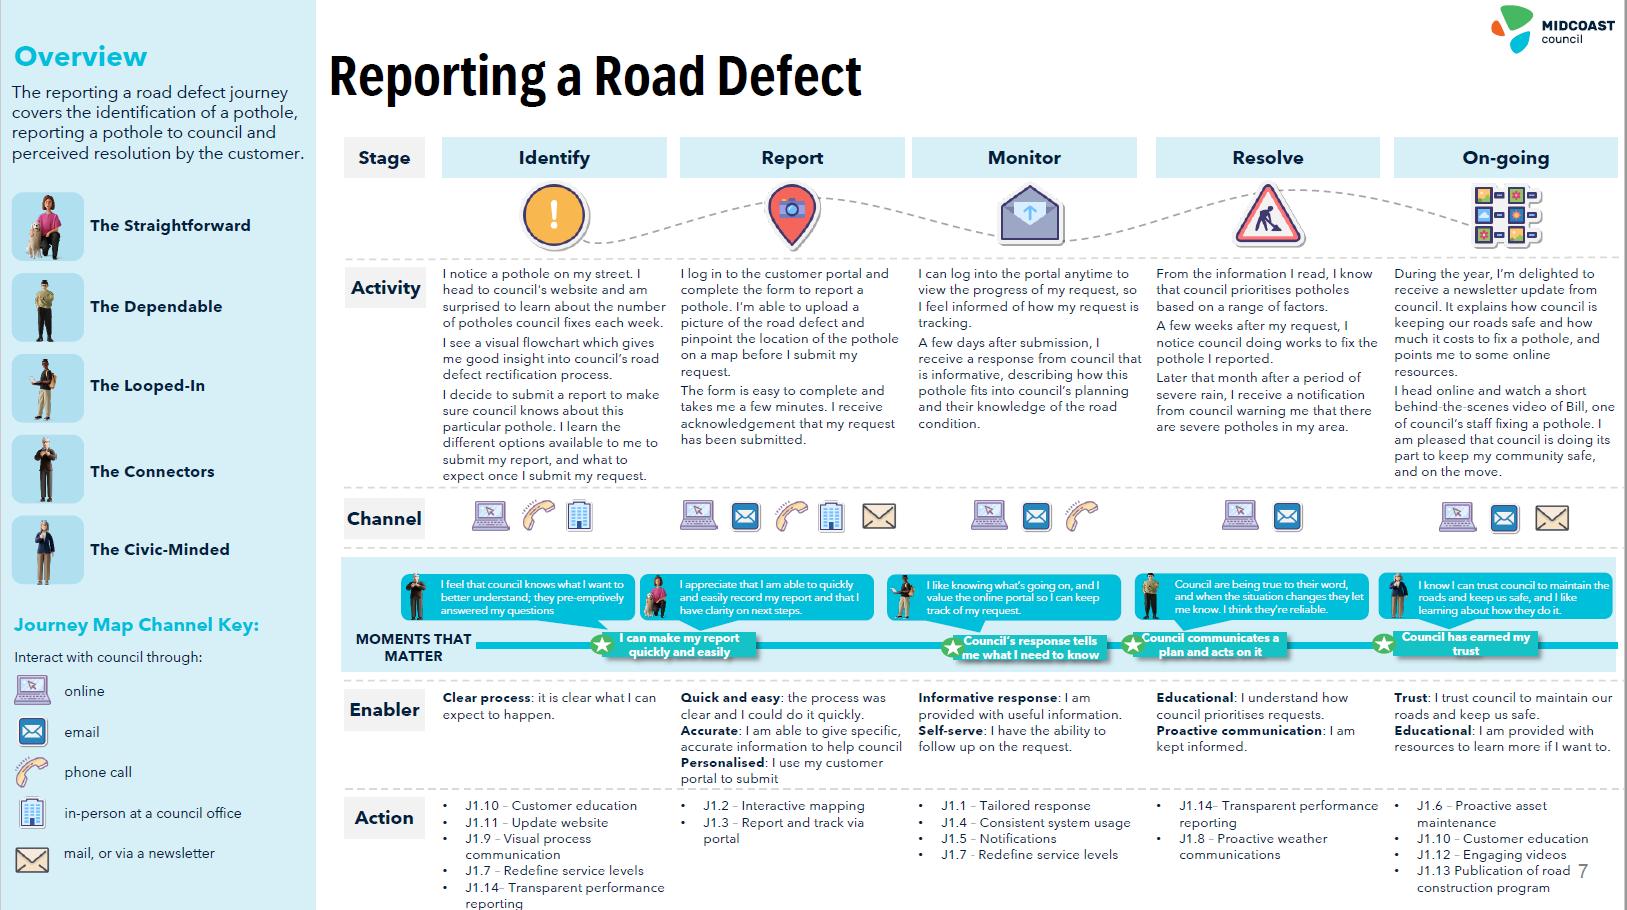
Service Levels
Operational Service Levels
The process for determining the current operational service levels at MidCoast Council has been consulted with key engineering maintenance, operations and asset management staff There is still a lack of data to derive specific measures. The current baseline levels of service were established by reviewing the quantum of works completed by maintenance teams over 2022/2023. The following table shows the observed or measured service levels.
Optimal Maintenance
The optimal maintenance level of service was determined by considering the costs required to match industry standards and best practice, particularly in relation to preventative maintenance It also considers the operational activities required to meet normal expectations. Factors such as the road hierarchy, utilisation, risk and cost were taken into account.
It’s important to note that operations activities include service delivery items such as street sweeping, drainage cleaning and verge mowing, as well as the proactive and reactive inspections undertaken by in-house technical staff and engineers.
Operations (maintenance) activities do not improve the condition rating of assets but rather enable the transport network to reach its design life and deliver on its transport function.
A further allocation of $8.5M in specific maintenance funding would be required for service output measure levels to meet the optimal LOS for transport assets The increase in outputs achieved from this funding can be identified by comparing the proposed outputs in the table below (in the column with a red border) to the adjoining column that shows the actuals recorded in 2022/2023.
MidCoast Roads Strategy 106
Proposed Outputs from existing budget plus $8.5M additional
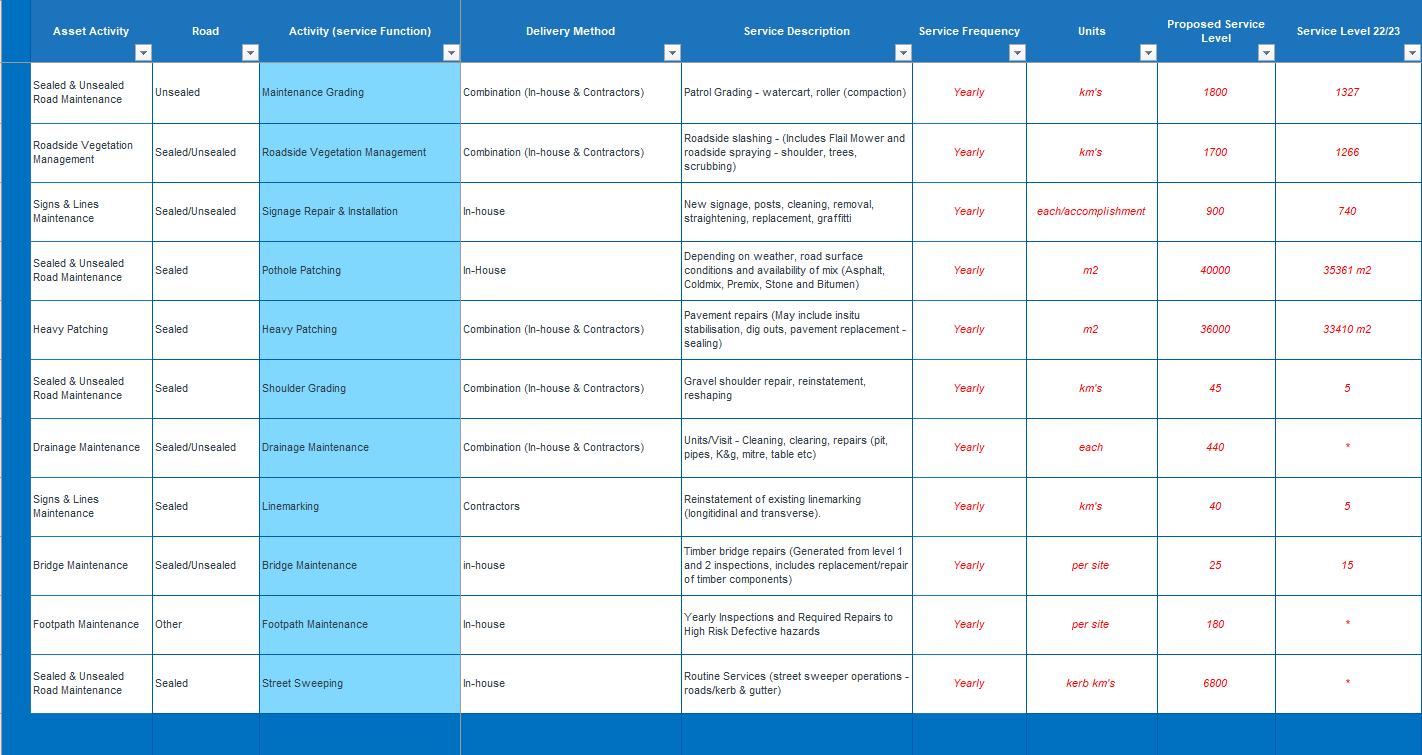 Figure 69 - Current Maintenance Service Output Levels & Proposed Levels (subject to additional funding)
Climate Change Risks, Adaptation & Net Zero by 2040
MidCoast Council adopted a Net-Zero by 2040 target for greenhouse gas emissions in June 2021. While areas like power and fossil fuel consumption are prominent (scope 1 & 2 emissions), there is a significant challenge to achieving Net-Zero for embodied emissions in transport infrastructure (Scope 3). This will be a challenge across the whole industry and requires more investigation.
When undertaking network improvements or renewals, the capital works process needs to be adjusted to consider the impacts on climate change and carbon emissions, with improvements captured and recorded in the project benefits register.
The availability of charging facilities has been identified as a major inhibiting factor for the growth of EV vehicles in regional areas. To date, Council’s practice has supported the establishment through a lease process with initial low fee periods and lease value relative to parking demand. Generally, EV chargers have been excluded from high-demand parking areas. Chargers in villages or lowdemand areas have been approved with a zero annual lease to secure private investment in EV charging infrastructure.
Investigation is required into the business case or strategy for supporting the development of EV charging facilities within public road reserves by Council or private operators.
In adapting to the predicted impacts, the primary risks affecting transport assets are higher temperatures (hot days resulting in damage to recently sealed roads), rainfall, sea level rise, coastal erosion and fire weather. While much work has been done modelling and projecting these impacts, further work is required to analyse and predict how this will impact transport infrastructure to enable long-term planning to accommodate the likely changes.
In examples of coastal erosion, changes in land use over time will affect the need for access via the road network. By examining these, we can plan for a staged or phased approach and implement actions as we observe identified triggers in the plan.
It is anticipated that the extent of damage to the transport network during natural disasters will increase with time as floods, storms and bushfires become more frequent and more intense. Given the critical role that our local and regional road network plays, MidCoast Council will need to plan to implement additional pro-active measures to mitigate the impacts of natural disasters. Further work will be required to develop a more detailed plan to identify this work.
Evidence-based work in other areas has already shown that proactive maintenance and sustainable levels of asset renewal are vital components of improving the resilience of the transport network. Proactive maintenance of drainage, culverts and structures, together with vegetation management and more regular resurfacing of sealed and unsealed roads, are key components of this work.
Further work is needed to better understand and document the recent natural disaster experiences, the lessons learnt and the improvements needed to make routes more resilient.
It will be key when that work is undertaken to ensure that the safety of the community, first responders and workers during response and early recovery is front of mind in all considerations.
MidCoast Roads Strategy 108
Transport Infrastructure Improvement Opportunities
The next ten years will likely see a significant shift in the systems and infrastructure supporting transport. Interrupters loom in several directions, with everything from new materials to autonomous vehicles and artificial intelligence ready to completely rewrite how we design, build and maintain transport assets. The potential for change has never been more significant than it is now
Resilience
With the level of natural disaster events over the last four years, all levels of government are shifting greater focus on developing resilience in the community and infrastructure. The approach to disaster management focuses on the PPRR Model: Prevention, Preparedness, Response and Recovery.
The Commonwealth Royal Commission and the NSW Bushfire Inquiry recognised the benefits of well-designed and maintained access routes to the community. The final reports criticised road authorities for the impact poor maintenance had on infrastructure and the delays in reopening road access due to post-bushfire risks from falling trees. These risks and delays made the response and recovery phases much more difficult for communities across NSW.
Building greater resilience into how we design, construct and manage transport assets improves the effectiveness of the PPRR model across all four phases. There are opportunities for MidCoast Council to apply the observations and learnings of others and our own experiences to improve future outcomes. Being able to sustain the condition of transport infrastructure is a critical prerequisite to achieving any success.
Collector Road Corridor Improvement
Each community or locality needs a safe and accessible route to a more significant centre to encourage people to evacuate. It also helps first responders access local units in rural areas to assist and reinforce their efforts to save lives and property. When access is affected unnecessarily, communities become isolated and rely on themselves for assistance.
Some typical limitations affecting our rural collector roads include narrow road widths, little or no shoulder, steep embankments and drop-offs, dense vegetation, winding sub-standard curves and poor surface conditions.
Further work is necessary to assess the adequacy of our collector roads in providing resilience and a prioritised works program should be developed for incorporation into future programs in conjunction with major renewals. This requires a whole of route and network approach. There are significant opportunities to improve the integration of outcomes on a network basis through the reuse of materials across projects and the use of select materials from within the road reserve for other components of road work. Additionally, we know the severity of impacts can be mitigated through undertaking more pro-active maintenance and renewal activities as recommended in this strategy. We also know that the work that MidCoast Council does for the road network can, in some cases, benefit other critical infrastructure such as power supply or telecommunication resilience.
Our intent is also to ensure that resilience is a key consideration in all future decisions. For instance, a shoulder widening project to improve road safety during normal periods of operation can also improve safety and resilience of the road.
MidCoast Roads Strategy 109
Road Delineation
Many of our roads have no line marking to indicate the road's centreline. Guideposts and raised reflective markers have been installed in some areas following rehabilitation or new construction works; however, this is inconsistent and they often aren't maintained.
Expanding and improving the level of delineation along the road network would improve general road safety. It would also help emergency services and first responders navigate during emergency circumstances.
Clear Zone Management
Much of the MidCoast road network has developed over time, going from rough bush tracks to formed roads and, for some, bitumen sealing. When undertaking major work, additional work is done to widen the pavement formation, providing minimum lane widths with sealed and unsealed shoulder components. In some areas, the width of the existing road reserve doesn’t allow for this.
More often, renewals are completed without adding to the road widths and shoulders. This perpetuates the presence of significant safety risks within the clear zone. Steep drop-offs occur on some roads alongside deep drains. This situation is exacerbated when in-situ stabilisation and pavement overlays are used to improve strength. Significant vegetation can be less than a metre from the trafficable lane on other roads.
Some roads have barrier protection, while others do not. Lack of barrier replacement over a long period is evident, with many timber posts and chainwire systems still in place. These systems do not meet current standards as they don’t provide an effective barrier. In addition to standard, examples of this type of barrier show signs of extremely poor condition, with star pickets currently holding them up or entire sections missing and not replaced.
Further work needs to be done to evaluate the level of roadside risks present, the potential to manage these risks, and the costs.
Vegetation Management
As the relative value of maintenance funding has reduced, the scope of planned or preventative maintenance has also declined. The re-direction of budgets to rectify high-risk defects has resulted in a gradual decline in less immediately urgent maintenance. The service interval for vegetation management is driven by traffic risk, meaning that busier roads and intersections are maintained more regularly.
The planning and scheduling of vegetation maintenance needs to shift from a reactive to a proactive planned approach. Effective vegetation management along roadsides positively impacts the road's maintenance, improves road safety, reduces fauna risks and increases community resilience.
The NSW Bushfire Inquiry Final Report acknowledged the impact that road closures had in preparation, response and recovery from the bushfires. The report noted that many closures remained in place well after the fire threat had passed due to the risks posed by vegetation in the road reserve. It also noted the opportunity for vegetation management to restrict fire transmission and make first responders' evacuation and emergency access safer.
Council is also required to design its work and programs to reduce the risk to workers. Work undertaken in a pro-active planned way under normal operating conditions is inherently far safer than work undertaken during and/or immediately following natural disasters. Therefore, we need to move as much work as possible into the pro-active preventative categories, as well as having robust safety systems in place when delivering higher risk unplanned activities in poor conditions.
MidCoast Roads Strategy 110
The Commonwealth Government's Royal Commission into National Natural Disaster Arrangements reinforced the opportunity for better management of road corridors, the benefits of broader collaboration around risk and maintenance activities and the opportunity to align road authority action with critical infrastructure and access routes.
With sections of our community at risk due to limited access points (i.e. single access coastal villages) or rural connectivity, active management of vegetation within the road reserve is an opportunity to improve community perceptions around safety and resilience and reduce the risk of damage to the road network.
Unsealed Road Upgrading
MidCoast Council has no program for upgrading and sealing higher-use unsealed roads. The immediate priority is to maintain our sealed road network as best we can, acknowledging that maintenance and renewal funding is well below the level required to manage this sustainably.
Some former Great Lakes Council roads have been sealed recently, including sections of The Branch Lane, Bombah Point Road and roads immediately adjoining the Port Stephens – Great Lakes Marine Park. A substantial proportion of this work has been grant-funded under the Marine Estate Management Strategy to reduce erosion and sedimentation along the roads and the impact this has on adjoining marine environments.
Industry best practice indicates that the total lifecycle cost for roads with less than 100 vehicles per day is cheaper if unsealed. Where the daily traffic is more than 300 vehicles, the lifecycle cost is lowest if sealed. Between 100 and 300 vehicles per day, local factors will influence whether sealed or unsealed is the most cost-effective.
The capital costs are a major barrier to upgrading and sealing high-priority rural collector roads. Even though leaving the road unsealed is not the best in the long term, where there is insufficient funding to maintain and replace existing infrastructure, roads remain unsealed. They generally need a better level of service as maintenance grading cannot keep up with the deterioration, especially in periods of prolonged wet weather.
Examples of unsealed roads where the lifecycle cost is likely to be reduced through upgrading and sealing are:
• Cedar Party Road
• Central Lansdowne Road
• Comboyne Road,
• Bulga Road
• Manchester Road
• The Branch Lane
• Wallambah Road
• Wattley Hill Road
• Bootawa Road
Sealing busier gravel roads eliminates excessive dust during dry periods. This would be a significant benefit to adjoining landowners. It also provides much better-quality access for rural residents who regularly need to access services such as schools, daycare and medical providers.
Sealed roads are typically wider than unsealed roads and operate at higher vehicle speeds. If designed, constructed and maintained appropriately, sealed roads can be safer and more resilient in natural disasters.
Further work is required to identify the roads that should be upgraded to reduce the long-term ownership costs and develop a program for future funding considerations.
MidCoast Roads Strategy 111
Asset Criticality
Whilst we have an asset hierarchy that reflects the level of use of a road, each road has a level of criticality depending upon how important the ability to use it is.
Some roads provide access to critical infrastructure (like Bootawa Road & Bootawa Dam Road for access to Bootawa Dam), and others provide access to economic generators (like Wingham Road for Wingham Beef Exporters or Waitui Road for Waitui Falls).
Some roads provide important alternate access during flood events when low-level bridges and causeways are no longer accessible. Others are the only access into or out of an area.
Identifying and understanding these risks will allow us to integrate asset criticality into managing transport assets.
Adoption of New/Changing Technology and Technical Standards
The pace of technological change is accelerating in the transport sector. Efficiency is driving opportunistic investment in electronic and hydrogen technology coupled with the concept of driverless or autonomous vehicles. Some of our current challenges have resulted from a lag between the changing needs or demands and the development of the network.
We could break this cycle by proactively preparing for change and incorporating adaptive planning techniques into future transport asset strategies. Current emerging issues are detailed below.
Higher Mass Limits and Performance Based Specifications
Road authorities are obligated to allow heavy vehicle access where it is physically possible and safe. More efficient transport helps business enterprises remain cost-effective. Some technologies can reduce the impact of moving the same freight via traditional vehicles.
Forward planning must account for the changing vehicle types and loads in determining design principles for alignments and pavement strength. Actions or works recommended by this process should form part of long-term planning.
Asset AI
The use of artificial intelligence (AI) has the potential to transform the way we manage and respond to defects in the network. The present system involves manual inspection, measurement and recording in a relational database for risk assessment and maintenance planning. This consumes significant resources and only provides insight into a small proportion of the defects across the entire network at any one time Information can become outdated or inaccurate over a relatively short timeframe. It is also difficult to gauge the change over time without resource intensive measurements.
There are already multiple suppliers of AI-based visual assessment tools that can utilise relatively inexpensive visual records from iPhone cameras mounted on the dash of garbage trucks to identify defects across the entire network. This technology can be used to analyse changes in defects over time based on fortnightly datasets and ultimately help to streamline responsiveness to customer requests. In an ideal system, the information could be made available to customers at the first point to demonstrate if we are aware of their issue and where it sits in our response priorities. This may alleviate a significant proportion of requests before they are made.
Early development of systems has the potential to use AI to match requests with known defects and generate draft written responses to enquiries. This would free inspection staff to plan and undertake maintenance instead of manually dealing with customer requests.
MidCoast Roads Strategy 112
The IPWEA’s NSW Roads & Transport Directorate have completed an evaluation of AI potential and a technology pilot with two NSW Councils. We have been included in the Beta testing phase of the project. The customer experience strategy journey map supports the adoption of AI technology. The Asset AI project is not within the present scope. It will run parallel to the Business Transformation Program uplift of our Transport Assets into the full functionality of Technology One’s Enterprise Asset Management Module This will provide significant benefits to Council, staff and customers.
Under S45 of the Civil Liability Act, Council has a defence against liability if we are unaware of the specific defects. AI-automated defect identification could render this defence no longer effective. However, inversely, it provides all of the information necessary to defend a claim under S42.
Automated defect monitoring would provide an opportunity for transparent reporting to the community about current defects and aid in better understanding what we can address.
Implementing AI-automated defect identification, monitoring and reporting should be pursued as a high-priority action.
Compass IoT
Modern vehicles have several sensors that constantly collect information on speed, acceleration, braking, and swerving. This information is available as anonymous cloud datasets. When added to more general observations, such as Google Cloud data, it can be used to derive insights into the network conditions and driver behaviour.
Australian based transport information startup Compass IoT are pioneering tools that leverage the available data into insights. Their revolutionary platform provides near real-time analysis tools for road safety, pavement and surface conditions, journey mapping/planning and intersection analysis.
Datasets in regional areas like the MidCoast are currently limited; however, they will grow rapidly as newer vehicles replace older ones. Using the demonstration data, we could see the impacts of heavy patching on Manning River Drive around Cubba Cubba Creek last year.
The number of vehicles posting data to the cloud platform is limited on the MidCoast. Even with a small dataset, we can observe patterns at key locations. We need to continue to monitor the emergence of this technology as the volume of data will increase as the number of new cars increases.
Autonomous Vehicles and Driver Assistance Systems
Driverless autonomous vehicles are moving through demonstration phases. This technology still has time to go before it is generally accepted. One of the significant impediments is the standard of lane delineation and other measures that give the guidance systems the capacity to operate safely.
This same issue affects the driver assist system in most modern cars. Further work is needed to improve the level of delineation on our road network. Not only will this enhance the level of readiness for growth in autonomous vehicles, but it will also help the current vehicles with driverassist systems. As noted above, general road safety improvements are associated with road delineation treatments.
TfNSW R2 Management Systems Prequalification – Safety, Environment & Quality
We provide road maintenance services for TfNSW under the Road Maintenance Council Contract (RMCC). In 2022, Council received ‘R2’ prequalification under the national system for civil construction works. We have developed and implemented a management system for the work we complete on TfNSW’s behalf. This system covers quality assurance, environmental management and safety.
MidCoast Roads Strategy 113
There is an opportunity for us to expand the application of our management systems across all of the work that we do rather than being confined to RMCC work
Appropriateness of Technical Design and Construction Standards
To address the many maintenance requirements of our road network, it is important to recognise that the maintenance need is often a direct consequence of the inadequacy of one of the many components that make up a road in additional to utilising the asset (‘wear’). Often, these are historic issues that will continue to cause an accelerated rate of asset consumption/depreciation, resulting in damage / failure until they are subject to capital improvement. Some examples of this are:
• A road with poor geometric design for the current traffic
• Construction with local materials of substandard quality
• Inadequate drainage provisions
• Non-complaint construction methods
• Failure to undertake an effective resealing program.
These issues will result in much greater maintenance demands than one designed and built in accordance with current best practice for the current and expected traffic loads If we are to optimise the value derived from transport assets, then we must ensure all new work or renewals meet the requirements of standards and specifications that are fit for purpose.
Much of the new infrastructure is privately funded through new development and then handed to or inherited by the Council. Historically, councils have been reluctant to increase development standards as doing so will increase the cost of work required for development and potentially deter some developments from proceeding. On the surface, there may be some truth to this, however, where councils already have a significant asset liability or backlog, it serves no positive purpose to continue adding to it with poorly designed or built infrastructure that requires additional funding for maintenance or premature renewal.
In a recent example, a defect was raised in a new subdivision that is less than two years old where a vehicle has travelled over a stormwater inlet virtually destroying the lintel. The developer has refused to rectify the damage as it is well beyond normal maintenance. The manufacturer claims the product meets the required standards. Whilst Council staff do not agree with the manufacturer or the developer, to fix the problem will take away from existing maintenance funding.
The factors that resulted in this defect are:
• Road width
• Road alignment (curve)
• Location of pit (on inside of curve)
• Inadequate reinforcing ties
• Substandard concrete (not confirmed)
We need to undertake a performance review of both council and developer works and revise the technical design and construction specifications to ensure we are getting the most out of new or renewed assets.

MidCoast Roads Strategy 114
Figure 70 - Destroyed Stormwater Inlet Pit Lintel (<2 years old)
Planning For Growth
Forward growth planning has typically been done on an ad hoc basis associated with rezonings or concept planning for developments at a precinct level.
Considering the potential for future growth, it would be beneficial to revise the long-term growth planning on the traffic-generating potential and update this with the most recent information. This would ensure a steady program of improvements is planned for the future and appropriate levels of developer contributions can be collected to offset the proportion of funding required for the upgrades by new developments
MidCoast Roads Strategy 115
Future Desired State Summary
The desired future state has established the need to increase maintenance and renewal funding. With this, the Road Strategy can deliver on the intended outcomes. If we continue without change, the road network will decline by nearly 25% over the next decade.
Whether we use the current depreciation as a guide for the magnitude of increases required, the results of the AEC Financial Sustainability Review or the ARRB modelling, recognising and accepting that more funding is needed is a critical milestone in improving outcomes.
We've recognised the significant backlog that exists and that it needs to be addressed. Increasing renewal expenditure at the level recommended to maintain network condition by the ARRB modelling might delay addressing the backlog in the shorter term.
Additional funding of $26.35m for renewals and $8.5M for maintenance is required.
A large body of technical, operational and strategic work is required to uplift our organisational performance and prepare us for the future. Current technical and management resources can support this; however, it will require supplementation with external resources and greater collaboration across the rest of the organisation.
It is recommended that any additional funding be allocated to establish a rolling program to increase the participation of cadets and apprentices in the workforce. This is essential to providing skilled resources to service the community now and into the future, where existing resources are limited and ageing. This approach would also allow Council to take a greater leadership role in addressing high youth unemployment within the MidCoast Region
MidCoast Roads Strategy 116
Options
The options to restore the road network's condition to satisfactory over time are limited. The AEC Financial Sustainability Review provides specific details on different funding levels.
The evidence supports a case for substantially increased funding for renewals and maintenance to ensure that the road network does not deteriorate any further. This needs to be part of an engagement program that considers both the community’s desire for better infrastructure and the willingness to pay or affordability.
A substantial backlog of work already exists. Unless something changes, this backlog will continue to accumulate Each year that renewals do not exceed the rate of deterioration adds to the backlog. Failing to undertake preventative maintenance programs or work that extends asset lives only exacerbates the current poor situation and the network deteriorates
Once a decision is made to increase funding or not, the options relate to how much additional funding and its timing. Whilst any delay with increased funding adds to the backlog, it is unrealistic to expect income to be increased all at once.
Priority for allocation of additional funding should go to resurfacing, crack sealing and shoulder grading/drainage programs to immediately slow the rate of physical deterioration
Secondary priorities include vegetation management, delineation and safety barrier replacement.
There may be opportunities to leverage new technologies and innovative solutions in the future. A large body of technical, operational and strategic work is required to uplift the organisational performance and prepare for the future.
Overall, the key will be to continue monitoring and reporting on performance over time so that we are in a position to better gauge the impacts of the decision and make more informed decisions in the future
MidCoast Roads Strategy 117
References
BIS Oxford Economics, 2021 Update: The Value of Australia's Roads BIS-Oxford-Summary-and-Report.pdf (roads.org.au)
Commonwealth Government, National Road Safety Strategy 2021-30, National Road Safety Strategy
Commonwealth Government Joint Select Committee on Road Safety, Driving Reform: final report for the Inquiry onto Road Safety, 2022 & Government Response 2023 Driving Reform: final report for the Inquiry into Road Safety (aph.gov.au) australian-government-response-to-the-joint-select-committee-on-road-safety-october-2023.pdf (infrastructure.gov.au)
Commonwealth Government, Royal Commission into National Natural Disaster Arrangements, October 2020
Royal Commission into National Natural Disaster Arrangements Report
Galehouse L, Moulthrop J & Hicks G, Principles of Pavement Preservation – Definitions, Benefits, Issues and Barriers, October 2003 TR News 228 - September-October 2003: Preserving Highway Infrastructure (trb.org)
Independent Pricing & Regulatory Tribunal – Fit For Future Ration Calculation Microsoft Word - IW - Reporting - ~ Fit for the future DRAFT infrastructure ratios written explanation 220615 (nsw.gov.au)
Infrastructure Australia, Australian Infrastructure Audit 2019 Australian Infrastructure Audit 2019 | Infrastructure Australia
IPWEA Levels of Service & Community Engagement (Practice Note 8)
IPWEA Condition Assessment & Asset Performance Guidelines (Practice Note 9 2015)
IPWEA NSW & ACT, Lessons Learned from Disaster Recovery, 2021
IPWEA NSW & ACT, Automated Detection of Road Defects, 2021
IPWEA NSW & ACT, Timber Bridge Management Report, October 2023
IPWEA NSW & ACT, 2023 Local Roads Congress Communique https://www.ipweansw.org/resources/2023-local-roads-congress-communique
MidCoast Council (AEC), Financial Sustainability Review, December 2023 (draft)
MidCoast Council (KPMG), Customer Experience Strategy, 2023 (draft)
MidCoast Council, Transport Quarterly Operations Report, Item# 16.5 Page 207, 25 October 2023
Ordinary Council Meeting Agenda 25-OCTOBER-2023-OPEN-AGENDA_2.pdf
MidCoast Council, Risk Management Policy & Framework, 2019 Risk Management Policy and Framework - MidCoast Council (nsw.gov.au)
MidCoast Council, Asset Management Policy, 2021 Asset Management Policy - MidCoast Council (nsw.gov.au)
MidCoast Roads Strategy 118
MidCoast Council, Asset Management Strategy 2022-2032 Asset Management Strategy - MidCoast Council (nsw.gov.au
MidCoast Council, Asset Management Plan (2023 Draft)– Roads, Bridges & Stormwater
MidCoast Council, Climate Change Policy, June 2021 Climate_Change_Policy.pdf (amazonaws.com)
MidCoast Council, Climate Action Strategy, June 2021 https://haveyoursay.midcoast.nsw.gov.au/download_file/360/483
NSW Roads Act 1993
NSW Civil Liability Act 2002
NSW Audit Office, Local Government 2022, Financial Audit Report, 13 June 2023 TABLING REPORT - Local Government 2022.pdf (nsw.gov.au)
NSW Audit Office, Regional Road Safety, Performance Audit Report, 30 November 2023 FINAL REPORT - Regional road safety (nsw.gov.au)
NSW Grants Commission, Information & Key Resources
Local Government Grants Commission - Office of Local Government NSW
NSW Government, Final Report of the NSW Bushfire Enquiry, July 2020 Final-Report-of-the-NSW-Bushfire-Inquiry.pdf
NSW Office of Local Government (OLG) Council Comparison Time Series Data 2021/2022 https://www.olg.nsw.gov.au/wp-content/uploads/2023/10/Time-Series-Data-2021-22.xlsx
Pittwater Online News, Roads to Pittwater, July 2018 Pittwater Online News
Roads & Maritime Service , Roads Thematic History, 2006
Roads Thematic History - Second Edition 2006 (nsw.gov.au)
Statewide Mutual, Best Practice Manual – Roads , June 2021
Texas Transport Institute, The Benefits of Pavement Markings: A Renewed Perspective Based on Recent and Ongoing Research, 2008 The Benefits of Pavement Markings - Safety | Federal Highway Administration (dot.gov)
Transport For NSW – NSW Centre for Road Safety, Crash Statistics
NSW Centre for Road Safety | Transport for NSW LGA crashes summary | Transport for NSW
Transport For NSW, Block Grant Funding Regional Road Block Grant | Transport for NSW 2023-2024 Block Grant Payments and repair allocations Attachment B (nsw.gov.au)
Transport For NSW, National Prequalification System for Civil (Road & Bridge) Construction, December 2023
National Prequalification System for Civil (Road and Bridge) Construction Guidelines December 2023 (nsw.gov.au)
Transport for NSW, 2026 Road Safety Action Plan – Towards zero trauma on NSW roads Home | Towards Zero (nsw.gov.au)
MidCoast Roads Strategy 119
Related Links
Information about Crown roads | Crown Lands (nsw.gov.au)
The history of Transport for NSW agencies in NSW | Transport for NSW
Ozroads: NSW Road History
Roads Australia
IPWEA (NSW & ACT) Asset AI Project
About | Compass IoT
MidCoast Roads Strategy 120
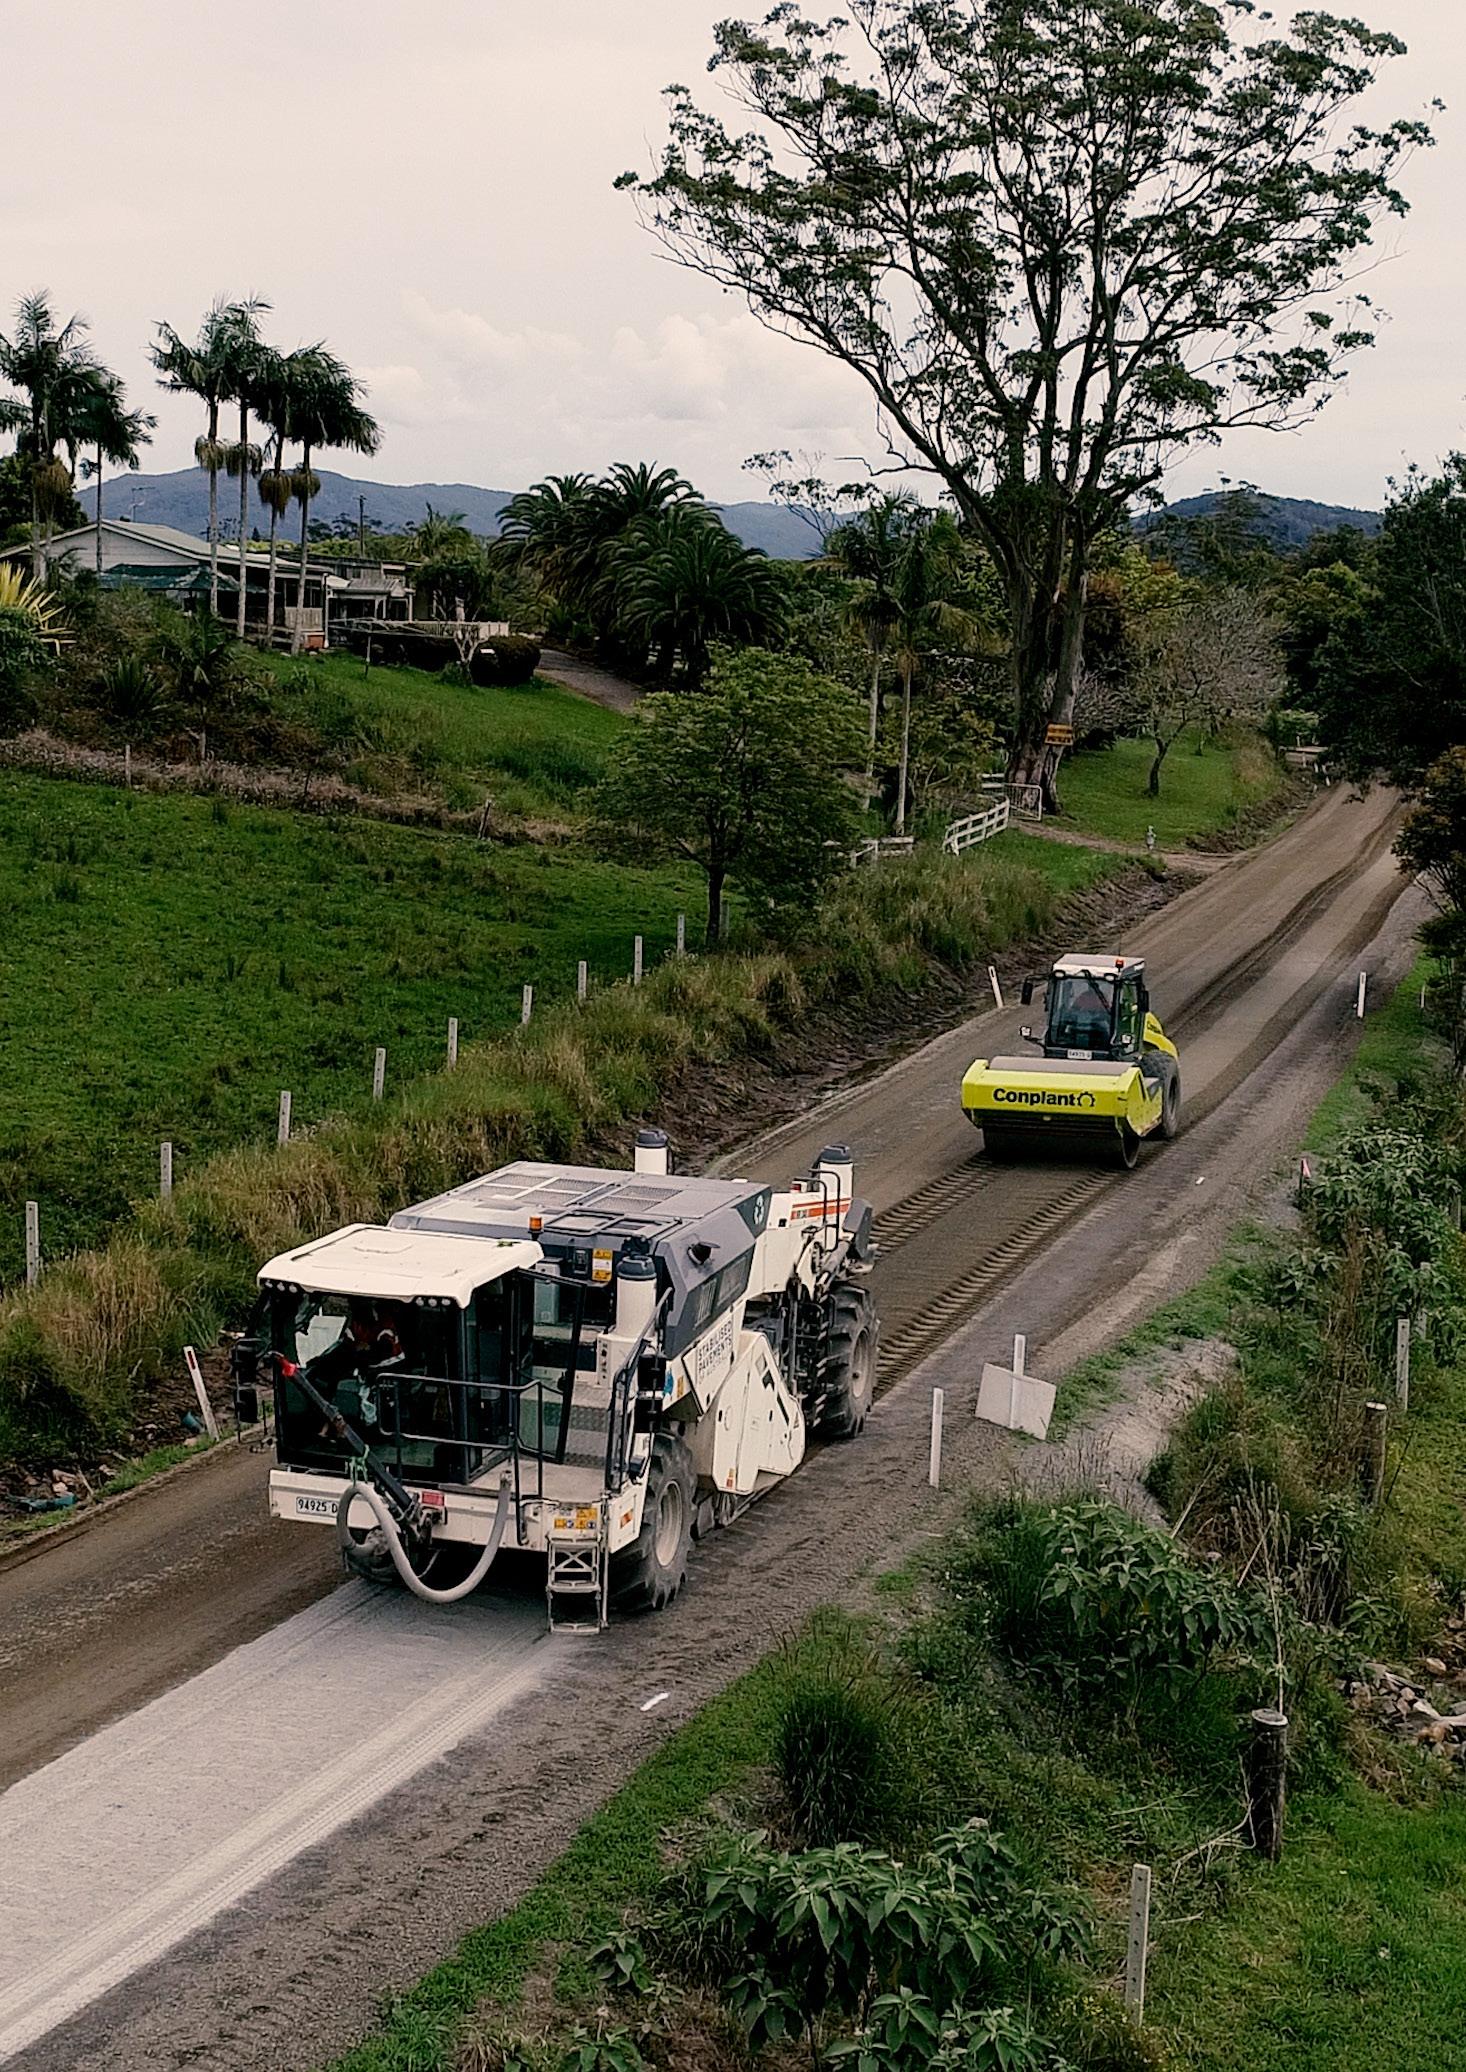
APPENDICES
Appendix A – Strategic Action Plans
MidCoast Roads Strategy 122
1. Asset Reconditioning & Preventative Maintenance Actions
Item Action
1.1 Implement an expanded heavy patching program in conjunction with an increased resealing program
Internal (maintenance) - heavy patching
Contractor - resealing
1.2 Develop and implement a guardrail renewal and safety fencing compliance upgrade program
Internal (assets) – program development
(operations) project management
Installation work by contract
$1.4M/yr - Number/surface area heavy patched - Pavement Area resealed
$800K/yr - Length of chain mesh fence replaced - Additional guardrail length
1.3 Implement an expanded resealing program
1.4 Develop and implement a crack sealing program as part of increased planned maintenance
1.5 Develop and implement a Bus Shelter renovation and replacement program
Internal (maintenance) - heavy patching
Contractor - resealing
Internal (maintenance) with crack sealing equipment
Internal (assets) – program development & management
Installation work by contract
$4.85M/yr - Pavement Area resealed
- Average age of pavement seals reducing
$25K + Maint - Length of crack sealing complete
$40K/yr - Target # or renewals completed
1.6 Develop and adopt performance standards for inspections, defect intervention levels and maintenance response times as part of the extension on existing service levels together
Internal (operations) – Develop, implement, record and report
Nil - Inspection standards, intervention levels and revised service levels adopted
MidCoast Roads Strategy 123
Resourcing Model Additional Funding Required Performance Measures
with additional detail added to the quarterly operations report - Additional detail reported
1.7 Develop and implement a cutting widening program to improve road alignments for safety and to generate material for embankment widening and gravel road resheeting
Internal – investigation & implementation (Graduate or student project)
1.8 Develop and implement a footpath replacement program Internal (assets) – program development
Internal (operations) - construction
Nil - Investigation completed - Gravel sources developed - # of road alignments improved
$85K/yr - Length of footpath replaced
1.9 Investigate the opportunity to expand the quality, safety and environmental management systems used for work on state roads (R2 Prequalification) to all work undertaken across the network (regional and local roads).
1.10 Develop and implement a program to improve and replace guideposts and linemarking on roads to aid delineation
Internal (operations, assets, projects & engineering)
Internal (assets) – program development
Internal (operations) - construction
1.11 Develop and implement a signage replacement program Internal (operations)
1.12 Develop and implement a culvert replacement/rehabilitation program
Internal (assets) – program development
Internal (operations) - construction
Nil - Investigation complete and recommendation made
$560K/yr - # guideposts replaced - # raised markers replaced - Linemarking completed
$100K/yr - # signs replaced
$1M/yr - # culverts replaced or rehabilitated -
MidCoast Roads Strategy 124
2. Asset Management Improvement Actions
Item Action
2.1 Undertake an automated footpath condition assessment and defect assessment to inform a future repair and renewal program
Internal (assets) - supported by consultant $100K - Condition assessment complete - Data incorporated in renewal program & AMP
2.2 Revise the Kerb and Gutter condition and implement an annual renewal program Internal (assets) - supported by consultant
- Condition assessment complete
- Data incorporated in renewal program & AMP
2.3 Consider road program management at the sub or part segment level and how this can be accommodated within current asset and accounting frameworks. Internal (assets in consultation with operations)
2.4 Review current trends in Higher Mass Limit Vehicles and Performance Based Standards with respect to our design and construction specifications and existing road network, recommending changes and a program of works to provide long term community benefits
2.5 Compare and contrast the treatment unit rates used for the ARRB Condition Monitoring and the AEC Financial Sustainability Review and validate them against actual rates delivered by MidCoast Council.
2.6 Conduct a performance audit on representative samples of works completed by both Council and developers over the last 20 years and recommend changes to the design and construction specifications to improve asset performance and optimise community value.
Internal (assets) supported by consultant
External – consultation with key industry stakeholders
- Programs developed at sub segment level - Asset & accounting frameworks adjusted
- Recommendations made - Works program prepared
Differences in base rates understood
- Performance assessment complete - Recommended changes adopted in specifications
MidCoast Roads Strategy 125
Resourcing Model Additional Funding Required Performance Measures
$50K
Nil
Nil
Internal (assets)
Internal (assets) Nil -
-
Review complete
$50K
2.7 Investigate existing unsealed roads to determine those that would be cheaper over their lifecycle to be sealed and develop a prioritised program with estimates for future funding considerations
2.8 Develop data on pavement thickness and material quality for sealed roads and remaining gravel depth for unsealed roads to inform future decision-making and strategies around renewal.
2.9 Compile the observations and impacts from recent natural disasters into a lesson learnt and improvement opportunities to incorporate into future designs
2.10 Review the current maintenance activities to ensure that renewals or rehabilitation work is being properly capitalised
Internal – supported by consultants
$25K - Investigation complete
2.11 Complete a traffic study into current and future traffic along collector and distributor roads to determine current deficiencies and future needs with recommendations to address these
2.12 Increase the number of technical staff trained in road safety audits and use them to work with asset inspectors recording roadside hazards
Internal (assets & operations) Nil - Data being systematically collected and added to the asset information system
Internal (assets & operations) Nil - Experiences documented - Improvement opportunities identified
Internal (assets & operations) Nil - Review complete - Capital renewal work done from within the maintenance budget is accounted for.
Internal (assets, project delivery & development engineering) supported by external consultant
$150K - Traffic study complete - Deficiencies identified - Recommendations documented
Internal (assets, project delivery & Nil - Additional staff trained in road safety audits - Improved understanding and recognition of different roles - Safer designs -
MidCoast Roads Strategy 126
3. Growth, Climate Change & Infrastructure Resilience Recommendations
3.1 Undertake asset criticality assessment to identify the relative levels of importance for transport network assets. Consult with critical infrastructure providers, Local Emergency Management Committee and Zone Bushfire Management Committee
3.2 Undertake a network resilience study and develop an asset improvement plan that reflects what was learnt from recent experiences with and a greater focus on keeping critical routes accessible during and immediately after events.
3.3 Undertake a climate change adaptation study to identify the infrastructure at risk, options to mitigate the risk and costs. Finalise with a Climate Change Adaptation Strategy
Internal (assets) – supported by consultant
External – consultation with key critical infrastructure & emergency service stakeholders
(assets) - supported by consultant
Internal (assets) - supported by consultant
3.4 Conduct a network wide assessment of Road Clear Zones and compile a list of prioritised works to address high-risk deficiencies Internal – supported by consultants
3.5 Expand roadside vegetation program to improve access and resilience of infrastructure during emergencies
(operations)
- Assessment complete - Data incorporated in AMP
3.6 Develop a shoulder/embankment widening program as an alternative to disposal of spoil from road works sites
Internal – graduate or student project
- Study complete - Data incorporated in AMP
- Study complete - Data incorporated in AMP
- Study complete - Data incorporated in AMP
- Program scope revised - Performance measures defined - Implementation with reporting
- Program developed and being progressively implemented
MidCoast Roads Strategy 127
Item
Resourcing Model Additional Funding Required Performance Measures
Action
$100K
$250K
Internal
$100K
$100K
Maint
Internal
Nil
3.7 Complete a strategic review of future growth needs in relation to transport infrastructure and prepare and overall MCC Transport Infrastructure Growth Plan to service future development. This will incorporate the previous work done for historical DA’s and rezonings into a single current transport growth strategy ensuring the infrastructure required by new development and growth is proportionally funded from S711 charges
3.8 Investigate the extent, generation and magnitude of Scope 3 emissions generated from operation, maintenance of the public road network
3.9 Revise the project delivery framework to incorporate an assessment of Climate Change and Greenhouse Gas Emissions in the planning and execution phases, capturing and reporting any identified benefits.
3.10 Investigate actions to encourage the expansion of EV charging facilities in the road reserve through appropriate lease arrangements or Council ownership that is beneficial to the community and assists in the reduction of greenhouse gas emissions
Internal (assets & strategic land use planning) - supported by consultant
Internal (assets)
Consultant
Internal (projects & engineering)
$150K - Review completed - Plan adopted
- S7.11 plans revised and adopted
$100K - Investigation completed - Recommendations made
Nil - Benefits being progressively captured & reported
Internal (assets)
Consultant
$25K - Investigation complete
- Policy position on use/lease of road reserves determined - Business case for ownership/operation considered
MidCoast Roads Strategy 128
4.1 Advocate for a change to the funding and management arrangements between local, state and federal governments.
Elected
arrangements
4.2 Advocate for greater focus on preventative road safety actions rather than historical accidents statistics Elected
4.3 Advocate for the Block Grant and Roads to Recovery programs to be indexed by the road construction cost index (or at least CPI or the NSW rate peg) each year.
4.4 Continue membership and support of the NSW Roads & Transport Directorate and in particular, the initiatives in the annual NSW Local Roads Congress Communique
4.5 Support NSW Roads & Transport Directorate’s Asset AI project through early adopter involvement in Beta trials.
4.6 Revise the Community Strategic Plan, Delivery Program and Operating Plan to be more wholistic of the challenges faced by Council and the community in relation to the transport network
Elected Council & Executive
Supported Communique supported
Elected
4.7 Develop an annual budgeting and reporting tool that demonstrates the application of funding from different sources to particular projects Internal (Assets & Finance) nil Transparency over the source and application of funding for transport projects.
MidCoast Roads Strategy 129
Item Action Resourcing Model Additional Funding Required Performance Measures
4. Advocacy Plan
Council
Executive Nil Funding
&
improved
Council & Executive Nil Preventative
taken
focus
Elected Council & Executive Nil Funding increase by CPI
Nil R&TD
Unknown Beta
Council Staff
Trials complete
&
Nil CSP, DP & OP Revised
Council, Executive
Council Staff
5. Risk Management Action Plan
5.1 Roll up the existing strategic risk registers for the Transport & Engineering function and finalise a risk management plan at the Transport & Engineering functional level.
Internal (operations, assets, projects & engineering supported by corporate risk team)
5.2 Undertake training and capacity uplift in the implementation of Best Practice defect and risk management.
5.3 Audit and improve existing systems and practices to provide protections under the Civil Liability Act
5.4 Develop and implement service levels and reporting
Internal (operations)
External consultant/facilitator
- Transport & Engineering Strategic Risk Register & Management Plan complete
$100K - Uplift program complete
External consultant/facilitator $50K - Audit Complete - Recommendations provided
Internal (operations) Nil - Levels implemented and reported regularly
5.5 Undertake a lateral branch clearing program for collector and arterial roads to reduce ongoing corridor risk to staff and community during storm and emergency events. Internal (operations)
5.6 Implement a program to identify and rectify nonconforming pram ramps and other priority remedial works required by the Disability Discrimination Act
5.7 Benchmark the Strategic Risk Register and Risk Management Plan for Transport & Engineering against the 2023 IPWEA Road Management Assessment (pg73 IPWEA 2023)
Internal (assets & operations)–investigation & implementation
Internal (operations, assets, projects & engineering supported by corporate risk team)
- Length of road cleared - Volume of material mulched
$50K/yr - # of ramps improved
- Benchmarking complete
MidCoast Roads Strategy 130
Item Action Resourcing Model Additional Funding Required Performance Measures
Nil
Maint
Nil
5.8 Benchmark the Strategic Risk Register & Risk Management Plan for Transport & Engineering against the 2023 IPWEA Timber Bridge Management Assessment (pg51 IPWEA 2023)
5.9 Prepare a network-wide Road Safety Plan using the Roads & Transport Directorates guide
5.10 Review Council’s policy statements for administration, management and maintenance of the transport network.
Internal (operations, assets, projects & engineering supported by corporate risk team)
- Benchmarking complete
Internal (assets) supported by external consultant $100K - Plan developed
Internal (assets, projects & operations)
5.11 Undertake an audit of existing disability car parking spaces against current standards and identify the remedial works necessary to comply or other options for more appropriate disabled car parking provisions. Internal (assets)
5.12 Systematically revise parking and pedestrian access provisions in high activity CBD zones to plan for future improvements including streetscaping upgrades
Internal (assets & projects) supported by external design consultants
5.13 Undertake an AusRAP assessment of regional, collector and distributor roads
Internal (assets) in conjunction with AusRoads
- Policies reviewed
- Audit complete
5.14 Prepare a road renewal and maintenance plan for regional and significant local roads to prioritise resources for resealing and maintenance of high-speed, high-traffic and high-risk roads to address the relatively high proportion of single vehicle accidents on these roads
Internal (assets & operations
$100K - Investigations complete and plan developed for one locality per year
$50K - Assessment complete - Major routes rates using the start system
- Plan completed
MidCoast Roads Strategy 131
Nil
Nil
Nil
nil
midcoast.nsw.gov.au


 Figure 69 - Current Maintenance Service Output Levels & Proposed Levels (subject to additional funding)

