CITY OF LONG BEACH


COMPREHENSIVE PLAN 2022–2032

ADOPTED: AUGUST 1, 2023


ADOPTED: AUGUST 1, 2023


The City of Long Beach Comprehensive Plan 2022–2032 was prepared with the input of elected officials, community leaders and volunteers, business owners and residents—each of whom contributed their time and their expertise to the goal and strategies that will guide the City for the next decade.
The City of Long Beach would like to thank all those who participated and provided insightful comments and feedback throughout the process. These contributions have guided the preparation of the Comprehensive Plan and ensured that it truly represents Long Beach’s collective vision.
The City of Long Beach would like to especially recognize the contributions of the following people:
John Bendo, City Council President
Elizabeth M. Treston, City Council Vice President
Roy Lester, City Council Member
Karen McInnis, City Council Member
Tina Posterli, City Council Member
Ronald J. Walsh, Acting City Manager
Patricia Bourne, Director, City of Long Beach Economic Development and Planning
John McNally, Director, City of Long Beach Public Relations and Special Projects
Jordan Schieber, Assistant Planner, City of Long Beach Economic Development and Planning
Franklin Alvarado
Steve Candon
Jason Clancy
Vincent DePasquale
Katherine diMonda
Patrick Gallagher
Michael Negri
Tyrone Nurse
Jackey Odom, Honorary Member
Pearl Polite
Eric Sackler
Damian Sciano, Chairman
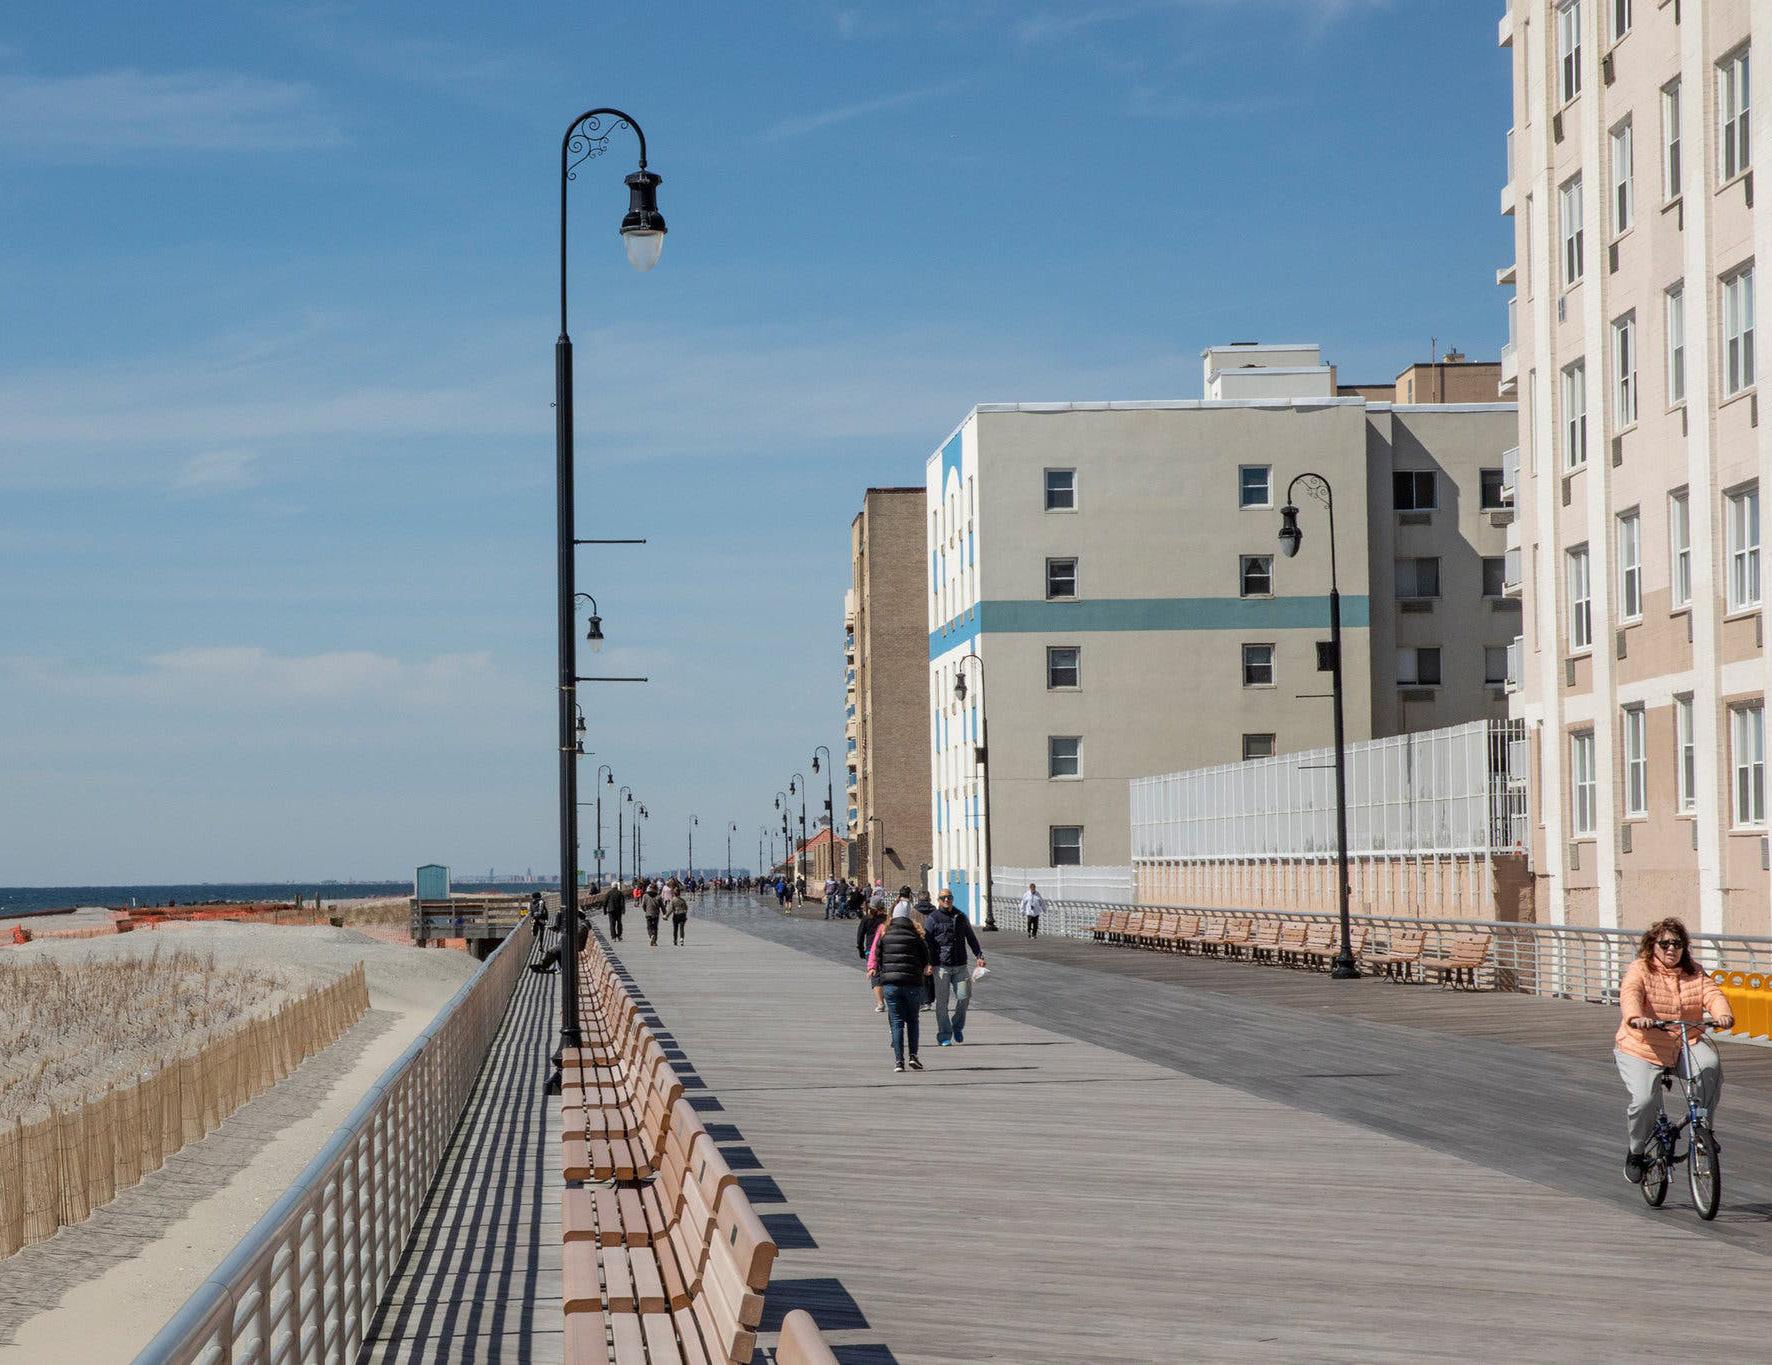
This Comprehensive Plan is an official policy document prepared by the City, with input from community residents and business owners, that guides the community’s vision and goals for its future. The Comprehensive Plan is a mechanism to promote the health, safety, and general welfare of the City residents, presenting a snapshot of the current state of the City, including an inventory of its natural and built spaces, demographic diversity and housing supply, economic health, natural and cultural resource protection, and resiliency to natural and manmade conditions.
At the beginning of the process, the City and Consultant Team established preliminary objectives for the Comprehensive Plan that were shared with the community at the virtual public meeting on April 21, 2022:
f The Plan should be an expression of goals for the City’s future evolution and a series of actions to achieve those goals;
f The Plan should provide an opportunity for the community to reflect on its collective vision for its future, economic, natural, and social environments; and
“Among the most important powers and duties granted by the legislature to a city government is the authority and responsibility to undertake city comprehensive planning and to regulate land use for the purpose of protecting the public health, safety and general welfare of its citizens.”
—New York State General City Law §28-A
f The Plan goals and strategies should guide the City’s policy decisions and assign action items for short- (2-5 years), medium- (6-10 years), and longterm (+10 years) implementation.
New York General City Law § 28-A.3. (a) (2021) defines a “Comprehensive Plan” as “the materials, written and/or graphic, including but not limited to maps, charts, studies, resolutions, reports and other descriptive material that identify the goals, objectives, principles, guidelines, policies, standards, devices and instruments for the immediate and long-range protection, enhancement, growth and development of the city.”
A COMPREHENSIVE PLAN is a dynamic action document that should evolve with the changing needs of the community.
are similar to, and aligned with, regional, State, and federal programs, the City is well-positioned to seek funding and technical assistance for implementation of capital-intensive initiatives. This Comprehensive Plan recommends coordinating with neighboring communities, regional organizations, and Nassau County to maximize visibility and leverage support.
To prepare this City of Long Beach Comprehensive Plan, the City engaged its residents, business owners, local and regional elected and appointed officials, and leaders in discussions about what is working, what is not working, and how the City views its potential in the short-, medium-, and long-term. The Plan strives to balance many opinions and goals and collectively manage change. This Comprehensive Plan presents a coherent vision of a diverse population—children and seniors, long-term residents, and newcomers— and while aspirational, this vision is grounded in the practical reality of the City’s natural, financial, and physical resources and constraints.
A Comprehensive Plan is required to consider needs, plans, and policy documents proffered and adopted by government entities and regional agencies. To that end, the goals and action items presented herein are based on local priorities for economic growth, housing diversity and security, climate resilience and community quality of life. Because these priorities
This Comprehensive Plan charts a framework the City may follow to meet its goals and provides various options to achieve those goals, though it does not
Having an adopted Comprehensive Plan provides: a FRAMEWORK for the City’s growth management strategy;
GUIDANCE for the City to prioritize future planning, conservation, and development opportunities; and
PREDICTABILITY for City decision-making regarding land use and future development.
Nevertheless, even if zoning code revisions are not proposed or implemented, once a Comprehensive Plan is formally adopted, applications for development submitted to the City’s reviewing boards must be considered in the context of the goals and objectives set out in the Comprehensive Plan.
prescribe specific policies or regulations. Following the adoption of the Comprehensive Plan, the City must review, and revise as necessary, their governing land regulations, including the City’s Zoning Code, natural resource protections and subdivision requirements for consistency and accordance with this Comprehensive Plan. In addition, government agencies that propose capital projects in the City of Long Beach must consider their plans in the context of the City’s Comprehensive Plan.
Through its adoption of this Comprehensive Plan, City of Long Beach leadership affirms the Plan as an official policy document. It is therefore essential the Plan presents consensus-based initiatives. The document presents a vision for the future of the City and includes prioritized achievable actions items supported by the community; the action items are realistic and implementable. The Plan designs a blueprint for use by City government, land use boards, volunteer groups, committees, residents, and business owners to implement recommendations that promote appropriate growth and development.
The Comprehensive Plan:
f Creates a framework for implementing the community’s goals;
f Guides future planning, conservation, growth, land use, and economic investment;
f Thoughtfully considers and incorporates related local and regional planning efforts;
f Ensures potential development is consistent with the City’s planning policies and the community’s needs and priorities; and
f Develops a timeline and assigns specific responsibilities for implementing the Plan’s recommendations.
Adoption of a Comprehensive Plan—on its own— does not alter the City’s land use regulations or zoning code. The Comprehensive Plan is a tool to guide development, but not an instrument to change existing laws and codes. A Comprehensive Plan may recommend changes to the City’s zoning code to achieve the plan’s stated goals; however, enacting actual zoning code revisions requires a separate and distinct process.
If an application is inconsistent with the goals of a Comprehensive Plan, an applicant would need to justify to the relevant reviewing board that the project would not be in contravention with the overall City goals set out in the Comprehensive Plan.
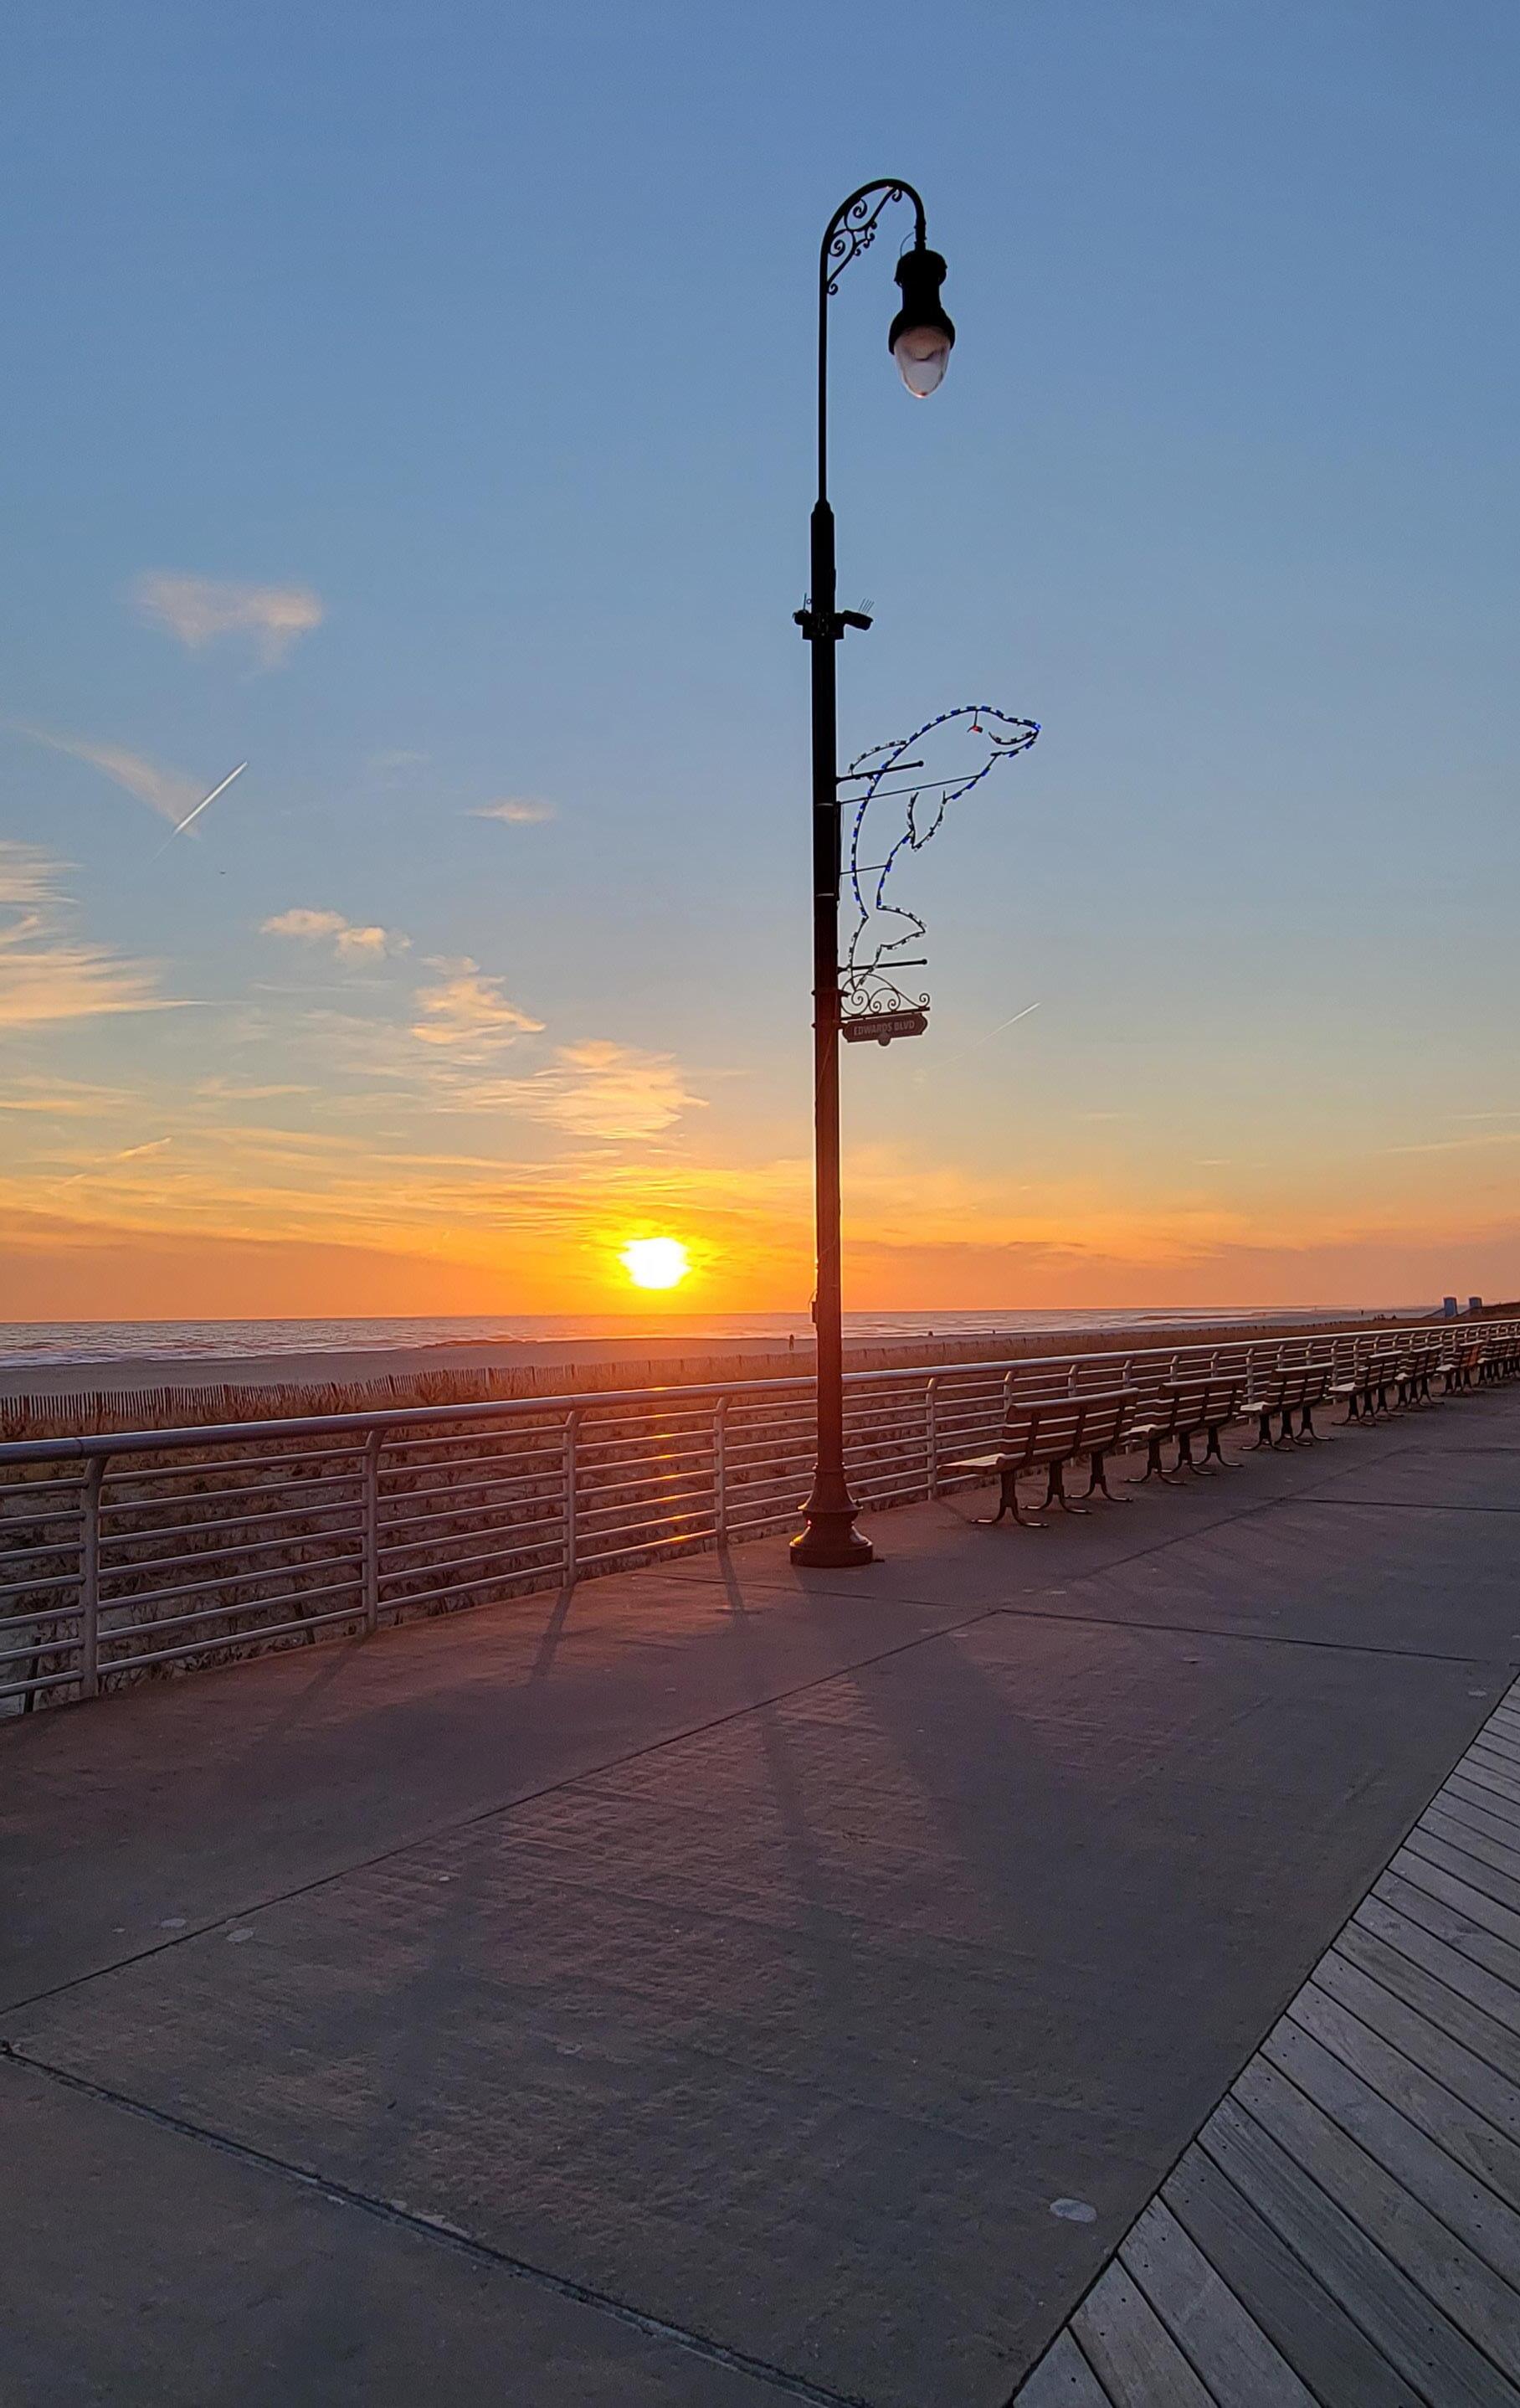
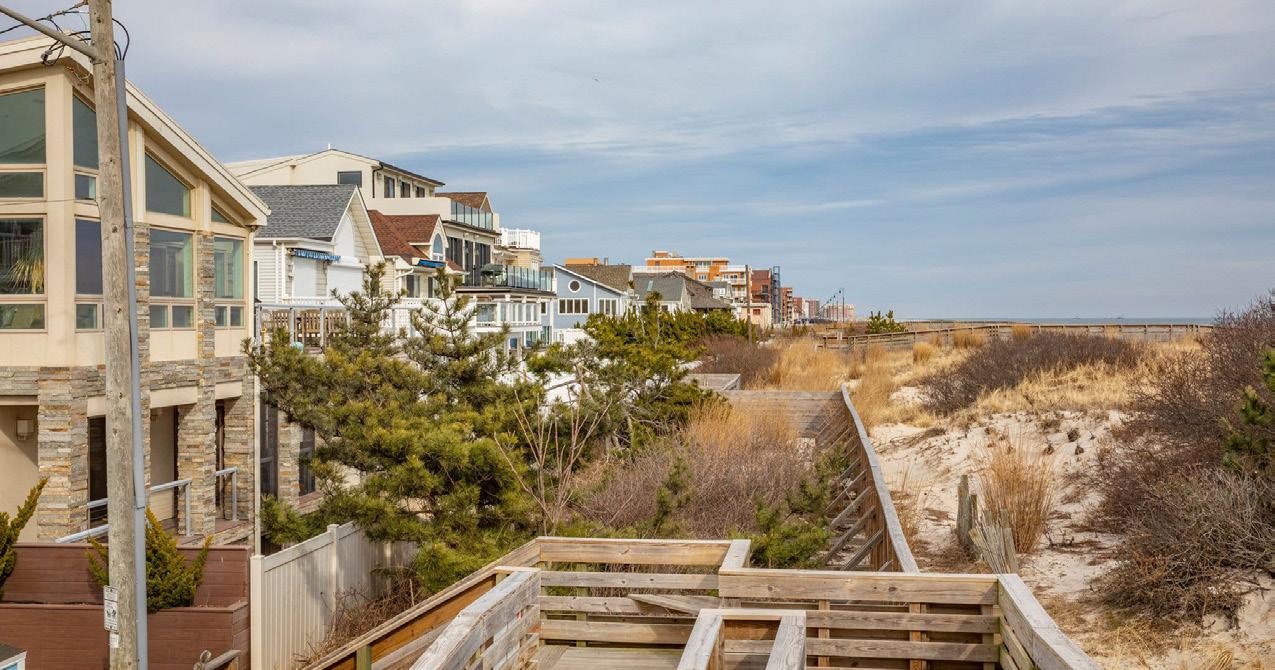
The Comprehensive Plan is divided into six chapters and several accompanying appendices that tell the story of the City of Long Beach’s planning history, where it is today, and lays the groundwork for where it is going into the future.
f Chapter 1: Introduction, Organization, and Context describes the purpose of the Comprehensive Plan, the policy framework, the organization of the document, and previous City of Long Beach planning initiatives.
f Chapter 2: Comprehensive Plan Process and Community Involvement describes and summarizes key findings from the community engagement process and introduces the Vision Statement.
f Chapter 3: Overview of Existing Conditions presents an inventory—in text, graphics, and mapping—of the City’s development patterns, natural and cultural resources, key demographics, and noteworthy trends.
f Chapter 4: Theme Areas with Goals, Strategies, and Action Items synthesizes information described in Chapters 1, 2, and 3. This Chapter is arranged around five key themes: Livable Neighborhoods and Sustained Quality of Life, Thriving Places and Robust Year-Round Economy, Access to Mobility and Connectivity, Enhanced Environment and Climate Resilience, and Sustainable Growth and Opportunities. The public engagement process has informed the goals within each theme. This chapter also presents neighborhood, site-specific, and Citywide strategies, and actions to achieve each goal.
f Chapter 5: Future Land Use Plan is an illustrative presentation of potential land use changes along with land uses to be conserved or to remain as they are based on the goal, strategies, and action steps of the Comprehensive Plan.
f Chapter 6: Conclusion provides the regulatory framework and summarizes next steps for implementation.
f Appendix A: Implementation and Action Plan summarizes action items, assigns responsibility for implementing the action items, and presents a timeline for completion.
f Appendix B: “History and Context of Long Beach,” provided by City of Long Beach staff.
f Appendix C: Recently Completed Resiliency Improvements
f Appendix D: Community Survey Results Report
f Appendix E: Streetsense Commercial District Strategy
f Appendix F: City of Long Beach Comprehensive Plan Final Data Analysis & Existing Conditions
The organization of what is now known as the City of Long Beach began in the 1880s, when the Long Island Rail Road (LIRR) extended service to the area. Capitalizing on the availability of public transit to this beach peninsula, the “Long Beach Improvement Company” secured a 100-year lease for the island of Long Beach and built the Long Beach Hotel as a summer resort. Located on the north side of West Broadway and spanning Riverside Boulevard, the Long Beach Hotel was the largest seaside hotel in the world, offering 5,000 guest rooms and a lobby that hosted public meeting rooms and the City’s first post office. The first Long Beach boardwalk ran across the length of the hotel property, connecting visitors from buildings in the hotel complex to the beach and bathing pavilion.
In 1906, Senator William Reynolds purchased both the Long Beach Hotel and the railroad lease. One year later, the Hotel mysteriously burned down, taking with it adjoining cottages, the hotel dormitory, the chapel, a power plant, and two strings of LIRR cars.
S City of Long Beach Dunes and Beach
1 The following sources were used in this section: City of Long Beach Comprehensive Plan, 2007, Saccardi & Schiff, Inc.; Long Beach New York Rising Community Reconstruction Plan, March 2014; The “History and Context of Long Beach,” provided by City of Long Beach staff, is available in Appendix B

Undeterred, Senator Reynolds pursued developing Long Beach into a seaside planned community, implementing innovative engineering methods to build an “indestructible” 50-foot-wide boardwalk that was 10 feet above the high-water line and supported by concrete piles. The boardwalk was completed in 1914.
When Senator Reynolds first arrived in Long Beach, the area was mostly swampland. As work progressed on the new boardwalk, the material gained by dredging the marshland waters was supplemented with imported soil and used to create a solid island land mass. By 1913, under the umbrella of the Estates at Long Beach Company, Senator Reynolds had developed 200 mansions bordering the new boardwalk along the Atlantic Ocean. The remnants of the original red brick streets can still be found in parts of Long Beach, such as on West Penn Street. In 1922, the City of Long Beach was incorporated.
During World War I and then again during World War II, Long Beach was mainly utilized by the military. This postwar legacy is represented by the pedestrian neighborhood known as the Walks, located between Lindell and New York Boulevards, so named due to its proximity (within walking distance) to the military hospital located at the Nassau Hotel. By the end of
World War II, Long Beach was starting to develop into a middle-class residential and entertainment community. The first school occupied a room in the Nassau Hotel, and the boardwalk attracted familyfriendly recreation activities.
In the 1950s, Long Beach’s boardwalk remained a vibrant recreational center, though it began showing the wear and tear of its age, impelling the City to look at new ways to generate capital to support infrastructure improvements. Thus began the development of apartment buildings, some on former hotel sites, overlooking the Atlantic Ocean.
During the 1970s, when New York State began decommissioning psychiatric hospitals, some of Long Beach’s underutilized hotels were converted to long-term stay facilities to house this population. These uses were short-lived, however, as local officials pushed for amendments to New York State’s regulations regarding adult-care facilities. Pressure to decentralize care facilities to smaller, scattered site community-based housing forced some facilities to close, returning large development sites to the real estate marketplace. Redevelopment of the hotel sites for upscale multi-family residences helped to usher in a renaissance for the City that continues today.
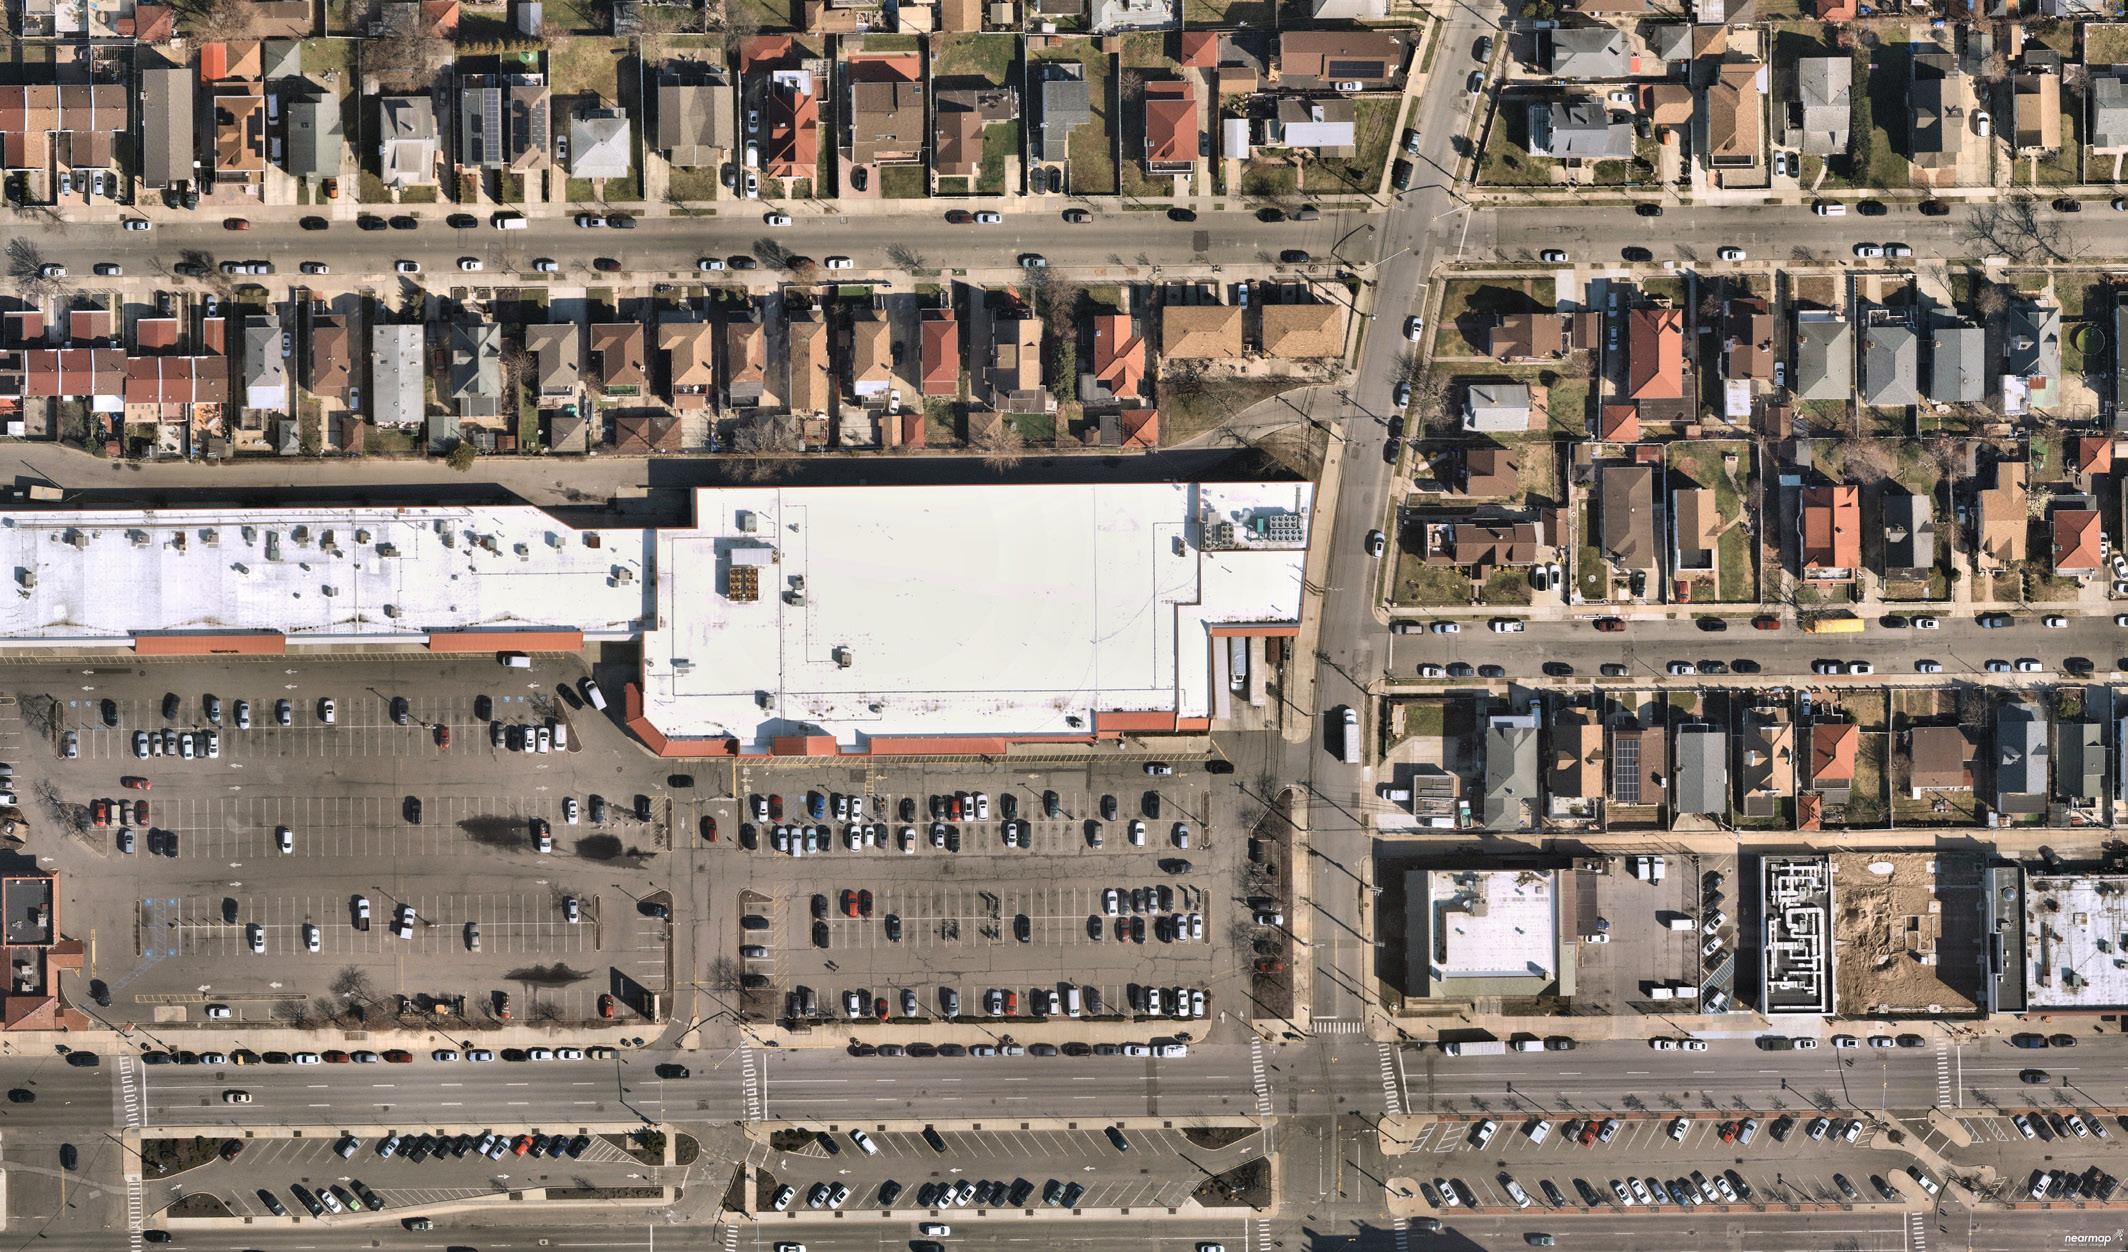
Throughout the 1980s, renewal efforts resulted in upgrades to the City’s sewer and roadway infrastructure and economic development initiatives, including the development of the seven-acre Stop and Shop Shopping Plaza. Since then, Long Beach has welcomed new commercial and retail development, and, generally, retail vacancy rates have remained low. Renewal initiatives also resulted in economic and social separation, using eminent domain, single-use zoning, and street design. The City has addressed, and will continue to address, the consequences of prior policies and actions by improving connectivity, incentivizing multi-use projects, and identifying vacant and underutilized sites to catalyze economic development that is consistent and complementary of the context and character of the neighborhoods in which they are located. The City has identified several parcels, including the Stop and Shop Shopping Plaza, as opportunity sites for redevelopment (see Theme 4.5 of this Comprehensive Plan). Revitalizing these key sites— by incentivizing a mix of uses—would generate new jobs and tax revenue for the City, improve aesthetics, safety, accessibility, and micro-mobility improvements.
In October 2012, Superstorm Sandy made landfall. While the City of Long Beach has, historically, faced damaging winds, repetitive flooding, and storm surge, Superstorm Sandy was the largest storm in
New York State’s recorded history, devastating Long Beach, causing damage to homes, businesses, and key infrastructure, just as the economy was beginning to recover from the recession of 2008. The City was completely inundated by the storm, from the ocean and bay. In the immediate aftermath, the City focused its attention on recovery efforts to ensure that critical infrastructure and emergency services were operational and able to serve residents. Since then, Long Beach officials have focused their attention and resources on resiliency, sustainability, and flood mitigation measures. The City has incorporated sustainability into all capital and operational considerations, reinforcing the City’s ability to recover, as well as remain operational and economically fortified during and after storm events.
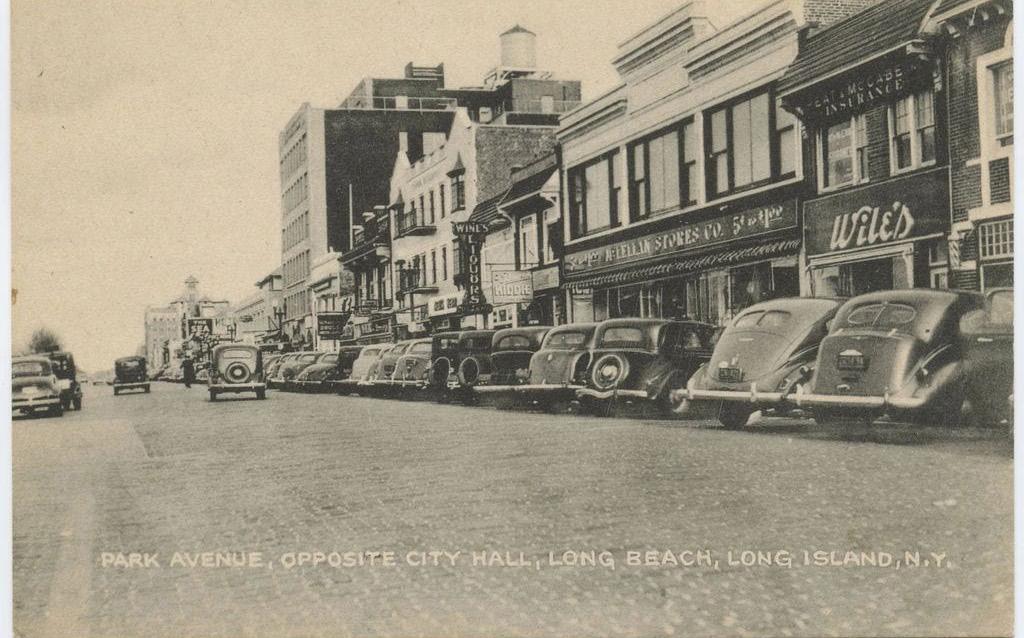
Incorporated as a city on June 1, 1922, Long Beach has a long planning history. This section summarizes the recommendations made and status of some of the City’s previous planning initiatives. It is appropriate that on the heels of celebrating its centennial in 2022, the City will look to this document to chart the course into a new century.
The City of Long Beach has a long history of planning for its future by learning from its past, assertively responding to its current challenges and engaging with residents, visitors, and business owners. The City has implemented many recommendations presented in its long-range planning documents, including zoning code amendments, open space preservation, resilience planning, streetscape and safety improvements via Complete Streets policies and economic development initiatives, and pursuit of grant funds.
Although diverse in their content, many of the previously completed studies, plans and reports reverberate similar visions and goals and in doing so, have guided the City’s decision making. One
goal contained in just about every plan and study is achieving the precarious balance between the beauty and benefit of the City’s waterfront with the impacts of flooding, underscoring the importance of the City’s long-term commitment to implementing resiliency measures that reduce the risk to City residents and their property. The vision and goals of these past plans, studies, and reports are carried forward into this Comprehensive Plan.
The Downtown Long Beach Economic Development Plan was prepared in a collaborative effort between the City Council and the Economic Development Committee of the Long Beach Island Neighborhood Advisory Council. The purpose of the study was to evaluate retail activity in the City’s Central Business District (CBD) via a survey of commercial/retail owners, residents, and visitors. The study analyzed factors that affect commercial health, including the retail mix, available parking and public transportation, urban design, and cultural and event space. The Economic Development Plan identified potential for capturing additional retail expenditures with new mixed-use development in the CBD by implementing the following key initiatives:
f Programming Kennedy Plaza to be the heart of a thriving downtown, with events such as Arts in the Plaza and a Farmers’ Market;
f Working with Waldbaums (now Stop & Shop) to redesign their shopping center;
f Attracting new anchor tenants, including a catering hall, a Cineplex, and the post office expansion;
f Creating a Business Improvement District (BID);
f Enforcing parking regulations;
f Expanding and improving non-vehicular transportation options (such as a trolley); and
f Continuing to improve pedestrian environment with plantings, benches, traffic calming measures at intersections, safer crosswalks, and other streetscape initiatives.
Though prepared in 1997, this Economic Development Plan was prescient in its focus and recommendations. Many of the issues documented in the 1997 Plan were reiterated in responses to the current survey, in discussions with City of Long Beach residents and stakeholders, and remain as priority action items presented in this Comprehensive Plan.
The 2007 Comprehensive Plan is the City’s most recently adopted Comprehensive Plan. The 2007 Plan carried forward economic development recommendations presented in the Downtown Long Beach Economic Development Plan (1997), including the redesign/revitalization of the Stop & Shop plaza and the City’s downtown and existing commercial centers. The 2007 Plan described necessary infrastructure improvements for roadways and sidewalks, wastewater collection and treatment systems, storm water management, and waterfront revitalization; all front and center in the New York Rising Community Reconstruction Plan (2014). The Plan also described necessary traffic, roadway safety, transportation, and multimodal improvements. Several of these recommendations were codified in the City of Long Beach Complete Streets Policy (2013) and subsequently implemented via grant-funded projects in 2015 and 2016 and remain a priority goal for the City. The 2007 Plan recommended amending the City’s zoning code to facilitate workforce housing by allowing new uses in the City’s business district. While the City has allowed some housing, the zoning does not currently allow mixed-use developments in the Park Avenue business district. Amending the
Zoning Code to allow housing over commercial/retail properties, where appropriate, and many of the other recommendations of the 2007 Comprehensive Plan remain relevant and are carried forward into this updated Plan.
The City’s BOA Pre-Nomination Study focused on the North Park neighborhood, which is bounded by Magnolia Boulevard to the west, Long Beach Boulevard to the east, Reynolds Channel to the north, and Park Avenue to the south.
The BOA Study sought improvements in four major areas: business and job development, housing, recreation and open space, and infrastructure. Business and job development intends to provide a wider range of jobs with a focus on career training, provide local hiring opportunities for redevelopment projects, while continuing to provide diverse retail options. For housing, the BOA study seeks to utilize traditional and innovative planning strategies to provide diverse housing options, with an affordable component that is responsive to the existing neighborhood context. Recreation and Open Space recommendations include both new and expanded community facilities designed to provide recreational
and educational opportunities for the community, children in particular. Infrastructure recommendations include a focus on preserving existing housing stock and flood mitigation.
The BOA study area includes residential, recreational, commercial, industrial, and community land uses. Residential uses are clustered in the center of the BOA, while the boundary consists primarily of commercial uses. Recreation, industrial, and community uses are dispersed throughout the area.
The City continues to pursue grant funding for Phase II; however, these opportunities, when offered, have been highly competitive and otherwise limited by New York State.
In 2013, the City Council adopted a Complete Streets policy to advance mobility, safety, and connectivity within and between the City’s neighborhoods. Complete Streets are roadways designed for safe, convenient pedestrian, motorized and nonmotorized transportation access and mobility for all roadway users. The policy recommends specific phased measures to increase pedestrian connectivity and non-motorized transportation, as well as construct crosswalks, curb extensions, and
other pedestrian safety improvements. Since the Complete Streets policy was adopted, the City has required implementation of these improvements wherever possible. The City has received $7 million in grant and City Capital Plan funding that has paid for a variety of improvements, including bicycle lanes, permeable pavement utility strips, streetlights, improved crosswalks, curb extensions, streetscape improvements (including sidewalk planters and bicycle racks), and other safety upgrades on Edwards and National Boulevards. Design work is in progress for an additional $2.5 million of improvements on Park Avenue, including: gateway and streetscape enhancements, traffic calming measures, and connectivity projects within the Bayfront and on Long Beach Boulevard.
Comprehensive Plan Update – “Creating Resilience: A Planning Initiative” (2018–Draft)
In response to, and to rebuild from, Superstorm Sandy (2012) and the subsequent economic recession, in 2015 the City of Long Beach initiated a Comprehensive Plan Update. The Plan Update was organized around four topics:
f Environmental Resilience addressed infrastructure resilience and sustainability, including storm water management, water quality, protection
strategies for and necessary upgrades to critical infrastructure, residential and commercial development along the ocean and the bay, renewable and energy-efficiency programs, sea level rise, climate change, and the reduction of greenhouse gas emissions.
f A Productive and Sustainable Economy assessed economic development, land use, zoning and housing trends, neighborhood preservation, streetscape, recreation, and gateway improvements. The Plan Update recommended a focus on economic development initiatives within the CBD, Bayfront, Oceanfront, and West End neighborhoods, and along Long Beach Boulevard.
f Transportation and Mobility focused on improving vehicular circulation and relieving traffic congestion via a range of parking management strategies. This section recommended enhancing transit and multimodal connections throughout the City through the Complete Streets Policy.
f Implementation and Phasing provided a timeline for future initiatives, and a general discussion of funding sources.
Though this Plan was not adopted by the City, its focus on balancing transportation, infrastructure, housing,
and land use pressures with economic development, environmental sustainability, and resilience remain relevant.
One of the most significant challenges to the longterm sustainability of the City of Long Beach is sea level rise and more frequent short-duration high-intensity storm events. Born from its oceanfront location on an Atlantic Coast barrier island, development density, high water table, and low permeability, Long Beach has long prioritized community resilience. When faced with a natural disaster and/or extreme weather event, a community’s preparedness is exposed. A resilient community is not only prepared to withstand and respond to a natural disaster, but also able to rebound and recover quickly and efficiently. The following planning documents summarize Long Beach’s long commitment to fortifying its position. However, as demonstrated in and documented by the City’s New York Rising Community Reconstruction Plan (2014), even the best laid plans can be tested during a catastrophic event. In the years following Superstorm Sandy, the City has identified its vulnerabilities and allocated resources toward community resilience.
Prompted by the passage of, and to ensure consistency with, the City’s Comprehensive Plan adopted in 2007, the City of Long Beach prepared a Draft Local Waterfront Revitalization Plan (LWRP) in 2009. While the 2009 Draft LWRP was ultimately not adopted by the New York State Department State (DOS), it reiterated recommendations prioritized in the 2007 Comprehensive Plan. The 2009 Draft LWRP recommended economic development and revitalization of the Bayfront area with a mix of residential, commercial, civic, and water-dependent uses. To facilitate the redevelopment of this area, the 2009 Draft LWRP recommended land use and zoning text and map amendments for a mix of uses along the waterfront. Other familiar priorities described in the 2009 Draft LWRP included design development of the Stop & Shop plaza, streetscape/ façade improvement projects, fortifying flood and erosion control infrastructure, as well as increasing public access to and pedestrian amenities along the waterfront, including recreation and open space opportunities, boardwalks and walkways, docks, and piers. The Plan also promoted improved pedestrian connectivity and support for non-motorized transit.
In 2016, and generally in conjunction with its comprehensive planning initiative at that time, the City completed a Draft LWRP. The Draft was submitted to and reviewed by DOS, with their comments being given to the City in 2018. As DOS requirements had changed significantly in those two years, funds were obtained from DOS to make the necessary revisions. The City is incorporating DOS’ comments on the 2016 Draft LWRP and coordinating with this Comprehensive Plan to ensure consistency of recommendations. The City intends to complete this effort in 2024 then submit the final Draft LWRP to DOS. Priority initiatives detailed in the 2016 Draft LWRP that continue to be relevant include: implementation of multimodal safety projects detailed in the City’s Complete Streets policy (along Long Beach Road and Park Avenue), including sidewalks, bicycle lanes, traffic calming measures, streetscape improvements, streetlights, and crosswalks.
Another important component of the City’s postSuperstorm Sandy resilience efforts involved a sustainability assessment for the West End neighborhood. The assessment evaluated existing conditions, identified short- and long-term
opportunities for improving environmental, economic, and social sustainability. Through desktop analyses, physical condition evaluation, stakeholder interviews, a photographic inventory, and site visits, the assessment cataloged positive qualities and areas for improvement. The evaluation was accomplished using the Leadership in Energy and Environmental Design (LEED) Neighborhood Development (ND) Sustainable Neighborhood Assessment Tool.
The assessment recommended policy, planning, and development initiatives that, when implemented, would reduce the City’s disaster risk and create a more resilient and sustainable future. The recommendations were divided into five key themes, which are common throughout many of the planning documents summarized herein. These are:
f Living with Water – The West End neighborhood is built in a low-lying area with very little permeable surface and a high water table. Climate change models demonstrate that over the next 100 years, extreme weather events and storm flooding will become far more frequent. To be best prepared, the City must implement measures that help the West End neighborhood adapt to, and rebound from, the consequences of major storm events.
f Green Space/Active Space – The assessment revealed an “overwhelming” lack of open space in the West End neighborhood. In addition to the benefits offered by connecting the ocean and bay sides of the neighborhood, passive and generally undeveloped recreation areas and open spaces absorb storm water.
f Rebranding and Reinvesting – The assessment highlighted the importance in continued investment in the West End neighborhood, noting that capital investment “improves economic vitality by attracting residents and visitors, helps foster an identity for the neighborhood and creates a business environment that invites and encourages a diverse mix of offerings.”
f Cyclist and Pedestrian Infrastructure – The physical constraints and lack of pedestrian, non-motorized amenities in the West End neighborhood have resulted in congested streets and significant parking supply-and-demand imbalances. The assessment recommends physical and policy changes to address this disparity.
f Parking Management – Implementing a parking management strategy would allow creative off-street shared parking arrangements to
accommodate not only the existing residential population, but also the commercial/restaurant/ retail demand and maximize parking efficiency.
In October 2012, Superstorm Sandy completely inundated the City of Long Beach with water from the Atlantic Ocean on one side of the barrier island, and storm surge from the Bayfront. The storm caused power outages, damage to homes and businesses, and a complete shutdown of the City’s drinking water supply and sewer infrastructure. Given the extent of destruction, the City of Long Beach, Nassau County, New York State, and many federal government agencies evaluated the damage, issued reports documenting the physical condition and estimating financial damages to the City of Long Beach. The NYRCR Plan is one of those reports.
The NYRCR Program was created in 2013 by the Governor’s Office of Storm Recovery (GOSR) to provide financial assistance to communities throughout New York State that were hardest hit by Superstorm Sandy.
Using U.S. Housing and Urban Development (HUD) Community Development Block Grant (CDBG) Disaster Recovery (DR) funding, the NYRCR Program provided technical assistance to municipalities to inventory
damage and develop projects that would increase the communities’ resilience to storm events. Following completion of the NYRCR Plan, GOSR selected projects that would receive funds for implementation. GOSR initially allocated $25 million to the City of Long Beach for implementation of resiliency projects. To date, the City has received approximately $20 million for projects under the NYRCR Program and has supplemented the funding with Federal Emergency Management Agency (FEMA) and City Capital Projects dollars. A list of these projects is provided in Appendix C. Some of the most significant City projects and their status as of May 2023 are:
f North Shore Bulkheading project – Construction of new and/or fortification of existing bulkheading along the City’s north shore. All new bulkheads were installed to the height equal to the Base Flood Elevation (BFE).
f Northshore Critical Infrastructure Project –Funded by FEMA, this project is underway and will provide bulkhead improvements and pumping of water during high tides and flood events.
f Office of Emergency Management – Completed construction of the Office of Emergency
Management within the sixth floor of Long Beach City Hall.
f Long Beach Drainage Improvements –Addresses chronic flood prone areas in Long Beach. Improvements include concrete curbs and gutters, sidewalks, pedestrian ramps and crosswalks, driveway aprons, street lighting, and the installation of a completely new subsurface storm sewer drainage system to mitigate potential flooding.
f Consolidation of the Sewerage Treatment Plant with Nassau County – Results in the cleanup of Reynolds Channel, improves the wetland protection for future storms, and ultimately frees up an approximately five-acre parcel for redevelopment/reuse by the City.
f Citywide infrastructure improvements –Completed the installation of new catch basins and manholes, and installing backflow devices in key locations.
f Critical Services – Fortifying emergency service structures (Fire Stations and Police headquarters) by raising electrical panels, flood- and windproofing windows and doors and installing fixed generators. This project is funded by FEMA.
In 2019, recognizing there is no one solution for mitigating flood hazards, the City prepared a Floodplain Management Plan (FMP) to identify alternatives that would increase flood resilience. The first FMP was developed in 2019, adopted in 2020, and is in the process of being adopted. The Committee meets several times a year to discuss flooding issues and potential improvements that could be included in the next FMP update.
Through a community engagement process facilitated by the City, the FMP identified areas of repetitive loss (the entirety of the City) and initiatives to meet flood hazard mitigation objectives.
The FMP meets City, State, and Federal planning requirements that allow the City to remain in the Community Rating System (CRS) program with a Class 7 CRS Rating. This rating reduces homeowners FEMA flood insurance by 15 percent. The City is actively implementing methods and activities with the goals of maintaining this rating and working to lower it. If the rating is lowered, then flood insurance would be reduced even more. The City’s goal is to obtain Class 6 or lower status, resulting in a 20 percent insurance reduction
The FMP also coordinates existing plans and programs for high-priority initiatives and projects to mitigate possible disaster impacts. The FMP is linked to plans adopted by the City and Nassau County to ensure they can work together in achieving hazard mitigation.
The FMP features five goals to protect the City from flood vulnerability:
f Protect the City’s built environment from flooding and sea level rise;
f Increase resiliency to flooding and sea level rise;
f Protect the natural environment from the impacts of flooding;
f Educate the public, officials, and other stakeholders about flood hazards and what can be done to mitigate impacts; and
f Ensure effective response to flood events to save lives and protect property.
The objectives under each goal lay out steps the City can implement to reduce their risk and vulnerability to flooding.
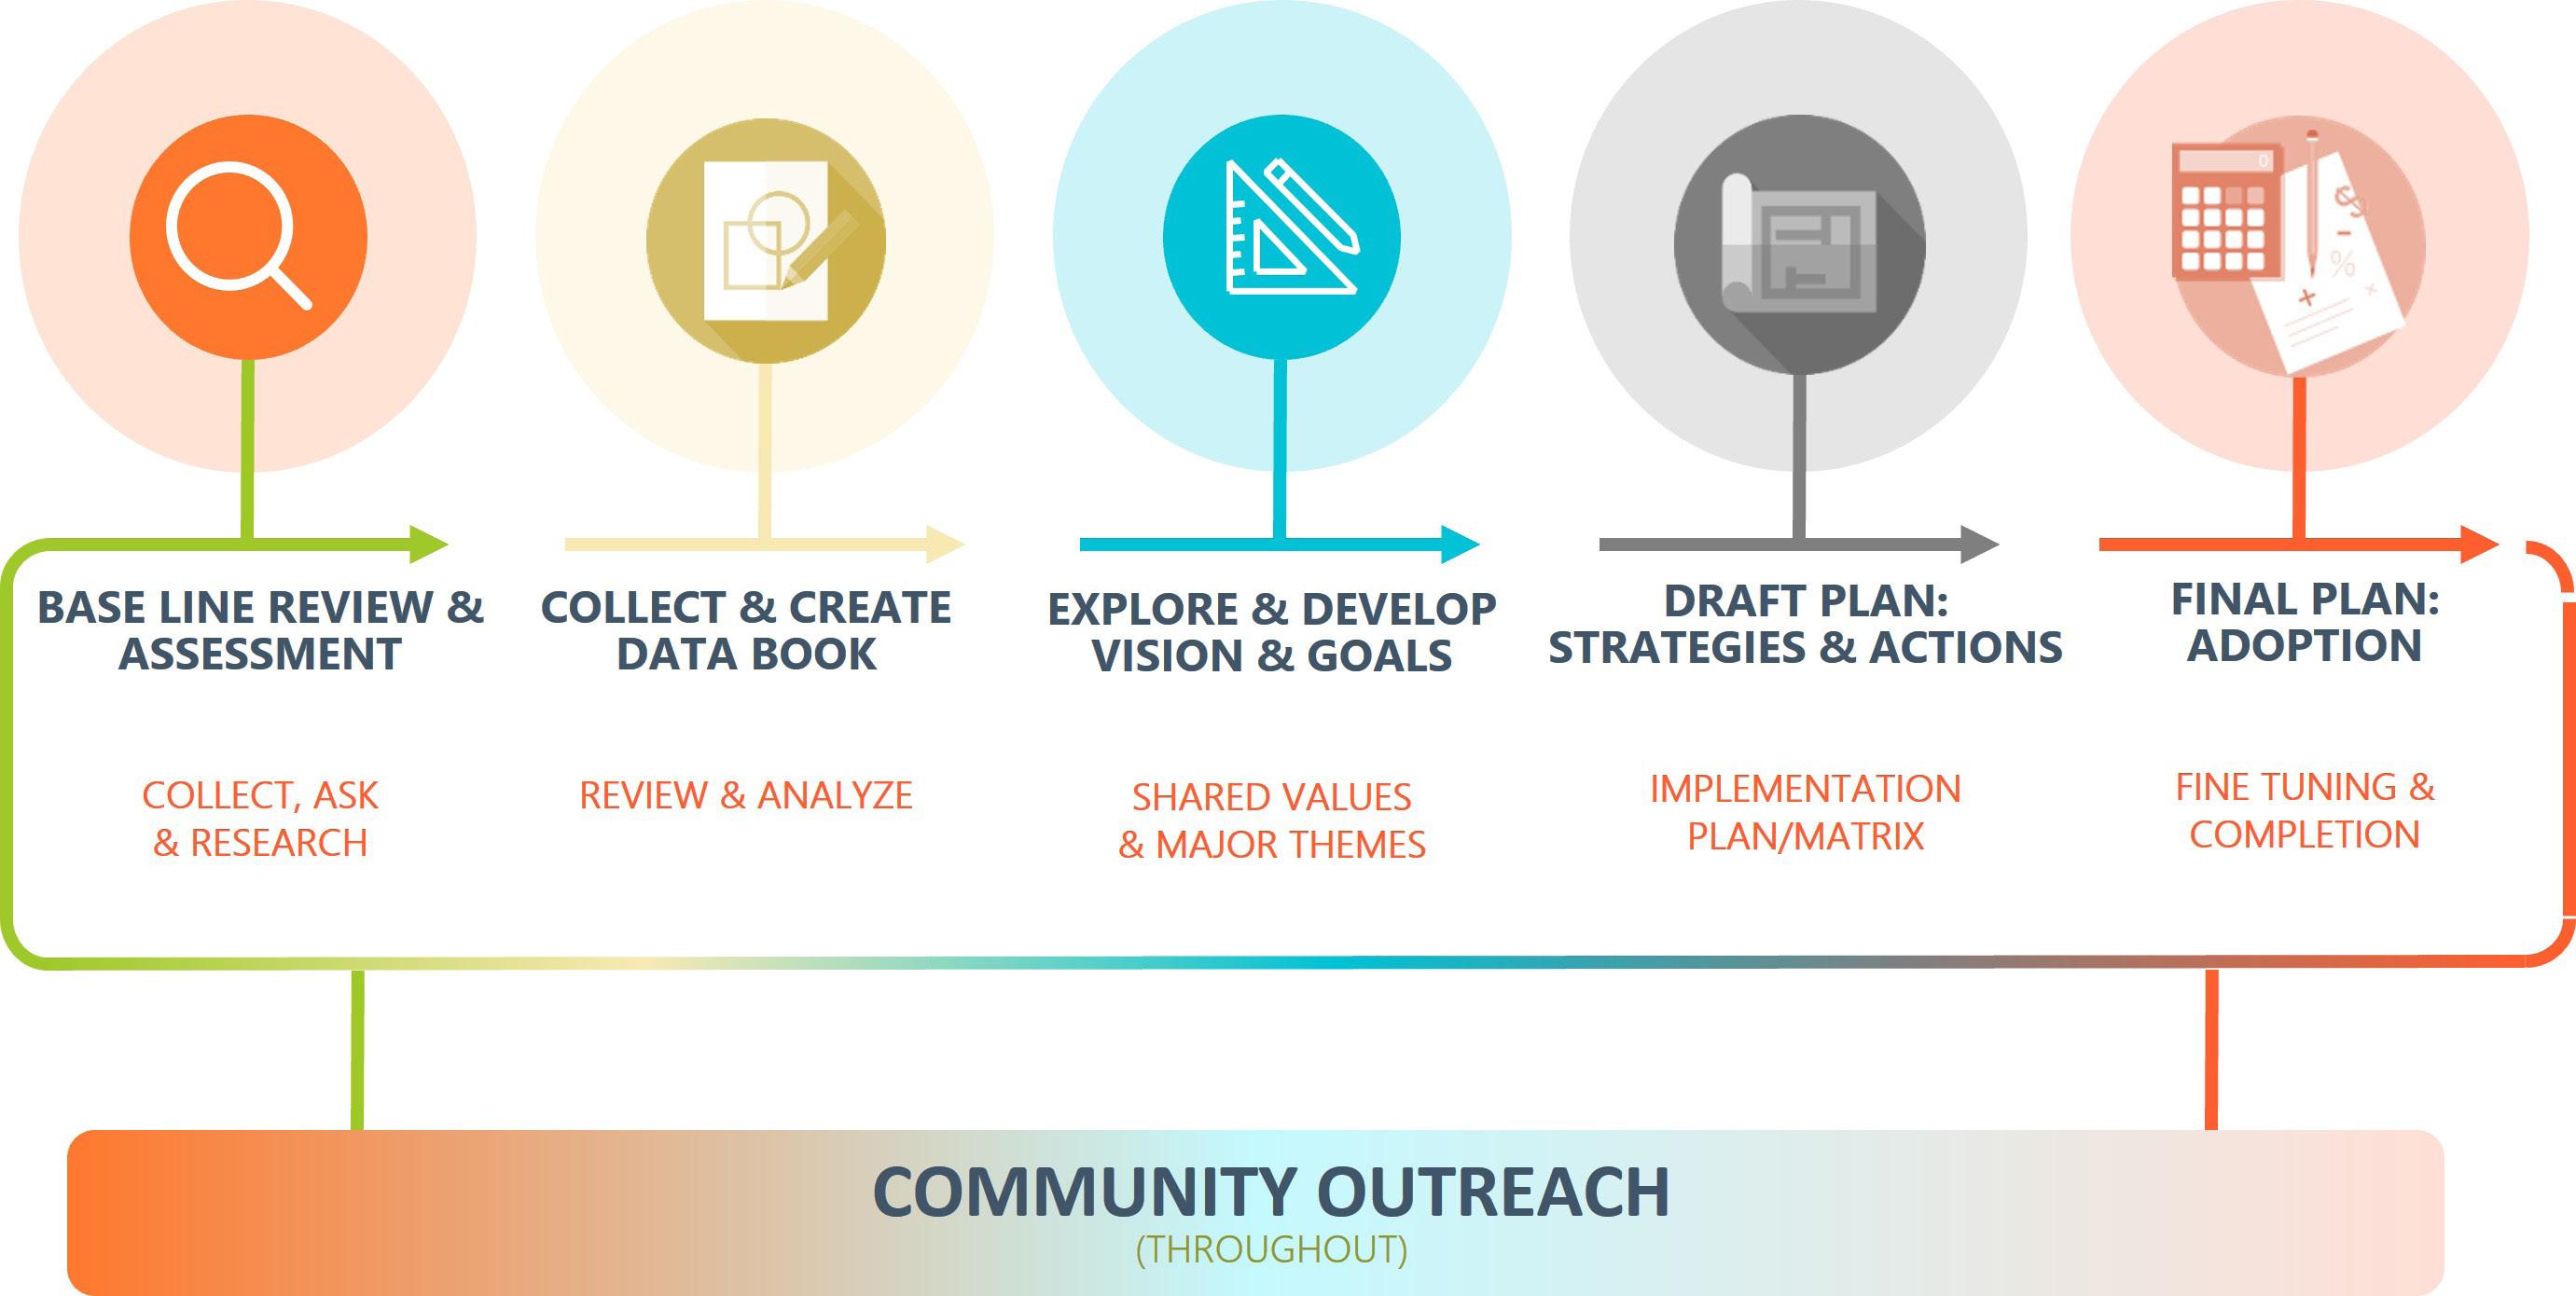
The process to develop a Comprehensive Plan involves reviewing past planning efforts and documents, assessing current conditions and trends, and developing reasonable goals and strategies while engaging the community in a dialogue about its current and future wants and needs (see Figure 2-1, Comprehensive Plan Process). The planning process for the City of Long Beach Comprehensive Plan
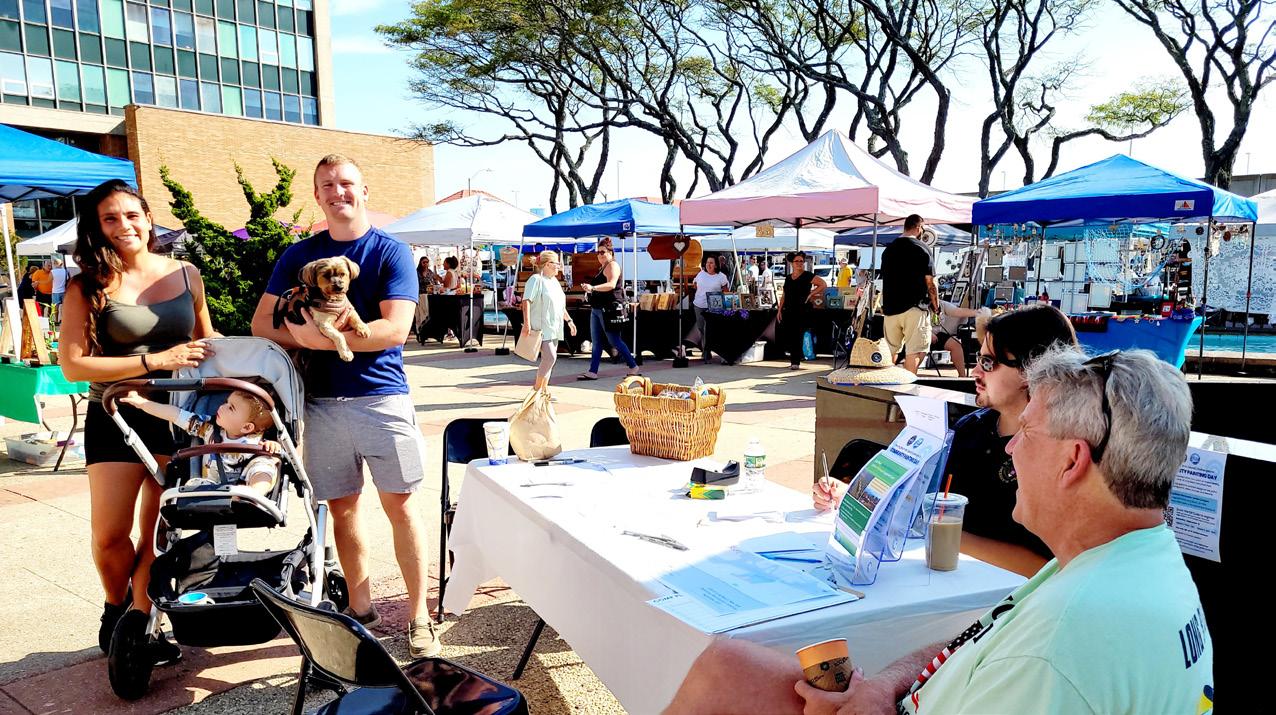
began in late 2021 with the selection of a Consultant Team and formation of an internal working group to assist with the endeavor. Shortly thereafter, the working group prepared a Community Engagement Plan, which included community leader interviews, a community-wide survey, public workshops, open houses, and regular consultations with the City’s Planning Advisory Board (PAB). The PAB served an important role in the process by identifying community champions, reviewing data, identifying priorities, and
assisting with setting the direction for the Plan. The components of the community engagement efforts are discussed in more detail in this chapter.
The City of Long Beach PAB was established in late 2020. The 11-member board is appointed by the City Manager and is tasked with the following duties and functions:1
f To study, report, and recommend to the Department of Economic Development and Planning2 by the City Council or City Manager;
f To promote public interest and understanding in the physical development of the City of Long Beach and in all matters falling within the authority of Department of Economic Development and Planning;2 and
f To meet not less than once a month and at such other times as called for by the director of the Department of Economic Development and Planning2 in order to keep record of its activities and meetings resolutions findings and determinations.
1 https://www.longbeachny.gov
2 aka Department of City Planning and Development
The PAB held six (6) [February, March, May, November, December, and January/February] formal meetings during Plan development, and the PAB members were active in support of the public meeting. In addition, City staff communicated regularly with the PAB to update the Board on the process, progress, and broader community engagement efforts. The PAB has and will continue to serve as the primary community champion for the Plan, assisting City staff by promoting community engagement activities.
Between January and March 2022, the Consultant Team met with more than 30 community leaders to introduce the Comprehensive Plan development process and gain early insight into issues facing the City. The results of these conversations guided the next stages of the community engagement process including identifying questions for the community survey and ideas for exploration at communitywide workshops and meetings. Some community leaders became community champions for the Plan development.
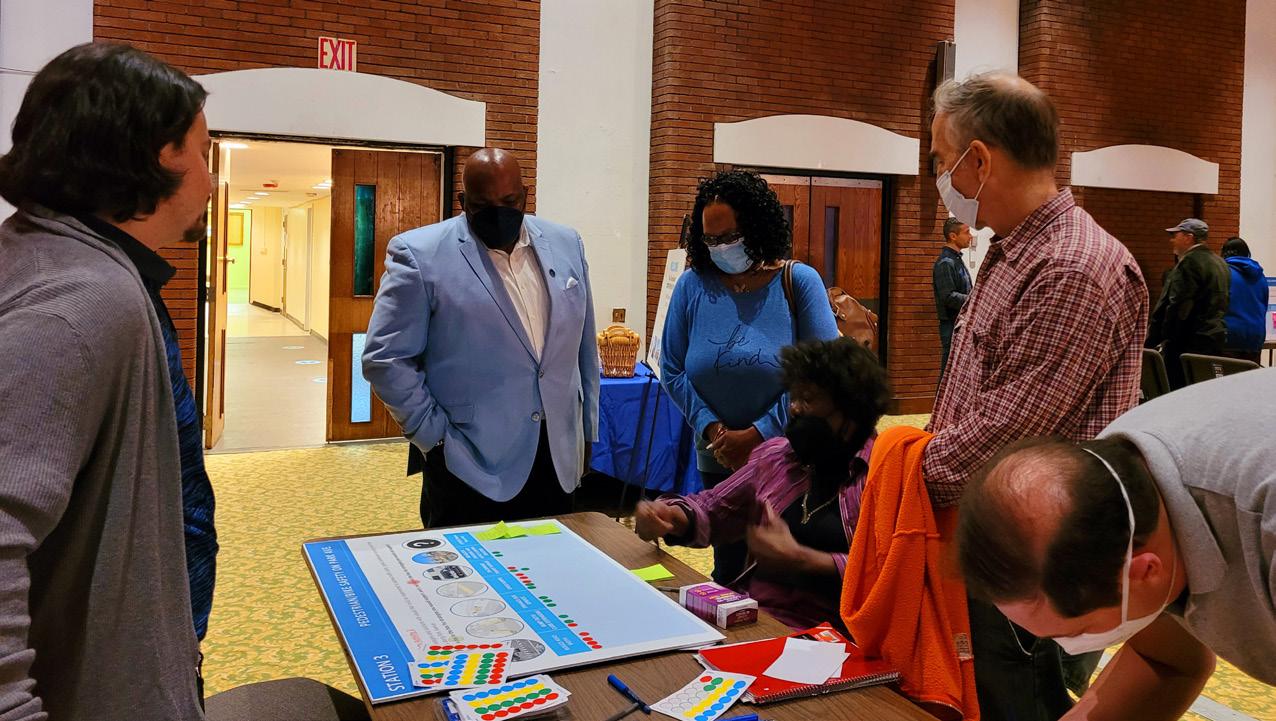
The Consultant Team developed an interactive project website and StoryMap that served as the primary online information resource for the project. The StoryMap supplied background information for the Comprehensive Plan, notifications on community engagement activities, and hosted the online community survey. The StoryMap was accessed through the City’s website and was active from April 2022 through the adoption of the Plan.
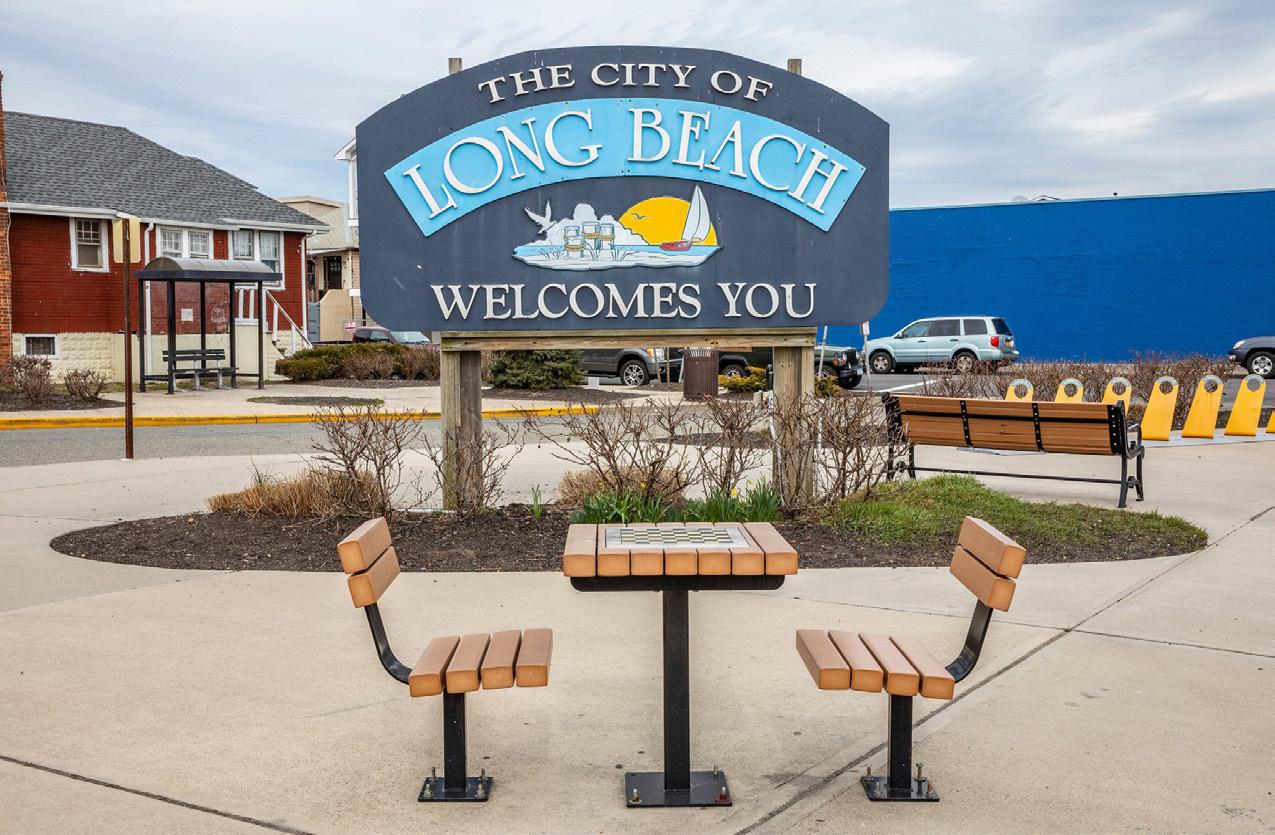
To engage and draw upon the knowledge and priorities of the residents and business owners, a community-wide survey was developed and conducted from April through July 2022, both online and in person, with paper copies distributed through community organizations. The survey received approximately 1,200 responses from a wide cross section of residents. While the survey recorded a variety of concerns, needs and ideas, results revealed 73 percent of respondents rated the overall quality of life in the City as good or excellent. Other key findings include:
f More than 90 percent of survey respondents noted the beach, boardwalk, waterfront as the main reason they choose to live/work in Long Beach.
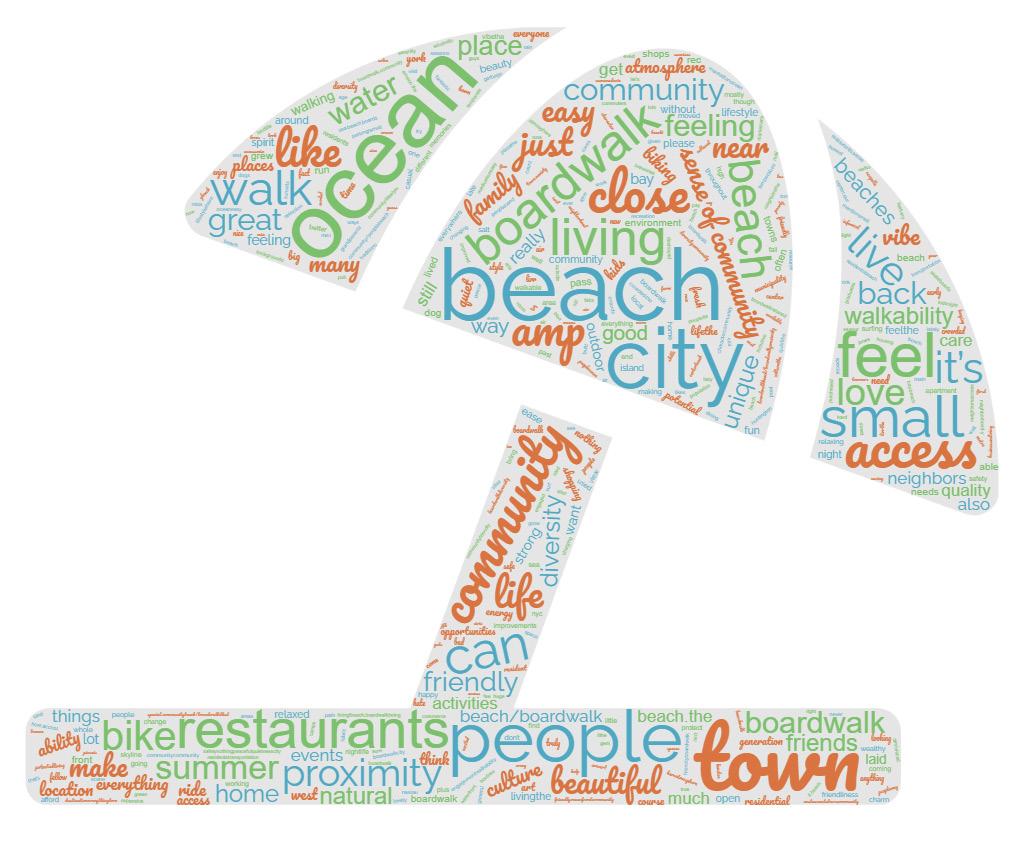
f Approximately 40 percent of survey respondents identified improving roadways, drainage, utilities, and other infrastructure as priority projects.
f Approximately 50 percent of survey respondents noted there is not enough affordable senior housing in Long beach.
f Seventy percent of respondents don’t feel comfortable biking on Park Avenue.
f Approximately 90 percent of survey respondents indicated parking is challenging in the West End Business District.
f Sixty-one percent of respondents agreed that the City should develop vacant parcels along the Bayfront.
Specific suggestions received from residents in the survey were considered during the development of the Plan’s Goals and Strategies, and, in many cases, ideas were combined and generalized to allow for the greatest flexibility. A report summarizing the community survey results is included in Appendix D.
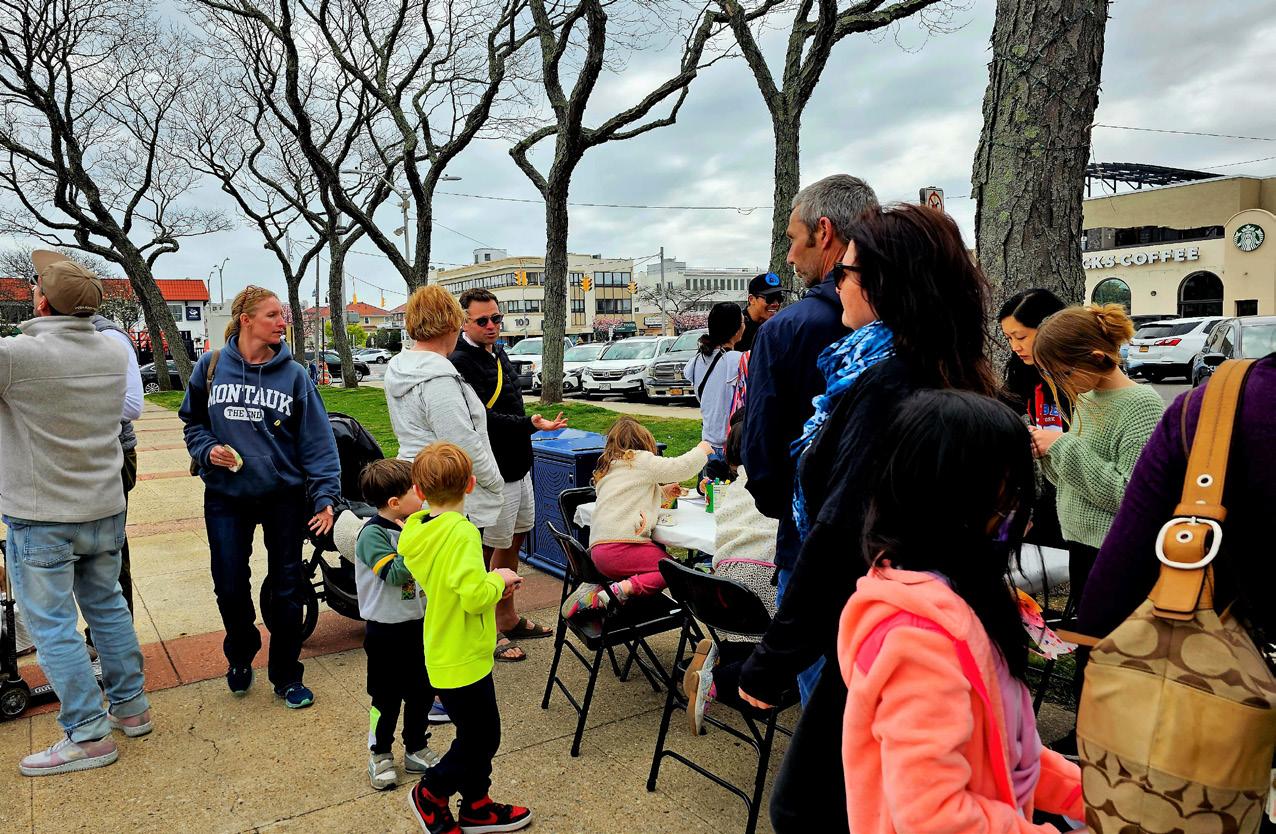
The kickoff community-wide event for the Comprehensive Plan was an informational Virtual Public Meeting held on April 21, 2022; the link to this meeting was posted on the StoryMap webpage. The focus of this public meeting was to introduce the Project Team, explain the intent for and use of a Comprehensive Plan, review the process and timeframe, discuss the data and components that would be included in the final Plan, and to answer questions related to the Plan and its development.
The second series of community engagement events included in-person public workshops and community meetings held between May and August 2022. Each event had a specific targeted set of objectives as described and summarized herein.
May 2022 Neighborhood Workshops. In May 2022, three (3) neighborhood workshops were held. The first two workshops were held on May 19—one in the West End neighborhood and the other in Central/ East End neighborhood. A third workshop was held on May 23 in the North Park neighborhood. Each workshop was organized in two parts: part one included a brief presentation on the process and an overview of survey results received to date (through
May 15), with a focus on the results from respondents in the associated neighborhoods; part two included interactive exercises on select topics areas based on emerging subject themes identified through initial survey results for the various neighborhoods or as identified by community leaders.
f The West End workshop included interactive exercises on parking and circulation, climate resiliency, and quality of life.
f The Central/East End workshop included interactive exercises on opportunity sites adjacent to the Long Island Rail Road (LIRR), transit oriented development, and pedestrian/bike/traffic safety.
f The North Park workshop included interactive exercises on opportunity sites along the Bayfront, housing affordability, and other areas of interest.
June 2022 Commercial District Workshop. The Consultant Team’s economic development specialist, Streetsense, focused on the City’s commercial corridors and market conditions. Specifically, tasks for Streetsense included review of economic development, physical assessment, market demand, and capacity for the Central Business District along Park Avenue, West End Business Districts along Beech Street, the Boardwalk, the City entry area
along Long Beach Boulevard, and East Park Avenue between Neptune and Pacific Avenues. A commercial district workshop was held on June 2, 2022, and the Consultant Team reviewed their findings with residents and business owners.
August 2022: Chamber Meeting. This Chamber of Commerce sponsored meeting was conducted via a virtual platform (Zoom) and in-person. City staff presented an overview of Plan goals, objectives, and progress to date followed by a question-and-answer session. Meeting attendees were also encouraged to submit written follow-up questions.
Early December 2022: PAB meeting and Review. In early and mid-December, the Project Team and City Staff met twice with the PAB. At the first meeting in early December, the Project Team updated the PAB regarding the Plan process and timeline and presented the Plan’s proposed general themes and strategies. The PAB subsequently received the full draft Comprehensive Plan for their review and comment. In mid-December, the Project Team and City Staff met with the PAB to review the overall draft Comprehensive Plan.
June 2023: Public Open Houses. In June 2023, the Project Team conducted two community engagement sessions (June 14 at the Long Beach Martin Luther King Center and June 15 at Long Beach City Hall) to present the final draft Comprehensive Plan. Together with City Staff, the Project Team presented the Plan’s goals, strategies, and implementation schedule. Workshop attendees were asked to comment on and prioritize draft goals and strategies that best aligned with their preferences. Following the engagement meetings, the Project Team and City Staff reviewed community feedback and noted significant similarities with priorities expressed in the Community Survey conducted more than a year prior. Community feedback was integrated into the final draft Comprehensive Plan presented for community consideration at the City Council’s subsequent Public Hearing.
Summer 2023: State Environmental Quality Review, Mandatory Referrals, and Comment Period. Pursuant to Title 6 NYCRR Part 617 of the implementing regulations pertaining to Article 8 of the Environmental Conservation Law, the adoption of a Comprehensive Plan is a State Environmental Quality Review Act (SEQRA) Type 1 Action (6 NYCRR, Part
617.4). By Resolution issued on June 6, 2023, the Long Beach City Council declared themselves SEQRA Lead Agency for the environmental review of the City of Long Beach Comprehensive Plan. Also, by resolution issued on June 6, 2023, the City Council scheduled a Public Hearing on the draft City of Long Beach Comprehensive Plan for June 20, 2023, establishing a 10-day comment period following the close of the Public Hearing. In addition, per General City Law §28a.6.b and General Municipal Law §239-L&M, the Long Beach City Council referred the City of Long Beach Comprehensive Plan to the Nassau County Planning Commission, which by Resolution No. 10533-23 issued on June 15, 2023, recommended “that the referring agency take action as it deems appropriate, the Commission having no modifications” and offered the following commendation:
“
….The Draft Plan spells out numerous worthy goals and objective [sic] that the Commission strongly supports. Among these are the protection of neighborhoods that would provide a foundation for future zoning amendments; providing a focus on affordable housing, diversification of the housing stock and the preparation of a Citywide Housing Plan; enhancement of mobility and connectivity; enhancement of environment and climate resiliency and the creation of opportunities for sustainable
growth, including creating a TOD district adjacent to the LIRR station, while protecting the unique character of the City’s neighborhoods. The Nassau County Planning Commission will continue to support the City in achieving these goals and objectives and its balanced approach to economic development, sustainability, and the protection of neighborhoods.”
The City prepared a Full Environmental Assessment Form (FEAF) evaluating the potential for the adoption of the City of Long Beach Comprehensive to result in significant adverse environmental impacts. On June 20, the City Council opened and closed a Public Hearing on the draft Comprehensive Plan and collected comments from the community through June 30, 2023. Comments and recommendations collected at community engagement sessions held on June 14 and June 15, and those received subsequent to the City Council’s Public Hearing, were incorporated into the Final 2023 City of Long Beach Comprehensive Plan. By resolution issued on August 1, 2023, the City Council of the City of Long Beach issued a SEQRA Negative Declaration and adopted the City of Long Beach Comprehensive Plan.
The Vision Statement for this Comprehensive Plan was developed using information collected from the online survey, throughout the community engagement process, and via discussions with a broad section of residents, business owners, and community leaders.
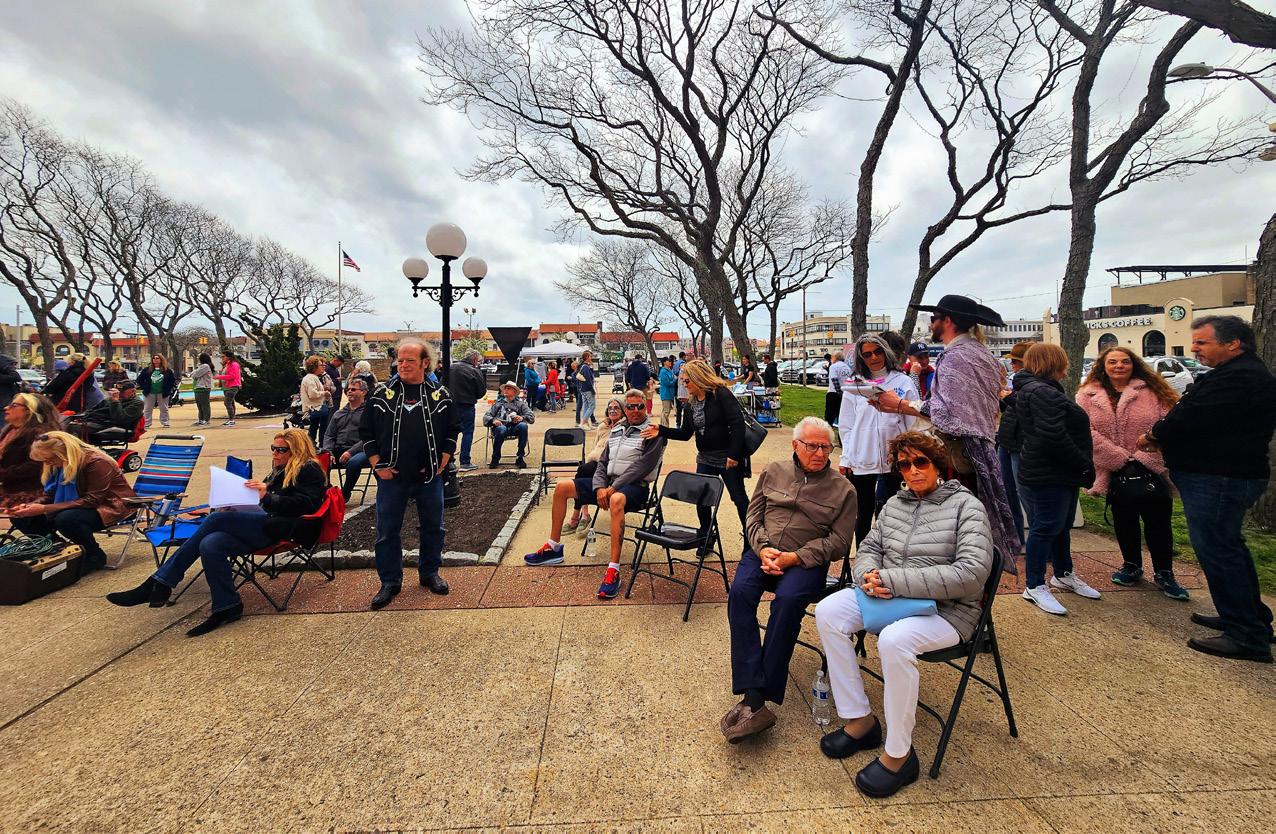
We envision a vibrant, inclusive, sustainable community that offers a high-quality of life for all residents and guests. Through responsible planning, we will enhance our infrastructure and public spaces, protect our natural resources, support local business and the arts, and encourage smart economic growth as we work towards a future that is equitable, resilient, and embodies the unique character of Long Beach.
The goals, strategies, and action steps (including citywide, neighborhood, and site-specific action steps) presented in Chapter 4 of this Comprehensive Plan are framed around five (5) theme areas:
Livable Neighborhoods and Sustained Quality of Life, Thriving Places and Robust Year-Round Economy, Access to Mobility and Connectivity, Enhanced Environment and Climate Resilience, Sustainable Growth and Opportunities.
These five (5) themes of the Comprehensive Plan were built from themes that emerged throughout the engagement process:
1. Maintaining and improving the Quality of Life throughout the City and within the City’s residential neighborhoods;
2. Improving roadways, drainage, utilities, and infrastructure within the City;
3. Addressing housing affordability and the need for more housing and medical options for the City’s senior population;
4. Enhancing business districts by increasing the variety of stores and services, improving visual aesthetics, hardscape, and safety;
5. Promoting economic development that encourages a year-round economy;
6. Addressing inadequate parking (especially in the West End neighborhood), transportation, and circulation issues (especially during summer months);
7. Improving pedestrian, biking, and traffic safety throughout the City and especially along Park Avenue;
8. Addressing concerns about climate resiliency and flood risks;
9. Focusing economic development and growth within opportunity sites rather than Citywide or within established neighborhoods; and
10. Capitalizing on the transportation hub of the LIRR along Park Avenue and promoting transit oriented development.
This Chapter provides an inventory, in graphic and tabular format, of the existing conditions in the City of Long Beach’s commercial corridors, transportation systems, community and cultural facilities, and natural resources including climate change and adaptation. This data forms the foundation for the goals, strategies, and recommendations presented in this Comprehensive Plan. The data includes assessments of population and population density, age, race and ethnicity, household, education, and income. Where instructive, the narrative includes trends that can be used to meaningfully plan for the City’s future. For example, where age-related statistics may indicate a steadily aging population, the City could evaluate its existing resources and determine whether additional services may be needed in the future.
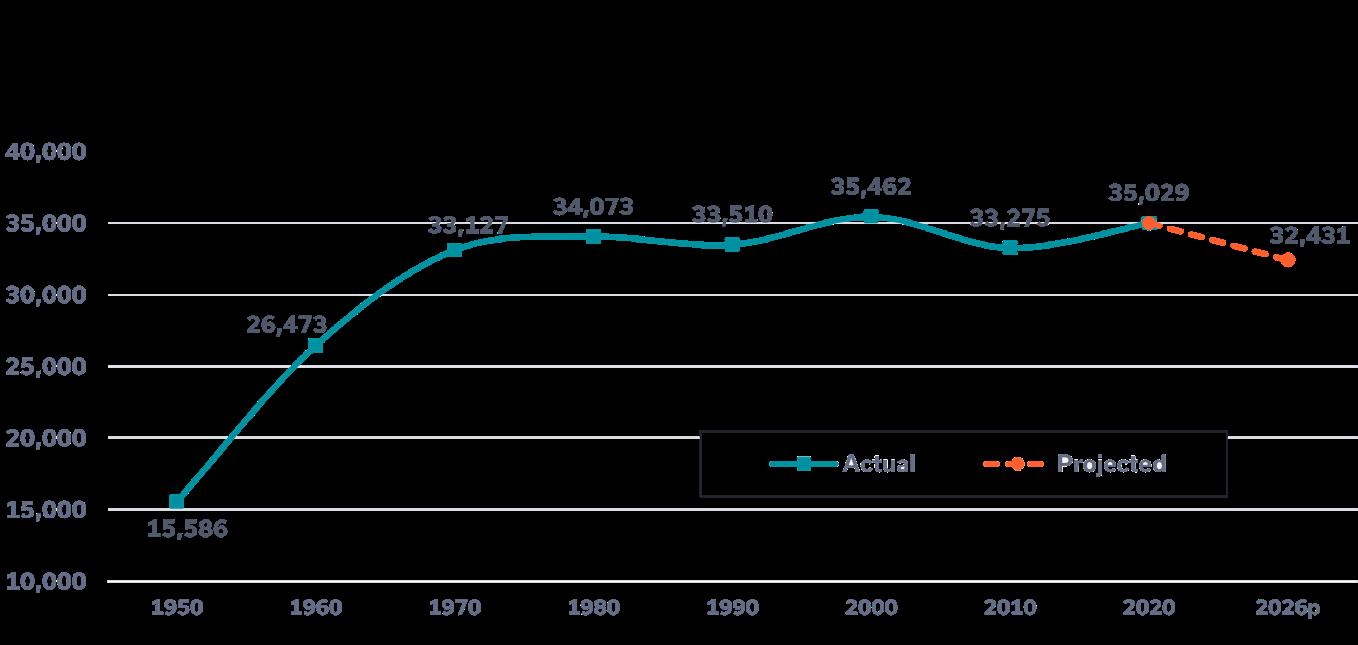
Per the U.S. Census, the 2020 population of the City of Long Beach was 35,029, which represents a slight (five percent) increase from 2010 (33,275). Between 1950 and 1970, the City saw its highest population
growth, with an overall increase of 17,541 (112.5 percent). As shown in Figure 3-1, Historic and Projected Population: 1950–2026, the population has remained relatively constant since 1970, with minor fluctuations over the last fifty years. Specifically, there was a one percent decrease between 2000 and 2020. Projections show an eight percent decrease in City population between 2020 and 2026.1 However, the City has approved approximately 500 new residential units with construction expected by 2026, indicating stabilization and growth. As residents are still returning to rehabilitated homes post-Superstorm Sandy, it is realistic to project a slight growth in population.

Based on U.S. Census information, at 15,665 persons per square mile (ppsm), the City of Long Beach has a higher population density than its surrounding neighbors and Nassau County (see Figure 3-2, Population Density). Island Park—located to the north of the City on the mainland—has a population density
above 10,000 ppsm but lower than Long Beach, while East Atlantic Beach and Atlantic Beach to the west fall within the 2,000–4,999.9 ppsm census category, and Lido Beach to the east falls within the 50–99.9 ppsm category.
According to 2015-2019 American Community Survey (ACS) estimates, and as shown in Figure 3-3, Median Age Comparison (1990-2019), the median age in Long Beach was 44.9 years old, as compared to Nassau County (41.7) and New York State (38.8). Further review of U.S. Census information indicates that the City’s median age has been consistently increasing since 1990, when the median age in the City was 36.8 years old.

Over the last several decades, the City’s population has been aging, as indicated by the increasing median age. In just the last decade, Long Beach’s older adult population (55–79) grew by 1,252 between 2010–2019 (see Figure 3-4, Population by Age [2010–2019]).
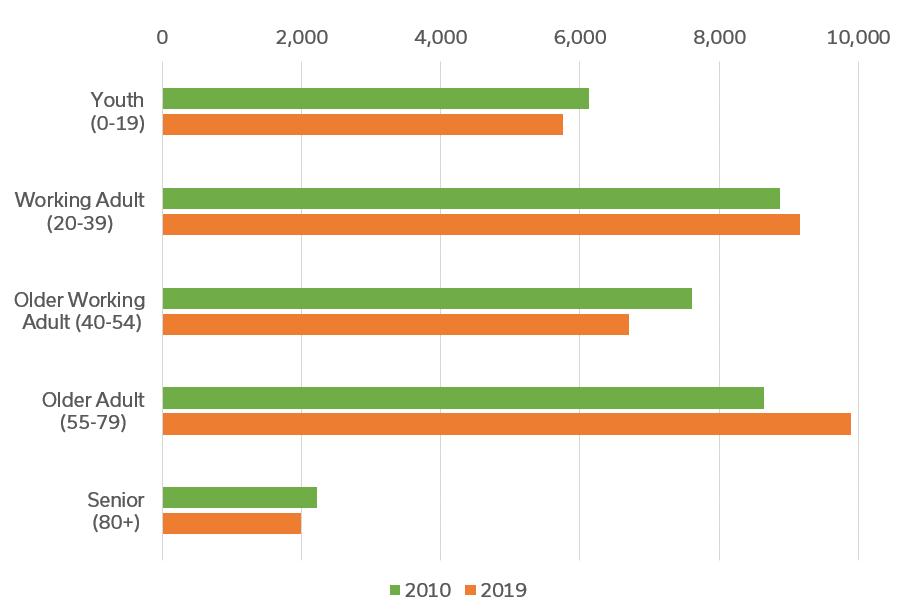
Long Beach may have a larger percentage of older residents than the County as a whole, due to the historic location within the City of in-care facilities that were once hotels converted for this use. The greatest decrease in the age cohort occurred in the older working age adult (40-44)—down 954 persons— and older children (15-19)—down 452 persons— populations. In the 40–54 age population group, data show a decrease of 900 persons between 2010-2019. The data also reflects an increase in the 25-39 age cohort typically comprising young families.
The populations of both Long Beach and Nassau County are diversifying, with the county at-large showing greater diversity. As shown in Table 3-1, Race and Ethnicity, per U.S. Census data, most of the Long Beach population in 2010 was white (75.5 percent), a trend that continued in 2020 with a slight decline (72.9 percent). The second-largest populations for both Long Beach and Nassau County are “Hispanic or Latino.” In Long Beach, specifically, nearly all racial/ ethnic groups have grown since 2010; the African American population, however, decreased by seven percent. As of 2020, 13.4 percent of the Long Beach population is foreign born, adding to the diversity of the City.
Nassau County has seen an 11.2 percent decrease in the white population, while Long Beach’s white population remains stable. Racial groups that saw growth in Long Beach from 2010 to 2020 include “Two or more races” (115.2 percent) and “Native Hawaiian and Other Pacific Islander” (75 percent). The “Hispanic or Latino” population group also grew, from 14.1 percent in 2010 to 15.3 percent in 2020.
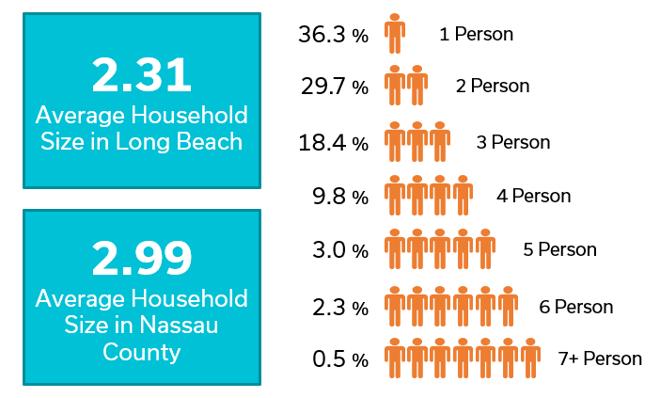
According to 2015-2019 ACS estimates and presented in Figure 3-5, Average Household Size, the average household size for Long Beach increased from 2.18 in 2010 to 2.31 in 2019. Long Beach has a smaller household size when compared to Nassau County (2.99) in 2019. The one-person household is the most prevalent in the City, comprising 36.3 percent of the population, followed by two-person (29.7 percent) and three-person (18.4 percent) households.
As shown in Figure 3-6, Education Attainment, the City of Long Beach has a high education attainment rate for adults over the age of 25, with nearly half earning an advanced degree (bachelor’s [25.7 percent] and graduate [23 percent]). Nassau County’s higher education attainment rate is essentially the same
S Table 3-1: Race and Ethnicity
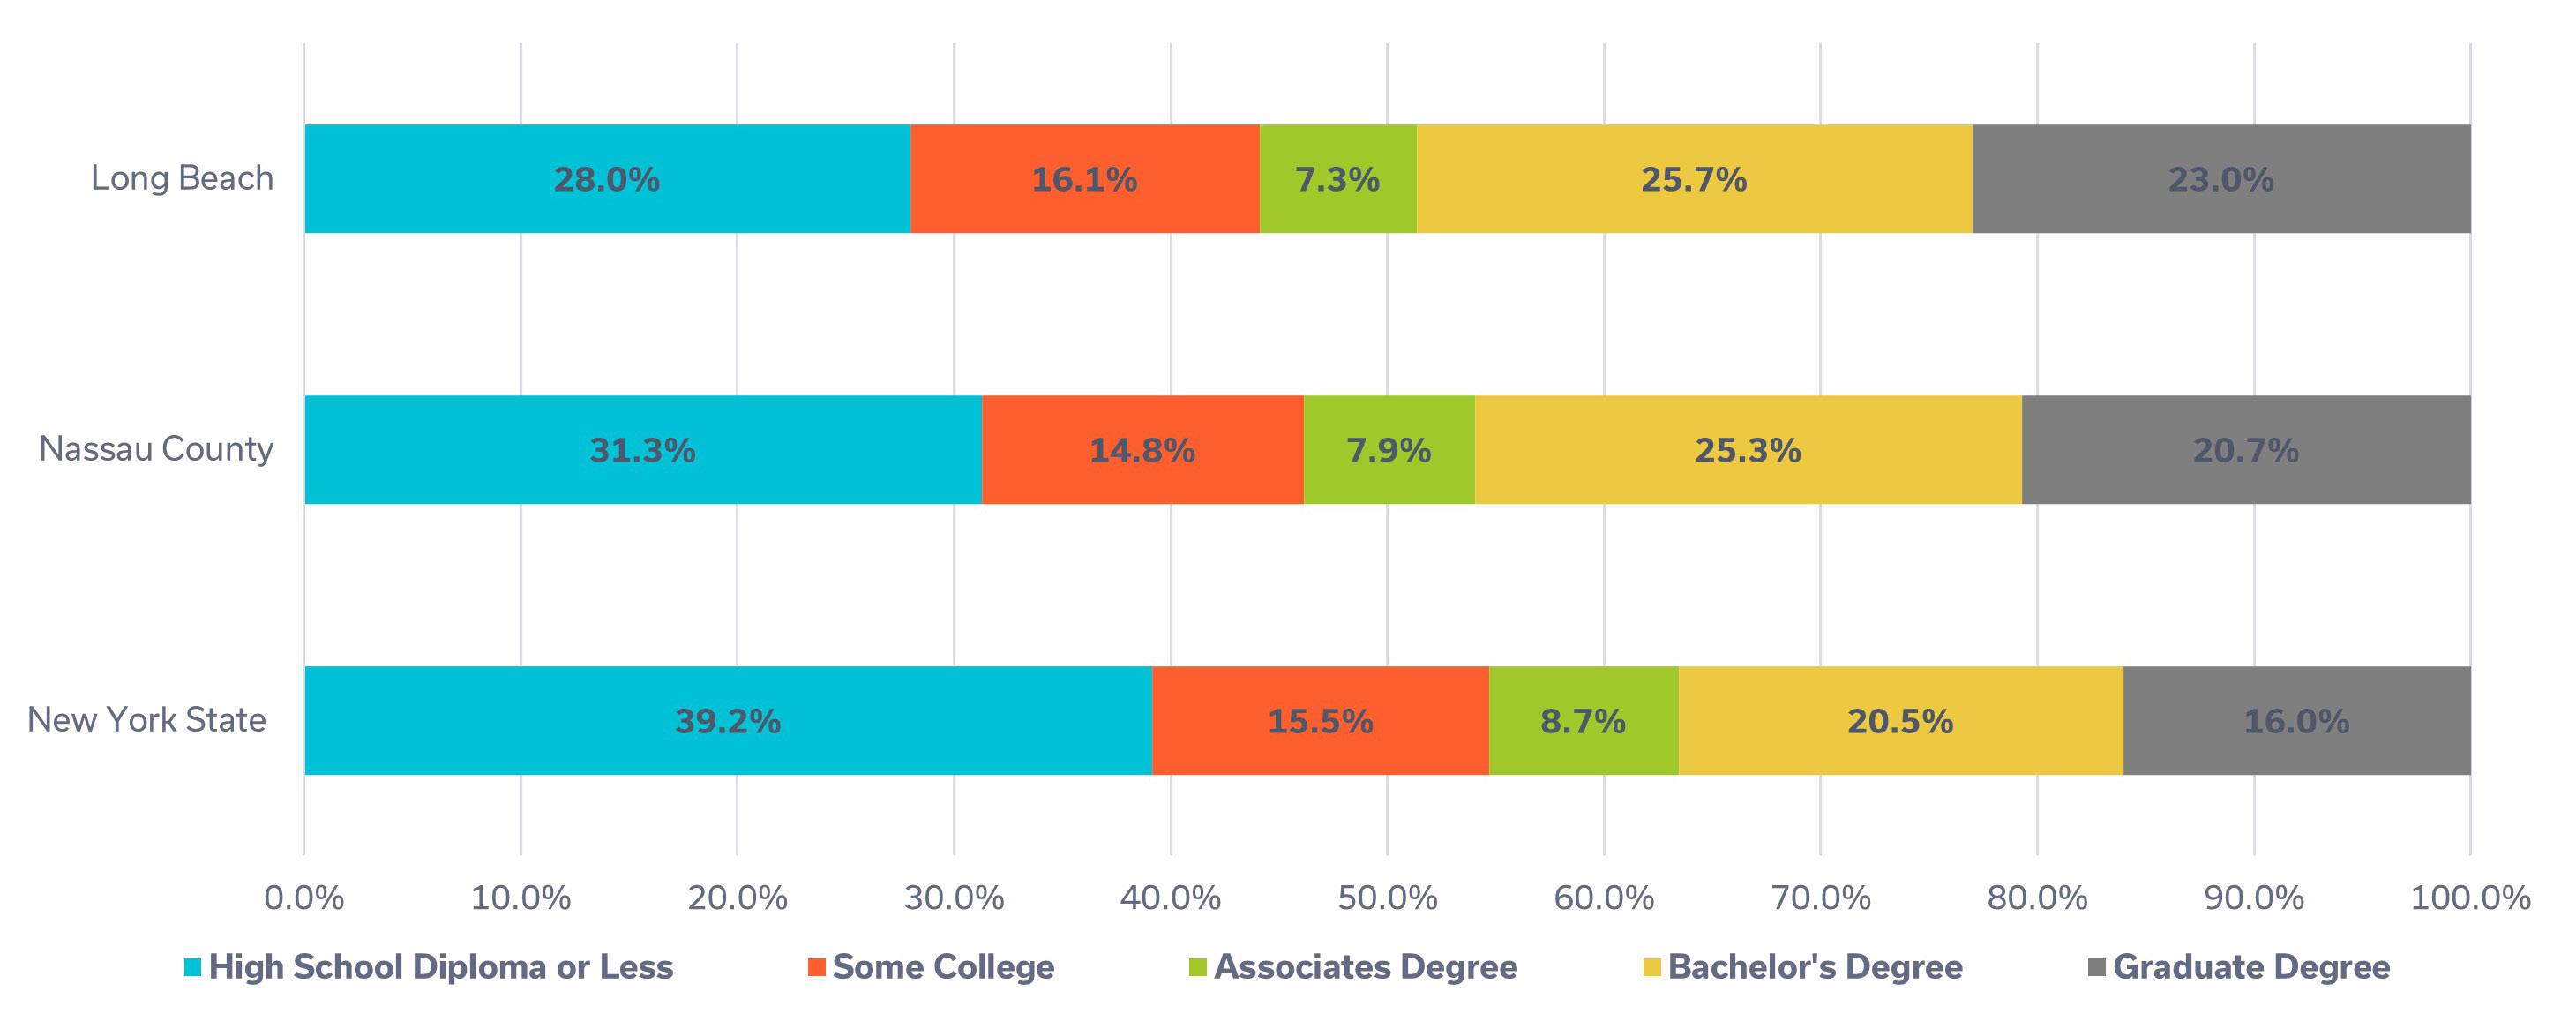
as Long Beach, reporting a slightly lower graduate degree attainment (20.7 percent). Per 2015–2019 ACS estimates, when compared to New York State, both Long Beach (48.7 percent total) and Nassau County (46 percent total) surpass the higher education rates for both bachelors and graduate degrees, with New York State reporting 36.5 percent.
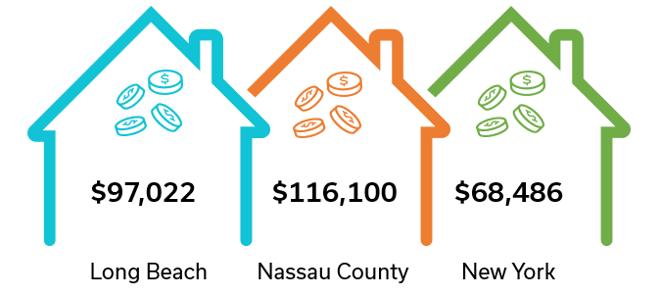
According to 2015-2019 ACS estimates and presented in Figure 3-7, Median Household Income Comparison, 2019, the median household income for Long Beach was $97,022, which was 16 percent lower than Nassau County ($116,100) and 42 percent higher than the State ($68,486). Though Long Beach has a higher education attainment rate than Nassau County, the median income is lower.
According to information from Nassau County and based on the 2010 U.S. Census, the City of Long Beach has fourteen designated low and moderate income (LMI) census block groups (see Figure 3-8, Low and Moderate Income), where at least 51 percent of persons are LMI individuals. Several of those census block groups are adjacent to Reynolds Channel. The majority of Long Beach falls into the 20–40 percent LMI range.
S Figure 3-8: Low and Moderate

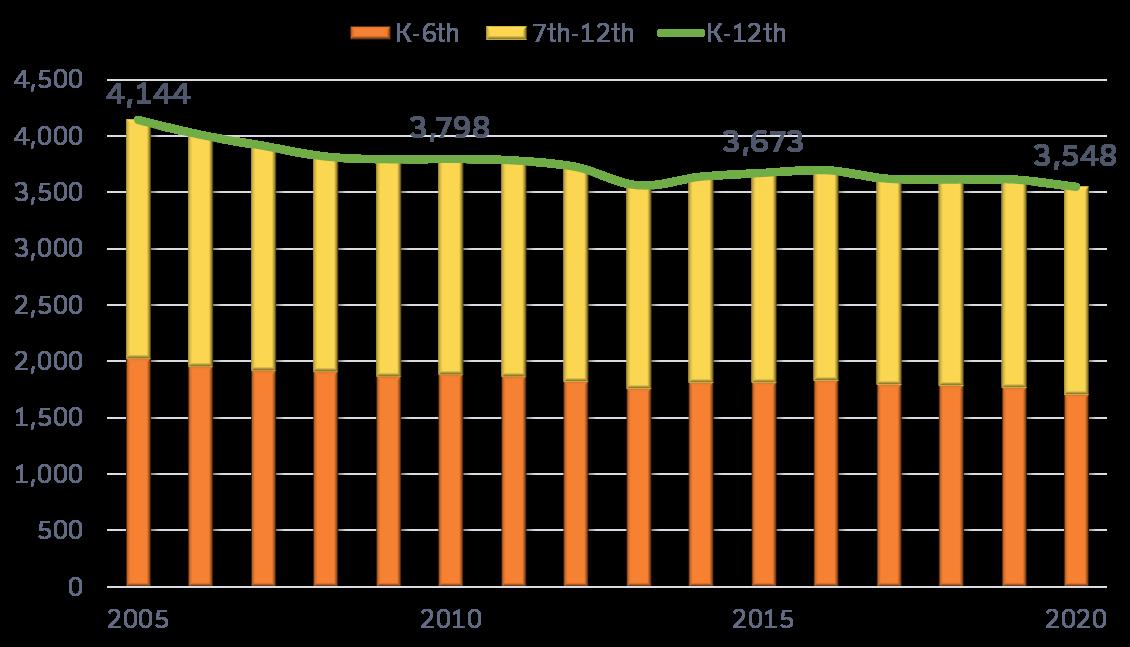
Between 2005 and 2020, public school enrollment in Long Beach declined by 15 percent (see Figure 3-9, Historical Long Beach School Enrollment). The City saw a steady decline in school enrollment from 2005 to 2013 (2012–2013 enrollment dipped due to Superstorm Sandy, when families had to temporarily relocate, other families moved away, and certain first floor apartments in the West End were no longer available), while enrollment declined at a slower rate from 2018 to 2020. Of note is that K-6 public school enrollment declined at a slower rate from 2005 to 2020 than enrollment for grades 7-12 during the same period.
When looking at the statistical data in the context of planning for its future, the City of Long Beach has been evolving in the following ways:
Total population is generally stable, however, the older adult (55-79) population is growing and working older adults (40-54) and early 20s populations are declining.
Household size is increasing.
Population density (persons/square mile) is higher than neighboring Nassau County communities.
There is higher educational attainment, but lower salaries than Nassau County.
Public school enrollment has declined but remains generally stable.
The City of Long Beach is largely a residential community. Other land uses include recreation and open space, public facilities, industrial, commercial, and community services (see Table 3-2, Existing Land Use, and Figure 3-10, Existing Land Use).
Residential land uses account for 48 percent of the City’s total land. The most prevalent residential land use is single-family homes (59 percent), followed by two- and three-unit attached residential homes (27 percent). The City has eight distinct neighborhoods, which offer a variety of housing types from singlefamily detached homes to townhomes to high-rise residential buildings with over 50 units.
Commercial and industrial land uses account for only three percent of the City. The City’s central downtown is organized around the City Hall government center and the Long Island Rail Road (LIRR) multimodal transportation center, which act as the hub of the main commercial district on Park Avenue. Long Beach Boulevard between the bridge and Park Avenue includes mainly automobile-centric retail uses.
Neighborhood-serving retail is located on Beech Street in the West End neighborhood and on East Park Avenue in the Canals and East End neighborhoods. The City’s Bayfront is defined by industrial uses, as well as public facilities and institutions.
The City’s current zoning map (see Figure 3-11, Zoning Map) and ordinance date from the 1980s. The traditional grid pattern of the City features wide boulevards and narrow side streets. Most of the City is zoned for one, two, and other multi-family residential uses, with business and industrial districts comprising the remainder of the City’s development pattern. Since that time, the City has amended discreet sections of the Zoning Code to address pressing issues. Discussions with City staff, the Planning Advisory Board (PAB) and Zoning Board of Appeals (ZBA) have indicated a more comprehensive review and update of the Zoning Code and map are required to accommodate changing conditions and preferences, including resiliency needs and recommendations provided herein.
2+3 Family Residential
4-6 Family
High Density Residential - 6 to 25 units
Highest Density Residential - More than 25 units
Vacant Residential
General Commercial & Retail
Vacant Commercial
Medical/Health Care
Government Housing (Community Facilities)
Mixed Use
Vacant Mixed Use
Government Use
Educational
Parks & Open Space
Private Institutional Industrial Utility Parking ROW
Road Islands


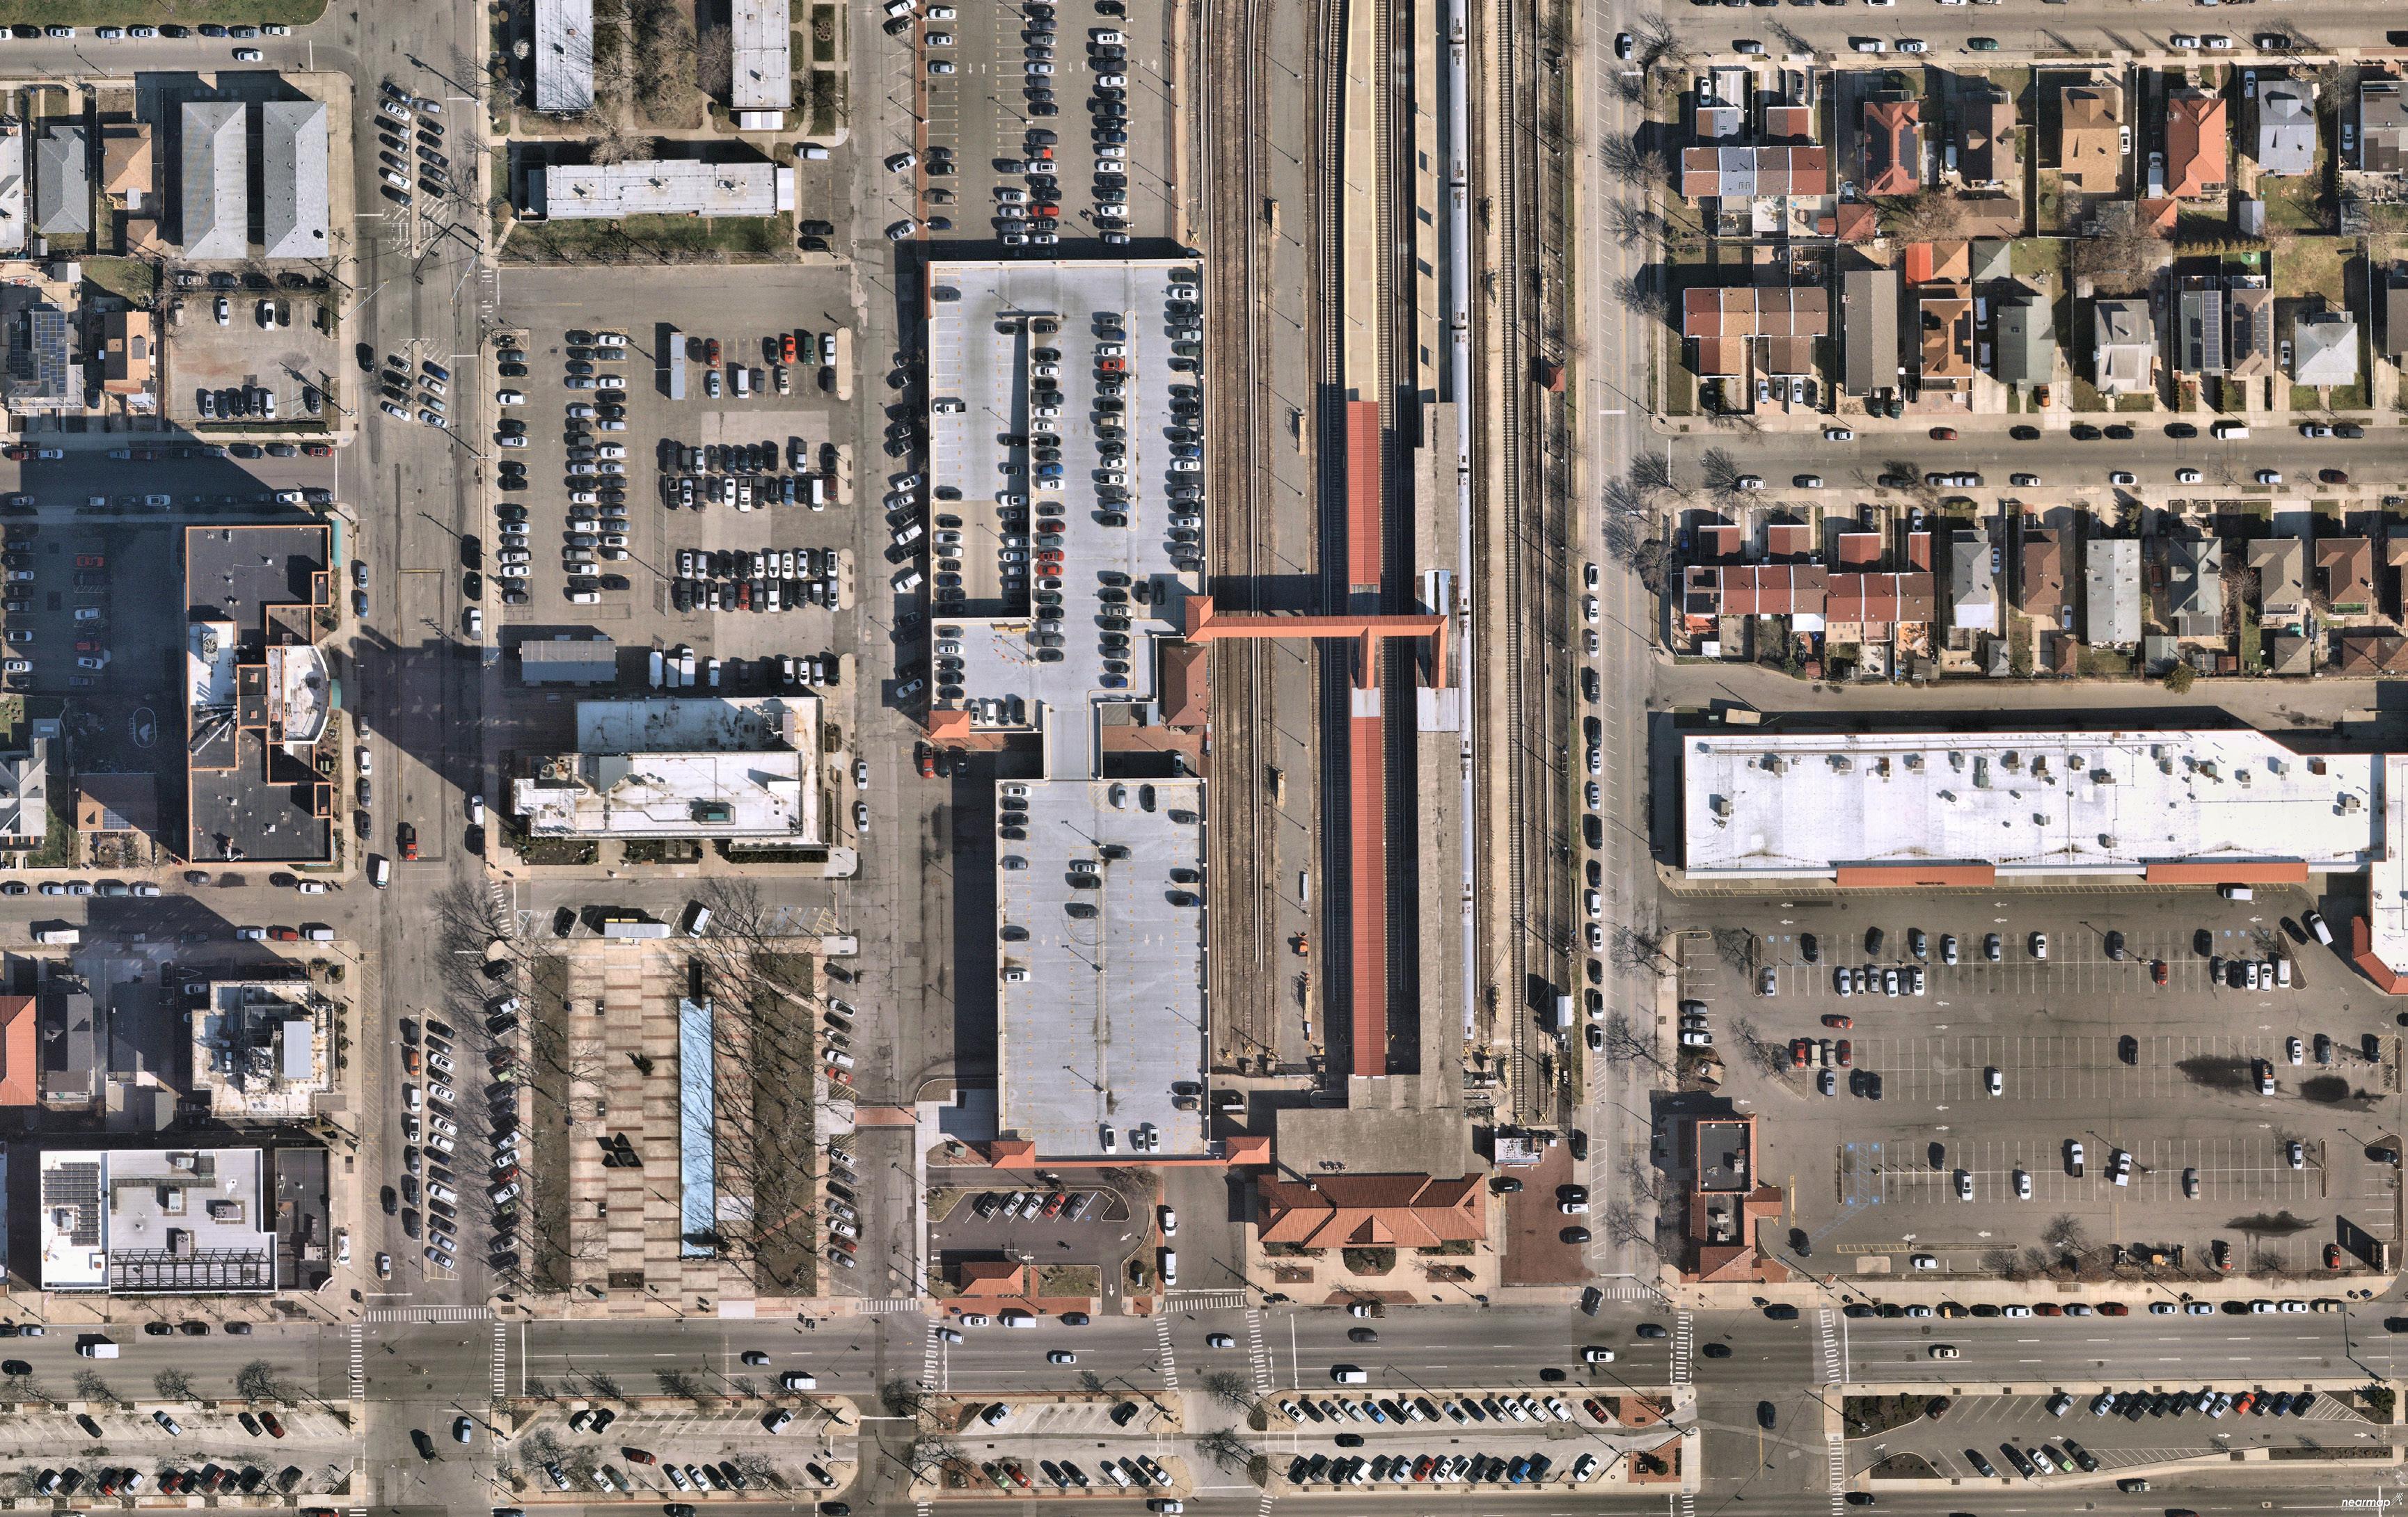
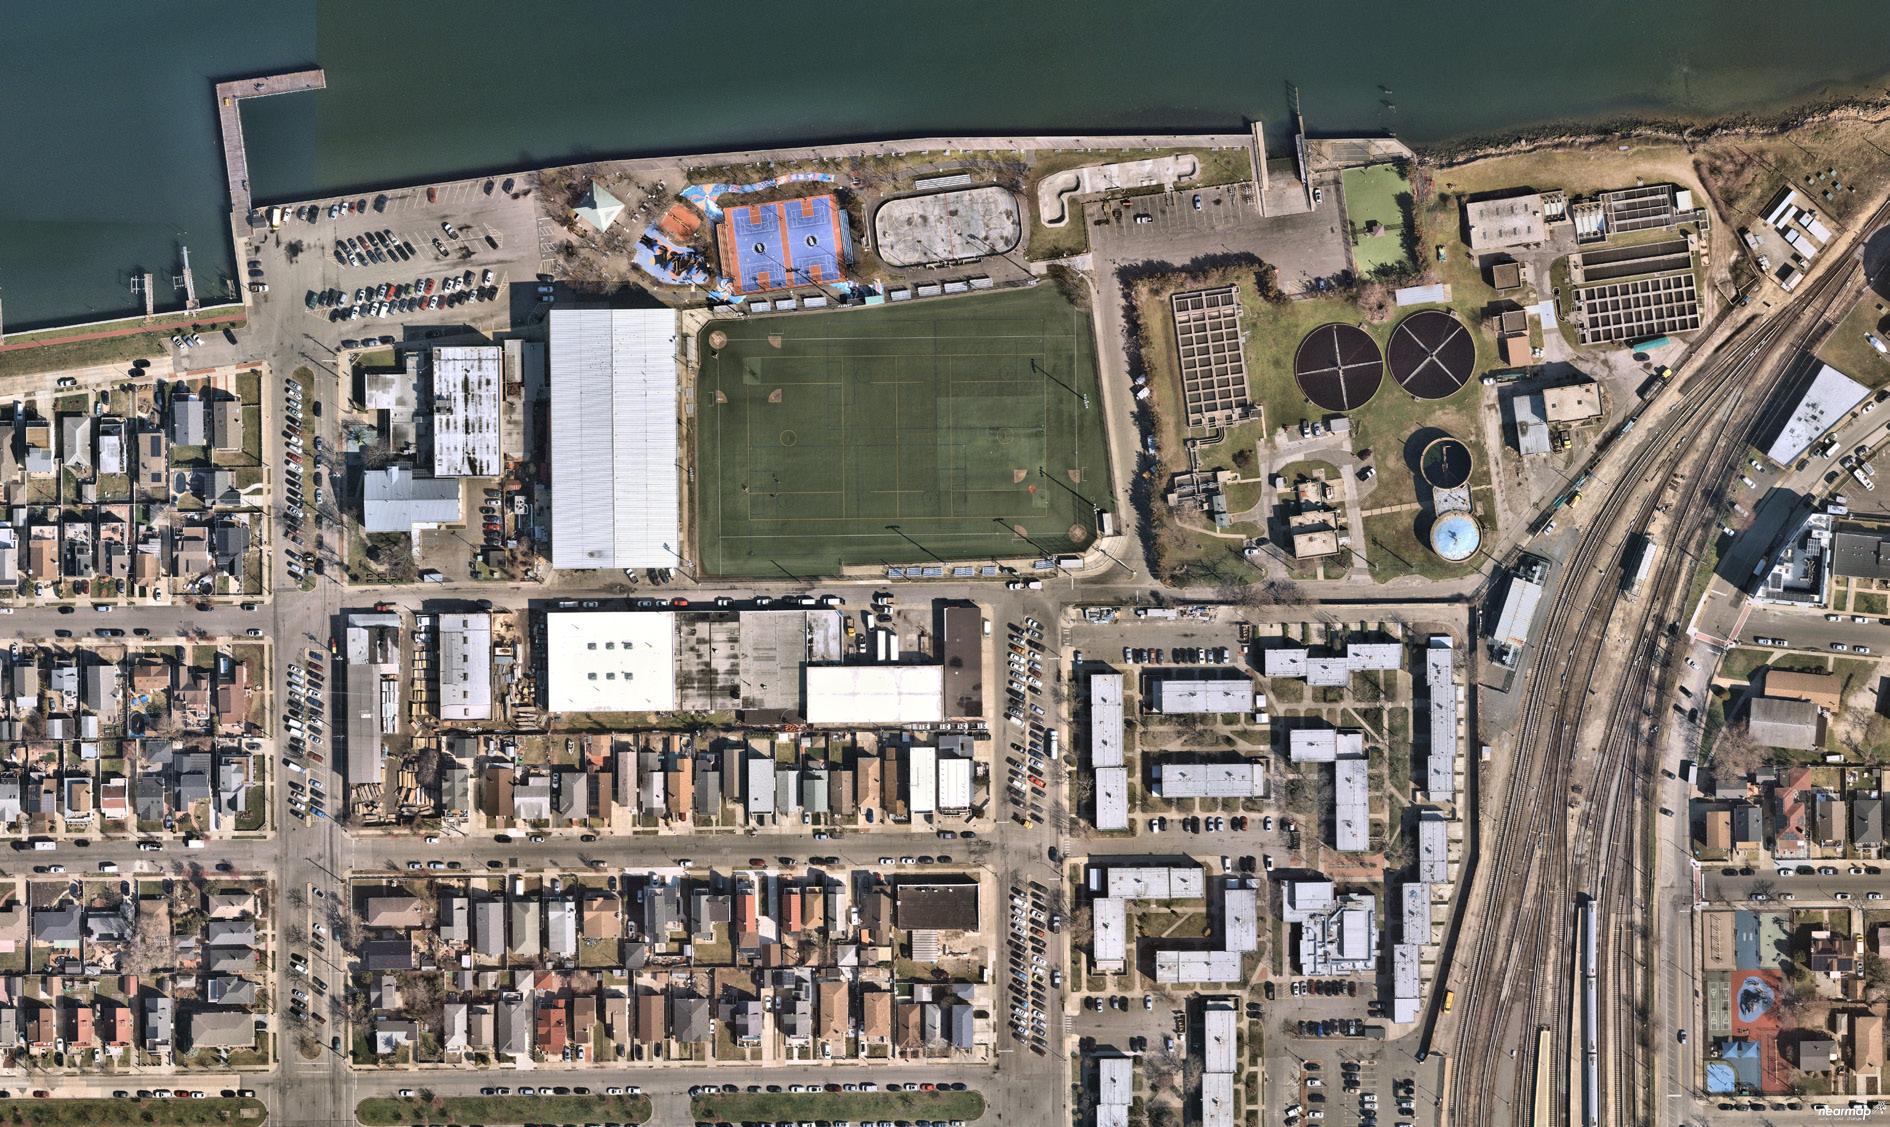
As shown in Figure 3-12, Opportunity Sites, the City has identified several opportunity sites for potential development, including the City Hall/Kennedy Plaza/ LIRR multimodal center/parking garage sites, the Stop & Shop site along East Park Avenue, which has been identified in the City’s planning and policy documents for more than 25 years, the Bayfront Sewage Treatment Plant to the west of the LIRR tracks, and several other sites along the Bayfront between the LIRR tracks and Long Beach Boulevard, several of which are City-owned. These areas are categorized by underutilization and are in the federal Opportunity Zone and New Markets Tax Credit areas. Some of these properties border the North Park community, which is an environmental justice area.2
The City of Long Beach is primarily residential.
The Zoning Code and Map are in need of updating.
Economic development/redevelopment and reuse sites have been identified as opportunity sites.
2 Environmental justice is the fair treatment and meaningful involvement of all people regardless of race, color, national origin, or income, with respect to the development, implementation, and enforcement of environmental laws, regulations, and policies.
Several opportunity zones have been identified for economic development and the surrounding communities should be involved as the City considers paths forward.
The City of Long Beach hosts eight neighborhoods, as shown in Figure 3-13, Long Beach Neighborhoods, each unique with its own identity and character. These neighborhoods are the West End, Westholme, the Walks, Central District, North Park, the East End, the Canals, and the President Streets. While each neighborhood offers both single and multi-family housing options, housing challenges exist.
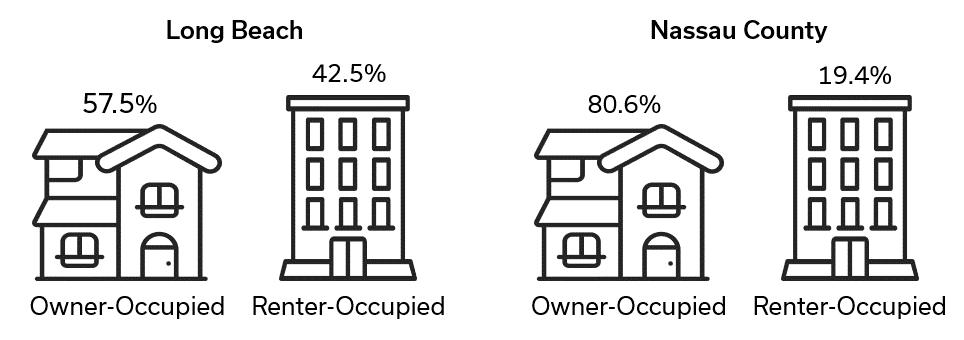
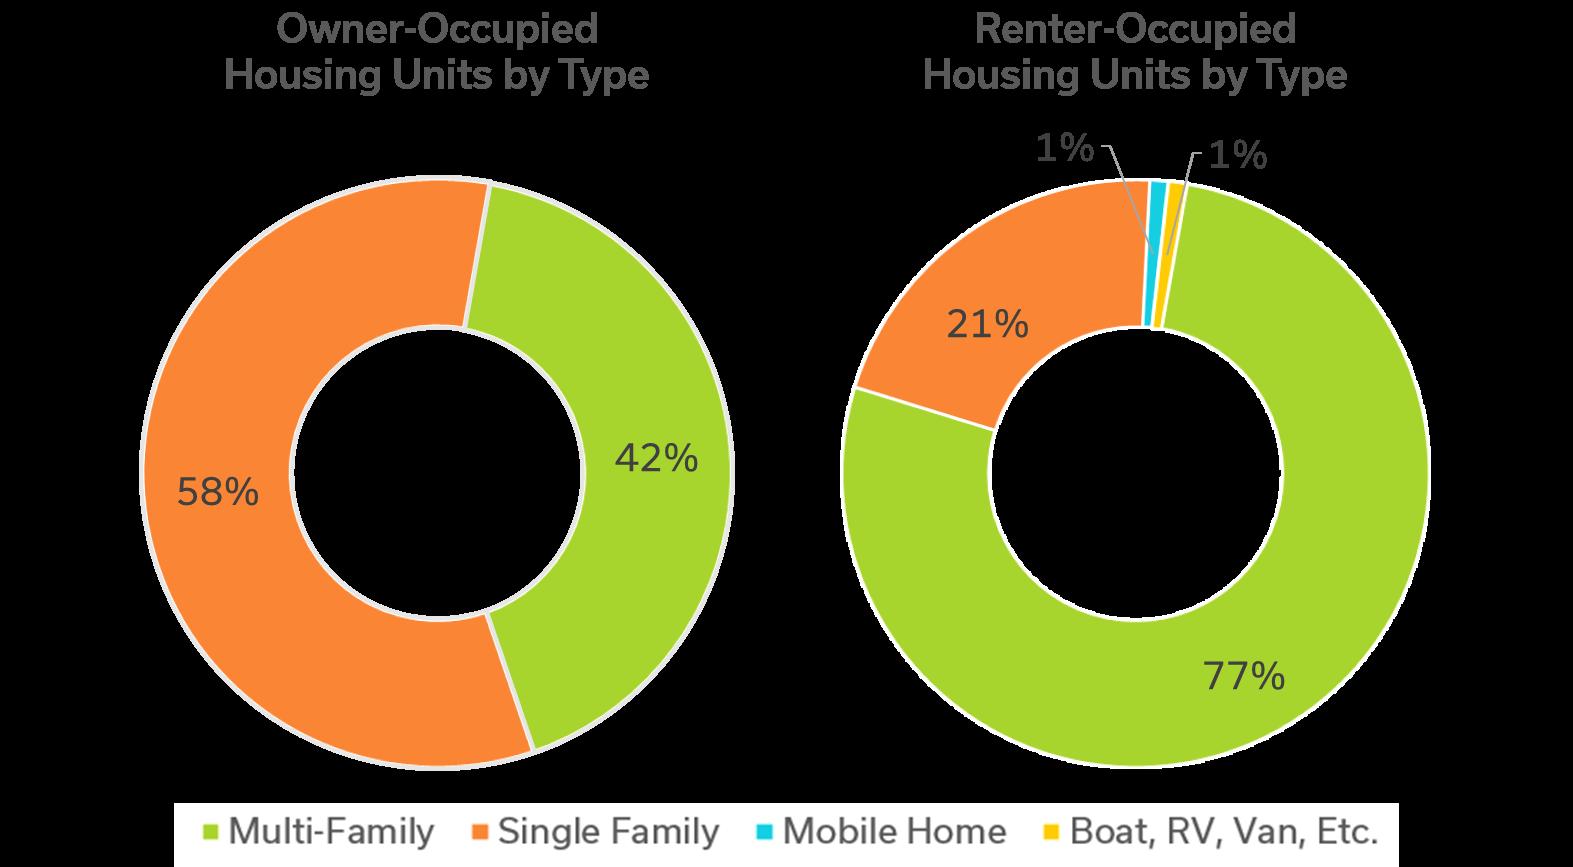
The City has a larger portion (42.5 percent) of renteroccupied housing than that of Nassau County (19.4 percent), even with high-rise units in Long Beach offering the opportunity for ownership (see Figure 3-14, Housing Tenure, and Figure 3-15, Housing Units by Type), which could be explained by the high number of “snow-bird” residents. While there are many hybrid arrangements for housing tenure that exist somewhere between renting and owning (community land trusts, co-ops, residential hotels, etc.), most owner-occupied housing in Long Beach is single-family homes (58 percent); by comparison,renteroccupied homes are largely multi-family (77 percent).

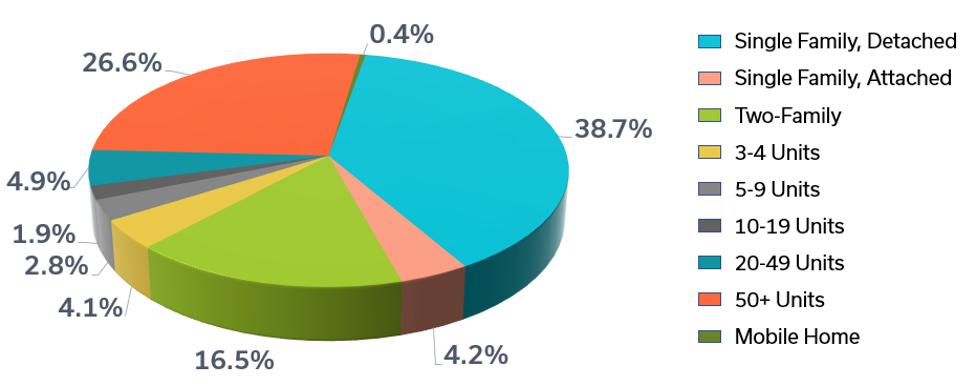
A diversity of housing types and affordability are central to the goals of the City of Long Beach and its residents. The City boasts a rich history of generational families that love to live in Long Beach and pass down their homes. While the homes of Long Beach residents come in all shapes and sizes, single-family detached residences (38.7 percent) and multi-family developments with 50+ units (26.6 percent) are the most common housing types (see Figure 3-16, Long Beach Number of Units in Structure).
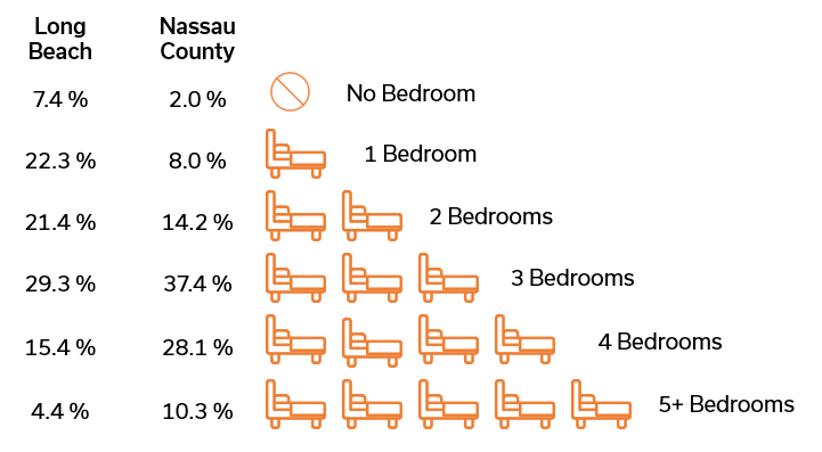
As shown in Figure 3-17, Housing Units by Number of Bedrooms, Long Beach’s unit sizes (number of bedrooms) are fairly evenly split, with 22.3 percent of the housing stock comprising one-bedroom units, 21.4 percent two- bedroom units and 29.1 percent three-bedroom units.
Nassau County is less diverse than the City, with approximately 75 percent of units comprising three or more bedrooms.
Home construction in Long Beach has kept pace with Nassau County, experiencing a two percent increase between 2010 and 2020, but has lagged behind New York State within that same time frame (see Table 3-3, Home Construction). Since 2012, and partly as a result of rebuilding after Superstorm Sandy and the reuse of vacant and underperforming parcels, the City has permitted five new multi-family dwellings and 493 one-and two-family dwellings.3 Balancing resiliency with preserving neighborhood character has been a challenge for the City of Long Beach post-Superstorm Sandy, as homes were rebuilt and elevated above Federal Emergency Management Agency (FEMA) Base Flood Elevation (BFE). To reduce risk of damage due to flooding, and comply with FEMA regulations, approximately 1,200 units (between 10 and 15 percent) of the City’s housing stock was required to be raised above BFE. This new building typology altered the traditional streetscape, with second-story additions and raised building elevations changing the neighborhood scale (see Figure 3-18, FEMA Base Flood Elevation).

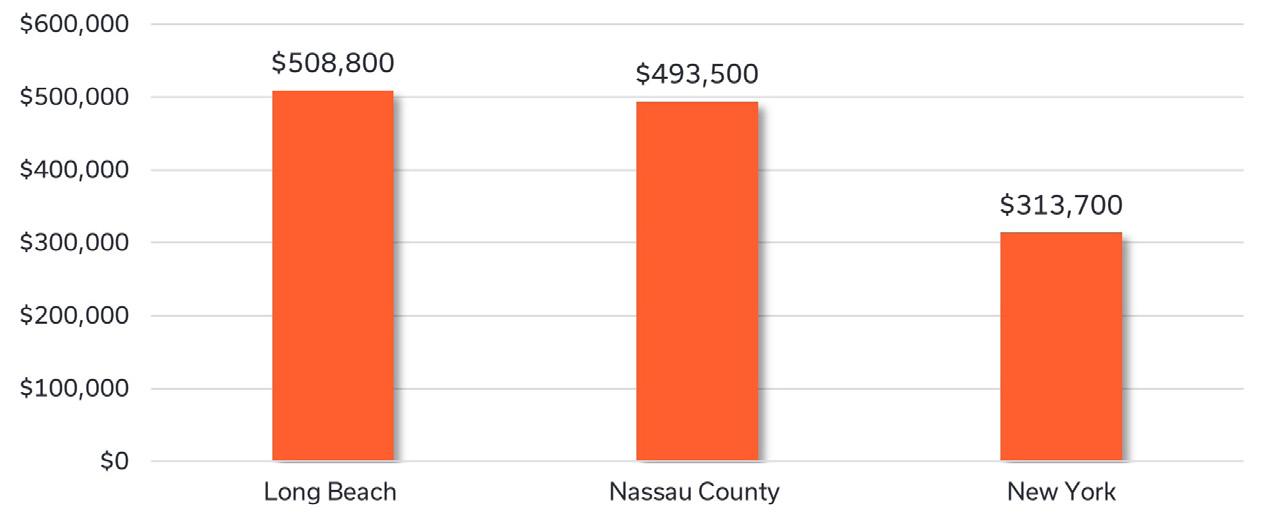
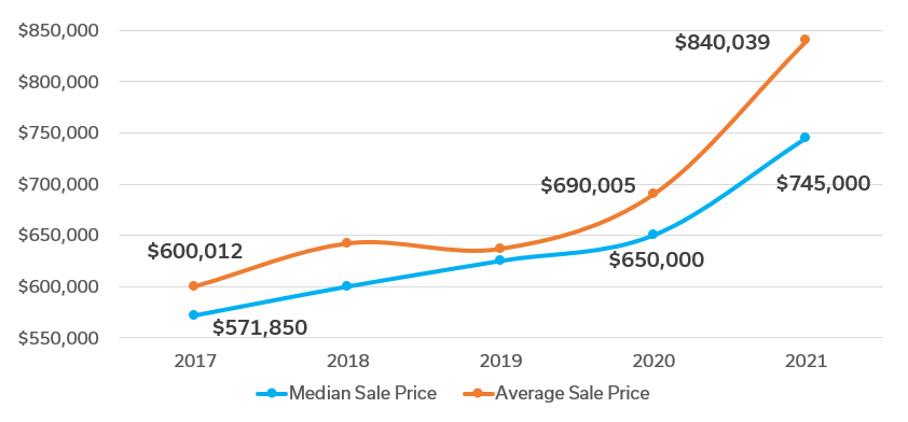
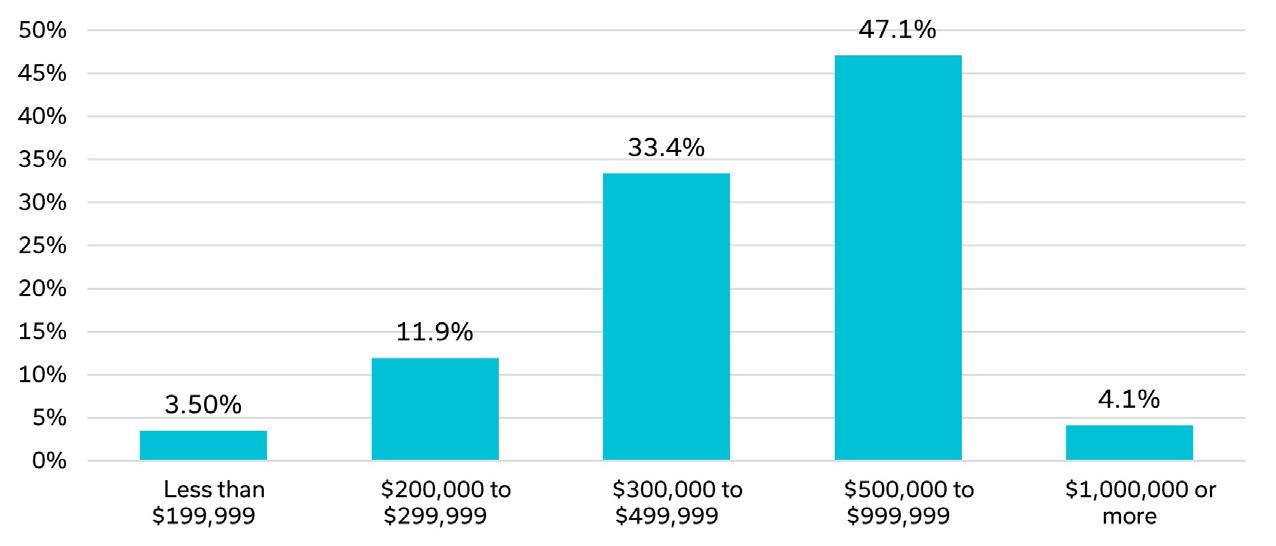
Despite the reality that incomes are lower in Long Beach than in Nassau County, median home values are higher exacerbating housing affordability issues. Nearly half of all homes in the City are now valued between $500,000 and $1,000,000, with only 3.5 percent of homes valued less than $200,000 (see Figure 3-19, Median Home Value, 2019, and Figure 3-20, Long Beach Distribution of Owner-Occupied Home Values). Home prices in Long Beach rose 22 percent between 2020 and 2021, as shown in Figure 3-21, Five-Year Long Beach Median and Average Home Sale Prices, largely due to increased demand resulting from New York City residents purchasing housing outside the City during the COVID-19 pandemic. Nassau County median home sale prices have also rapidly increased since 2019.
Housing rental costs in Long Beach are distributed evenly across several price points, though almost a quarter of units rent for more than $2,500 per month; approximately 12 percent of units rent for less than $1,000, but this does not guarantee affordability needs are being met (see Figure 3-22, Long Beach Distribution of Gross Monthly Rental Costs).
Generally, housing is considered “affordable” when monthly expenditure (excluding utilities) does not exceed 30 percent of gross monthly income. Using ACS 2015-2019 estimates, the median household income for City of Long Beach was $97,022. At this income level, housing would be considered affordable with costs lower than $2,425 per month. Thirty-six percent of Long Beach households qualify as low income (earning less than 80 percent of the Area Median Family Income [AMI]), compared to just under 25 percent of Nassau County households. In Long Beach, most households earning less than

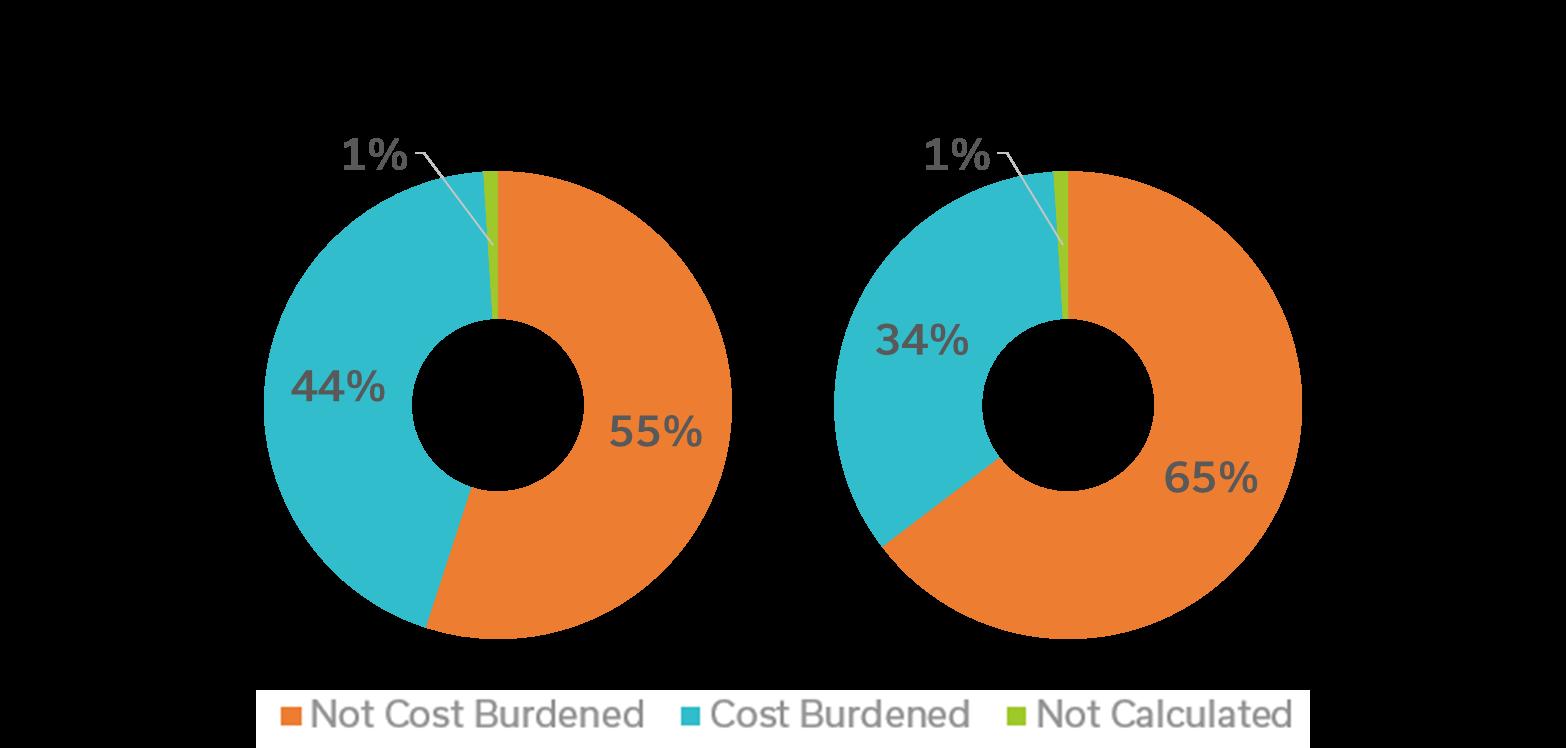
80 percent of the AMI are cost burdened, and 74 percent earning less than 30 percent of the AMI are severely cost burdened (spend 50 percent or more of household income on housing). Nearly 35 percent of Long Beach owner-occupied households spend more than 30 percent of their income on housing costs. Sixty-seven percent of renter-occupied households earning less than 30 percent AMI are severely cost burdened, with 44.4 percent of Long Beach renteroccupied households spending more than 30 percent of their income on housing costs (considered cost burdened). Seniors (65 years and over) are more likely to be cost burdened, as seen in Long Beach with almost half (46.2 percent) of seniors spending more than 30 percent of their income on housing costs (see Table 3-4, Housing Affordability; Figure 3-23, Cost Burden for Renters and Owners; and Figure 3-24, Portion of Income Spent on Housing, by Age of Householder in Long Beach).
S Table 3-4: Housing Affordability

Long Beach offers more subsidized housing units than other Nassau County communities per capita. The Long Beach Housing Authority maintains five (5) developments:
f Channel Park Homes
f Sol Scher Apartments
f Michael Valente Apartments
f Sonny Duckman Apartments
f Morton Cohen Apartments
Three hundred eighty-nine Section 8 rental vouchers are available, with 299 vouchers presently issued. Pinetown Homes provides 121 units of lower-cost housing.
Despite many home-ownership opportunities in densely populated Long Beach, the rate of ownership is lower in Long Beach than in Nassau County because there are more rental options than in the rest of the county.
Even though incomes are lower in Long Beach than in Nassau County, median home values are higher, exacerbating housing affordability issues.
Long Beach offers a diverse housing stock, with an even distribution of one-, two-, and three-bedroom units.
Rental and sales prices are rising at an increasing rate.
Thirty-six percent of the City’s population qualify as low income.
Thirty-four percent of the City’s homeowners and 44 percent of the City’s renters are cost burdened, which is on par with Nassau County.
To partially offset this housing cost burden, Long Beach offers more subsidized housing than other Nassau County communities.
The City of Long Beach offers more than 200,000 square feet of retail development in five neighborhoods: Beech Street in the West End neighborhood, the Central Business District along Park Avenue, between Neptune and Pacific Streets on East Park Avenue, Long Beach Boulevard at the City entryway, and the Boardwalk. Collectively, retail offerings include neighborhood goods and services, food and beverage, general merchandise and apparel, furnishings, and other miscellaneous retailers. See Appendix E for more information on the commercial corridors and districts.
The 1,042 businesses in Long Beach are primarily focused on service (45 percent), retail (28 percent), and finance, insurance, and real estate (13 percent, collectively). The largest employment sectors are in educational services (16 percent), health and social services (13 percent), scientific and technology services (10 percent), and retail (nine percent). The Long Beach City government and school district employ 21 percent of the local workforce.
According to ACS data, between 2010 and 2019, Long Beach gained an estimated 305 jobs (see Table 3-5, Annual Employment Estimates). The largest employment gains were in construction, while the largest losses were in public administration and wholesale trade. In losing 57 jobs, the agriculture, forestry, fishing and hunting, and mining industry saw the steepest percentage drop. The education section maintains the largest workforce.
S Table 3-5: Annual Employment Estimates
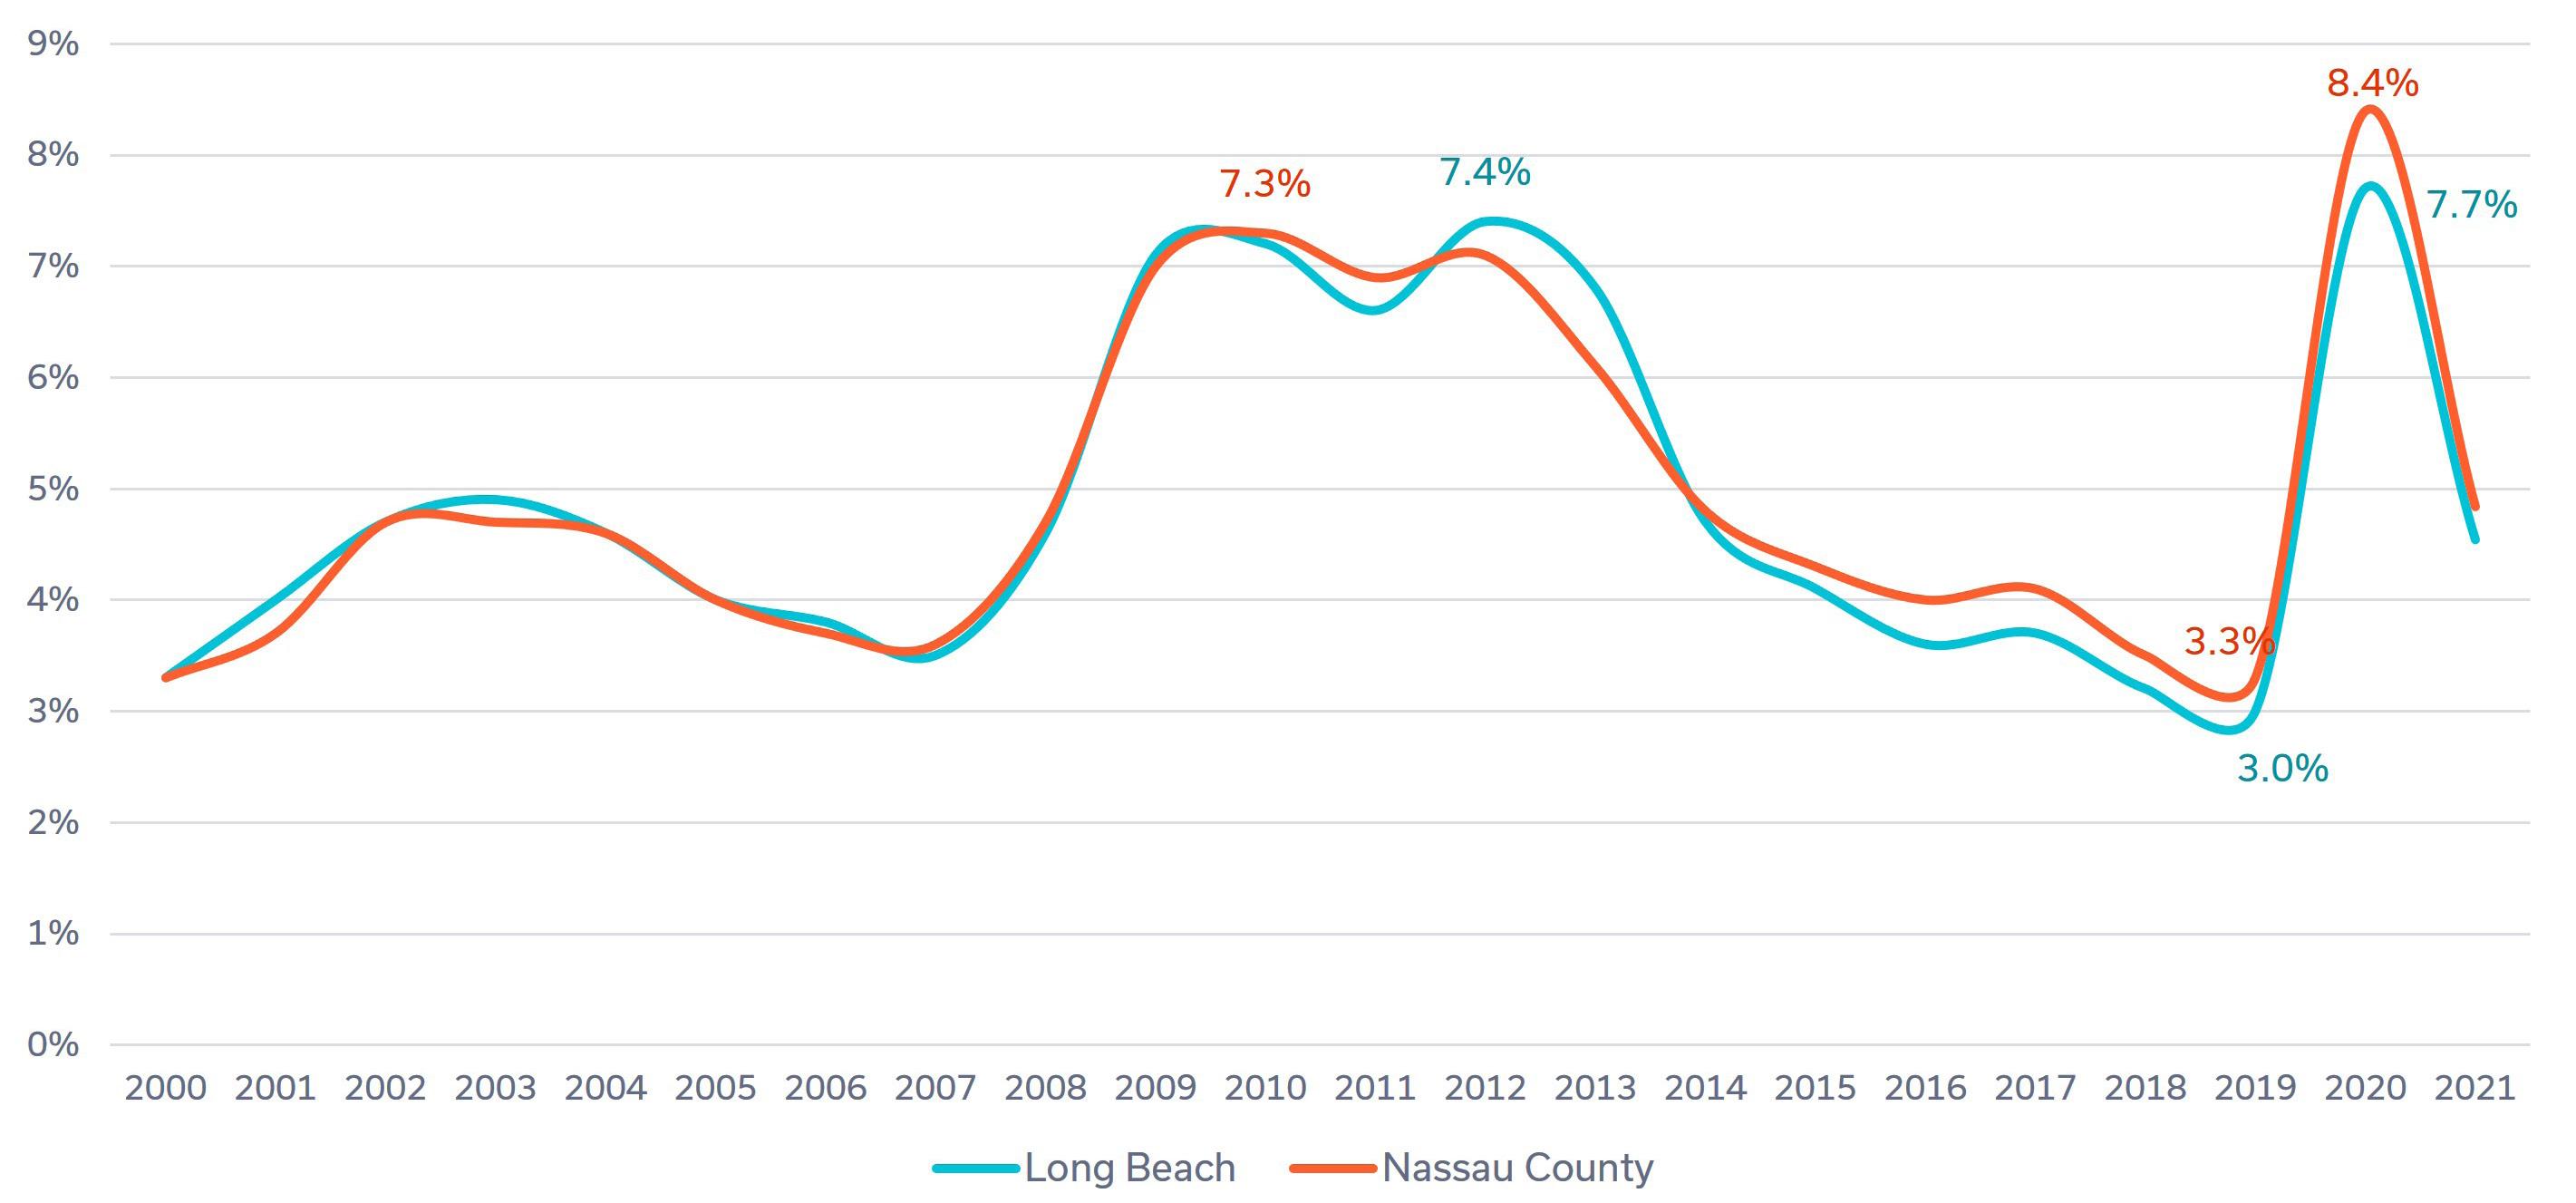
According to the New York State Department of Labor, Long Beach’s unemployment rates have paralleled Nassau County’s over the last 20 years. The unemployment rate in Long Beach declined
significantly between the 2012 peak and 2019 but increased dramatically due to the COVID pandemic, when unemployment rose to nearly eight percent.
In 2021, the unemployment rate decreased to 4.5 percent (see Figure 3-25, Long Beach and Nassau County Annual Unemployment Rate).
Vehicular and public transportation access to the City of Long Beach occurs via three bridges, the LIRR, which connects Long Beach to the New York metropolitan area, and the Amtrak New England rail system. The road system (see Figure 3-26, Road Classification) consists of two county arterials, Long Beach Boulevard, and the section of Park Avenue from Long Beach Boulevard east; one principal arterial (City owned), Park Avenue; and several collectors roads, that feed into the arterials.4 Though LIRR ridership declined due to the COVID-19 pandemic, numbers are slowly returning to pre-pandemic numbers. The Long Beach LIRR station is the sixth busiest in Nassau and Suffolk Counties and is scheduled by the MTA for an overhaul in 2023/24. LIRR ridership is projected to recover 80 percent of its pre-pandemic ridership by 2026.
The local Long Beach bus system runs along an East Loop and a West loop providing services within the City to the LIRR station, offers a shopping bus schedule and Able Ride (see Figure 3-27, Public Transportation). The Nassau County NICE bus system terminates at the multimodal center. Bus
4 NYSDOT: Roads classified as collectors and arterials may be eligible for state and federal funding programs.
ridership also decreased during the pandemic, shifting from 15,000-20,000 total riders per month pre-pandemic to, most recently, around 7,500 riders per month.5
Citywide, Long Beach achieves a high WalkScore6 for transit, bicycle infrastructure, and walkability (see Table 3-6a, WalkScore Ratings).7
5 City of Long Beach.
6 WalkScore—an organization that measures the walkability, transportation, and bikeability of communities in the U.S., Canada, and Australia—shares data collected from their three rating systems: Walk Score, Transit Score, and Bike Score. The score indicates how well a location is served by pedestrian and biking infrastructure and public transportation. A higher score indicates better infrastructure, connectivity, and network. The Walk Score is based on the distance to amenities nearby, population density, road metrics, and other data.
7 https://www.walkscore.com/NY/Long_Beach
Functional Road ClassNY DOT
Principal Arterial Other
Minor Arterial
Major Collector
Road Islands
Railways
Long Island Rail Road
S Figure 3-26: Road Classification

S Figure 3-27: Public Transportation

It is interesting to note that data analyses prepared by WalkScore indicated Long Beach’s commuting scores are lower than national averages, but ACS commuter data8 shows higher than national average percentages of Long Beach commuters take public transit or opt for non-motorized options, including walking and bicycling (see Table 3-6b, American Community Survey Commuter Data).
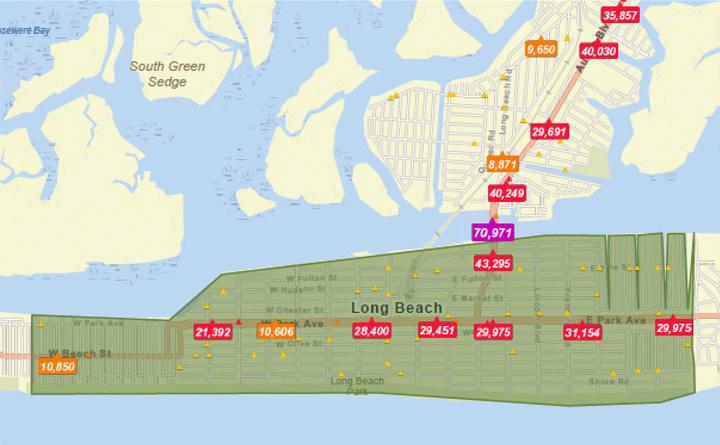
The highest traffic volumes within the City occur along East Park Avenue, the City’s major commercial corridor and principal arterial, and Long Beach Boulevard. Long Beach Boulevard and Park Avenue going east from Long Beach Road are County roads. The Long Beach Boulevard Bridge holds the highest traffic volumes (see Figure 3-28, Citywide Traffic Volumes). Traffic volumes decrease around Park Avenue in the vicinity of the LIRR Station and along West Park Avenue, thinning out west of the LIRR
Station and into the neighborhoods (except along Broadway). Commercial traffic, including heavy trucks, travel along New York State Truck Routes, the Long Island Expressway (LIE) and the Sunrise Highway to and from Long Beach.
Many areas in the City have inadequate on- and offstreet parking, where demand significantly exceeds supply. The parking shortage results in increased traffic congestion and negatively impacts air quality and quality of life for residents, as motorists circle through local streets seeking available parking and/or waiting for spaces to open. Demand for parking proximate to the Ocean waterfront has also increased as more
residents and visitors seek recreational opportunities. While the West End and Park Avenue commercial districts have a total of approximately 1,600 available on-street and public parking spaces, there are limits and rules around parking times and designated spaces that make it difficult for customers, workers, residents, and visitors to park for an extended period, drawing them away from spending time in these main commercial districts. While employees and visitors may park in the LIRR garage on the weekends when the garage is not used for commuters, the distance and challenges crossing Park Avenue make these parking options less appealing. The City is studying
how to make parking accessible and have sufficient space turnover to meet demand.
Long Beach’s strong existing on and off-road shareduse paths and bicycle network accommodates a wide variety of non-motorized uses (see Figure 3-29, Bicycle Network). The City’s trail network consists of the 2.25-mile Boardwalk along the Atlantic Ocean, bicycle lanes on Edwards Boulevard (recommended in the City’s Complete Streets Program and grant funded), and shared use paths on West Bay Drive, along the Bayfront, Ocean View, and Broadway. However, although prioritized in many of the City’s

planning documents, the City lacks a fully connected network, particularly from north to south. Per a 2021 Bike Score assessment, Long Beach’s Bike Score (53) citywide was less than the national average (67) likely due to the lack of bicycle infrastructure connecting Long Beach’s neighborhoods to local and regional employment centers.9 At the neighborhood level, a review of the WalkScore assessment, reveal downtown Long Beach, particularly along the central commercial corridor, achieves the highest transit, bikeability, and walkability scores, followed closely by the North Park neighborhood. Bicycle usage within the City, particularly for recreational cycling along the City’s beachfront, is high per City indicators, thus encouraging an expansion of the shared-use path network both within the City and to neighboring communities. Plans are in process to connect with the communities to the west.
The Long Beach City Council committed the City to Complete Streets in 2013 when it adopted legislation to use Complete Streets principles as much as possible. Complete Streets are safe for all users,
9 Bike Score—a method of measuring a community’s bike ability based on bike lanes, landscape, road connectivity, amenities, and percent of people who bike to work—is scored out of 100; thus, the higher the score, the more bike-friendly a community is considered.
especially seniors, comfortable, and convenient for travel for everyone, regardless of age or ability— motorists, pedestrians bicyclists, and public transportation riders. Over the last decade, Long Beach has received grant funding for the Complete Streets program, and other built infrastructure projects, which improved bicycle lanes, crosswalks, and curb extensions, including the Edwards Boulevard
Reconstruction Project, Neptune Boulevard, and National Boulevard. Complete Streets projects in the planning stages include the Park Avenue commercial area.
As part of its future growth and development, the New York Metropolitan Transportation Council (NYMTC) has established transportation system goals that:
f Ensure the safety and security of people and goods across all uses and modes;
f Maintain, operate, and coordinate to better enable inclusive, reliable, easy, accessible, and seamless travel across the region while striving to enhance equity in the services provided;
f Efficiently serve today’s population and plan for the growing number of residents, workers, and increasing amounts of goods;
f Minimize its greenhouse gas emissions and other impacts on the environment, especially the effects of climate change; and
f Are resilient and can mitigate, adapt to, and respond to chronic and acute stresses and disruptions.
Long Beach offers a variety of community facilities to its residents, including City Hall, public schools, athletic facilities, fire and police departments, emergency services, places of worship, post office, public bus garage and LIRR station, and multiple libraries, as show in Table 3-7, Community Facilities and Figure 3-30, Parks, Recreation, and Community Facilities. Following Superstorm Sandy, the City was forced to reevaluate the resiliency of its critical infrastructure and has invested heavily in reducing risk to storm events (see Appendix C). In the 2014 New York Rising Community Reconstruction Plan (NYRCR), the City prioritized several infrastructure projects that continued flood protection efforts throughout the City’s most vulnerable areas, especially along the Bayfront. Plans have been implemented by the U.S. Army Corps of Engineers (ACOE) to harden
the protection on the oceanfront using raised dunes, plantings, and the city-rebuilt, FEMA-funded new boardwalk with storm protection pilings. The public bulkheads along the Bayfront have been replaced in east and west areas. Plans for the central section have final agreements with the LIRR, allowing work to get started. The City has identified a need for emergent and non-emergent medical facilities in addition to the existing ones; the Mt. Sinai South Nassau pavilion is expected to be up and running in 2023 and will provide a host of critical care services.
Community Facility Type
The Boardwalk Community Facility
City Hall City Hall
EAC - Senior Center Community Facility
East Elementary School School
Fire Station #1 Fire
Fire Station #2 Fire
Lindell Elementary School School
Long Beach Post Office Post Office
Long Beach Public Library Library
Magnolia Community Center Community Facility
MLK Community Center Community Facility
Municipal Boat Launch Boat Launch
Municipal Fishing Pier Fishing
Police Auxilary Police
LIRR Train Station Train Station
Water Pollution Control Plant Community Facility
Water Purification Plant Community Facility
West End Elementary School School
S Table 3-7: Community Facilities
* See Table 3-7 for list of community facilities.
& Recreation (see Table 3-8 for list of parks and recreation facilities)
Other City Property
S Figure 3-30: Parks, Recreation, and Community Facilities

The City is fortunate to have numerous public and private passive and active recreation areas within its borders. More than eight percent of the City’s land is used for its 11 parks and recreation facilities. The 3.5mile beach and 2.25-mile boardwalk along the Atlantic Ocean serve as the City’s primary public open space.
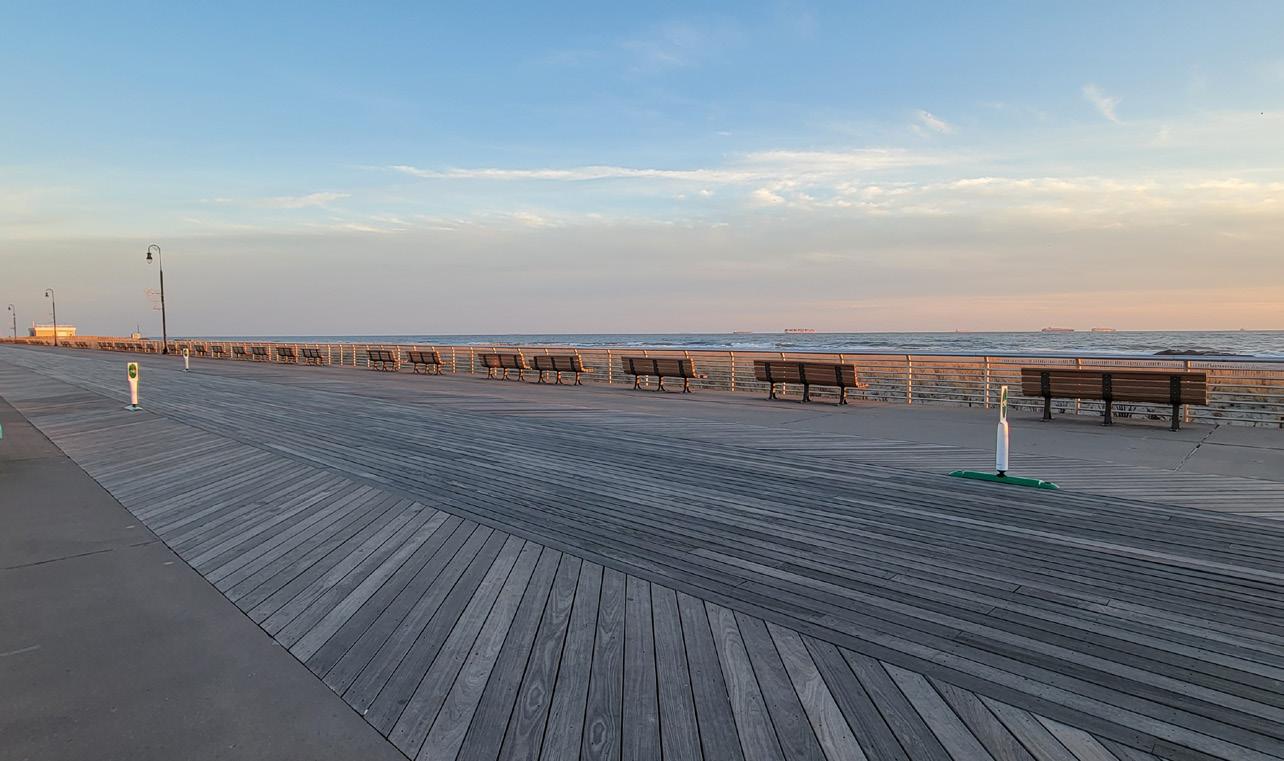
However, passive green recreational space is limited (see both Table 3-8, Parks and Recreation Facilities and Figure 3-30, Parks, Recreation, and Community Facilities). According to the Trust for Public Land, nearly all City of Long Beach residents live within a 10-minute walk of a park.
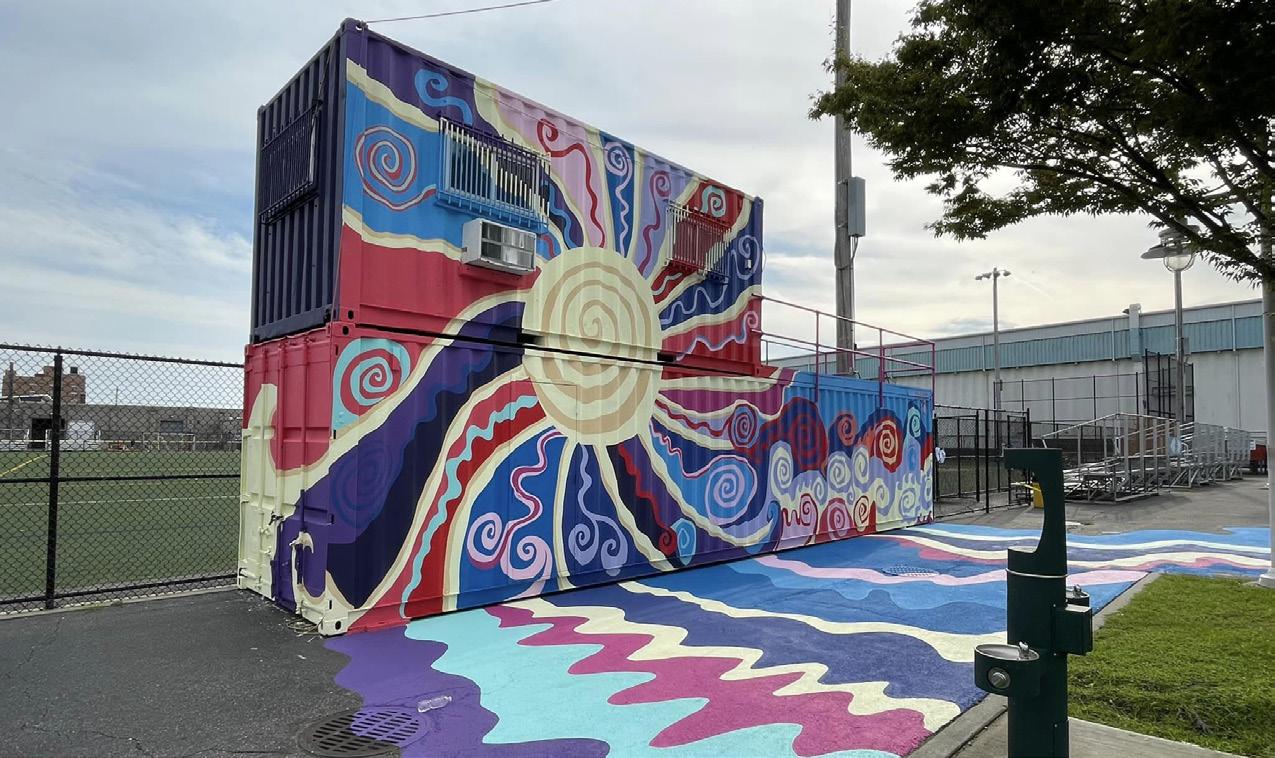
Founded in 1880, Long Beach is a unique Long Island community with a rich history and many local historic landmarks. Construction of the railroad connection to the City of Long Beach in 1880 provided easier transportation access facilitating the City’s growth as a resort community. In 1907, William Reynolds purchased the land area known as Long Beach, with the intention to build a planned community, Reynolds initiated the dredging of what is now known as Reynolds Channel on the north, filled in wetlands, and constructed many of the City’s homes, medians, street malls, sewer system, and the Boardwalk.
The City of Long Beach was incorporated in 1922, allowing the City greater control of its own government services. During the 1930s and 1940s, year-round residents of the City began to slowly replace the resort communities, culminating in a precipitous decline in tourism after World War II. In the 1970s, many of the old hotels previously used as long-term stay facilities were redeveloped as market-rate multi-family housing or nursing homes to accommodate changing demands. Various buildings and landmarks within the City of Long Beach are listed or eligible for listing on the National Register of Historic Places, reflecting the City’s strong
preference in preserving its living history. As shown in both Table 3-9 and Figure 3-31, Cultural and Historical Resources, historic properties include: the Pauline Felix House, Samuel Vaisberg House, Cobble Villa, Barkin House, Granada Towers, the Long Beach Post Office, and Long Beach Historical Museum. Locally significant buildings and structures include: the LIRR Station Building, St. James Church, the 9/11 Memorial, the Holocaust Memorial at Kennedy Plaza, John F. Kennedy Memorial, Red Brick District, Shine’s Bar on the West End, Laurel Diner, Edna Buckman
Kearns Historic Marker, and The Wreck of The Mexico Historical Marker.
* See Table 3-9 for list of cultural and historic resources.
Natural resources and the environment are critical to the protection and well-being of any community, its residents, visitors, infrastructure, and economy. The benefits they provide are wide ranging and include flood attenuation, storm surge protection, provision of clean air and water, pollution uptake, carbon sequestration, climate resilience, and recreation to name a few. Protection of these resources is paramount to the current and future health of the City.
In 1900, Long Island was composed of a wide variety of surface water including wetlands and watercourses, including those classified as Riverine and Lacustrine Water, Marine and Estuarine water, Palustrine Vegetated Wetlands, Tidal Flats, and Estuarine Vegetated Wetlands. Land development on Long Island and within the City of Long Beach resulted in the filling of many wetlands, thereby reducing water resources and increasing impervious coverage. Increased impervious cover in the region has exacerbated flood risk, rates of storm water runoff, and levels of pollutants entering waterways. Accelerated urbanization limits the landscape’s ability
to support biodiversity and mitigate storm related flooding in the region.
As a result of dense land development in the City, starting with Senator Reynolds, no wetlands remain, but for the intertidal zone along the southern coast (a designated Estuarine and Marine wetland). The intertidal zone serves as a habitat for many coastal plant and animal species and recreational space for residents and visitors.
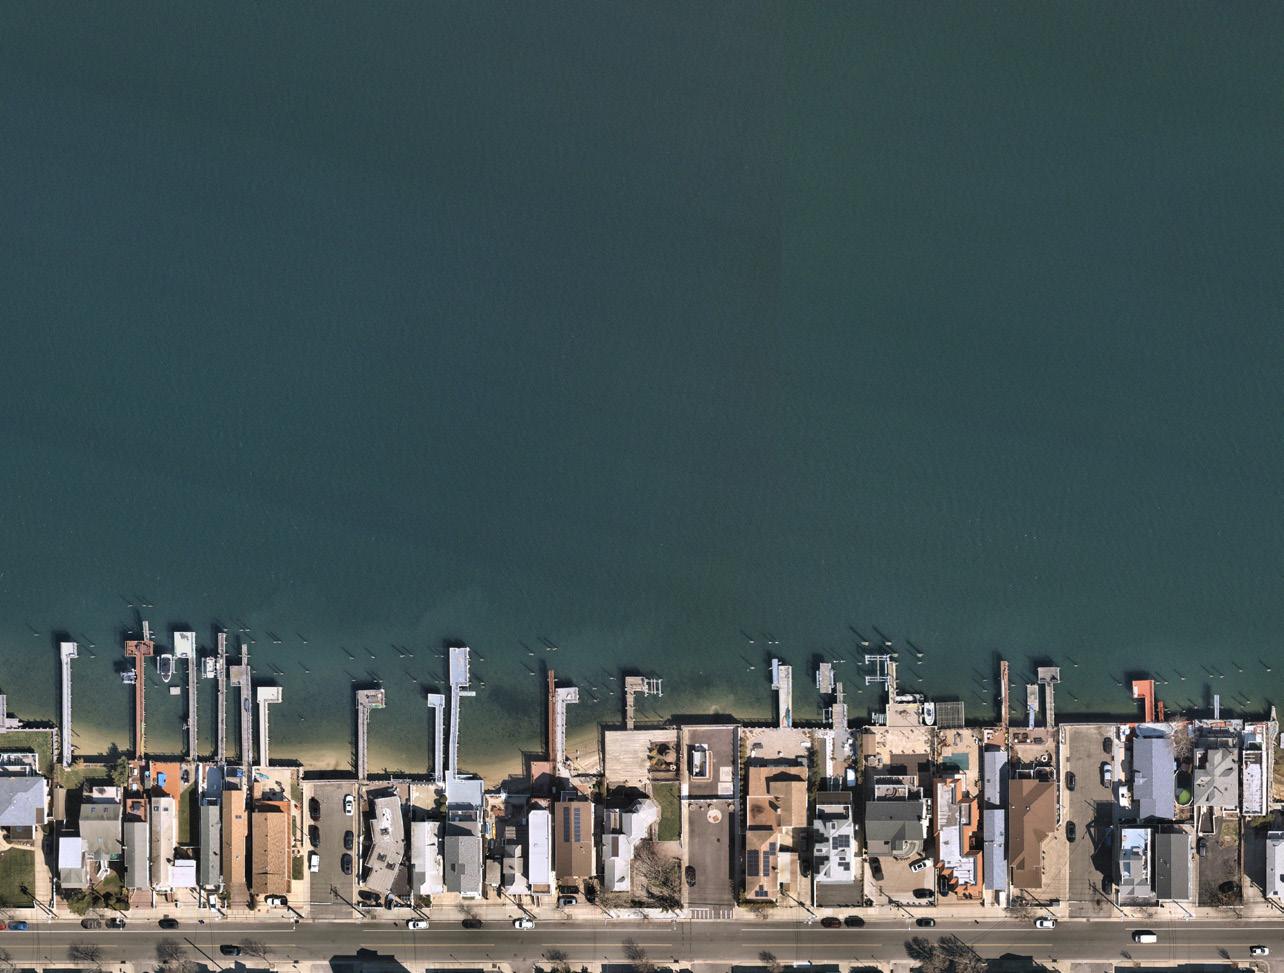
The New York State Department of Environmental Conservation (NYSDEC) has identified significant natural communities in the City’s north, northeast, and northwest across Reynolds Channel and along the Atlantic Ocean beach in Long Beach. To the north, salt pannes associated with the intertidal wetlands of Hempstead Bay are considered high quality examples of this rare community type. A half-mile buffer area encompasses the potential natural communities located across Reynolds Channel and the Channel itself. The southern shoreline is comprised of both the “maritime beach” and “marine intertidal gravel/sand beach,” both NYSDEC-designated rare communities. Both low and high salt marsh are also included in the NYSDEC Environmental Assessment Form mapping database. These communities are all vulnerable to increases in sea level rise.
The loss of wetlands and excessive nutrients from sewage treatment release from both Nassau County and City plants and untreated storm water outfall have deteriorated the City’s water quality in the estuary. There are 80 drainage outfall locations along the northern shore of Long Beach, parallel to Reynolds Channel and within the canals that connect to the Channel. Due to
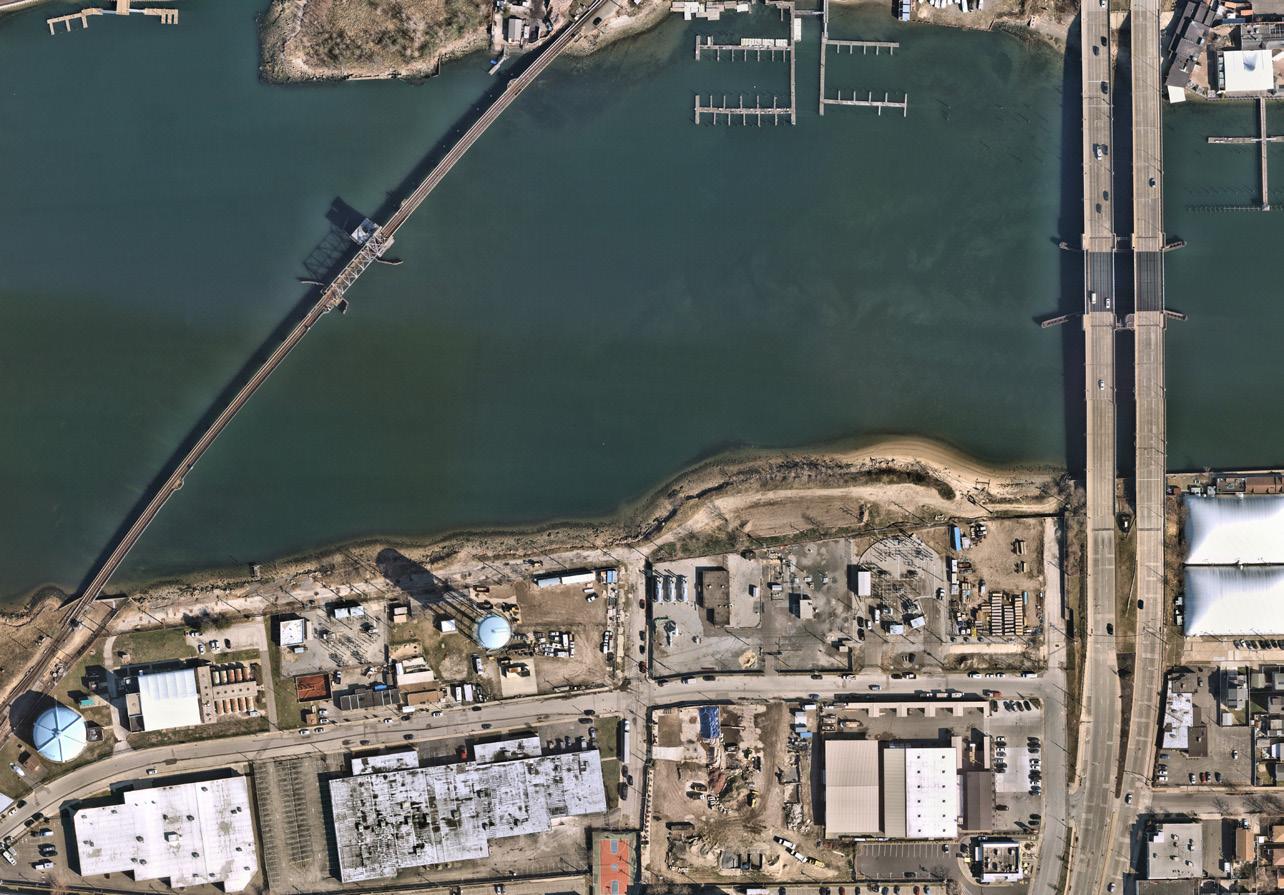
the excessive outfall, the habitat for fish, shellfish, waterfowl, and other fauna has deteriorated, and shellfish beds are no longer viable. The poor water quality also limits the recreational use of the Reynolds Channel. Consolidation of the City’s sewerage treatment plant with Nassau County’s is underway. This project will move effluent to the County’s Bay Park facility, then to its Cedar Creek facility, and, from there, into the ocean, thereby cleaning up Reynolds Channel, making the former plant a developable fiveacre property, and improving the bay wetlands that provide storm protection.
The beach and dunes of Long Beach provide many economic, social, and environmental benefits. The beach and adjoining dunes attract seasonal visitors, protect against flooding and storm surges, and are essential habitats for plant and animal species in the City, some of which are protected at the state and federal level. Dune restorations efforts by the ACOE have resulted in a more attractive and functional beachfront, with increased social and environmental benefits.
The common and least tern (State-threatened) is identified as present in the City and/or the surrounding environs. Seabeach knotweed, a rare plant according to NYSDEC, is also found proximate to or within Long Beach. At the federal level, the northern longeared bat (threatened), roseate tern (endangered), piping plover (threatened), red knot (threatened), and seabeach amaranth (threatened) are all listed by the U.S. Fish and Wildlife Service (USFWS) as occurring in or around the City. Additionally, 43 species of birds, protected under the Migratory Bird Treaty Act, are also documented by the Service.
The majority of Long Island depends on an underlying sole-source aquifer system for its fresh water. The system supplies over 400 million gallons of fresh water per day to over 2.8 million people in Nassau and Suffolk counties. Residents and businesses in Queens County also draw water from these resources. The three major aquifers that comprise the system are the Lloyd, Magothy, and upper glacial. The Lloyd aquifer is the oldest, deepest, most protected from pollutants that enter the groundwater due to an intervening lens of clay, and, therefore, the cleanest. The Lloyd aquifer is a limited resource and the only source of fresh water
for Long Beach. The use of this aquifer is restricted by NYSDEC to coastal communities, like Long Beach, where there is no other clean water aquifer available. Generally, the thickness of the aquifer declines to the north of Long Island. In Nassau County, the thickest points of the aquifer (400–500 feet) are along the southern coast, adjacent to the Atlantic Ocean. Water withdrawal and sea level rise will continue to deplete this resource. These factors are also believed to contribute to saltwater intrusion into the aquifer and an advance landward of the saltwater/freshwater interface. Long Beach will continue to work with the County and its neighboring communities to stress the protection of the Lloyd aquifer for coastal community use and conservation measures. Coordination with the State on more regional issues facing the aquifer will be ongoing. Ultimately, the protection of the Lloyd aquifer is imperative to the City’s well-being.
The United States Geological Survey (USGS) is currently studying the groundwater throughout Long Island to update its model on the effects of saltwater intrusion to the Lloyd aquifer. The City of Long Beach is a strong advocate to preserve the Lloyd aquifer for the coastal communities and has assisted in preventing the permitting of new pumping wells in other areas,
working closely with Nassau County and other Lloyd aquifer-dependent communities. Programs for public education and outreach are available to citizens, but few ordinances are in place to regulate water usage. The limited area of permeable surfaces and increases in impervious surfaces on Long Island restricts the infiltration of storm water, further exacerbating issues related to water use and aquifer recharge rate.
With the development of the City, and as noted in the “Parks, Recreation, and Open Space” section, passive green recreational space—including terrestrial ecosystems, the community of living organisms, and the non-living environmental features that support them—are very limited. This extends to a lack of areas that support a tree canopy, the west end of the City is nearly devoid of trees, and those with pervious surfaces that remain unpaved and/or undisturbed. Without these types of ecological resources in place, flooding, water quality issues, and heat island effects are exacerbated, aquifer recharge is reduced and natural habitat to support flora and fauna is significantly compromised.
As the climate continues to change, communities around the world face challenges related to extreme weather events, and long-term stressors such as temperature increases, sea level rise, changes in precipitation patterns and water availability. These acute and chronic impacts will have implications across public health and well-being, livelihoods and economic stability, infrastructure, mobility, and cultural identity, not to mention direct and indirect impacts to natural resources and the environment.
Given the location and geologic composition of Long Beach, the City has historically experienced damaging winds, frequent inland flooding, and storm surge as a result of extreme weather events. Hurricane Irene (2011) and Superstorm Sandy (2012) each caused a significant amount of damage to Long Beach, as well as

Long Island and the surrounding region. Superstorm Sandy, the largest storm to make landfall in New York in state history, hit Long Beach on October 29, 2012, and devastated the community by destroying homes, businesses, and critical infrastructure, including sewer and water lines, wells, pump and lifting stations, roads, parking lots, electrical systems, traffic signals, fire hydrants, and curbs and sidewalks.
Residents lost many personal assets such as vehicles and were without electricity, drinking water, and sewage services for over two weeks. The Long Beach water purification plant and water storage tower, water pollution control plant, electrical substations, and a major gas pipeline required emergency repairs that lasted several weeks. The City was flooded by 17.48 feet of storm surge, according to USGS.10 Streets were flooded with three to 10 feet of water at the peak of the flooding, and receding water left behind four to six feet of sand in some areas.
The City of Long Beach and Nassau County have gone through a planning process to identify key hazards in Long Beach and develop actions and strategies to reduce vulnerabilities and risks of natural hazards and extreme weather and create a more resilient and sustainable city. As a certified Bronze Climate Smart Community,11 the City has committed to reduce greenhouse gas (GHG) emissions, including actively building a GHG inventory, upgrading infrastructure like streetlights to more efficient LED technology, fast-tracking solar permits and studying rooftop solar on government buildings. These efforts have been documented in planning and policy documents including: the Long Beach NYRCR, the New York State and Nassau County Hazard Mitigation Plans (HMPs), the Long Beach Floodplain Management Plan (FMP), and the City’s participation in the Climate Smart Community program. A summary of these reports has been provided in Chapter 1 of this Comprehensive Plan.
This section summarizes trends and projections for changes in temperature, precipitation, sea level rise,
Long Beach is part of the South Shore estuary, which spans over 70 miles throughout both Nassau and Suffolk counties.
Extensive wetland habitat loss, experienced through urbanization, has limited the landscape’s ability to support ecological diversity and naturally mitigate flooding.
Sewage treatment release and storm water runoff have degraded water quality in Reynolds Channel and are currently being addressed to remove the effluent from the channel through the Nassau County and Long Beach consolidation project.
The beaches and dunes of the southern waterfront provide many resiliency, environmental, social, and economic benefits.
The Lloyd aquifer is a limited resource at risk for overuse and saltwater intrusion; water conservation and protection are important.
Lack of trees and other green space exacerbates flooding, water quality, and heat island effect issues.
and urban heat island for Long Island and the City of Long Beach.12
11 Climate Smart Communities Certification Report [accessed November 26, 2022]
12 Climate Projections are simulations of Earth’s climate based on assumed ‘scenarios’ for the concentrations of greenhouse gases in the atmosphere that affect the planet’s radiative balance. Climate projections are useful in
Global average temperatures are rising with extreme heat events becoming more frequent. Nassau County has been experiencing a rise in temperatures, a trend that is projected to continue. From 2020 to 2100, temperatures are expected to continue to increase, leading to higher temperatures. Days per year with temperatures exceeding 95 degrees in Nassau County are also projected to increase.
Overall extreme annual precipitation has increased in New York in the last 20 years, and severe rainfall events are becoming more frequent.13
Sea levels for coastal New York have been increasing and are projected to continue increasing due to global warming. As of 2014, rates of sea level rise on New York State’s coastlines have ranged from 0.86 to 1.5 inches per decade, averaging 1.2 inches per decade since 1900. Sea level is projected to rise along the
New York State coastline three to eight inches by the end of the 2020s, 9 to 21 inches by the 2050s, and 14 to 39 inches by the 2080s. The high-end estimate for sea level rise by the 2080s is 58 inches. Ranges for sea level rise are expected to change as ice mass and ocean dynamics in the region change.14,15 Average sea level in Long Island is expected to increase from the 1991 to 2001 baseline average by eight inches to 30 inches by 2050.16 Projections based on the Intergovernmental Panel on Climate Change (IPCC) Sea Level Rise Models can be seen in Table 3-10, NYSDEC CRRA Sea Level Rise Projections, 17 which shows the current projections for how coastal flooding might change in Long Beach based on sea level rise in the 2020s, 2050s, 2080s, and 2100s.
14 See Chapter 1 Climate Risks – NYSERDA [https://www.nyserda.ny.gov/-/ media/Project/Nyserda/files/Publications/Research/Environmental/ EMEP/climaid/ClimAID-Climate-Risks.pdf]
15 NYSDEC enacted the New York Community Risk and Resilience Act (CRRA) in 2014, which included the adoption of sea level rise projections. In 2017, DEC adopted 6 NYCRR Part 490, which established sea level rise projections for the three parts of NY State that are coastal or coastally influenced: Mid-Hudson, New York City/Lower Hudson, and Long Island
16 Projections from the Coastal Assessment Regional Scenario Working Group (CARSWG) and NY State Community Risk and Resiliency Act (NYCRRA). Projections from CARSWG show sea levels continuing to rise at an accelerated rate after 2050
considering future hazards and vulnerabilities, and to help inform future planning, including needs for climate adaptation.
13 New York Climate Change Science Clearinghouse
17 NYSDEC CRRA. These projections were generated in 2017 and utilize 2000 to 2004 levels as a baseline. The sea level rise projections are just one part of CRRA’s efforts to ensure communities are resilient in NY. Also see the National Oceanic and Atmospheric Administration (NOAA) Sea Level Rise Mapper at Sea Level Rise and Coastal Flooding impacts.
color and material, imperviousness preventing water infiltration, and pollution all contribute to urban heat island effect. Heat islands can affect communities by increasing summertime peak energy demand, air conditioning costs, air pollution and greenhouse gas emissions, heat-related illness and mortality, and


Tree Canopy can improve heat island effects and offers relief from excessive temperatures. The West End neighborhood experiences some of the most severe heat island effects in Long Beach. In 2015, after many trees were lost due to saltwater flooding from Superstorm Sandy, the City of Long Beach developed a Tree Replanting Master Plan. The “State Streets” in the West End neighborhood are not included due to lack of planting strips in the roadways. Tree planting in the West End is therefore dependent on property owner participation. Other heat island areas in the City include the North Park neighborhood, the City Hall area, and the oceanfront west of Long Beach Boulevard. These areas are included in the 2015 Tree Replanting Plan, with the goal of planting a variety of trees that do well in the oceanfront environment to alleviate the effects of heat around the City. Currently, 3,000 new trees have been planted through the Tree Planting Plan.
The vast majority of the City of Long Beach is within a high-risk flood area with a one percent or greater chance of flooding, as identified by FEMA where mandatory flood insurance is required. Zone VE (Coastal High Hazard Area), which is mapped along the south shore, has a one percent or greater chance of flooding and an additional hazard associated
with storm waves, as shown in Figure 3-18, FEMA Base Flood Elevation. The beach communities and the communities adjacent to Reynolds Channel experience the greatest risk for flooding.
Average annual temperatures are rising with extreme heat events becoming more frequent.
Variation in total annual precipitation is occurring, while extreme rainfall events are becoming more intense.
Sea levels in the Long Island Region continue to rise at an accelerating rate.
The Heat Island effect, compounded by increasing temperatures, is an issue in some Long Beach neighborhoods especially in the West End neighborhood.
The vast majority of Long Beach is within a high-risk flood area with a one percent or greater chance of flooding, as identified by FEMA where mandatory flood insurance is required.

This chapter synthesizes information described in Chapters 1, 2, and 3 and is organized around five key themes:
f Livable Neighborhoods and Sustained Quality of Life
f Thriving Places and Robust Year-Round Economy
f Access to Mobility and Connectivity
f Enhanced Environment and Climate Resilience
f Sustainable Growth and Opportunities
The public engagement process has informed the goals within each theme. This chapter also presents Citywide, neighborhood, and site-specific strategies and actions to achieve each goal.
We envision a vibrant, inclusive, sustainable community that offers a highquality of life for all residents and guests. Through responsible planning, we will enhance our infrastructure and public spaces, protect our natural resources, support local business and the arts, and encourage smart economic growth as we work towards a future that is equitable, resilient, and embodies the unique character of Long Beach.
The Neighborhoods
The fabric of a community is its neighborhoods, and Long Beach is comprised of eight major and distinct neighborhoods. The City’s eight major neighborhoods are as follows:
f The West End – This neighborhood runs from the Beach to the Bay, from New York Avenue to Nevada Avenue, reaching East Atlantic Beach. The West End is characterized by its beach bungalows on small lots, many of which have been raised since Superstorm Sandy to comply with Federal Emergency Management Agency (FEMA) 100-year floodplain requirements. The West End community is also known as a nightlife destination offering bars, restaurants, and summertime activities.
f Westholme – From Beach to Bay, the Westholme neighborhood reaches from New York Avenue to Laurelton Boulevard, south of Park Avenue; and to Magnolia Boulevard north of Park Avenue. This neighborhood comprises a variety of housing, including single-family, two- and three-family
homes. The Westholme neighborhood features many historic homes designed in the “eclectic Mediterranean” style, introduced in the early twentieth century by Long Beach founder, Senator William H. Reynolds.
f The Walks – The Walks neighborhood encompasses the area between Park Avenue and West Beech Street, between New York Avenue and Lindell Avenue and features ten “walks” named for months of the year. The layout of the community was built by the military during World War I, when the nearby Nassau Hotel become a military settlement.
f Central District – The neighborhood between Laurelton Boulevard and Monroe Boulevard has become known as the Central District. This neighborhood contains the Park Avenue Central Business District.
f North Park – The area north of Park Avenue, between Magnolia and Long Beach Boulevards is known as North Park. The North Park neighborhood encompasses the Long Island Rail Road (LIRR) Long Beach Station, City Hall, and a mix of singlefamily and two- and three-family homes. The North Park neighborhood is also developed with several city-owned and former industrial sites at
its Bayfront, offering opportunities for a potential updated vision of the area, including compatible housing and mixed uses. Long Beach Boulevard at North Park’s eastern border is developed with convenience retail and car-oriented uses, prominent chain stores, and Long Beach’s coworking space / innovation center.
f The East End – From Beach to Bay, the neighborhood between Monroe Boulevard and Maple Boulevard, south of Park Avenue, and Long Beach Boulevard and Neptune Boulevard, north of Park Avenue, is known as the East End. This neighborhood contains many single-family homes, and strip commercial/retail stores that serve local needs.
f The Canals – The Canals area consists of several north-south streets with parallel canals originating from Reynolds Channel. The Canals neighborhood extends from Forrester Street to Curley Street, north of Park Avenue. This neighborhood comprises primarily single-family homes.
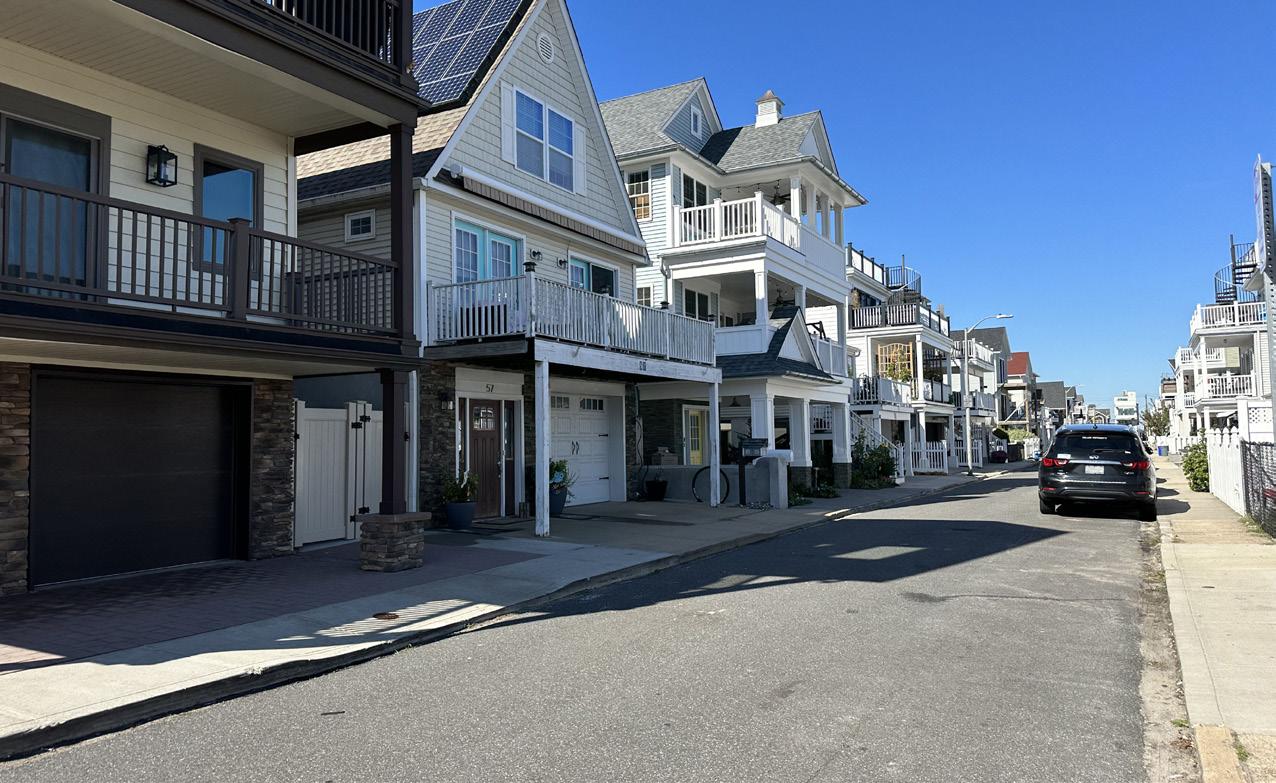
f The President Streets – The President Streets neighborhood comprises streets named for U.S. presidents, except for Atlantic, Belmont, and Mitchell Avenues, and Pacific Boulevard. This neighborhood extends between Roosevelt and Maple Boulevards south of Park Avenue.
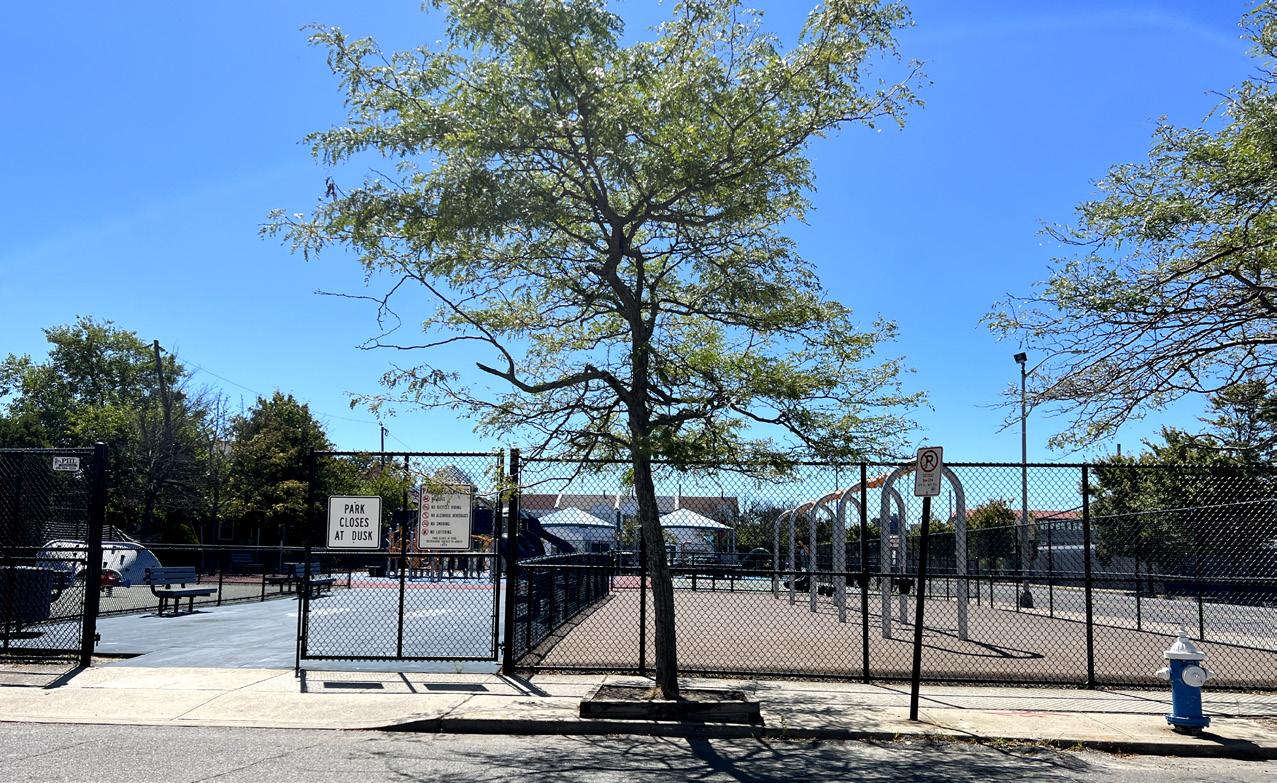
Drafted in the 1980s, the City’s Zoning Code and Zoning Map have not kept pace with on-the-ground development patterns and new priorities. This means that zoning district requirements established to control measures like building size (footprint, height), location of a structure on a lot (front, side, and rear yard setbacks), and other dimensional regulations need to be reexamined in the context of 40 years of development. Following Superstorm Sandy, many residences, businesses, and essential community facilities were rebuilt, and others are currently in the planning stages to be rebuilt and elevated above FEMA Base Flood Elevation (BFE) to increase their resiliency and reduce their risk from storm damage. While some property owners have decided not to elevate their buildings, the potentially life-saving structural requirements have, consequently, altered the character of the built environment and resulted in variability between the Zoning Code and actual development. Preserving the unique characteristics of each of the City’s neighborhoods—essential to maintaining Long Beach’s character and quality of life—can be achieved through policy and design recommendations.
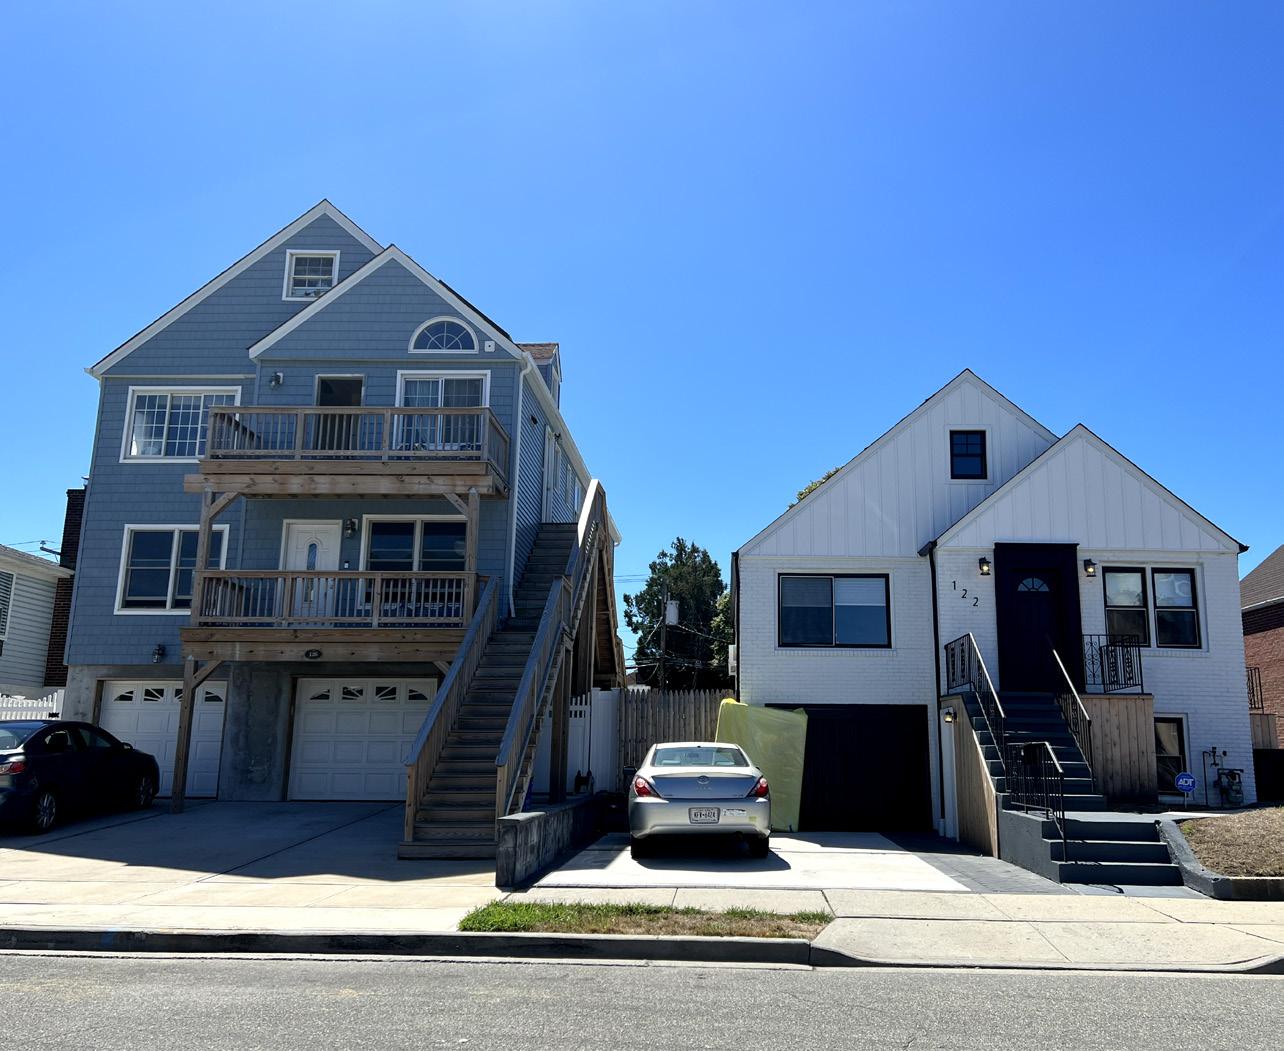
The variability between the Zoning Code, actual development, and the City’s plans for development should be reconciled through a Zoning Code update, which is recommended as a next step in this Comprehensive Plan.
Presently, the City’s Zoning Board of Appeals (ZBA), an appellate board, has assumed the roles and responsibilities for reviewing site/land development applications in addition to their responsibilities for area and use variance reviews. Land development applications, including site plan, subdivision, and
special use permits, may be better accommodated by a Planning Commission/Board, used in many municipalities. Establishing a streamlined application process would facilitate, and potentially expedite, reviews. Hiring additional staff to help with land development application review may also provide much needed support, although staffing would need to be reviewed in the context of additional costs to the City. All of the above referenced recommendations are noted as key priorities in this Comprehensive Plan.
Goals, strategies, and actions that promote livable neighborhoods and sustain the quality of life enjoyed by Long Beach residents were developed from community input and consideration of Long Beach’s opportunities and constraints (see Appendix D).
Question 15: How would you rate the overall quality of life in Long Beach?
f Excellent: 18.10%
f Good: 54.57%
f Average: 23.17%
f Poor: 3.89%
f Very Poor: 0.27%
S Survey Results1
Goal 1.1: Protect neighborhoods at a Citywide level and cultivate renewed quality of life and enhanced physical environment.
f Strategy 1.1.1: Evaluate and, if necessary, revise the City’s Zoning Code1 to be consistent with existing development patterns and the Comprehensive Plan’s Future Land Use Plan. Zoning Code revisions would be designed to facilitate the application process, address residents’ quality of life concerns, and prioritize resiliency measures that reduce the risk of storm damage to the City of Long Beach and its neighborhoods. Suggested revisions to be considered for the Zoning Code include:
Landscaped buffer areas between residential and commercial neighborhoods; the buffers would be located on the commercial properties.
— Revised parking requirements that allow flexible off-street parking arrangements, including shared parking between uses that generate different peak hours of demand (i.e., a
hotel and an office use, or a home supply store and a restaurant only open in the evenings).
— Regulations that would establish appropriate home-based businesses by special permit.
f Strategy 1.1.2: Continue regular maintenance and incorporate necessary resiliency components into planned improvements to the City’s roadways, pedestrian and biking facilities, and other City infrastructure.
f Strategy 1.1.3: Continue implementing Citywide efforts to increase the sustainability of the City’s infrastructure.
f Strategy 1.1.4: Continue Code Enforcement efforts, including property maintenance, maintaining high quality aesthetics within the City’s commercial areas, and regulating short-term rentals.
f Strategy 1.1.5: Continue implementing sustainability initiatives and investigate new methods to minimize heat islands, and enhance the City’s natural environment and sustainability.
f Strategy 1.1.6: Ensure that proposed improvements and development applications are consistent with the City’s adopted Local Waterfront Revitalization Plan (LWRP) that prioritizes public access to the City’s waterfront.
f Strategy 1.1.7: Ensure that large-scale development and/or redevelopment applications are reviewed in the context of the community benefit they may provide.
f Strategy 1.1.8: Continue to promote and provide educational materials describing sustainability measures that protect residents and neighborhoods and increase the City’s resilience.
Goal 1.2: Provide a foundation for future zoning amendments and updates.
f Strategy 1.2.1: Update the City’s Zoning Code and Zoning Map to:
Consider innovative zoning approaches to ensure development is balanced with resiliency initiatives.
Increase the efficiency of the land use approval process and minimize the need for variances.
— Realign the Zoning Code with Building Code requirements for building elevation/setbacks.
— Align with City’s vision for future land use and development.
— Update policies to ensure Zoning Code is reviewed and revised more frequently.
Goal 1.3: Evaluate existing planning processes, structure, and administration.
f Strategy 1.3.1: Evaluate and update the City’s administrative procedures to streamline the land use application review process.
f Strategy 1.3.2: Create an application “flow chart” to ensure efficiency of application processing and consistency with the City’s adopted and accepted policy documents. The flow chart would list required reference materials including historic and ecological resources, the Comprehensive Plan and the LWRP.
f Strategy 1.3.3: Create a Planning Board/ Commission with clearly defined roles and responsibilities.
f Strategy 1.3.4: Evaluate, in the context of funding, internal City of Long Beach staffing needs and consider retaining a full-time or consulting planner to coordinate land use policy initiatives with the Planning Board/Commission, implementation of the Comprehensive Plan recommendations, and the LWRP.
Goal 1.4: Focus on affordable housing and housing needs.
f Strategy 1.4.1: Continue City efforts related to housing affordability, including providing local resources, and housing information seminars and workshops to educate the community regarding available public and private resources.
f Strategy 1.4.2: Prepare a Citywide Housing Plan that examines the housing needs of Long Beach residents, including seniors, young families, those that live/work in the City, and long-term residents wishing to downsize and stay in Long Beach. The Housing Plan would focus on long-term housing affordability in the City and developing incentives for providing affordable housing.
f Strategy 1.4.3: Adopt “inclusionary” zoning that would require new residential development with five or more units to provide some percent of new housing units as affordable (minimum 10 percent).
f Strategy 1.4.5: Consider creating a Transit Oriented Development (TOD) District in downtown Long Beach that would allow mixed-use development at/near/adjacent to the LIRR station.
f Strategy 1.4.6: Assess and determine if a policy for short-stay residential properties that would require a registration permit is needed.
f Strategy 1.4.7: Work with experienced housing agencies, such as the Long Island Housing Partnership (LIHP) and Community Development Corporation of Long Island (CDCLI), to expand first-time homebuyer assistance and foreclosure prevention programs. These programs would also explore incorporating advances in energy and cost saving technologies into housing design, construction, operation, and maintenance, particularly for low- and moderate-income households.
Goal 1.5: Enhance community facilities to adequately serve current and future residents and their needs.
f Strategy 1.5.1: Continue and expand the City’s maintenance of park and recreation facilities.
f Strategy 1.5.2: Support parks, open space, and recreation facilities and programs that respond to recreation trends and resident interests.
f Strategy 1.5.3: Encourage private sector development of family-friendly entertainment activities and establish alliances with cultural/ art institutions to increase local amenities, and provide destinations for residents and visitors,
including Farmer’s Markets and pop-up stores; all of which would support economic development.
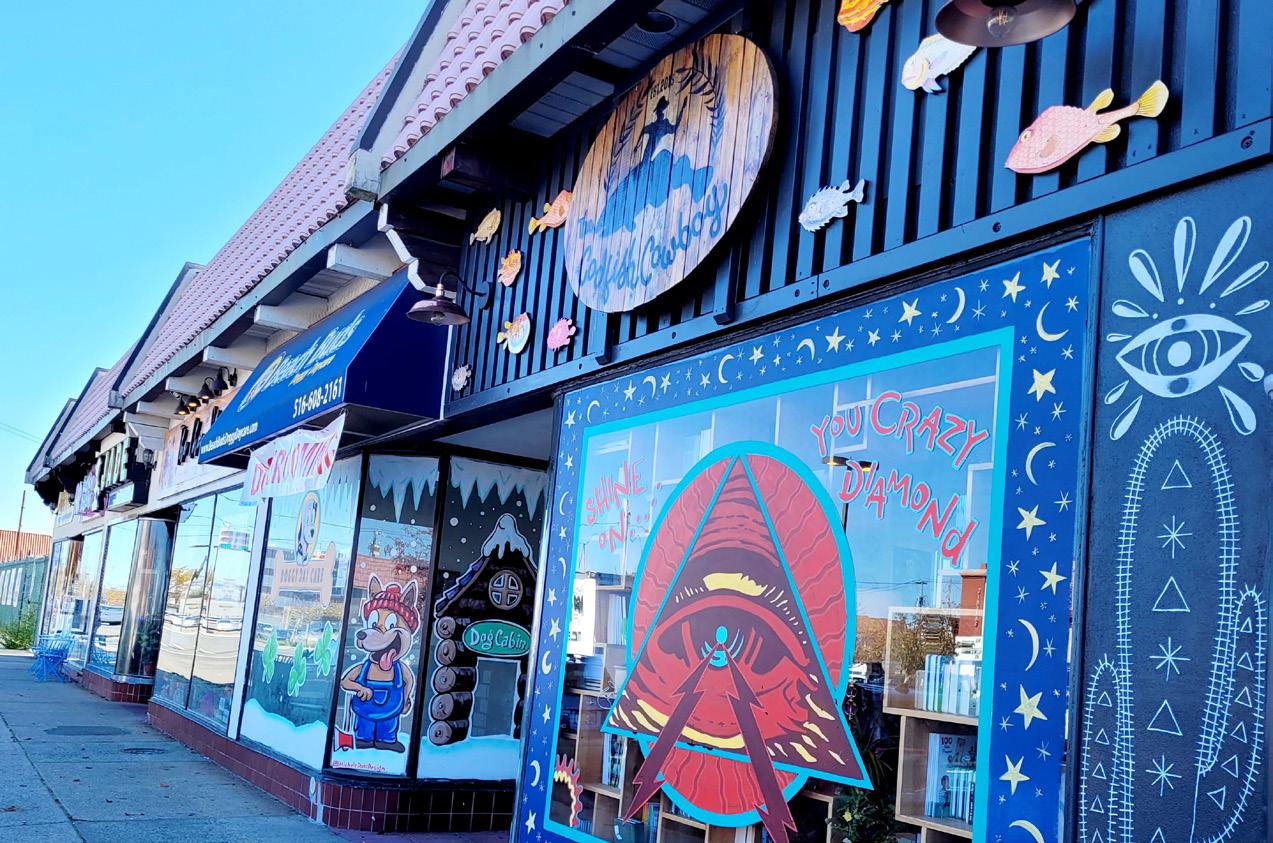
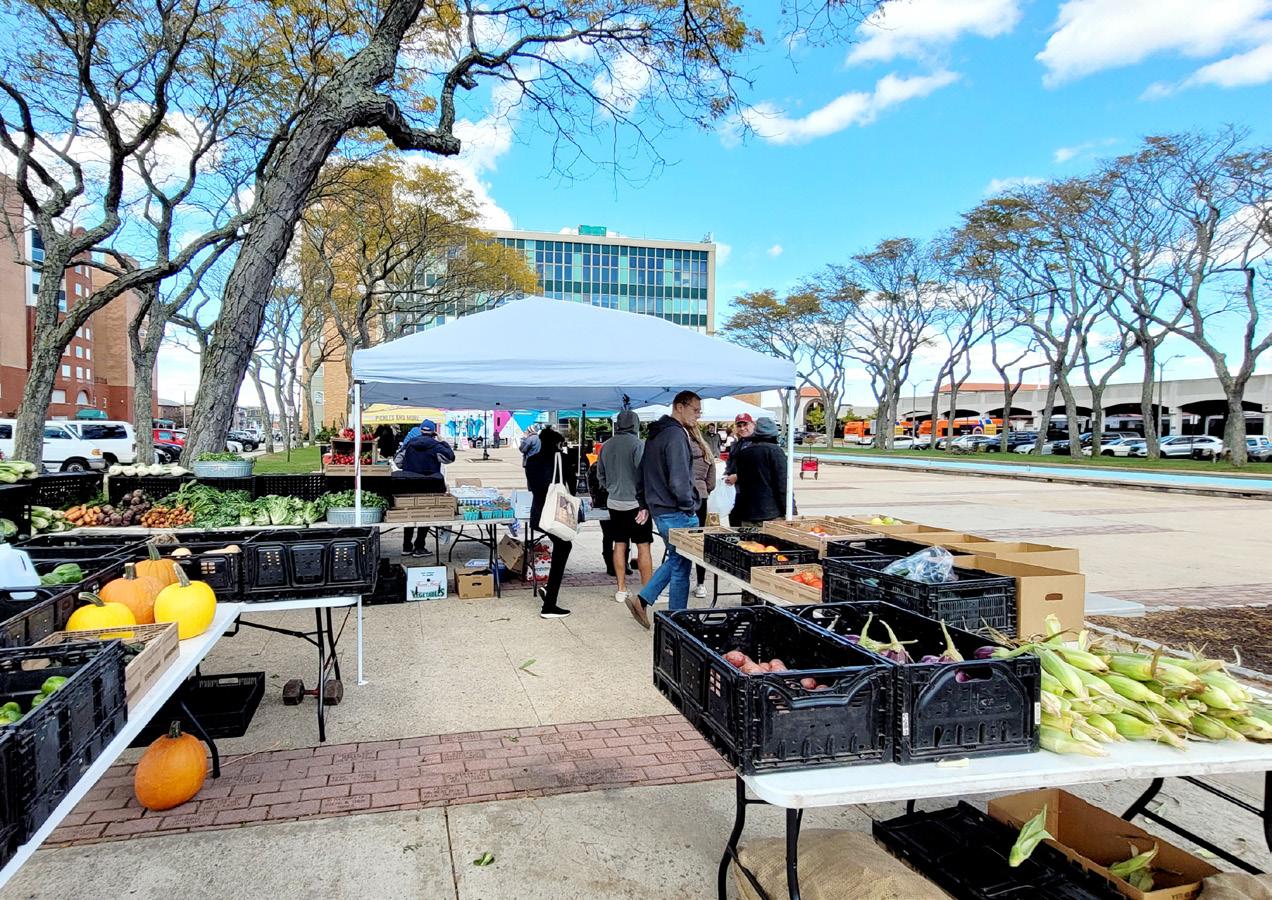
Goal 1.6: Continue to preserve and enhance the City’s cultural and historical assets.
f Strategy 1.6.1: Expand the local inventory of sites and structures of historic significance.
f Strategy 1.6.2: Create a historic resources map that would be available on the City’s website and social media.
f Strategy 1.6.3: Continue and expand the City’s support of Long Beach’s artist community, provide opportunities for gathering spaces for artists, musicians, and the display of public art throughout the City, and consider creating a Cultural Arts Center.
f Strategy 1.6.4: Encourage the inclusion of cultural and/or educational facilities (e.g., theater, art gallery, concert hall) within major redevelopment projects.
Neighborhood-Specific Goals and Strategies
Goal 1.7: Protect and enhance the City’s distinctive neighborhoods with specific strategies tailored to the community.
f Strategy 1.7.1: Continue to implement recommendations included in the Empower North Park Initiative, including incentivizing mixeduse and mixed-income development, resiliency measures, and providing access from North Park to the Bayfront.
f Strategy 1.7.2: Maintain and expand relationships with the owners of Pine Town Homes and the Housing Authority to maintain affordable housing for the community.
f Strategy 1.7.3: Explore and employ legal mechanisms (e.g., Community Benefit Agreement) that would require new development projects that meet/exceed established thresholds to provide benefits to the community.
f Strategy 1.7.4: Promote mixed-use and mixed income development of appropriate size and scale to the neighborhoods in which they are located.
f Strategy 1.7.5: Improve direct access between North Park and the Bayfront.
f Strategy 1.7.6: Consider connecting access/ egress in the West End neighborhood between selected residential properties, where appropriate, to minimize adjacent driveways/curb cuts.
f Strategy 1.7.7: Reconfigure parking on wide streets south of West Park Avenue and on streets north of West Park Avenue, from parallel parking on both sides of the street to diagonal parking on one side to achieve additional parking spaces.
f Strategy 1.7.8: Implement sustainable green infrastructure measures to address the lack of greenspace and permeable surfaces in the West End neighborhood.
f Review and revise City’s Zoning Code.
f Create a Planning Board and land development application flow chart.
f Pursue state and federal funding and grants to support housing rehabilitation for seniors and other eligible households.
f Inventory City-owned vacant/underutilized properties and prepare a highest and best use analysis.
f Prepare a Citywide Housing Plan to evaluate housing needs of all residents.
f Prepare a Citywide streetscape plan that can be implemented in phases when funding becomes available.
f Create a structured enforcement policy for zoning and other building code violations.
f Recommend the adoption of inclusionary zoning that requires a portion of new multi-unit developments to be affordable.
f Enhance community facilities, including Parks and Recreation, as well as the City’s cultural and historic assets.
A viable economy is the keystone to a sustainable community. As a primarily residential beach community dependent upon dynamic summer activity and visitor dollars, the City of Long Beach’s economic focus is on retaining and enhancing the commercial downtown near the LIRR station. Survey results indicated residents identified improving this area as a top priority. The economic analyses indicated significant opportunities for residents to benefit from better on-island shops and services. Improving this area as a transportation hub would also better serve City residents and visitors.
The City’s primary goal is to attract new year-round businesses that provide reliable, quality employment, while encouraging an environment that allows existing businesses to prosper.
The City of Long Beach is actively engaged in promoting its business community through Citywide and neighborhood-specific economic development initiatives. The City’s main commercial downtown comprises both sides of Park Avenue, bound on the
west by Laurelton Avenue, and on the east by Monroe Boulevard. The Park Avenue Central Business District (CBD) is the primary downtown for Long Beach and presents the greatest opportunity for targeted economic development, capitalizing on its existing infrastructure and assets. Additional well-planned, mixed-use transit oriented development (TOD), including higher density housing with an affordability component, cultural/performance space, and retail/ dining, would boost shopping and worker activity in the CBD, activating the core of downtown and supporting a year-round economy. Reconfiguring connections between the North Park neighborhood and the CBD would enhance the walkability of downtown Long Beach. Other commercial areas within the City include: Beech Street between Nevada and New York Avenues in the West End neighborhood; East Park Avenue between Neptune and Pacific Boulevards in the East Side and Canals Neighborhoods; and Long Beach Boulevard from the Long Beach Road Bridge to Park Avenue, which the City has targeted as a potential Innovation District for focused economic development.
The two most concentrated retail and business areas in Long Beach are along Park Avenue, with approximately 640,000 square feet (sf) of gross leasable area, and within the West End Neighborhood
(Beech Street), with approximately 119,000 sf of gross leasable area. These two commercial districts serve both the surrounding neighborhood and the larger Long Beach community. The commercial corridor along Beech Street, while smaller in scale than the Park Avenue commercial center, is anchored by numerous food and beverage establishments and is a draw for visitors to Long Beach Island (see Appendix E for more information).
The City can capitalize on the development momentum created by the coworking space and Mount Sinai medical facilities near Long Beach Road, and target highest and best uses for existing underutilized and vacant City-owned property to create an innovation center.
In addition, the City will be able to utilize the five acres of Bayfront property that will become available following the Nassau County/Long Beach Sewerage Treatment Plant Consolidation and other City-owned Bayfront property in a plan developed with nearby residents.
On a macro-economic level, the City’s concentration of food and beverage establishments, notably in the West End (Beech Street) and Central Business District, reveal it is a dining destination, particularly in the summer. While the City does offer some localized,
neighborhood-scale general merchandise, apparel, furnishings, and other retail offerings, notably along Park Avenue (Lafayette to Monroe Boulevard and Neptune to Pacific Boulevard), Long Beach residents seek out Long Island’s malls for most of these types of purchases. Residents spending money outside the City’s local market represents a half billion dollars in loss of potential retail expenditure that could be captured by developing regional commercial draws in the City’s downtown and neighborhood-level goods and services, food and beverage, general merchandise, apparel, and furnishings.1
At the street level, public realm factors that influence the resident and customer experience in commercial districts include sidewalks, street trees/benches, lighting, wayfinding/signage, and roadbeds/ crosswalks. In the private realm, these factors include: the conditions of privately-owned properties, windows, outdoor display/dining, signage, awnings, façades, and building lighting. Streetscaping is essential to shaping the community’s identity and, therefore, has been a key component of the City’s overall economic development strategy. The City’s Complete Streets policies have garnered significant funding for the planning, construction, operation, and
maintenance of community streets that accommodate all anticipated users, including people walking, bicycling, taking public transportation, and driving cars and commercial vehicles. When evaluated and improved through coordinated efforts, a healthy and sustainable business district results.
Goals, strategies, and actions that promote thriving places and a robust economy have been developed from community input and consideration of Long Beach’s history, previous economic data collection efforts and development initiatives, changing demographics and socioeconomic statistics, an inventory of businesses, and other factors that affect Long Beach’s economy (see Appendix D).
The Commercial District Strategy can be found in Appendix E.
1 See Appendix E for Commercial District Strategy, Streetsense.
Question 19: How do you feel about the following statements about Long Beach’s Central Business District (Park Avenue)?
f There is a good mix of shops, restaurants, offices, and amenities
—
Agree: 66.88%
Neutral: 19.30%
Disagree: 13.82%
f It is thriving
Agree: 38.13%
Neutral: 42.99%
—
Disagree: 18.88%
f It is visually attractive
Agree: 24.88%
Neutral: 35.30%
Disagree: 39.81%
Question 27: What types of businesses would you like to see more of in Long Beach?
Neighborhood Goods/Services: 31.06%
Food & Beverage: 17.16%
General Merchandise, Apparel, Soft Goods, Furnishing, etc.: 37.10%
Question 24: Please select whether you agree or disagree with the following statements regarding economic development.
f Long Beach has a good blend or residential, commercial, and industrial uses
—
Agree: 54.74%
Neutral: 29.92%
Disagree: 15.34%
f Long Beach should grow its tax base through additional commercial development
Agree: 48.44%
Neutral: 24.22%
—
Disagree: 27.35%
f Business Districts should be a central focus of development
—
Agree: 61.51%
Neutral: 27.70%
Disagree: 10.79%
f Long Beach should develop vacant parcels along the Bayfront
Agree: 60.68%
Neutral: 19.28%
Disagree: 20.04%
Goal 2.1: Enhance the physical attributes of all commercial districts and areas.
f Strategy 2.1.1: Implement streetscape improvements in all districts to improve pedestrian and vehicle connections, circulation, and safety; create a consistent design aesthetic; and design safe open spaces that reflect the unique community character of each district. Priority areas for streetscape improvements are along Park Avenue and Beech Street with an emphasis on lighting, street trees, benches, trash bins, bicycle racks, and wayfinding signage that helps orient visitors to routes that connect to and from nearby bicycle routes and destinations.
f Strategy 2.1.2: Encourage business owners to pursue façade improvement grants.
f Strategy 2.1.3: Develop design guidelines for façades, signage, and streetscapes to preserve, protect and enhance the visual environment.
f Strategy 2.1.4: Consider creating one or more business improvement districts (BIDs) in partnership with Long Beach’s businesses. The BIDs would facilitate implementing signage, lighting, street furniture, trash bins, bicycle racks, other pedestrian scale amenities, and develop programming help to activate street life.
Goal 2.2: Improve the connectivity and safe passage to, from and between commercial districts.
f Strategy 2.2.1: Improve pedestrian crossings within the core downtown commercial area with pedestrian refuges and updated crosswalks and request that Nassau County consider longer crosswalk timing.
f Strategy 2.2.2: Connect the West End and Boardwalk bicycle networks with each other and with Park Avenue and develop connections with bicycle facilities in surrounding communities.
f Strategy 2.2.3: Retain a consultant to design and install a comprehensive, Citywide wayfinding signage that would direct visitors to public parking facilities, commercial districts, and points of significant interest.
Goal 2.3: Cultivate a truly year-round City economy.
f Strategy 2.3.1: Enhance business and district marketing support and opportunities.
f Strategy 2.3.2: Explore the possibility of creating a business incubator that would help jump-start new businesses.
f Strategy 2.3.3: Continue to offer training for business startups and expansion, with a specific emphasis on minority, veteran, and women-owned businesses.
f Strategy 2.3.4: Create a “Welcome to the City of Long Beach” visitors committee, composed of residents and business owners that would collaborate with the Nassau County Chamber of Commerce and neighboring communities to cross-promote existing visitor opportunities, and support existing and new businesses.
f Strategy 2.3.5: Continue to promote and augment the City of Long Beach business directory and visitor website.
f Strategy 2.3.6: Enhance the City’s identity/ branding through marketing and redesigned physical gateways.
f Strategy 2.3.7: Facilitate the development of a variety of recreational uses to attract a year-round visitor population.
f Strategy 2.3.8: Implement wayfinding signage along the Boardwalk and Ocean View to direct visitors to the commercial districts along Park Avenue and Beech Street.
f Strategy 2.3.9: Promote the City’s history, cultural resources, recreation opportunities, and artisan communities.
f Strategy 2.3.10: Update the City’s Zoning Code to align with City priorities for economic development, including:
— Facilitating appropriate home-based businesses (by special permit).
— Continuing and expanding outdoor dining opportunities.
Exploring a mix of uses within diverse building types.
Goal 2.4: Develop Park Avenue as a true “Transit Oriented Downtown” for the City of Long Beach.
f Strategy 2.4.1: Encourage private sector development of family-friendly entertainment activities and establish alliances with cultural/ art institutions to increase local amenities and provide destinations for residents and visitors to downtown Long Beach.
f Strategy 2.4.2: Actively pursue redevelopment of opportunity sites, including City Hall and its parking and plaza areas, and the Stop and Shop Shopping Center.
f Strategy 2.4.3: Conduct a TOD study and prepare a Special Area Plan for the area around the LIRR multimodal station.
f Strategy 2.4.4: Consider a mixed-use zoning district(s) on Park Avenue that diversifies tenant mix through growth created by residential demand.
f Strategy 2.4.5: Implement Transportation Demand Management strategies including creating a parking district to improve and facilitate access to the City’s commercial/retail corridors.
f Strategy 2.4.6: Review and amend the City’s Zoning Code to:
— Modernize off-street parking requirements with a focus on reducing commercial parking requirements within the proposed TOD and replacing the parking waiver/variance process with a fund that would act as a repository for fees collected from businesses in lieu of providing required off-street parking. These fees would fund other alternative transportation improvements.
— Revisit on-street parking requirements and layout.
Explore opportunities to continue outdoor dining.
f Strategy 2.4.7: Improve pedestrian access to parking lots on the North side of Park Avenue.
Goal 2.5: Develop the Bayfront with a mix of uses that provide public access to and capitalize on the waterfront location and respect its industrial character and proximity to primarily residential neighborhoods.
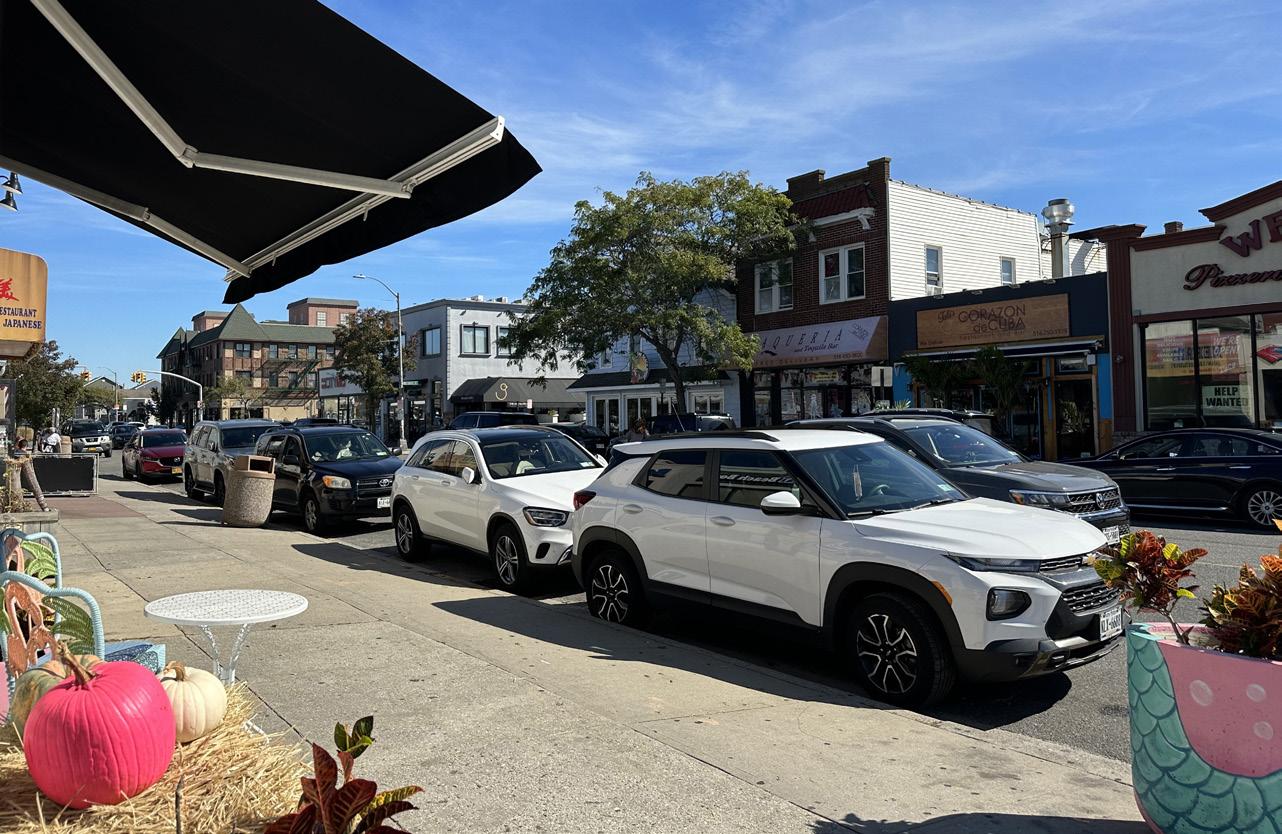
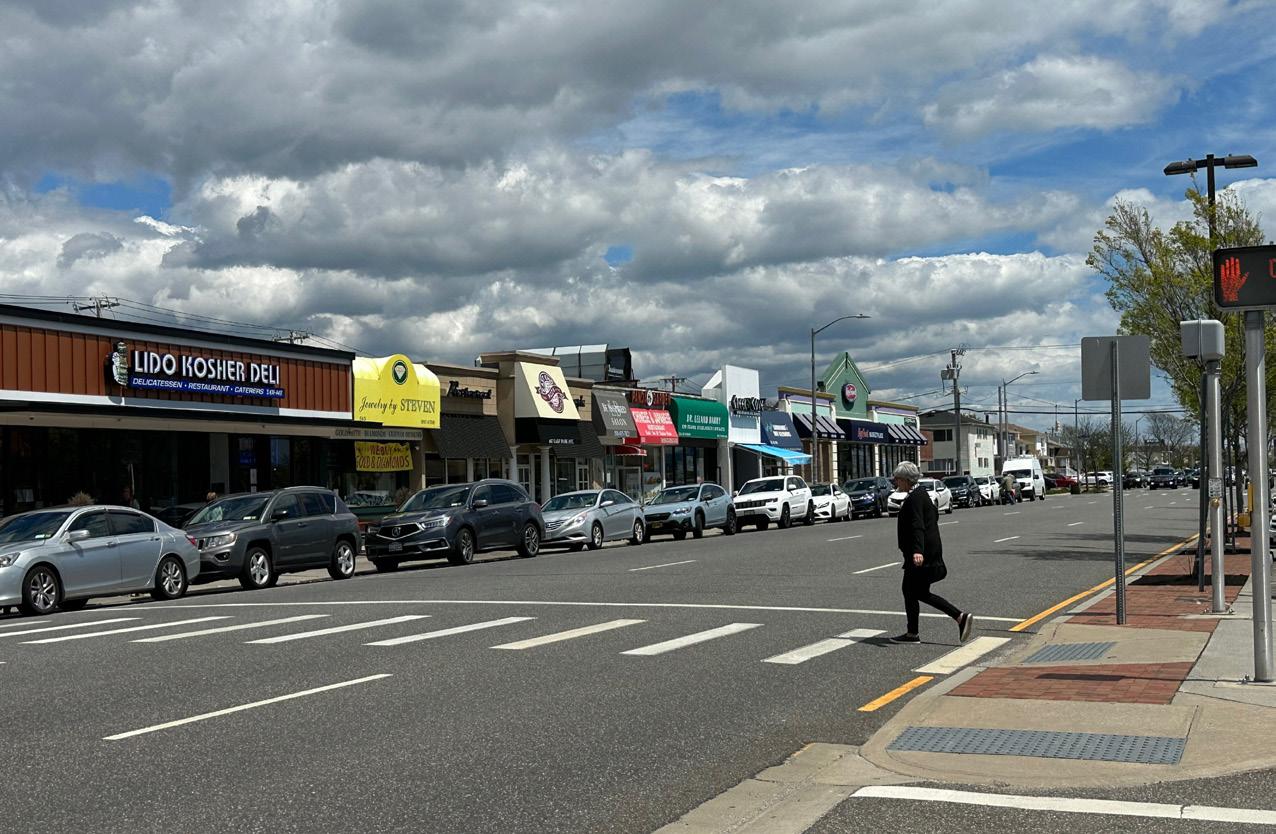
f Strategy 2.5.1: Investigate the potential to redevelop City-owned property with a mix of uses.

f Strategy 2.5.2: Improve direct access between North Park and the Bayfront.
f Strategy 2.5.3: Promote water-oriented and water-dependent uses (fishing pier, marina) made possible by the Nassau County/Long Beach Sewerage Treatment Plant Consolidation and Bay cleanup to be accomplished in partnership with Nassau County.
f Review and revise the City’s Zoning Code.
f Prepare a Citywide streetscape plan and design guidelines for commercial/retail zones that can be implemented in phases when funding becomes available.
f Consider creating one or more Business Improvement Districts (BID) to manage, advocate, and raise funds for commercial/retail neighborhoods.
f Draft and issue a request for qualifications (RFQ) for the redevelopment of City Hall to solicit input from the development community regarding the highest and best use of this property.
f Conduct a TOD study and prepare a Special Area Plan for the area around the LIRR station.
f Create mixed-use zoning districts or zoning district overlays.
f Continue pursuit of grants for and implementation of streetscape improvements and active mobility improvements.
f Develop the Central Business District into a “true” downtown with mixed-use zoning and more parking.
f Develop the Bayfront with uses that capitalize on and provide public access to the waterfront.
The City of Long Beach is on a long and narrow barrier island. Due to its unique geography, vehicular and public transportation access to Long Beach is limited to three bridges, the Long Island Rail Road (LIRR), which connects Long Beach to the New York City metropolitan area, and the Amtrak New England rail system. Access to the City is also available via water. Long Beach’s road system consists of one County arterial: Long Beach Boulevard; one City-owned principal arterial: Park Avenue (East Park Avenue is under County control); and several collector roads that feed into the arterials. Pedestrian and bicycle facilities within the City of Long Beach are an important component to the City’s mobility and connectivity, though connections to adjacent municipalities are currently limited (see Figure 3-30, Bicycle Network, in Chapter 3). Management of the City’s traffic and transportation facilities fall under the jurisdiction of local, County, and State departments, including: City of Long Beach and Nassau County Departments of Public Works; the New York State Department of Transportation; City of Long Beach, Nassau County and New York State
Police Departments, and the Nassau County Public Safety Commission. Cooperative involvement by and between these departments and commissions will be essential to the successful implementation of mobility and transportation strategies proposed in this Comprehensive Plan.
Goals and objectives related to transportation and mobility were developed by evaluating the City’s existing transportation infrastructure and systems in the context of community input (see Appendix D). Residents expressed concern about roadway and infrastructure maintenance, traffic operations, congestion, and the lack of on-street parking in areas where demand is high, especially in the downtown commercial areas. Residents support providing
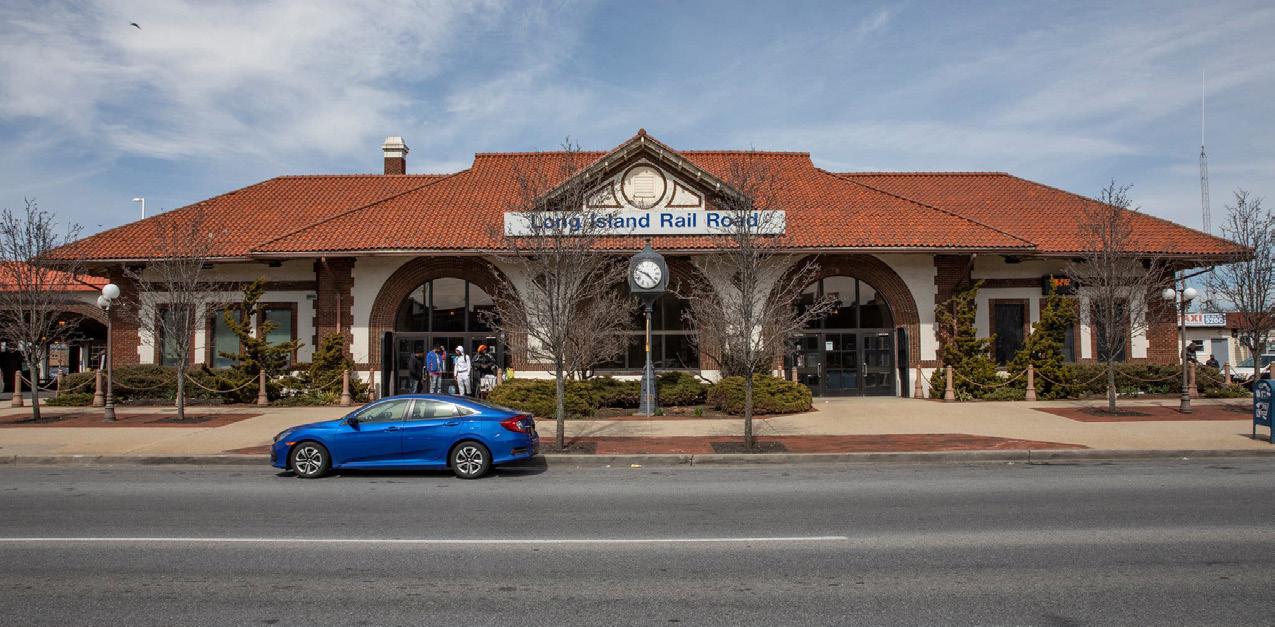
infrastructure for bicyclists and pedestrians where space and demand are present. The City has been successful in planning, obtaining grants for and implementing Complete Streets in targeted areas. The City of Long Beach has pursued and will continue to proactively pursue and implement safety improvements via the adopted City’s Complete Streets Policy. The design and implementation of Complete Streets projects will continue to create a connected network.
The Comprehensive Plan recommends augmenting existing transportation infrastructure, continuing the design and implementation of Complete Streets and traffic calming measures to improve roadway safety for all users.
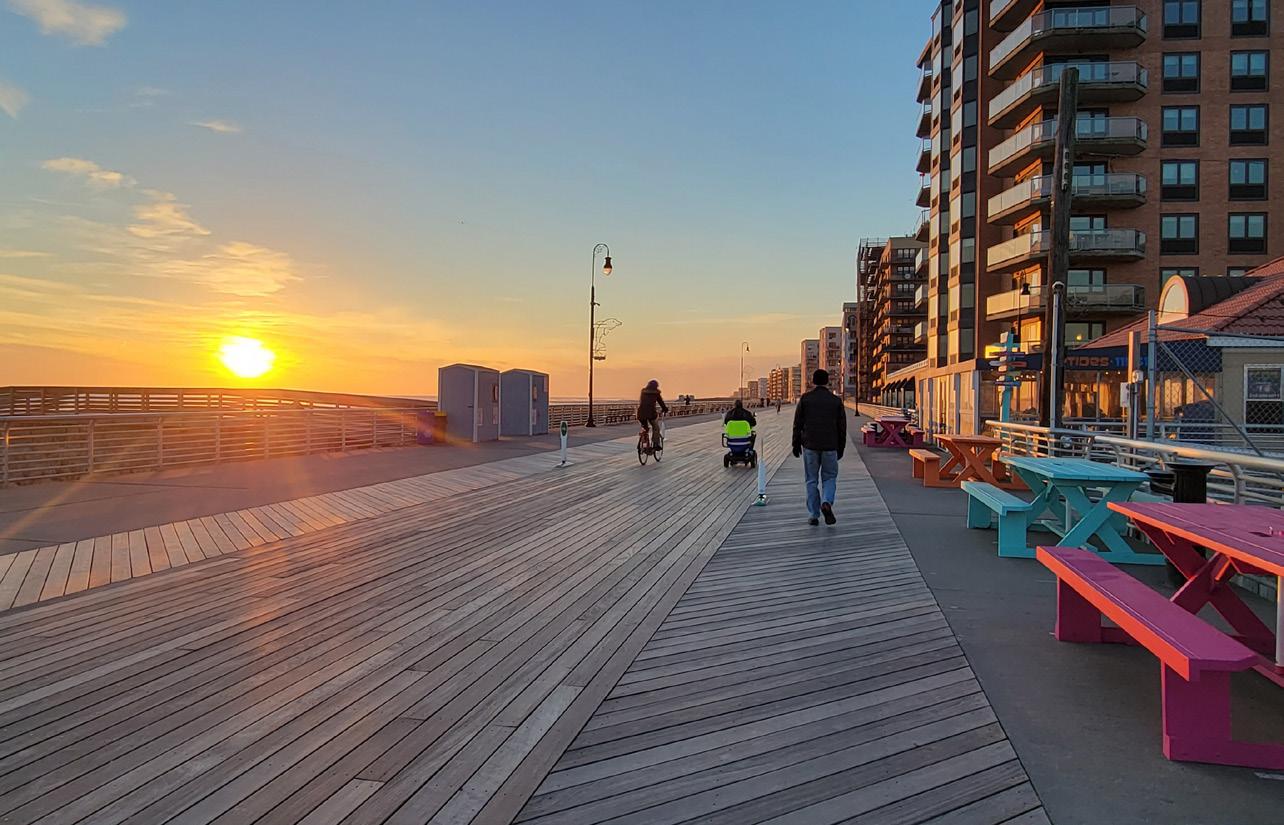
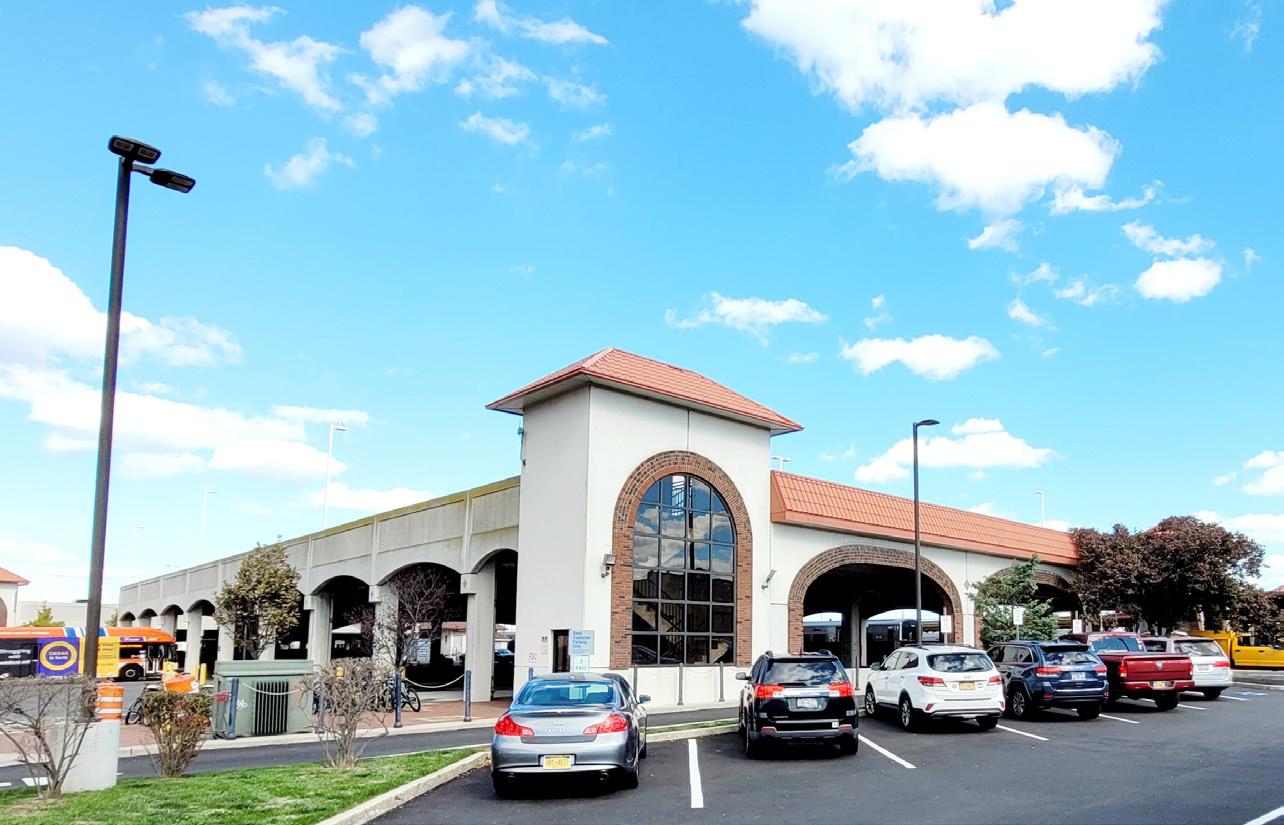
Question 34: What change would you do the most to create the city you want in the future?
f The highest response was: 40.87% of respondents said “improved roadways, drainage, utilities, and other infrastructure”
f Written-in answers included parking, appearance and aesthetic, and climate change initiatives
Question 22: If you do work, what is your primary travel mode to work?
f Drive Alone: 59.00%
f Carpool/Vanpool: 1.37%
f Long Island Rail Road (LIRR): 17.88%
f NICE Bus: 0.68%
f Long Island Bus System: 0.34%
f Bicycle: 2.51%
f Walk: 3.30%
f Work from Home: 14.46%
f Hired Service (taxi, Uber, etc.): 0.46%
Question 30: What improvements to Long Beach’s transportation system are most important?
f Ranked Responses from highest to lowest
— Improving & managing parking throughout City Improving & expanding the bicycle network & bike safety Reducing traffic congestion
— Making it safer & easier to walk around (sidewalks and streetscapes)
— Improving public transportation throughout Long Beach (including the West End, Recreation Center, LIRR Station, Beach/Boardwalk, and East End)
— Planning for new technologies (EV charging stations, rideshare drop off zones)
Goal 3.1: Improve transportation and mobility opportunities for better flow of traffic and people.
f Strategy 3.1.1: Review and amend off-street parking requirements in the City’s Zoning Code to consider shared parking arrangements, reduce required off-street parking for certain land uses.
f Strategy 3.1.2: Create an active multimodal transportation system, including environmentally friendly electric and biofuel vehicles for use by residents, city staff, and officials.
f Strategy 3.1.3: Collaborate with Nassau County to identify locations for the installation of state-ofthe art traffic signal technology that would improve east-west connectivity, especially along major roads and corridors (e.g., Park Avenue and Long Beach Boulevard). Innovative technologies could include Adaptive Traffic Control Systems (ATCS) that consist of hardware and software installed at each traffic signal (and possibly at centralized command center).1
1 Where ATCS has been installed, roadway traffic congestion has improved in both the peak hour and off-peak periods, resulting in improved traffic operating conditions and improved air quality. ATCS would improve operations for all roadway users (vehicular, buses, bicycles, and pedestrians). The City may consider hiring a consultant to examine the positive impact ATCS would have on the selected
ADAPTIVE TRAFFIC CONTROL SYSTEMS (ATCS): A traffic management strategy tool in which traffic signal timing changes and adapts based on actual traffic demand.
MULTIMODAL TRANSPORTATION: The efficient movement of people and goods on roadways that are designed for all users: motorists, pedestrians, bicyclists, seniors, people with disabilities, transit, and freight carriers. Providing safe and efficient opportunities for all multimodal users on the roadways and various transportation facilities is also a key component of Complete Streets.
f Strategy 3.1.4: Identify locations for and install Electric Vehicle charging stations and additional bicycle racks.
f Strategy 3.1.5: Identify suitable locations for roadway improvements that could facilitate the use of non-motorized, eco-friendly transportation options (e.g., human-powered (non-electric) skateboards, scooters, and bicycles) and, where appropriate, motorized eco-friendly transportation (e.g., e-bikes,2 motorized skateboards and scooters).
roadways and how the ATCS improvements could allow for effective and low cost multimodal/Complete Street projects.
2 The use of e-bikes would be required to comply with New York State laws, including age requirements (the rider must be over the age of 16), and use (restricted to bike lanes and/or on roads where speed limits do not exceed 30 miles per hour).
f Strategy 3.1.6: Consider hiring a consultant to evaluate existing and, where appropriate, propose new bus routes that better meet resident and commuter needs. The Study would also evaluate the feasibility of a City-sponsored shuttle between the LIRR station and the Beach/Boardwalk.
f Strategy 3.1.7: Consider connecting access/ egress between selected residential properties, where appropriate, to minimize adjacent driveways/curb cuts.
f Strategy 3.1.8: Consider replacing the parking waiver/variance process with a fund that would act as a repository for fees collected from businesses in lieu of providing required off-street parking. These fees would fund other alternative transportation improvements.
f Strategy 3.1.9: Where appropriate, including in areas proposed for Transit Oriented Development (TOD), amend the City’s Zoning Code to promote a mix of uses, including uses that are less cardependent that would reduce traffic congestion and increase walking and biking.
f Strategy 3.1.10: Evaluate locations where access and connectivity improvements are necessary for paratransit, bicycle, and pedestrian connectivity,
especially for seniors and people with different abilities (e.g., sidewalks, pedestrian ramps, and the Boardwalk).
Goal 3.2: Create safer multimodal transportation conditions for drivers, pedestrians, and bicyclists (see Figure 4-1, Bike Connectivity).
f Strategy 3.2.1: Continue to obtain grants to implement Complete Streets and streetscape projects.
f Strategy 3.2.2: Work with Nassau County to design and implement traffic signal system upgrades that provide signal control and safe conditions for multimodal roadway users.
f Strategy 3.2.3: Coordinate with Nassau County to connect the traffic signal system and security cameras to a central command center (City of Long Beach or Nassau County Department of
ACTIVE TRANSPORTATION: Human-powered mobility options that reduce motor vehicle usage and emissions by increasing the use of public transit, non-motorized, and motorized eco-friendly transportation.
Public Works) for traffic congestion monitoring and emergency incident response.
f Strategy 3.2.4: Prioritize planning for and implementation of micro-mobility, short-term trips.
f Strategy 3.2.5: Coordinate with the City of Long Beach and the Nassau County Department of Emergency Services to evaluate the need and
locations for signal pre-emption devices. Preemption devices create a “green wave” by turning traffic signals green as emergency vehicles (equipped with the detection devices) approach an intersection. The installation of pre-emption devices at selected traffic signals would decrease emergency response time and improve safety for all roadway users during emergency events.

Goal 3.3: Improve on and off-street parking conditions.
f Strategy 3.3.1: Consider hiring a parking consultant to expand upon parking studies at a Citywide level with a focus on each neighborhood’s unique issues. Possible scope items could include evaluating the City’s parking requirements to allow smart parking solutions that would improve user experience, including:
— A parking app and centralized pay stations. Signage for on- and off-street parking facilities that would display the number of available parking spaces, thereby reducing the need for motorists to circle the area to find an available parking space
Shared parking arrangements that serve the City’s oceanfront.
f Strategy 3.3.2: Continue to improve and publicize public transportation connections to help reduce parking demand.
f Strategy 3.3.3: Consider revising off-street parking requirements for commercial uses in the proposed TOD district and replace the on-street parking waiver with a fee that would fund alternative transportation improvements.
f Strategy 3.3.4: Consider utilizing a portion of parking revenue to improve parking conditions and infrastructure in areas where the City has identified a need for improvements.
Goal 3.4: Continue to maintain and improve the City’s roadway infrastructure.
f Strategy 3.4.1: Continue to seek funds and grants to ensure the City’s roadways are regularly maintained and repaired quickly when the need arises.
SMART PARKING SOLUTIONS: Strategies that employ technology to increase parking efficiency and improve the user experience.
f Strategy 3.4.2: Implement streetscape improvements that would improve pedestrian and vehicle connections, circulation, and safety and create a consistent design aesthetic. Streetscape design could include lighting, street trees, benches, trash bins, bicycle racks, and wayfinding signage that would direct visitors to routes that
2.2 spots per 1000 SF of retail
1.8 spots per 1000 SF of retail

2.7 spots per 1000 SF of retail (including LIRR parking)
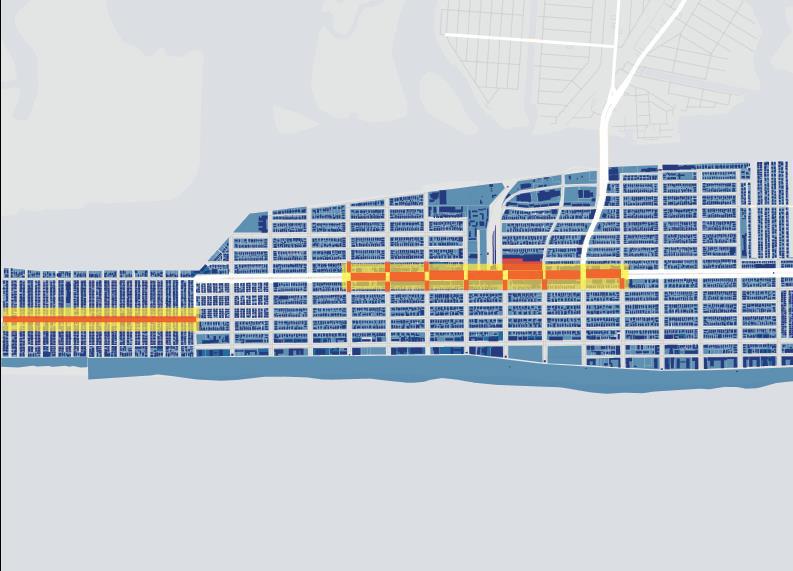


Streets Plan, including augmenting pedestrian and bicycle infrastructure and crosswalks along Park Avenue, could reduce the need for commercial parking. The City can also coordinate with Nassau County to design and implement traffic signal system upgrades that would address the current challenges to pedestrians crossing Park Avenue—identified as an impediment to using the LIRR parking structure. Investments in improving the underutilized Long Beach Bus system can further facilitate a decrease of automobile use, especially for visitors arriving via train.
f Strategy 3.5.3: Consider connecting access/ egress via shared driveways to reduce curb cuts between selected residential properties in the West End neighborhood, where appropriate.
Goal 3.6: Minimize the intrusion of non-residential traffic into the residential neighborhoods.
f Strategy 3.6.1: Limit commercial and other nonresidential destined traffic from local roads by installing “delivery only,” “truck route,” and “no trucks” signage in strategic locations.
Goal 3.5: Address on- and off-street parking requirements at the beachfront, commercial areas and within residential neighborhoods.
f Strategy 3.5.1: Consider hiring a consultant to evaluate parking supply and demand and identify options and locations for parking solutions in the West End neighborhood.
f Strategy 3.5.2: Consider developing a residential parking permit program in the West End neighborhood.
f Strategy 3.6.2: Continue to implement Complete Streets projects within selected areas of the City to reduce cut-through traffic.
f Strategy 3.6.3: Improve aesthetics along major roads and gateways to residential areas by installing measures that could include curb extensions, landscape buffers, planters, splitter islands, lighting, public art, bike parking, seating, and more.
Goal 3.7: Improve public bus service/routing between transportation and commercial hubs and residential neighborhoods.
f Strategy 3.7.1: Hire a consultant to evaluate existing bus service and routing, and recommend measures to improve intra-City travel, particularly between transportation and commercial hubs and residential neighborhoods.
f Strategy 3.7.2: Design and install modern bus shelters that respect the character of the neighborhoods in which they are located and improve the user experience. Shelter designs can accommodate community public service announcements and advertisements that can generate revenue used to support transportation projects.
Goal 3.8: Improve the overall user experience along Park Avenue.
f Strategy 3.8.1: Evaluate the cost and feasibility of installing traffic calming measures, including roadway striping. Temporary traffic calming measures (e.g., utilizing cones, planter boxes) can be installed to test their effectiveness prior to the installation of a permanent measures.
f Strategy 3.8.2: Continue to study and evaluate the feasibility of installing dedicated bicycle lanes.
f Strategy 3.8.3: Install additional bicycle facilities (e.g., outdoor/protected bicycle storage and repair kiosks).
f Strategy 3.8.4: Continue to study and evaluate improvements to the pedestrian experience by creating pedestrian-only rights-of-way and crosswalks.
f Strategy 3.8.5: Consider reducing the size of the median where appropriate to install angled parking.
TRAFFIC/STREET CALMING: Employing physical design measures that improve safety for motorists, pedestrians. and cyclists.
f Continue to pursue State and Federal funding for transportation project implementation, including Complete Streets.
f Coordinate with the Nassau County Department of Public Works, Traffic Engineering Unit, to develop and implement a Citywide traffic signal operations plan, with first phase roll-out along Park Avenue, Broadway, Beech Street, and Long Beach Boulevard.
f Seek funding for the design and implementation of a Neighborhood Traffic Management Plan.
f Seek funding for the design and implementation of a Parking Management Plan that would explore construction of additional garages to free up curb space for the installation of bus lanes, bicycle lanes, more efficient curbside parking, and green infrastructure best management practices (permeable pavers, landscaping, rain gardens, and bioswales).
f Study Transportation Demand Management strategies including creating a parking district to manage parking behavior and patterns and facilitate access to the City’s commercial/retail corridors.
f Evaluate and install, where appropriate, signage to limit heavy trucks from residential streets.
f Improve connections for bicycles between the Boardwalk, Park Avenue, and the West End.
As evidenced by the long and winding road of rebuilding that followed Superstorm Sandy, there is no more important component of sustainability than reducing the risk of damage caused by storms to the City’s physical infrastructure, ecosystem, and population. Municipal health is measured by its preparedness and fortification against extreme weather events. The City has completed much work assessing its vulnerability to extreme weather and climate change, prioritized solutions, identified opportunity sites, and implemented many projects and policy changes to achieve the City’s resilience goals. Frequently, the biggest obstacle in the way of realizing these goals is funding. The City’s consistent and persistent pursuit of funding (over $200 million) to harden its infrastructure and protect its neighborhoods has resulted in a stronger community. Representative projects include structure and utilities elevation; Complete Streets, which help reduce greenhouse gas emissions and thereby climate change impacts; drainage improvement; bulkhead repair, replacement, and new construction; tide flex valve replacement; dune reconstruction; ongoing flood
protection efforts tied to the New York Rising program and Federal Emergency Management Agency (FEMA) funds, and the reconstruction of the boardwalk. Since Superstorm Sandy, the City has prioritized municipal health and sustainability and reducing risk. Engaging with its residents and business owners in a partnership to make improvements to private land will continue to move the City toward a more resilient future.
The City of Long Beach Floodplain Management Plan (FMP), published in February 2020, is intended to support the City’s needs, and meet New York State and Federal planning requirements that allow the City to remain in the Community Rating System (CRS) program, by earning credit under Activity 510. Long
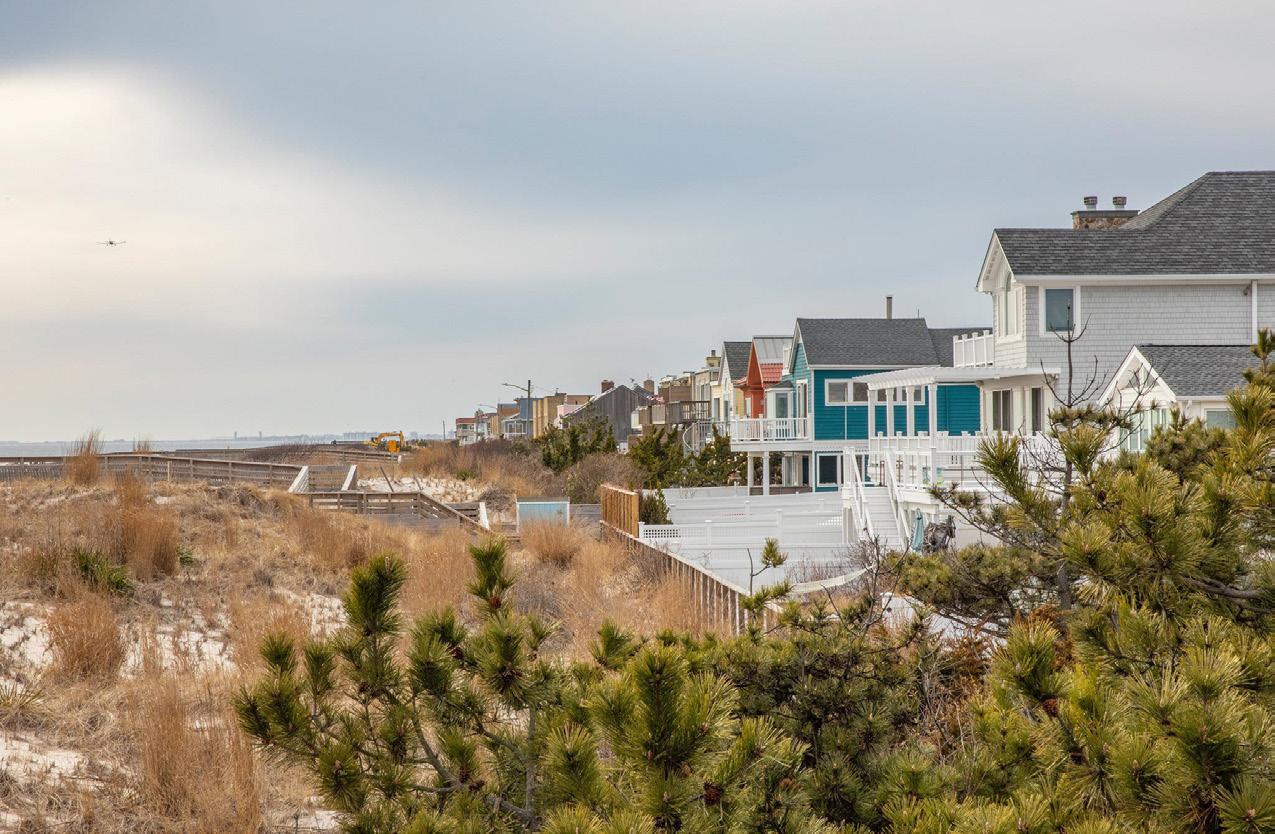
Beach currently holds a Class 7 CRS Rating. The City’s FMP also considered coordination of existing plans and programs for high-priority initiatives and projects to mitigate possible disaster impacts. The FMP links with established City and Nassau County plans to ensure they can work together in achieving hazard mitigation.
The City’s participation in the National Flood Insurance Program (NFIP) CRS has, to date, secured a 15 percent discount1 on flood insurance premiums for City of Long Beach residents. By implementing physical, educational, and policy measures that reduce the risk of damage due to flooding, Long Beach not only becomes stronger and more resilient, but also allows residents and business owners to benefit from additional discounts in flood insurance premiums. The City is actively looking for opportunities to improve its CRS Class rating and further reduce insurance premiums, including providing clear information to new residents (owners and renters) regarding the risk to existing structures, and the areas of the City that have been subject to repetitive loss due to flood damage.
The City of Long Beach is a certified Bronze Climate Smart Community as a part of New York’s Climate Smart Communities program. This reflects efforts by
1 In 2022, the City’s CRS rating is “7,” accounting for the 15 percent discount.
the City to reduce greenhouse gas (GHG) emissions, including actively building a GHG inventory; upgrading infrastructure like streetlights to more efficient LED technology, a fast track system for residential solar applications and investigating rooftop solar on government buildings. The City will continue to evaluate private development applications for alternatives energy sources, (i.e., solar, geothermal, on- and off-shore wind) to balance their environmental, economic, and quality of life impacts on the city and its resident. A full Climate Smart Communities Certification Report for Long Beach has been prepared and is available on the City’s website.
Question 32: What is the most important action needed to preserve Long Beach’s environment and protect the City from future storms?
f Prevent flooding due to sea level rise, storm surges, and daily flooding events: 38.48%
f Improve the city’s infrastructure (roads, bulkheads, public water, sewer, etc.): 28.43%
f Improve water quality: 11.48%
f Protect drinking water sources (Lloyd aquifer): 7.92%
f Transition to renewable energy & reduce the City’s carbon foot: 4.77%
f Encourage homeowners to adopt green infrastructure (rain gardens, rain barrels, porous pavement, etc.): 2.34%
f Other: 6.19%
Goal 4.1: Continue efforts to enhance and protect the City’s natural environment.
f Strategy 4.1.1: Continue to evaluate the City’s critical infrastructure in the context of sea level rise.
f Strategy 4.1.2: Consider measures to fully integrate climate resilience and sustainability responsibilities and oversight into the City’s regulatory process through a collaborative effort between City staff and grant managers/ consultants.
f Strategy 4.1.3: Evaluate new tools and funding sources for storm water management.
f Strategy 4.1.4: Identify additional opportunities to increase permeability with policy changes, green infrastructure improvements, including greenspaces such as rain gardens, infiltration basins, tree plantings, and green roofs.
f Strategy 4.1.5: Ensure that new development in areas of repetitive flooding meet resilience requirements, including those set forth in the City’s
Zoning Code and the New York State Building Code.
f Strategy 4.1.6: Continue implementing the 2015 Tree Replanting Plan, and consider preparing an updated plan.
f Strategy 4.1.7: Continue to work with the State, County, and neighboring communities to enhance water conservation efforts and protect the Lloyd aquifer.
f Strategy 4.1.8: Continue to coordinate with interested groups to educate residents and business owners regarding the importance of water conservation in protecting the Lloyd aquifer water supply.
f Strategy 4.1.9: Continue the City’s effort to remediate (in accordance with all applicable State and Federal regulations), identify possible redevelopment opportunities for Brownfield Opportunity Areas (BOA) and keep abreast of the ongoing cleanup at state superfund sites under private ownership.
f Strategy 4.1.10: Continue to identify open spaces that can serve as recreation areas, aid in storm water management and create additional environmental and community benefits.
Goal 4.2: Protect the City’s built environment from the effects of Climate Change.
f Strategy 4.2.1: Encourage the use of green building technology and resilient design guidelines for new development projects and retrofits by offering incentives (including streamlined approvals).
f Strategy 4.2.2: Continue to storm harden City infrastructure using standard practices and nature-based solutions,2 to afford protection from extreme weather-driven impacts.
f Strategy 4.2.3: Update the City’s Zoning Code to codify resilience measures, especially in areas of repetitive flooding, including:
— Reviewing building regulations to ensure the latest guidance on building design and construction in areas of flooding is incorporated into the Zoning Code.
Limiting the area of impervious coverage for new and reconstructed buildings to just the building footprint.
— Reducing required parking for non-residential uses.
Requiring green roofs, rain gardens, rainwater harvesting, and/or planter boxes.
— Encouraging tree planting to establish/ re-establish an urban tree canopy.
Retaining and processing storm water on project sites.
— Incentivizing property owners to reduce impervious surfaces through removal of parking, driveways, and walkways or replacement with pervious pavement/pavers.
Removing or relocating nonconforming accessory structures.
— Ensuring new buildings are constructed to withstand or adapt to flood events.
f Strategy 4.2.4: Continue to find opportunities to enhance drainage systems throughout the City but especially in the areas with the lowest elevations.
2 “Nature-Based Solutions.” FEMA.gov. Accessed August 25, 2022.
Goal 4.3: Support residents and business owners in coping with Climate Change impacts.
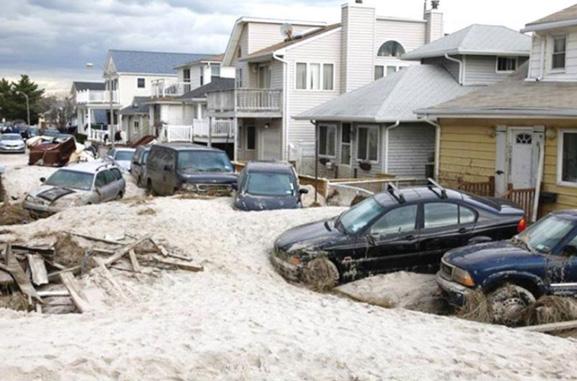
f Strategy 4.3.1: Continue to implement measures to maintain and possibly improve the City’s CRS rating, thereby achieving additional flood insurance premium discounts for City of Long Beach residents.
f Strategy 4.3.2: Create marketing and educational campaigns to inform residents and business owners of inherent hazard risks and opportunities/ mitigation strategies to offset those risks.
f Strategy 4.3.3: Continue to coordinate with local community organizations and institutions to support residents and businesses in preparing for extreme weather events and the effects of heat islands, especially as the West End has been shown (on the U.S. Geological Survey map) to be a prominent heat island in Nassau County.
f Strategy 4.3.4: Continue support of the City’s Office of Emergency Management during extreme weather events (heat, cold, storm), by codifying emergency response plans and coordinating with neighboring communities and responsible agencies.
f Strategy 4.3.5: Continue to pursue programs that assist residents in protecting their homes
from future storms through elevation and other measures.3
f Strategy 4.3.6: Continue to partner with public and private organizations to educate neighborhood and business organizations about the importance of incorporating resilience measures into their properties and day-to-day operations.
f Strategy 4.3.7: Continue to seek grants that support and promote education about effective permeability improvements.
S Damage from Superstorm Sandy in Long Beach’s West End, October 2012 (via NYRCR Long Beach Planning Committee)
3 Creating Resilience: A Planning Initiative, City of Long Beach, NY, Comprehensive Plan Update, 2018
f Consider adopting land use tools and policies like climate resilient zoning ordinances and resilient design guidelines to help prepare the City for the long-term impacts of climate change.
f Identify and document general and project-specific opportunities to implement green building and green infrastructure practices in new construction and retrofits/ renovations for both vertical and horizontal development.
f Work collaboratively with neighborhoods to assess opportunities for nature-based solutions that address coastal hazards.
f Pursue State and Federal funding for green infrastructure and nature-based project implementation.
f Prepare an approach to combat heat islands, including tree and vegetation planting, creating cool roofs, establishing neighborhood cooling centers, distributing education materials on health risks associated with intense heat.
f Continue to install new and update existing storm water management infrastructure.
f Increase coordination between experienced/trained City Office of Emergency Management staff and emergency service providers in emergency preparedness planning.
f Enhance communication and coordination with neighboring municipalities during extreme weather events (heat, cold, storm, etc.) and ensure facilities, and transportation to those facilities, are available short- and long-term for displaced residents.
A sustainable community manages its human, natural, and financial capital to meet current needs and ensures that adequate resources are available for future generations. The components that go into preparing a thoughtful Comprehensive Plan are essentially the same ingredients that create a sustainable community: civic engagement that prioritizes respect for diverse viewpoints, beliefs and values; engaged participation; economic security; respect for the ecological community; and social wellbeing. Creating a diverse and financially viable commercial base and balancing that with the housing, social, and resiliency needs of its residents will ensure a strong and sustainable future for the City of Long Beach.
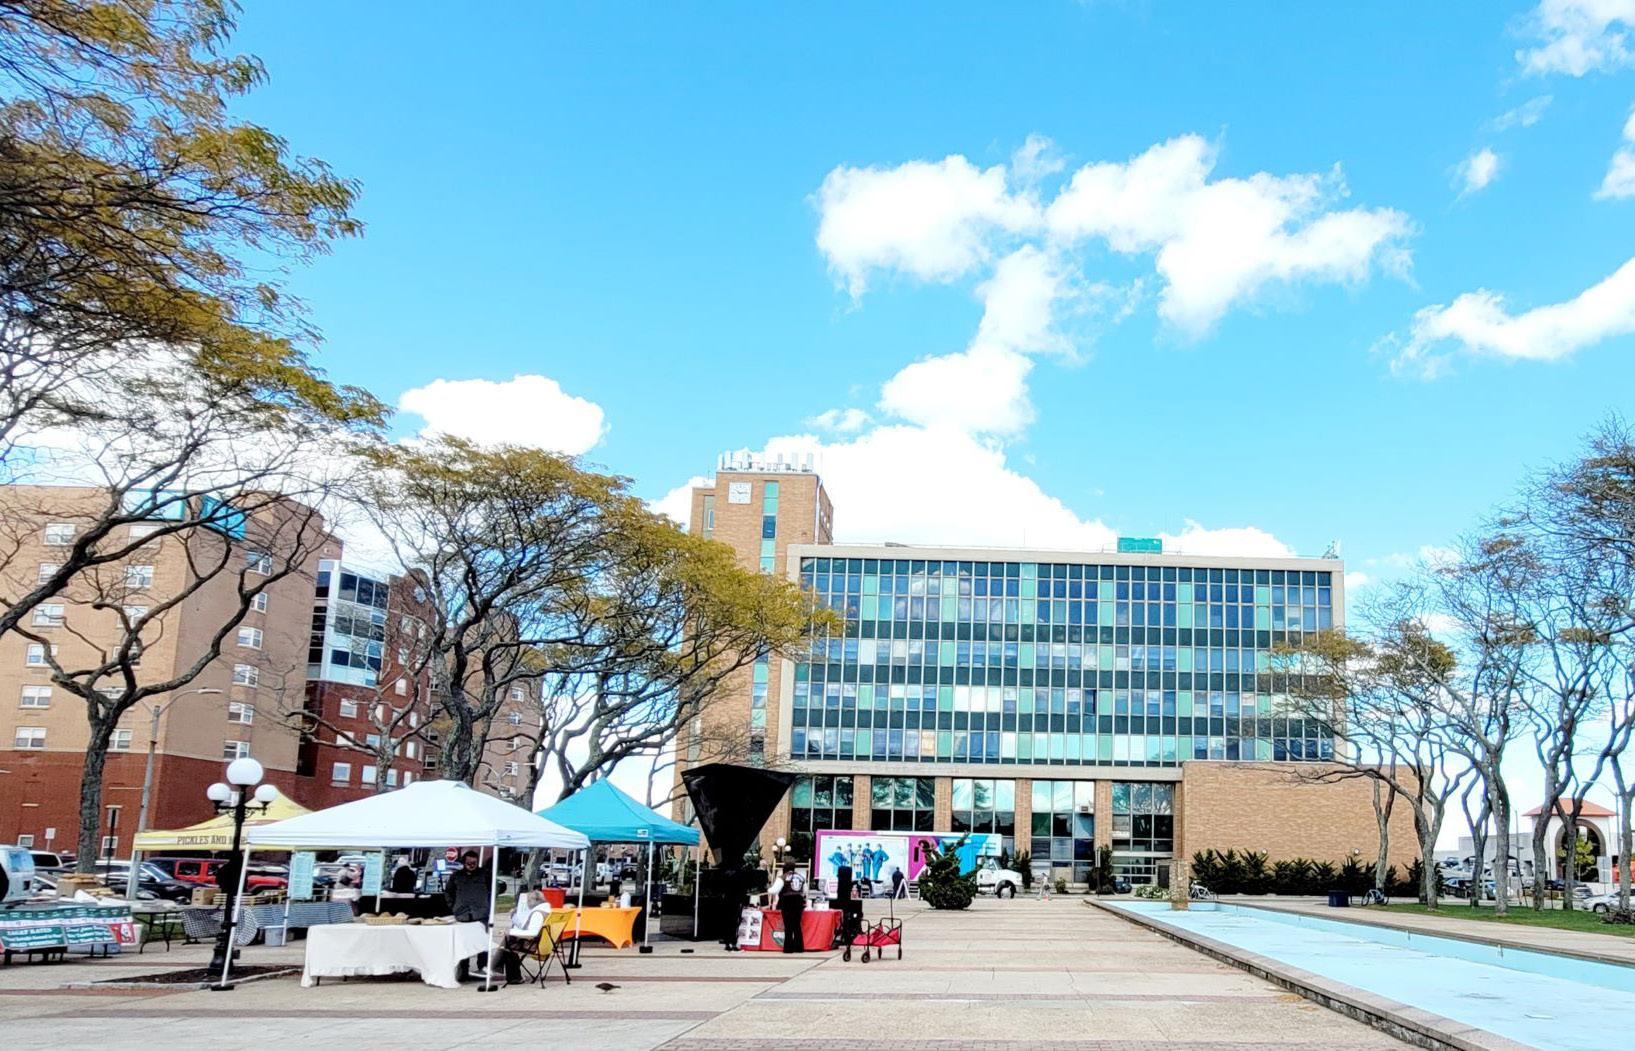
With an eye toward focusing growth in targeted areas, the City has prioritized the revitalization of the Park Avenue Commercial Business District (CBD), the Long Beach Boulevard Innovation District, and the Bayfront neighborhood. Within these areas, the City has identified priority initiatives and opportunity areas that, with careful planning and foresight, will build upon the City’s recent successes to further develop
a year-round economically sustainable regional destination. The City’s investment in safeguarding its infrastructure and capitalizing on development opportunities has demonstrated a commitment that has spurred significant private investment. Since it opened in 2015, the co-working center located on Long Beach Boulevard has doubled in size to include two separate facilities. New office and retail space has been developed on Park Avenue, led by the creation of a brewery in the center of the CBD. Proposed public transit improvements include the Metropolitan Transit Authority’s plans to renovate the Long Island Rail Road (LIRR) Long Beach station in 2023. The City recently implemented Complete Streets projects on Edwards Boulevard and National Boulevard, design
work along the Park Avenue commercial area and will continue to seek funds for and implement projects that address traffic and parking related concerns. The City is currently prioritizing design for traffic calming measures, improved circulation for pedestrians and cyclists and promoting Transit Oriented Development (TOD). These projects and the City’s efforts to concentrate new development in opportunity areas, all further smart growth and equitable development by combining a mix of uses for all user groups and creating a vibrant and sustainable Long Beach community.
Question 26: If you could choose where to see more concentration of business development and activity in Long Beach, where would you like to see it occur?
f Central Business District (Park Ave): 48.95%
f Beach/Boardwalk: 35.09%
f West End: 4.30%
f Other: 11.66%
Bayfront/waterfront
— East End
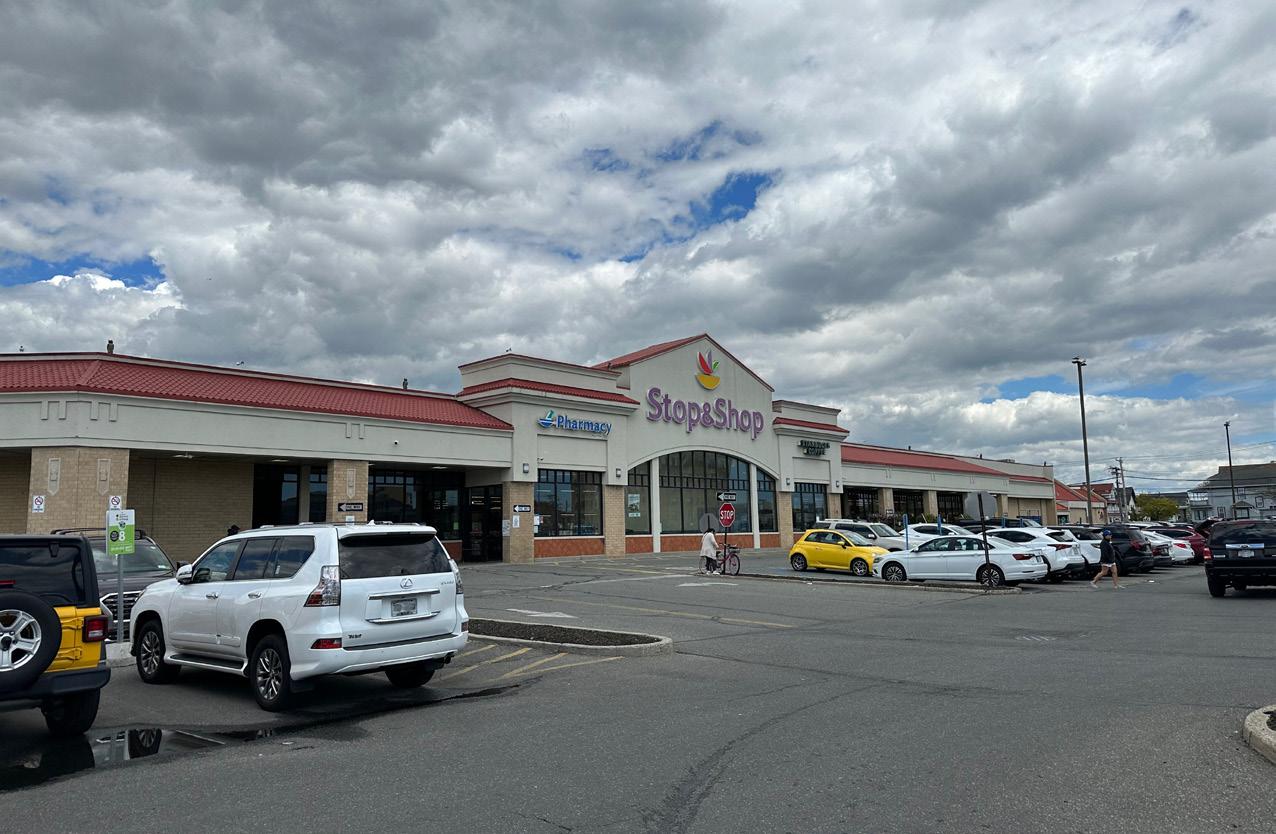
Hospital Area
North Park/Riverside
Nowhere – some participants did not support more development
Goal 5.1: Protect the unique character of the City’s neighborhoods while promoting economic development and encouraging business.
f Strategy 5.1.1: Review and revise the City’s Zoning Code to balance residential and commercial development with resiliency measures that reduce the risk of storm damage to City of Long Beach neighborhoods. Suggested revisions to be considered for the Zoning Code include:
Creating a TOD district in downtown Long Beach that would allow for mixed-use development at/near/adjacent to the LIRR station.
Promoting land uses and landscape design treatments that encourage a smooth transition between adjacent residential and commercial land uses. Creating mixed-use zoning districts in the commercial areas along Park Avenue and the Bayfront that allow a range of commercial and residential uses, in a mix of building types.
— Updating the Zoning Code to codify resilience measures, especially in areas of repetitive flooding.1
Reviewing and amending off-street parking requirements to consider shared parking arrangements, reducing requirements for certain land uses, and other parking demand management initiatives to support retail and commercial development in appropriate locations.
— Facilitating appropriate home-based businesses (by special permit).
— Continuing to expand outdoor dining opportunities.
— Developing zoning to support appropriate development along the Bayfront, while protecting the housing stock in the North Park community and insuring public access to the Bayfront.
Examining expansion of the Innovation District along Long Beach Road.
f Strategy 5.1.2: Ensure that waterfront development projects provide public waterfront access.
1 See Strategy 4.2.3 for specific resilience-related zoning recommendations.
f Strategy 5.1.3: Continue to offer training for business startups and expansion, with a specific emphasis on minority, veteran, and women-owned businesses.
Goal 5.2: Diversify the City’s housing stock to help meet the needs of year-round residents, senior citizens, young families, and local workers, reflecting the challenges created by rising costs for rental and for sale housing.
f Strategy 5.2.1: Prepare a Citywide Housing Plan that examines the housing needs of Long Beach residents, including seniors, young families, those that live/work in the City, and long-term residents wishing to downsize and stay in Long Beach. The Housing Plan would focus on long-term housing affordability in the City and developing incentives for providing affordable housing, such as land trusts.
f Strategy 5.2.2: Explore the development of accessory dwelling units (ADUs) in existing structures that can be renovated into small apartments, in specific neighborhoods, where appropriate.
f Strategy 5.2.3: Work with experienced housing agencies, such as the Long Island Housing
Partnership (LIHP) and Community Development Corporation of Long Island (CDCLI) to expand first-time homebuyer assistance and foreclosure prevention programs. These programs would also explore incorporating advances in energy and cost saving technologies into housing design, construction, operation, and maintenance, particularly for low- and moderate-income households.
f Strategy 5.2.4: Create public-private partnerships (P3) with for-profit and not-for-profit housing developers to increase the availability of affordable housing, using available funding mechanisms.
f Strategy 5.2.5: Explore and employ legal mechanisms (e.g., Community Benefit Agreement) that would require new development projects that meet/exceed established thresholds to provide benefits to the community.
f Strategy 5.2.6: Recommendation that new multiunit developments include a portion of affordable housing.
These strategies promote projects in commercial areas that include residential and non-residential uses, and support a healthy, environmentally sustainable, pedestrian-oriented community while concurrently
reducing auto-dependence and infrastructure costs (including fire and police department, sanitation and garbage collection, ambulances, and construction and maintenance of utilities and roadways).
Goal 5.3: Create mixed-use zoning districts, including Transit Oriented Development (TOD), where appropriate, including potentially at City Hall, the LIRR parking garage, and the Stop and Shop shopping center.
f Strategy 5.3.1: Consider amending the City’s Zoning Code to create a TOD zoning district, or zoning district overlay to facilitate a mix of uses in targeted areas. Mixed-use districts would allow development of residential uses in business districts and enhance community character near the LIRR station and increase walkability.
f Strategy 5.3.2: Conduct a TOD study and prepare a Special Area Plan for the area around the LIRR station.
f Strategy 5.3.3: Adopt “inclusionary” zoning that would require new residential development with five or more units to provide some percent of new housing units as affordable (minimum 10 percent).
f Strategy 5.3.4: Explore expansion of park, open space, and recreation facilities and programs
that respond to recreation trends and resident interests.
f Strategy 5.3.5: Encourage private sector development of family-friendly entertainment activities and establish alliances with cultural/ art institutions to increase local amenities, and provide destinations for residents and visitors, including Farmer’s Markets and pop-up stores; all of which would support economic development.
TRANSIT ORIENTED DEVELOPMENT (TOD) is defined as the creation of compact, walkable, pedestrian-oriented, mixed-use communities centered around transit systems. Living in TOD’s encourage a lower-stress life without complete dependence on a car for mobility and survival. TOD includes six key principles:
1) Connectivity – The TOD must be connected to neighborhood destinations, varied travel modes and activity centers throughout the region;
2) Quality Public realm and amenities – The TOD includes a network of public spaces that create a sense of place and promote pedestrian activity;
3) Pedestrian Friendly, Safe Environment – The physical environment and land uses must promote walking and vibrancy;
4) Attractive Architecture and Design – Design that integrates all components of the compact neighborhood and reflects a unified environment;
5) Mix of Uses – The TOD offers a mix of intensities of land uses and activities within walking distance of transit facilities; and
6) Multimodal Opportunities – Managed parking that balances automobile access with transit, walking, and biking options.
f Strategy 5.3.6: Encourage the inclusion of cultural and/or educational facilities (e.g., theater, art gallery, concert hall) within major redevelopment projects.
f Strategy 5.3.7: Encourage the expansion of light manufacturing in the Park Avenue CBD.
Goal 5.4: Prioritize and create a framework to facilitate development of Bayfront opportunity sites including the former wastewater/sewage treatment facility and other City-owned sites that can serve as catalysts for additional private investment.
f Strategy 5.4.1: Prepare a Special Area Plan for the Bayfront. The Plan would ensure that waterfront access is maintained and augmented where possible and would include a goal that establishes a Bayfront Mile esplanade from Washington Boulevard to the Long Beach Road Bridge and east.2 The City could seek support to prepare the Special Area Plan from a consultant, through issuance of a request for information (RFI) / request
for quote (RFQ) to the development community, or in-house by the City.
f Strategy 5.4.2: Prioritize direct access from the North Park neighborhood to the Bayfront.
f Strategy 5.4.3: Consider amending the Zoning Code to allow a mix of uses, including, water-related/water-dependent commercial development, green open space, affordable housing, educational uses, waterfront recreation and entertainment, and community facilities.
f Strategy 5.4.4: Continue to offer training for business startups and expansion, with a specific emphasis on minority, veteran, and women-owned businesses.
2 It is understood that the Bayfront Mile esplanade will be designed with consideration of existing waterfront utility infrastructure and the ability to cross over the LIRR tracks.
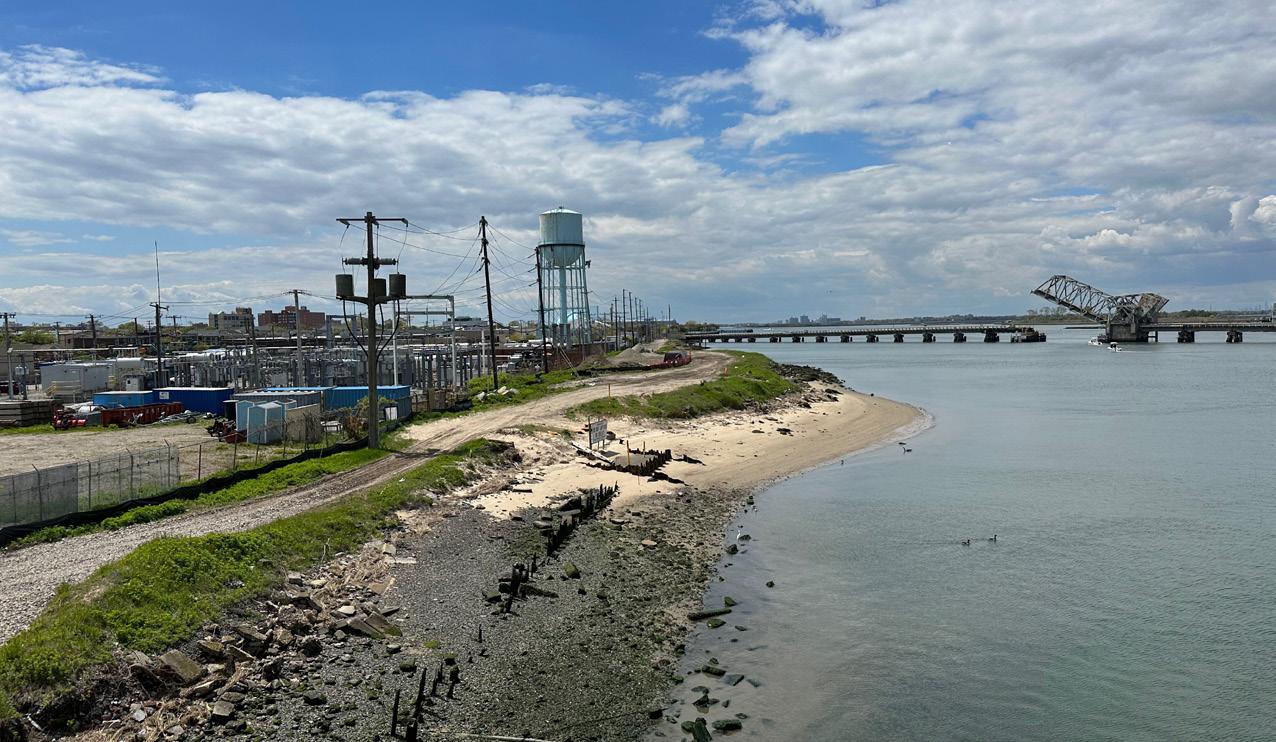
f Review and revise the City’s Zoning Code.
f Conduct a TOD study and prepare a Special Area Plan for the area around the LIRR station.
f Conduct a study and prepare a Special Area Plan for the opportunity sites along the Bayfront.
f Include Affordable Housing initiatives in the TOD and Bayfront Special Area Plan efforts.
f Create public-private partnerships to facilitate development of the City’s strategic opportunity sites.
f Explore legal mechanisms (e.g., Community Benefit Agreement) that require large development projects to include community benefits.
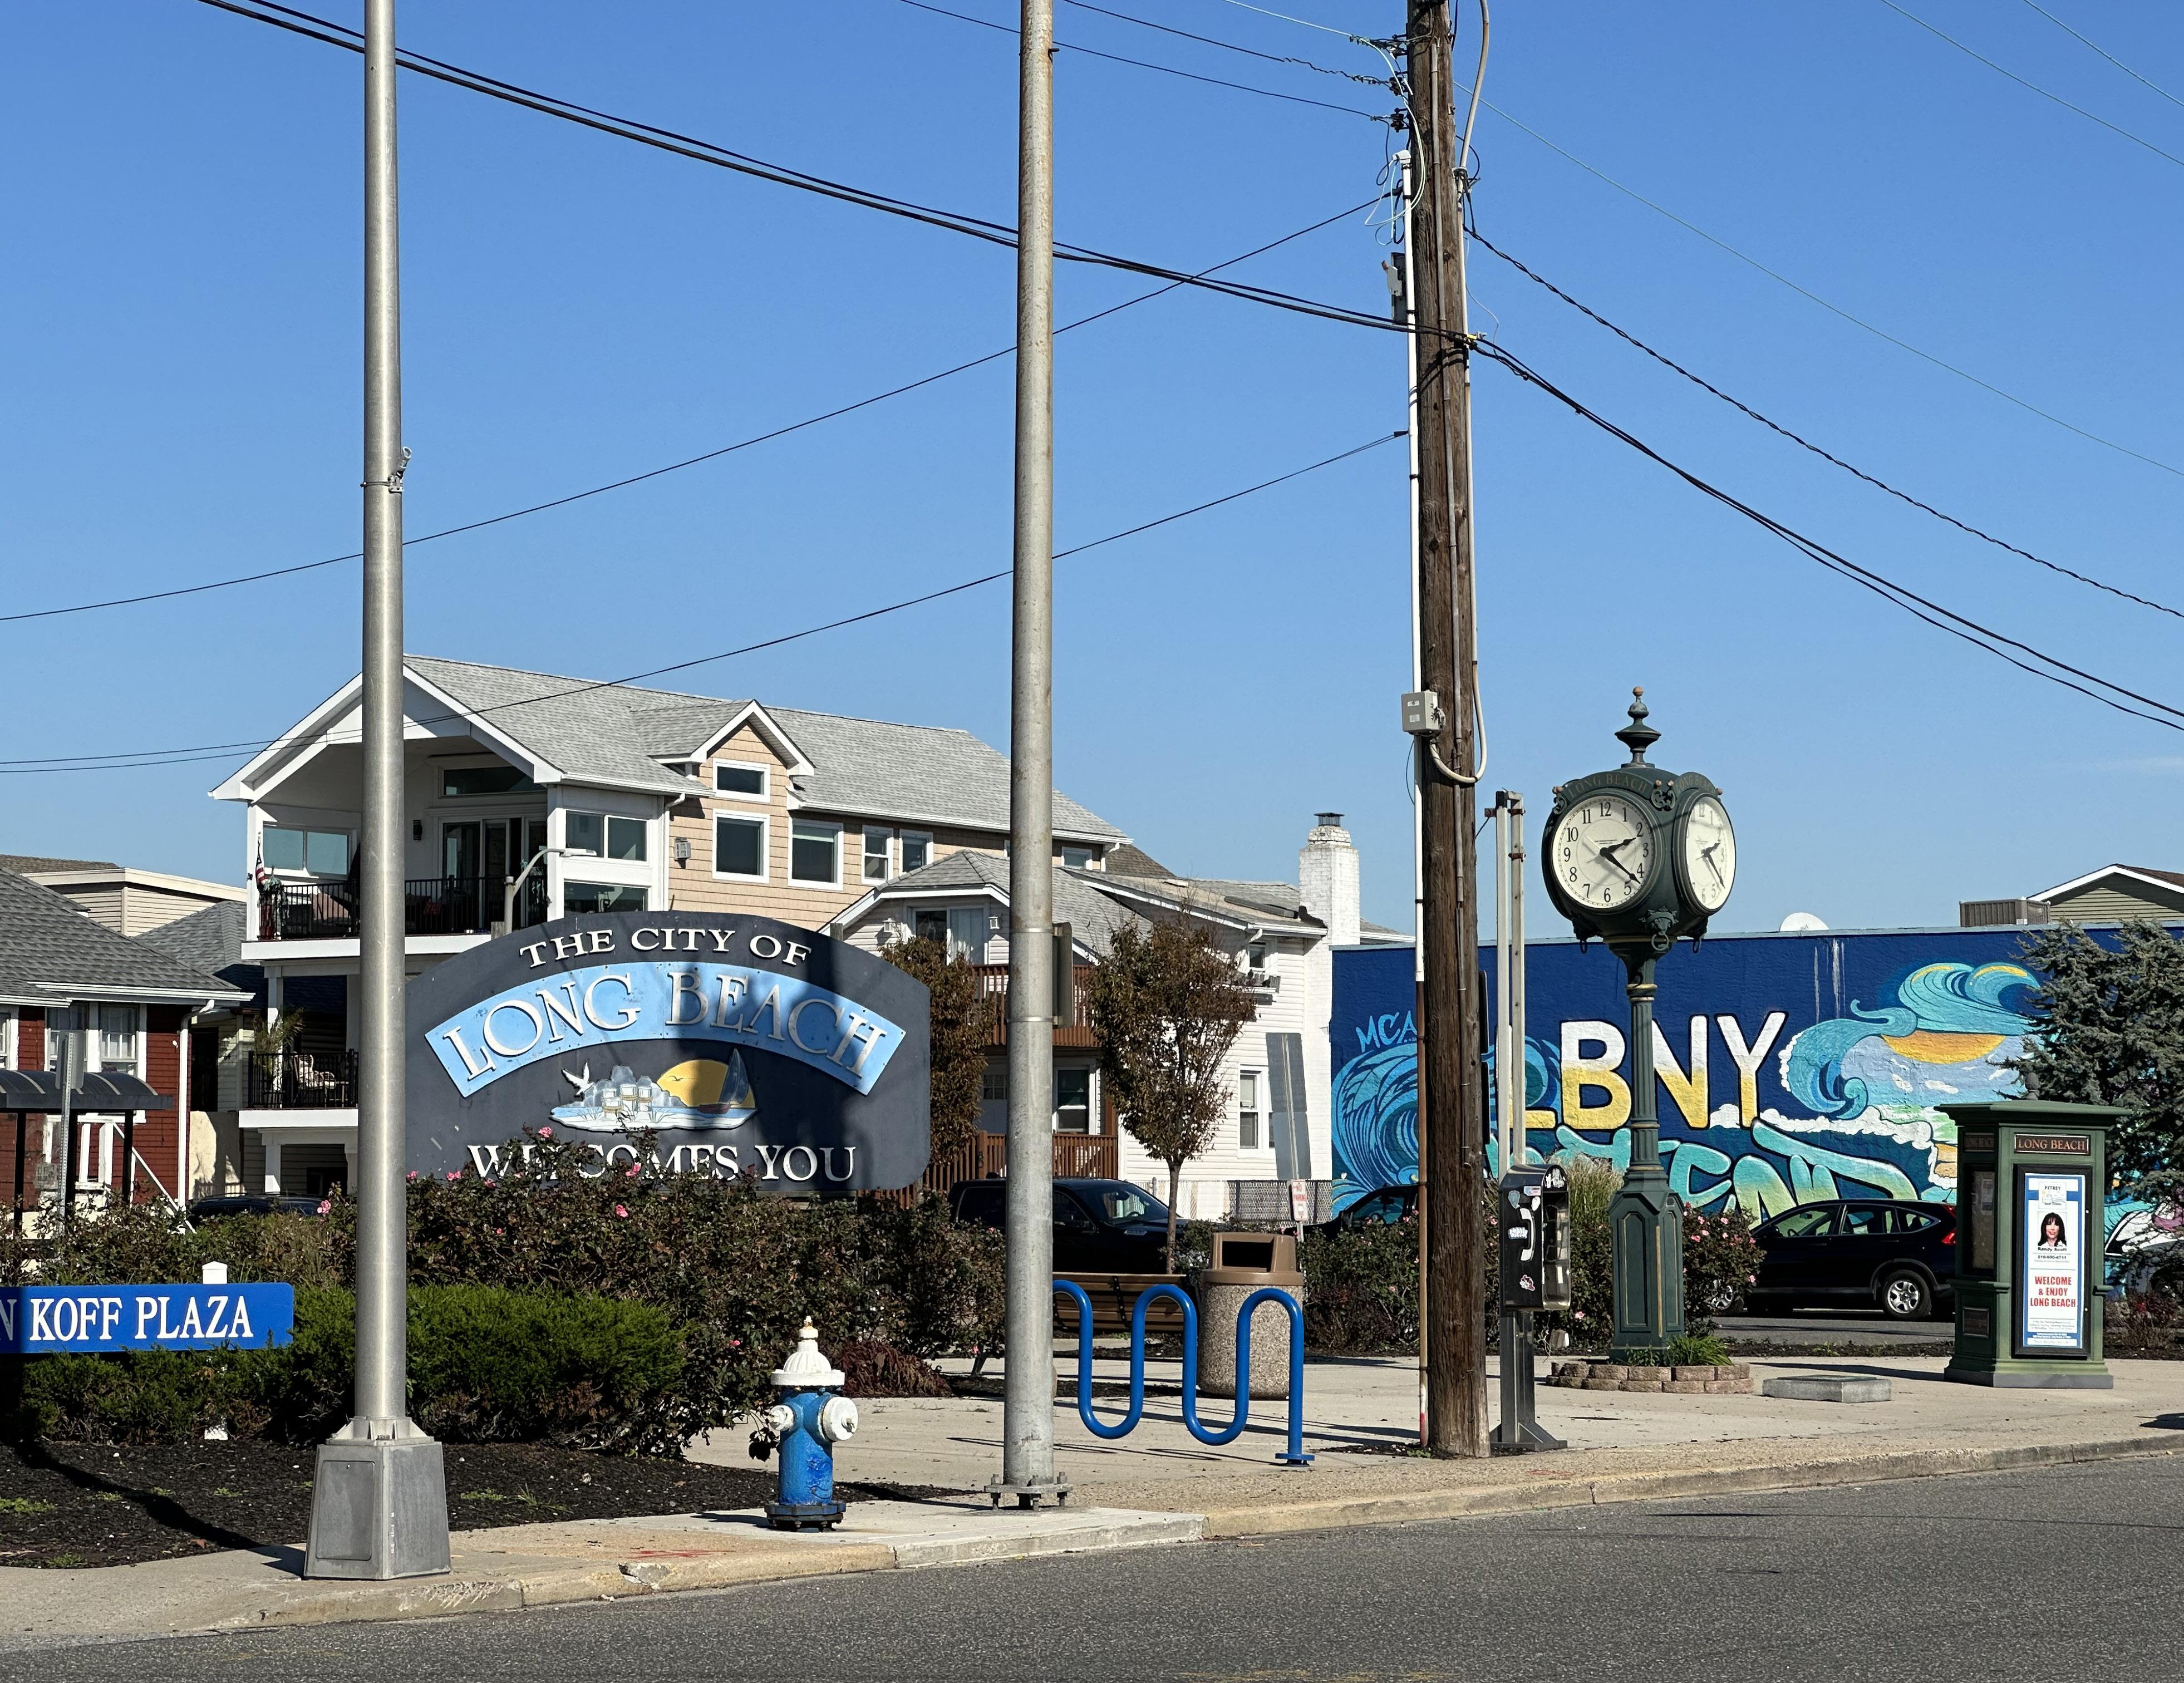
and apartment buildings) to meet the needs of firsttime home buyers and renters and downsizing seniors looking to stay in Long Beach.
The Future Land Use Map:
The land use recommendations recognize the City’s goal to continue resiliency initiatives and preserve open space and neighborhood character, while promoting economic development and diverse housing options, where appropriate, thereby increasing the supply of quality housing.
This Comprehensive Plan presents a land use map that balances existing development in residential neighborhoods and commercial districts, with preservation, sustainability goals, and future growth in targeted areas. The land use recommendations recognize the City’s goal to continue resiliency initiatives, preserve open space and neighborhood character, while promoting economic development and diverse housing options, where appropriate, thereby increasing the supply of quality housing. The future land use map identifies several areas where the City can explore a mix of uses and consider new housing types (e.g., townhomes, mixed-use buildings,
f Protects established residential neighborhoods;
f Recognizes and promotes current land use trends for small-scale redevelopment, including commercial uses in downtown Long Beach;
f Acknowledges the preference for mixed-used development where appropriate;
f Maintains infill development consistent with existing Zoning Districts along the oceanfront; and
f Prioritizes potential growth areas around the Long Island Rail Road (LIRR) station and along the Bayfront.
The Comprehensive Plan recommends mechanisms to ensure targeted growth while retaining the City’s established land use patterns. Future land use recommendations prioritize rehabilitation and reuse of City-owned vacant and underutilized properties to maximize their economic development potential, creating jobs and improving the tax base, upgrading the City’s utilities and infrastructure, and promoting housing and lifestyle diversity.
Future land uses by use category and targeted growth areas were developed in coordination with the City and refined based on discussions with residents and the business community through public engagement (see Figure 5-1, Future Land Use).
Residential Uses
f Low Density Residential: Typically, single-family detached homes and low-density multi-family properties.
f Moderate Density Residential: A blend of housing options, including two-family homes and small multi-unit walk-up structures, such as townhouses.
AND FACT from the Urban Land Institute with the National Multi Housing Council, Sierra Club and American Institute of Architects
f Low-/Mid-Rise Residential: Proposed as transition areas between low and moderate density residential uses and high-rise residences or commercial/retail areas. Low-/mid-rise residential buildings are marginally taller and may contain more units than moderate density residential uses but are not as dense as high-rise residential developments.
f High-Rise Residential:1 Higher-density multiunit residential properties, typically requiring an elevator. Some ground-floor commercial uses may be interspersed in these areas that capitalize on their proximity to the oceanfront to maximize views and access.
1 Previous plans typically defined high rises as five to 10 stories, with larger high-rise buildings focused in the center of the boardwalk where mixeduse is zoned to take advantage of the nearby LIRR and CBD.
“The nature of who lives in higherdensity housing—fewer families with children—puts less demand on schools and other public services than lowdensity housing. Moreover, the compact nature of higher-density development requires less extensive infrastructure to support it.”
f Central Business Uses: Central business uses are uses typically concentrated in a city center and include offices, retail, and other commercial businesses and services with residential uses subordinate to the commercial/retail uses. Central Business uses are generally focused along Park Avenue.
f Commercial Corridor: Commercial corridor uses are typically automobile-centric uses or other convenience-oriented commercial establishments. Commercial corridor uses are generally located along Long Beach Boulevard.
f Neighborhood Commercial: Smaller-scale commercial and retail uses that are neighborhoodfocused, typically served by on-street parking. Neighborhood Commerical uses are generally found along West Beech Street and East Park Ave.
Mixed Uses
f Mixed Uses (Commercial and Residential): Properties developed with ground floor commercial, and retail uses and residential units above. Mixed-use development is typically low and moderate density.
Community Facilities and Institutional Uses
f Public Community Facilities: Governmentowned properties and buildings that provide
services to the residents of Long Beach. These services may include emergency services, government operations, subsidized housing and public education facilities.
f Parks and Open Spaces: Passive and active municipally owned and operated recreation areas.
f Medical and Supportive Facilities: Public and privately owned and operated medical care, including hospitals, nursing homes, urgent care, and other medical facilities. This includes Long Beach Nursing Home and Rehabilitation Center.
f Private/Not-for-Profit Community Uses: Properties owned and operated by not-for-profit institutions that provide services to the community or support the operations of the institutions.
Industrial and Utility Infrastructure
f Industry and Utility: Properties that house manufacturing and industrial uses or contain public utility buildings and infrastructure.
Transit Oriented Development (TOD) and Potential Redevelopment Sites
f TOD Opportunity Area: Sites located at or near transit hubs, identified as appropriate for higher density development with a mix of uses.
f Bayside Redevelopment Area: Areas of future redevelopment potential along the Bayfront.

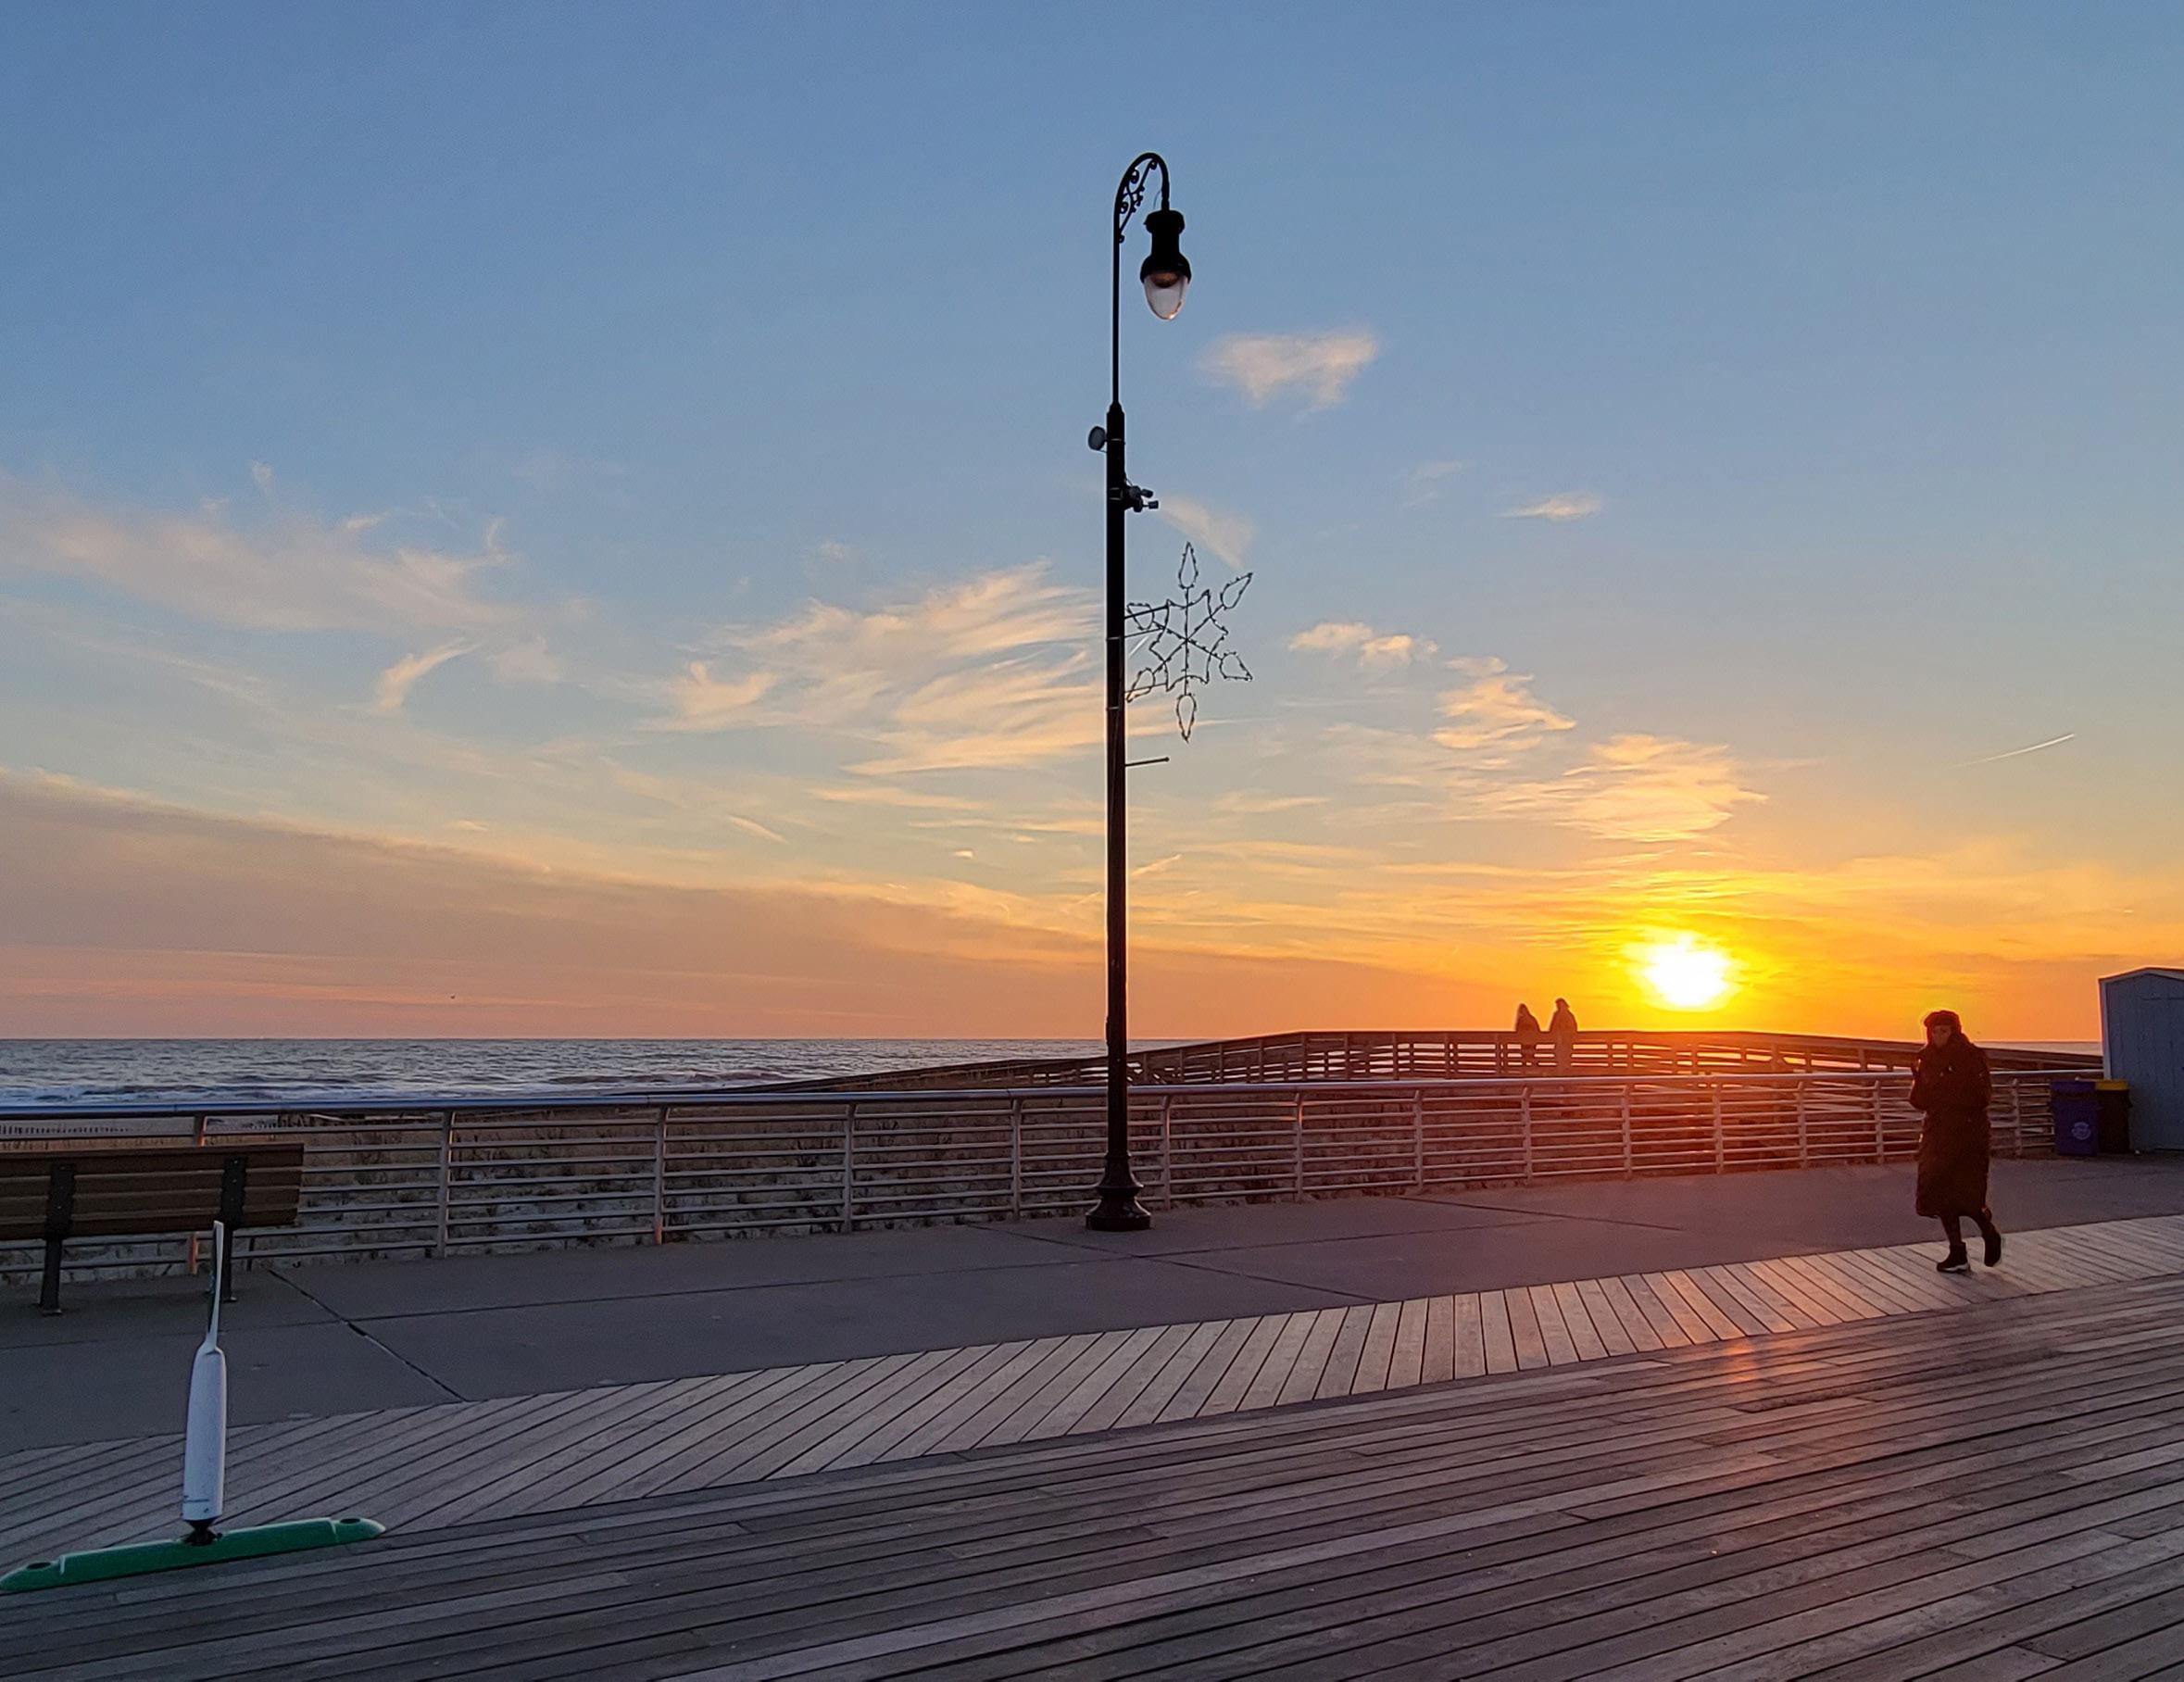
The Comprehensive Plan is a policy document that guides decision-making by and between the City’s numerous Boards, Committees, and Councils to advance the communities’ vision for the future of Long Beach. The Plan identifies key planning themes and prioritizes opportunities to implement strategies determined by assessing existing conditions, vetting those conditions through community engagement and documenting action items.
The City Council is responsible for adopting the Comprehensive Plan, implementing the Plan’s goals and strategies, and ensuring their completion. To that end, this Comprehensive Plan includes an “Implementation and Action Plan” (Action Plan) (see Appendix A). To ensure strategies presented in this Plan are implemented, the Action Plan assigns a “Responsible Party.” The Responsible Party would assume the lead role in presenting Action Items to the City Council, which would allocate capital and staff resources to help accomplish the tasks. Although the Action Plan proposes a timeline for completion, as circumstances change, the Action Plan and the associated timeline should be re-evaluated to course correct as necessary. The City Council may establish new Committees and Boards and reassign Responsible Parties during the implementation phase.
From time to time, within five to 10 years after the plan is adopted, the City Council or a group designated by the City Council will review the adopted Comprehensive Plan to determine whether any chapters require updating to remain relevant. It is understood that the Comprehensive Plan is a living document.
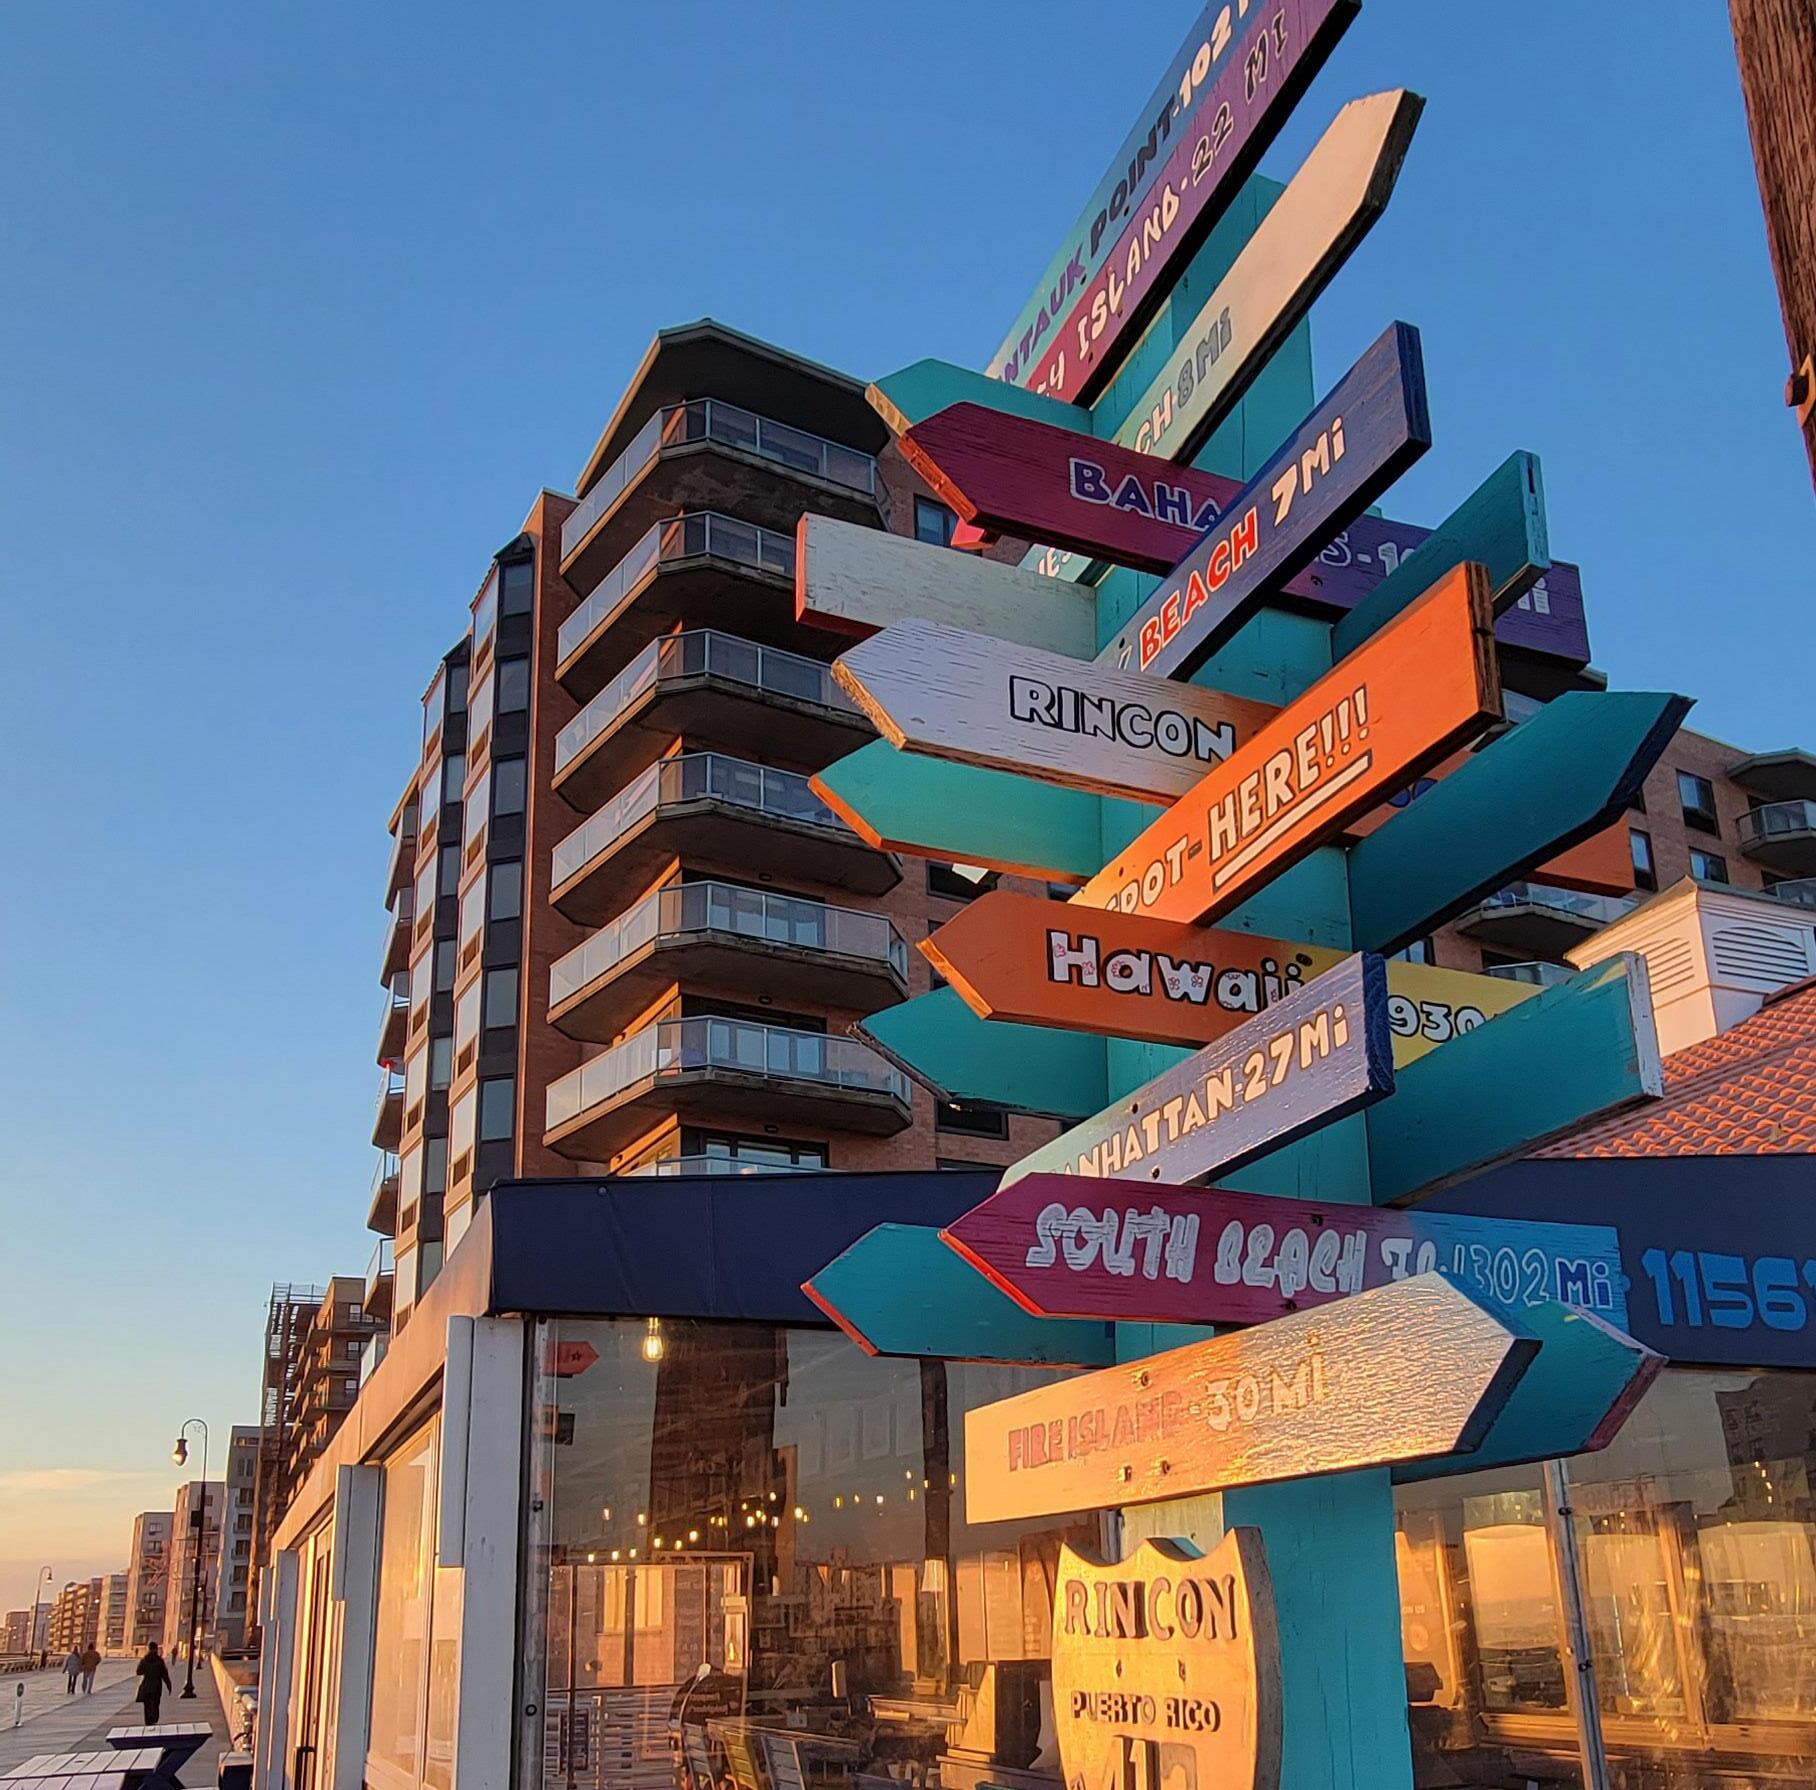
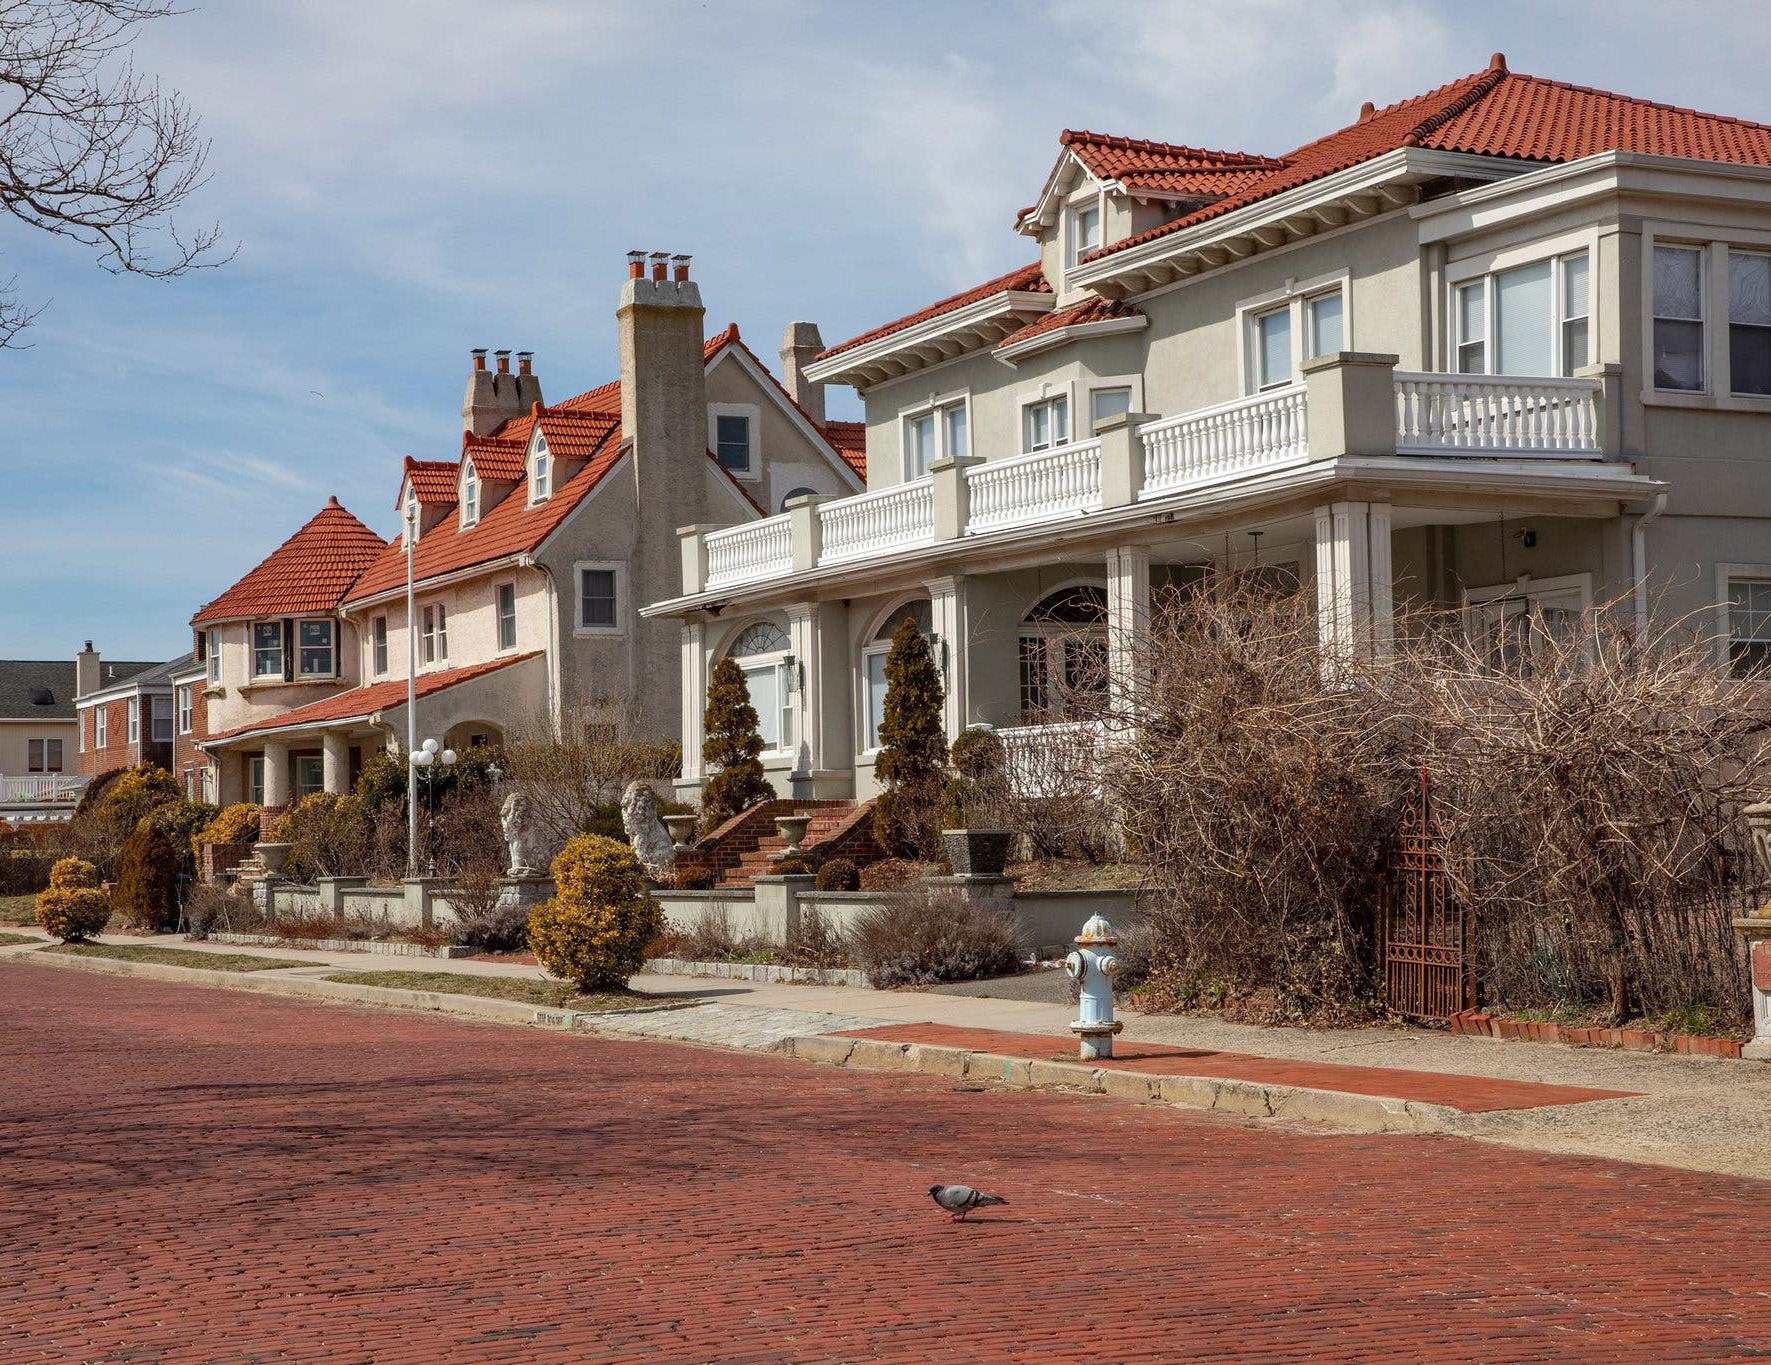
f Appendix A: Implementation and Action Plan
f Appendix B: History and Context of Long Beach
f Appendix C: Recently Completed Resiliency Improvements
f Appendix D: Community Survey Results Report
f Appendix E: Streetsense Commercial District Strategy
f Appendix F: City of Long Beach Comprehensive Plan Final Data Analysis & Existing Conditions
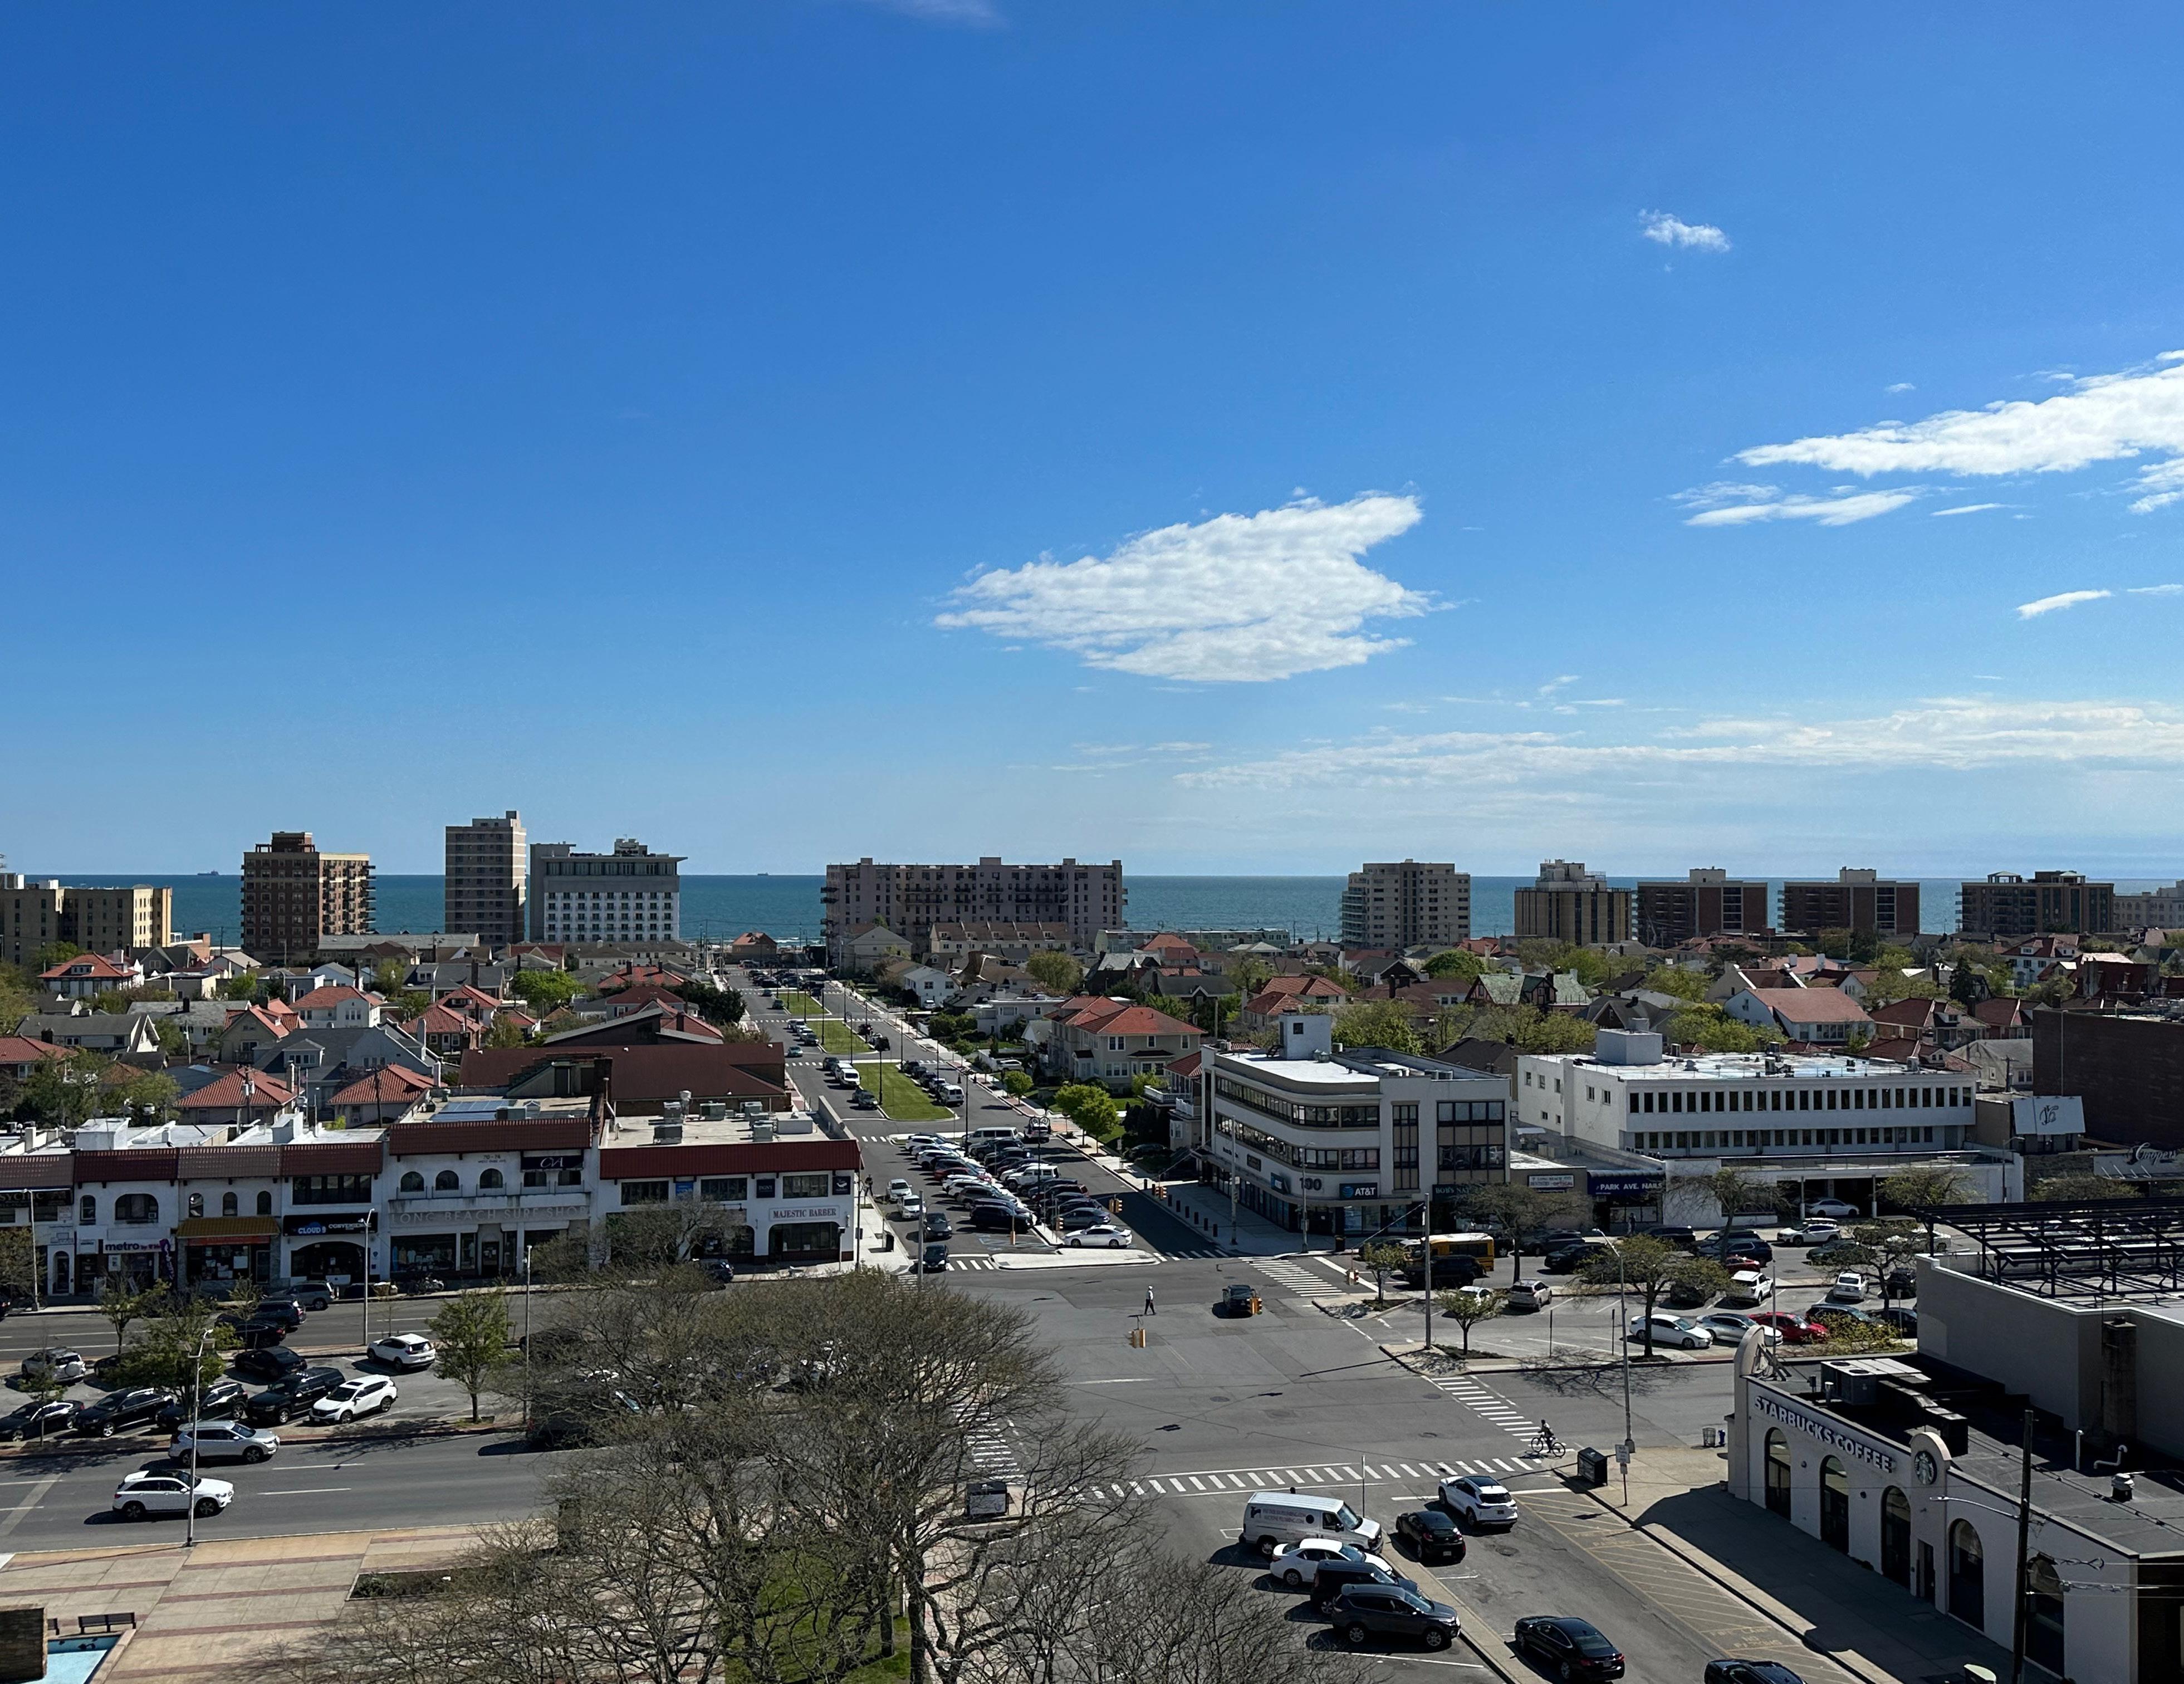
Code Responsible Entity
BD Building Department
CMO Office of the City Manager
COC Office of the Corporation Counsel
DPW Department of Public Works
EDP Department of Economic Development and Planning
FD Fire Department
PD Police Department
PR Office of Public Relations
TSP Department of Transportation
1.1 Review and revise City’s Zoning Code
1.2 Create a Planning Board and a land development application flow chart
1.3 Pursue state and federal funding and grants to support housing rehabilitation for seniors and other eligible households
1..4 Inventory City-owned vacant/underutilized properties and prepare a highest and best use analysis
1.5 Prepare a Citywide Housing Plan to evaluate the needs of all residents
1.6 Prepare a Citywide streetscape plan that can be implemented in phases when funding becomes available.
1.7 Create a structured enforcement policy for zoning and other building code violations
1.8 Enhance community facilities including parks and recreation
1.9 Enhance the City’s cultural and historic assets
2.1 Review and revise the City’s Zoning Code
Createmixed-usezoningdistricts(includingwithintheCBD)orzoningdistrictoverlays
2.2 Prepare a Citywide streetscape plan and design guidelines for commercial/retail zones that can be implemented in phases when funding becomes available
2.3 Consider creating one or more Business Improvement Districts (BID) to manage, advocate, and raise funds for commercial/retail neighborhoods
2.4 Draft and issue a request for qualifications (RFQ) for the redevelopment of City Hall to solicit input from the development community regarding the highest and best use of this property
2.5 Conduct a TOD study and prepare a Special Area Plan (including consideration of affordable housing) for the area around the LIRR station
2.6 Continue pursuing grants for and implementation of streetscape improvements and active mobility improvements.
2.7 Develop the Bayfront with uses that capitalize on and provide public access to the waterfront
3.1 Continue to pursue State and Federal funding for transportation project implementation, including Complete Streets.
3.2 Coordinate with the Nassau County of Public Works, Traffic Engineering Unit, to develop and implement a Citywide traffic signal operations plan, with first phase roll-out along Park Avenue, Broadway, Beech Street, and Long Beach Boulevard.
3.3 Seek funding for the design and implementation of a Neighborhood Traffic Management Plan.
3.4 Seek funding for the design and implementation of a Parking Management Plan that would construction of additional garages to free up curb space for the installation of bus lanes, bicycle lanes, more efficient curbside parking, and green infrastructure best management practices (permeable pavers, landscaping, rain gardens, and bioswales).
3.5 Evaluate Transportation Demand Management strategies (i.e., a parking district that would manage parking behavior and patterns and facilitate access to the City’s commercial/retail corridors).
3.6 Evaluate and install, where appropriate, signage to limit heavy trucks from residential streets.
3.7 Improve connections for bicycles between the Boardwalk, Park Avenue, and the West End
4.1 Consider adopting land use tools and policies like climate resilient zoning ordinances and resilient design guidelines to help prepare the City for the long-term impact of climate change
4.2 Identify and document general and project-specific opportunities to implement green building and green infrastructure practices in new construction and retrofits/renovations for both vertical and horizontal development
4.3 Work collaboratively with neighborhoods to assess opportunities for nature-based solutions that address coastal hazards
4.4 Pursue State and Federal funding for green infrastructure and nature-based project implementation
4.5 Prepare an approach to combat heat islands, including tree and vegetation planting, creating cool roofs, establishing neighborhood cooling centers, distributing education materials on health risks associated with intense heat
4.6 Continue to install new and updated existing storm water management infrastructure
4.7 Increase coordination between experienced/trained City Office of Emergency Management staff and emergency service providers in emergency preparedness planning
4.8 Enhance communication and coordination with neighboring municipalities during extreme weather events (heat, cold, storm, etc.) and ensure facilities, and transportation to those facilities, are available short- and long-term for displaced residents
5.1 Review and revise the City’s Zoning Code
5.2 Conduct a TOD study and prepare a Special Area Plan (including consideration of affordable housing) for the area around the LIRR station
5.3 Conduct a study and prepare a Special Area Plan (with a requirement for affordable housing) for the opportunity sites along the Bayfront
5.4 Create public-private partnerships to facilitate development of the City’s strategic opportunity sites
5.5 Explore legal mechanisms (e.g., Community Benefit Agreement) that require large development projects to include community benefits
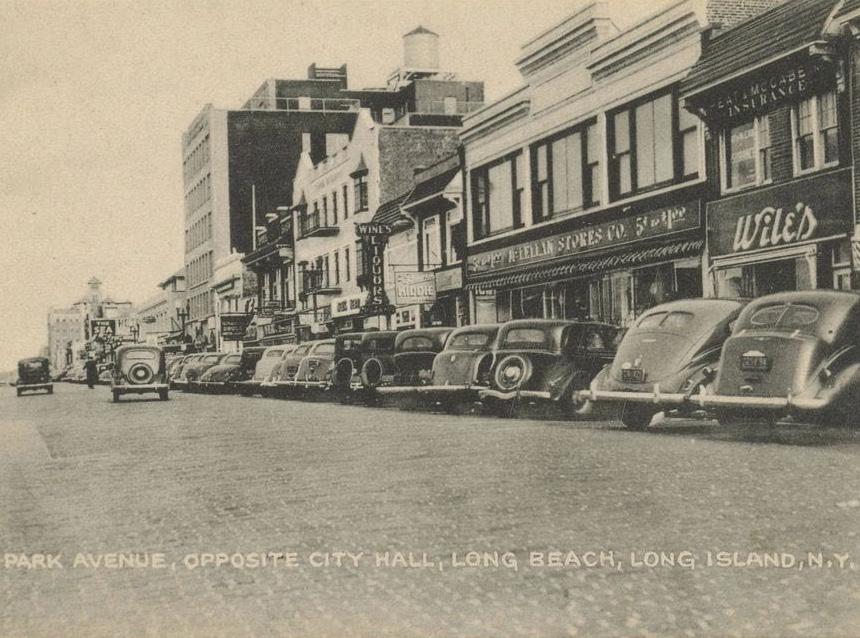
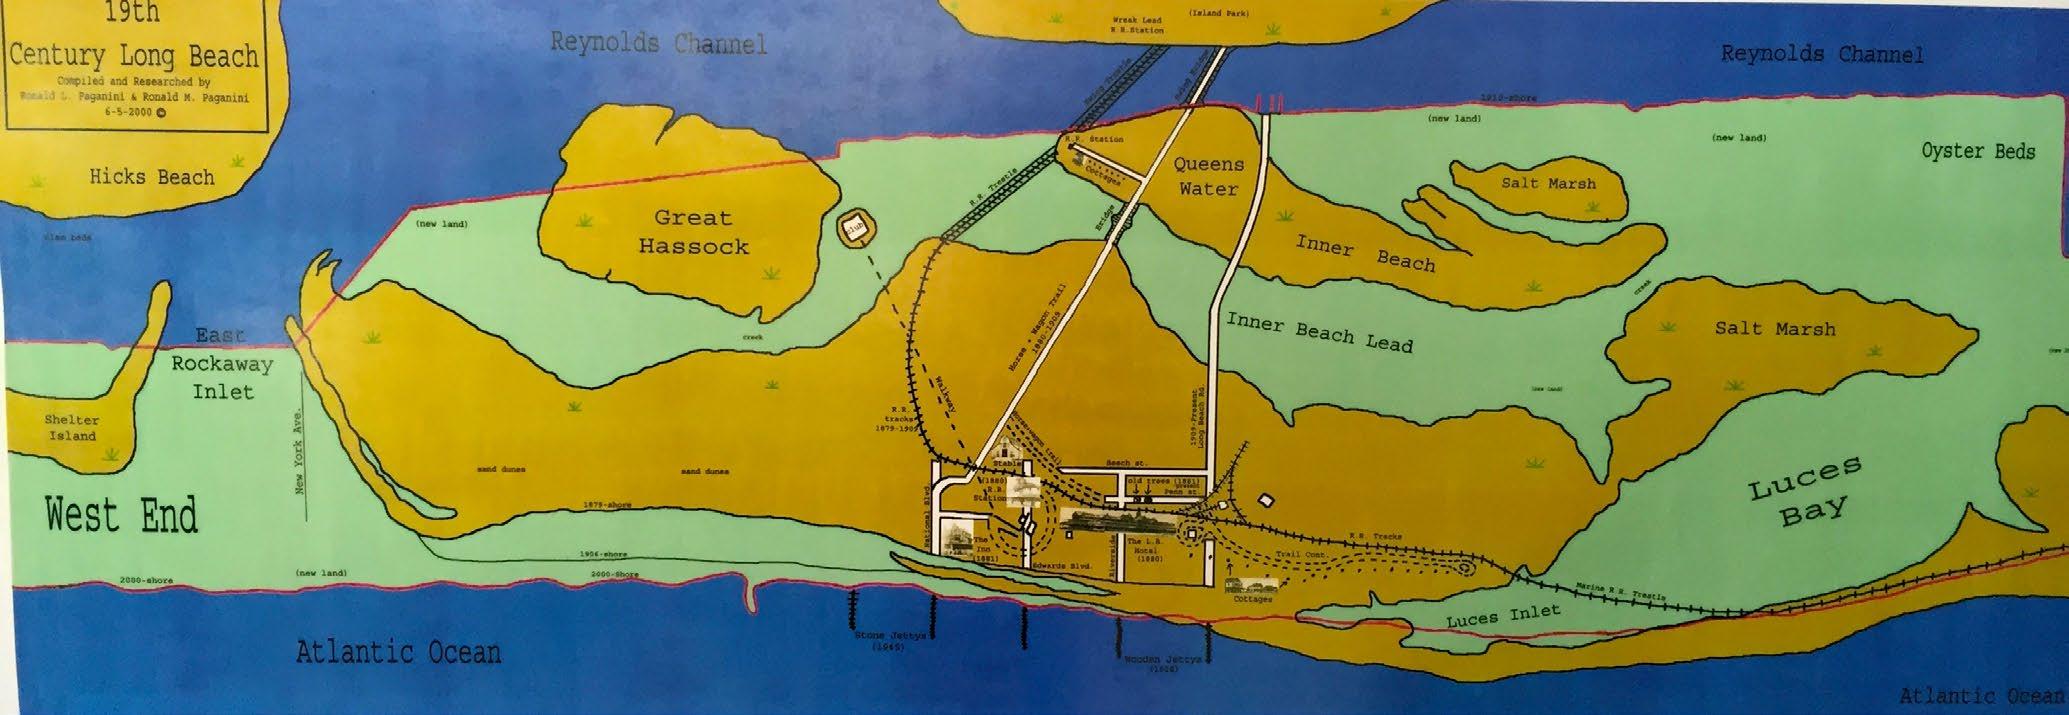
AuthoredbyCityofLongBeach
Prior to the founding of what is today known as Long Beach, New York, the seven-island sandbar (see Figure A) was seasonally visited by the Algonquin Native American Tribe, who were attracted to the natural resources found on the barrier islands of the Atlantic Ocean. To accommodate their seasonal stays, they constructed longhouses on the white sand beach. Some of the first economic development activities that occurred on the sandy shores of Long Beach were hunting, clamming, whaling, and wampum seashell gathering, performed by the Algonquin tribe. It was not until the late 19th century that Long Beach experienced a great amount of development by non-Native American settlers which began to resemble the City by the Sea known today.
Figure
the Long Beach Historical Society’s Museum. Long Beach was founded in 1880 after the construction of the railroad terminus and construction of the first Long Beach Hotel. The Long Beach Hotel, which bore the distinction of being the largest seaside hotel in the world with over 5,000 rooms, brought New York City residents and other Greater New York Area inhabitants to the barrier island via the Long Island Rail Road, which had a terminus station located just a few blocks from the beach. The Long Beach Hotel lobby served several public functions, as it was used as a convenient public meeting room and as the location of Long Beach’s first post office. The first Long Beach boardwalk ran across the length of the hotel property, and led visitors from buildings in the hotel complex to the beach and bathing pavilion.
In 1906, Senator William Reynolds purchased the world-class seaside resort hotel and the railroad lease. On July 30, 1907, a year after Senator Reynolds purchased it, the Long Beach Hotel burned down; the cause of the fire remains a mystery today Fortunately, no lives were lost. However, the fire destroyed one of the adjoining cottages, the hotel dormitory, the chapel, a power plant, and two strings of Long Island Rail Road cars.
Following the Long Beach Hotel fire, Reynolds set his eyes on developing Long Beach into a seaside planned community. He conceived and constructed an “indestructible”
boardwalk that would serve as the center of the Long Beach community. Reynolds would utilize innovative engineering of the time to build a 50-foot-wide walk that was 10 feet above the high water line, and supported by concrete piles. As part of an advertising campaign, Senator Reynolds held a photoshoot with his Dreamland elephants swinging timbers, leading many to believe that the elephants built the new boardwalk. The boardwalk was completed in 1914 and truly became a center for Long Beach social life. As he was working on the new boardwalk, Reynolds began the process of dredging the marshland waters and “filled-in” the areas between the seven islands, raising the topography by nine This expansive project allowed for The Estates of Long Beach Company to build a series of large stucco, red tiled-roof homes that bordered the new boardwalk along the Atlantic Ocean. The new houses were heavily advertised to wealthy, elite New York City residents who wanted to escape the summer heat By 1913, 200 of the Estate mansions were constructed. The remnants of the original red-brick streets can still be found in parts of Long Beach, such as on W. Penn Street. That same year, the Estates of Long Beach achieved Village status.
During World War I, the island was mainly utilized by the military and this postwar legacy is embodied by the pedestrian neighborhood known as the Walks. The Walks, located between Lindell and New York Boulevards, were within walking distance of the military hospital located at the Nassau Hotel. The Walks utilized a centralized sewer and water system, and it featured 10 lanes named after the months of the year.
By the end of World War I, people returned to Long Beach looking for entertainment and amusement, which created a host of more family-friendly attributes The first school occupied a room in the Nassau Hotel, the boardwalk became more attuned to family life, and there was transformation towards working class, rather than first-class elite, which diversified the City. By 1922, the Village had gained a New York State Charter incorporating it as the City of Long Beach.
During World War II, the Lido Hotel served as a post for the U.S. Navy, and Long Beach welcomed soldiers and sailors to the City. Post-1950s, the boardwalk was filled with different arcades, amusements, and refreshment counters despite its wear and tear. To accommodate the older infrastructure, the city needed to generate capital and increase their tax base by building up. This led to the creation of high rises overlooking the Atlantic Ocean, a trend that continues today. Some of today’s high-rise apartment buildings can be found in the same locations that the grand hotels were located in at the beginning of Long Beach’s history.
During the 1960s and 1970s, Long Beach struggled in combating a new identity as the “dumping ground for mental patients, welfare cases, and poor elderly people.” 1 As middle-class families moved away from the City, Long Beach struggled to attract new, younger couples. To address this, the City Council adopted a law, which was later overturned in court, stating that those needing psychiatric medication were not
1 Winerip, M. “In Long Beach, the tide seems to be turning,” from the New York Times archives. New York: The New York Times. https://www.nytimes.com/1983/03/13/nyregion/in-long-beach-the-tide-seems-to-beturning.html
permitted to live in Long Beach hotels. It was not until local officials started pushing for the rewriting of the State’s regulations on adult-care facilities did things begin to improve. With pressure from the State, many hotels were forced to either improve their quality of care and get an adult-home license or stop allowing disabled people to live there. Many hotels were forced to close, as a result. 2
From the 1960s to the 1980s, the City underwent urban renewal programs, as many other cities did in the nation. City Manager Ed Eaton began upgrading sewers, repaving streets, and seizing many of the boarded-up mansions. 3
Long Beach has always been vulnerable to natural hazards. According to the US Army Corps of Engineers, New York District, there have been occurrences of damaging storms in 1938, 1950, 1953, 1960, 1962, 1984, 1991, 1992, and 2012. 4 This long history of coastal storms has created a need for resilient and forward-thinking planning, not only for storm events, but also for long-term sea level rise due to climate change.
The notorious hurricane of 1938 brought havoc to the streets. This was one of the most destructive and powerful hurricanes ever recorded. Hitting the shores of Long Island and Southern Connecticut on September 21, 1938, the Category 3 hurricane caused extensive damage and 60 lives to be lost throughout Long Island. 5 In Long Beach, the 1938 storm left more than 150 people homeless as houses were smashed and uplifted by the storm surge and high winds (see Figure B).

Superstorm Sandy hit Long Beach, New York during October of 2012. Water from both the Atlantic Ocean and Reynolds Channel surged and surrounded the City. The storm
2 Ibid, p. 1
3 Ibid, p. 1
4 US Army Corps of Engineers, New York District, “Fact Sheet – Jones Inlet to East Rockaway Inlet (Long Beach) NY,” USACE website, accessed on April 12, 2021.
5 National Weather Service. “The Great New England Hurricane of 1938.” National Oceanic and Atmospheric Administration, accessed on May 3, 2021, https://www.weather.gov/okx/1938HurricaneHome
ended up causing an estimated $150 million in damages to the city’s infrastructure. Following the storm, Long Beach’s community came together to help their neighbors. The Martin Luther King, Jr. Center distributed resources such as food and clothing to those who lost their possessions in the storm. Though Superstorm Sandy brought massive destruction to the Long Beach community, it also led to a stronger, more resilient community. 6
To recover from Superstorm Sandy, the City focused its attention on resiliency, sustainability, and flood mitigation. The City of Long Beach replaced its damaged boardwalk with an estimated $40 million Brazilian hardwood, concrete-reinforced boardwalk. It stretches for 2.2 miles and has 700 benches that look out to the ocean. 7 This focus on resiliency lead to a number of other projects, including the Army Corps of Engineers $230 million project to fortify the ocean beach and $20 million Critical Infrastructure project 8
Economic Development
After the Long Beach Hotel was destroyed in a fire, Senator Reynolds tried to envision ways to generate more capital for the oceanfront. This included the construction of the Casino, which also featured open terraces, a glass roof, an open bar and grill, and private dining rooms. In addition to the Casino, Reynolds began constructing the Long Beach Boardwalk which would also attract visitors to the small coastal village. Overlooking the boardwalk was the National Pavilion, which provided expansion vistas. With the construction of these major attractions, Reynolds began his ambitious project of dredging which raised the elevation of the island by nine feet and created the rectangular island seen today. Streams and waterways that separated the seven islands of Long Beach became buildable areas, such as New York Avenue, which was an inlet between the Atlantic Ocean and the Bay.
In 1908, Reynolds broke ground on the Nassau Hotel, which was opened on June 19, 1909. Unlike the original Long Beach Hotel, the Nassau Hotel was built for year-round occupancy. This opened Long Beach to tourists through any season. Reynolds utilized publications and public relations media to promote his ventures, including the new Nassau Hotel. Often his advertisements were distributed in New York newspapers, distributed as brochures, and posted as flyers. Some of his advertisements were misleading, such as his map that indicated Long Beach was a mere 23 miles away from Manhattan (see Figure C), not accounting for the twisty roads which could add hours onto a trip He had hope that this would attract what is known as A-List people, which would add to the notoriety of Long Beach. Though the Nassau Hotel has gone through
6 Asbury, J. 2017. “Long Beach ‘stronger, smarter safer’ after Sandy, officials say” from the Newsday website. Newsday. Accessed May 3, 2021. https://www.newsday.com/long-island/nassau/long-beachsandy-1.14676685
7 Fischler, M. 2015. “Long Beach Comes Back After Superstorm Sandy.” New York: The New York Times. Accessed on May 3, 2021. https://www.nytimes.com/2015/04/19/realestate/long-beach-comes-back-afterhurricane-sandy.html
8 Rifilato, A. 2018. “Long Beach marks sixth anniversary of Sandy,” from the Long Island Herald website. Garden City: Richner Communications. Accessed on May 3, 2021. https://www.liherald.com/stories/longbeach-marks-sixth-anniversary-of-sandy,108829
many transformations and aliases, its spirit still shines through the lobby the current structure located there, the Ocean Club Condominiums. 9
Several other development projects, such as additional hotels, bathing pavilions, dining halls, and retail stores attracted visitors to the island. However, Long Beach made a shift from being a tourist destination to a small, family-friendly community shortly after.
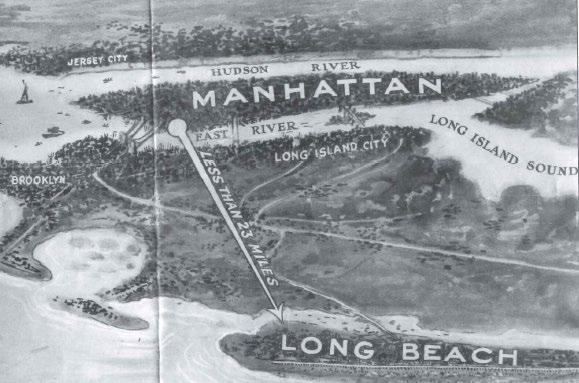
The West End grew up completely independent of Reynolds’ planned community but became annexed within the City of Long Beach in 1925. Initially, it was composed of highly flammable, movable shacks which prompted the incorporation of the Long Beach West Volunteer Fire Department in 1920. After World War I, the West End became home to more permanent bungalows but still housed seasonal renters.
Even when facing bankruptcy, Senator Reynolds, now known as Mayor Reynolds for the Long Beach locals, continued major engineering projects including the building of the Lido Hotel and the creation of a new neighborhood in the area that came to be known as the Canals. At the same time, the Roaring Twenties and Prohibition made Long Beach home to twenty-eight speakeasies and several gambling emporiums.
North Park developed primarily during the 1920s and 30s as Southern black migrants worked in the boardwalk hotels or as domestic servants. While some of these workers lived in the homes where they worked, a few rented and even bought converted garages in the area of what is now North Park. 10 It was a political move to keep people of color
9 LB Homes. “Ocean Club,” on the LBHomes website, Accessed on May 3, 2021, http://www.lbhomes.com/long-beach-condos/ocean-club.htm
10 Kellard, J. 2011. “Once all white, now full of color,” from the Patch website. Patch Media. Access on May 4, 2021. https://patch.com/new-york/longbeach/once-all-white-now-full-of-color
concentrated in the primarily industrial area. However, the North Park community grew closer and closer. Mrs. Reeder, a wealthy black woman, often provided warmth and clothing to fishermen and black laborers in the garage of her stucco estate. 11 In 1950, Rev. Jesse J. Evans founded and became the spiritual leader at Christian Light, as well as a pillar for the entire community. 12 On March 26, 1968, Rev. Dr. Martin Luther King Jr. visited Long Beach and Rockville Centre and spoke about how all races need “to come together and work towards what America stands for: democracy, equality, education.”
13
The 19th century railroad station was located at what is now Park Avenue and Edwards Boulevard. Its location provided access to the 1880 Long Beach Hotel and to the Marine Railway which carried riders to Point Lookout and to the hotel’s cottages along the beach. In 1909, Reynolds partnered with Pennsylvania Railroad to make Long Beach accessible by electric track. Reynolds then used the railroad to transport prospective investors to Long Beach in a private parlor car.
Traveling by automobile presented a challenge to those traveling to Long Beach from New York City. Traveling from the Boroughs to Long Beach could take hours on winding roads. One would need to take either the Queensboro Bridge or the Midtown Tunnel, which both met in Jamaica, and continue to Merrick Road in order to reach Long Beach. In late 1920s and 1930s, the Far Rockaway Bridge, the Meadowbrook, and the Loop Parkway toll bridge provided additional access to the barrier island.
Despite challenges, people flocked to Long Beach as they were lured by Reynolds’ advertising campaigns. Long Beach’s parking struggle can be dated back to 1912, as evident by Figure D As owning a personal vehicle became more of the norm and visitors flocked to Long Beach, it was evident that there needed to be a better way to access Long Beach. In 1922, the construction of the concrete Long Beach Boulevard Bridge connecting Long Beach with Island Park was completed and opened for automobiles.
11 Ibid, p. 1
12 Kellard, J. 2001. “Remembering Jesse Evans late pastor honored with street name” from LI Herald website. Garden City: Richner Communications. Accessed on May 4, 2021.
https://www.liherald.com/stories/remembering-jesse-evans-late-pastor-honored-with-street-name,18688
13 Strack, B. 2018. “50 years later, locals recall Dr. Martin Luther King Jr.’s visit to Rockville Centre” from the LI Herald website. Garden City: Richner Communications. Accessed on May 4, 2021.
https://www.liherald.com/stories/50-years-later-locals-recall-dr-kings-visit-to-rockville-centre,100639
Long Beach also hosted a docking site in Reynolds Channel for an American Aeromarine Inc. seaplane, which was later privately taken over to become the Long Beach Seaplane base in 1925 (see Figure E). This operation was originally part of American Aeromarine Inc’s route No. 3, which also serviced the Hamptons. The one-way fee between Long Beach and New York City was $20, and the trip was about 20 minutes. The excursions were discontinued in the 1970s after they were deemed no longer safe.

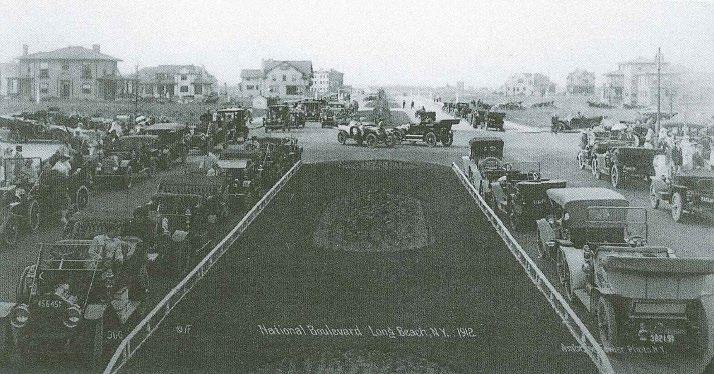
Asbury, J. 2017. “Long Beach ‘stronger, smarter safer’ after Sandy, officials say” from the Newsday website. Newsday. Accessed May 3, 2021.
Fiore, R., Carole Shahda Geraci, and Dave Roochvarg. 2010. ImagesofAmerica– Long Beach.United States: The Library of Congress.
Fischler, M. 2015. “Long Beach Comes Back After Superstorm Sandy.” New York: The New York Times. Accessed on May 3, 2021.
Kellard, J. 2001. “Remembering Jesse Evans late pastor honored with street name” from LI Herald website. Garden City: Richner Communications. Accessed on May 4, 2021.
Kellard, J. 2011. “Once all white, now full of color,” from the Patch website. Patch Media. Access on May 4th, 2021.s
LB Homes. 2021. “Ocean Club,” on the LBHomes website, Accessed on May 3, 2021. National Weather Service. 2021. “The Great New England Hurricane of 1938.” National Oceanic and Atmospheric Administration, accessed on May 3, 2021.
Rifilato, A. 2018. “Long Beach marks sixth anniversary of Sandy,” from the Long Island Herald website. Garden City: Richner Communications. Accessed on May 3, 2021.
Strack, B. 2018. “50 years later, locals recall Dr. Martin Luther King Jr.’s visit to Rockville Centre” from the LI Herald website. Garden City: Richner Communications. Accessed on May 4, 2021.
US Army Corps of Engineers, New York District. 2021. “Fact Sheet – Jones Inlet to East Rockaway Inlet (Long Beach) NY.” USACE website, accessed on April 12, 2021
Winerip, M. “In Long Beach, the tide seems to be turning,” from the New York Times archives. New York: The New York Times.
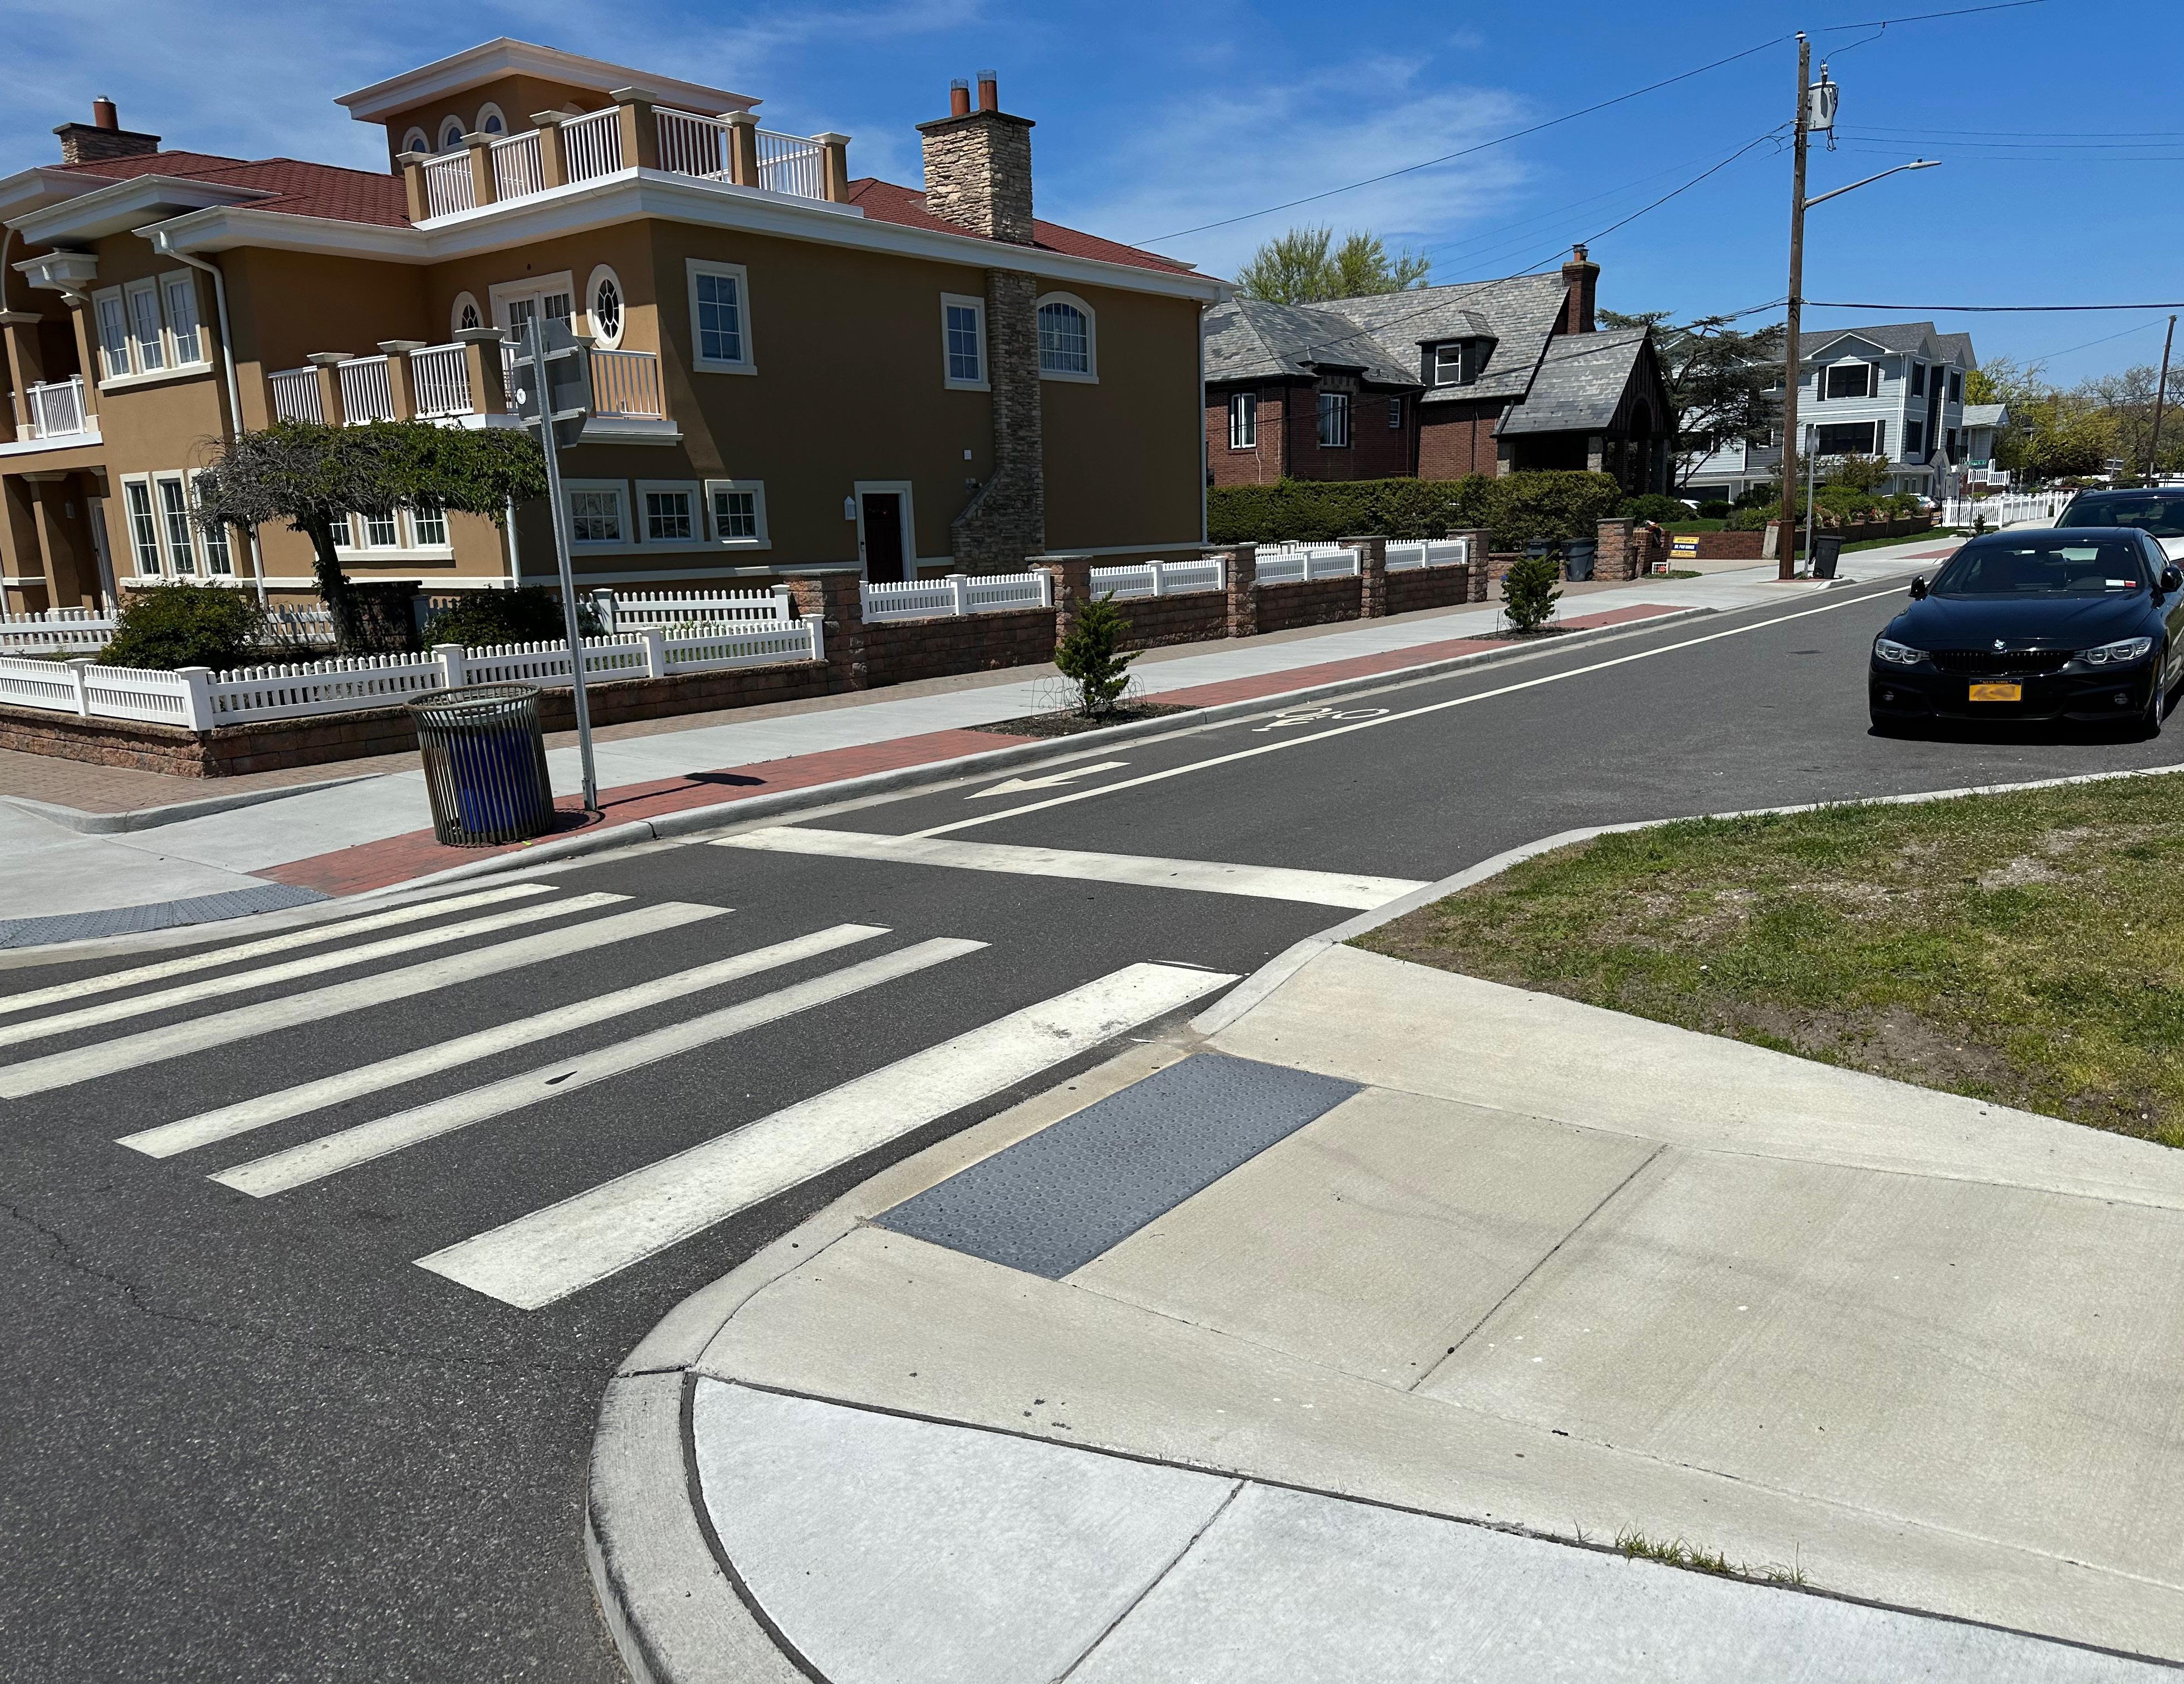
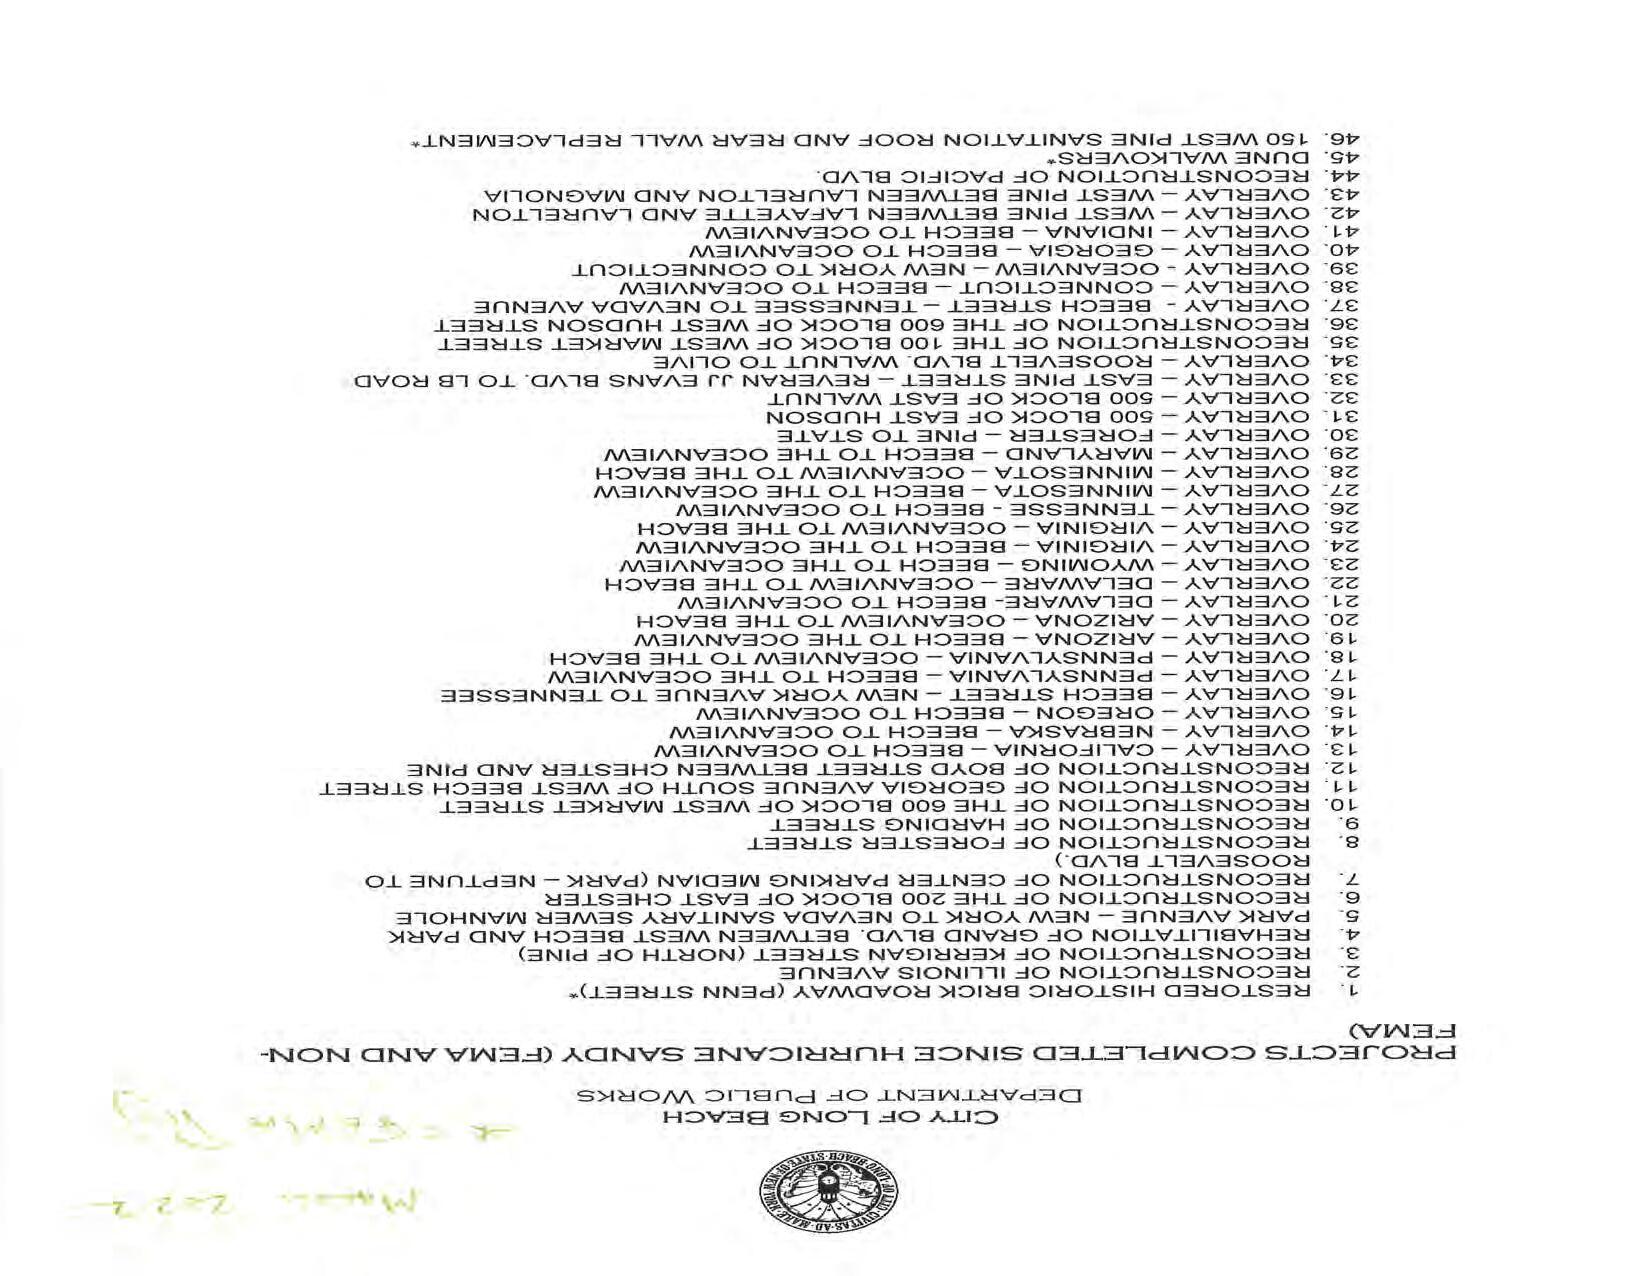
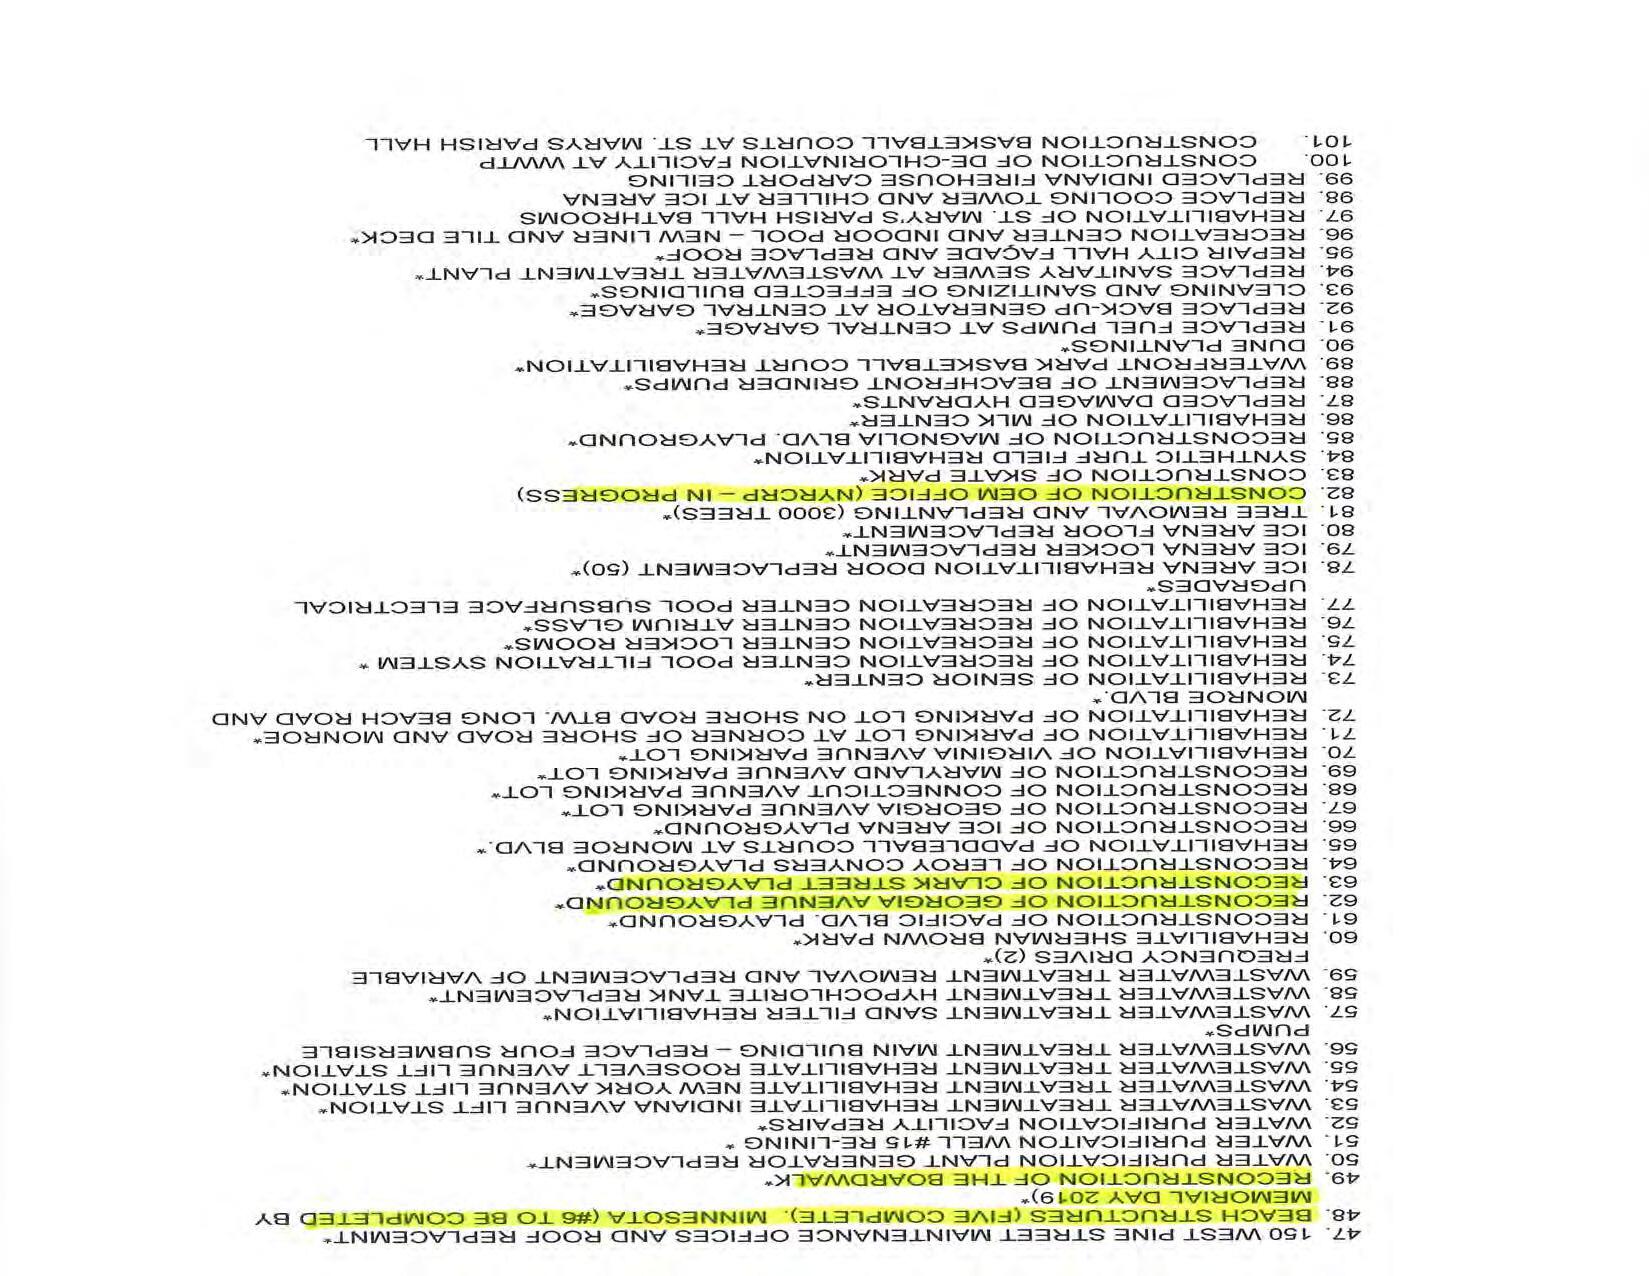
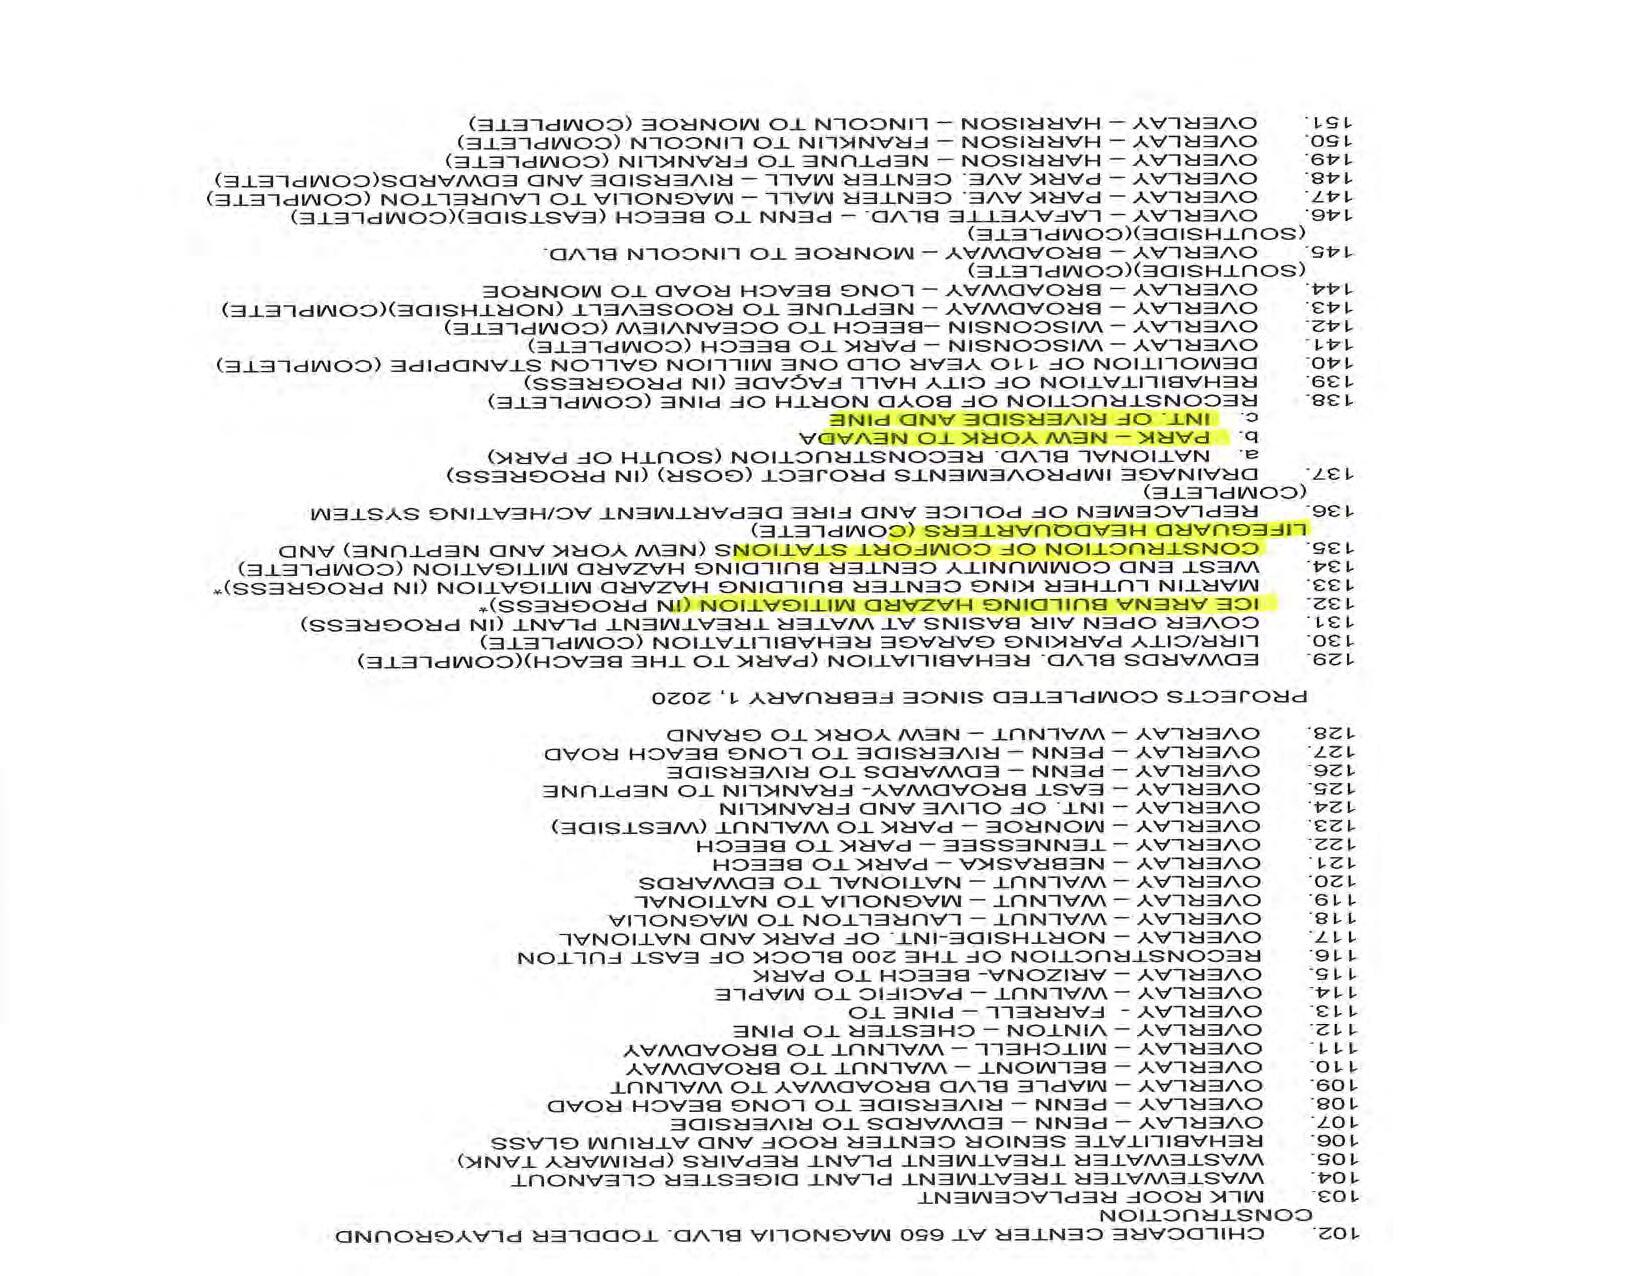

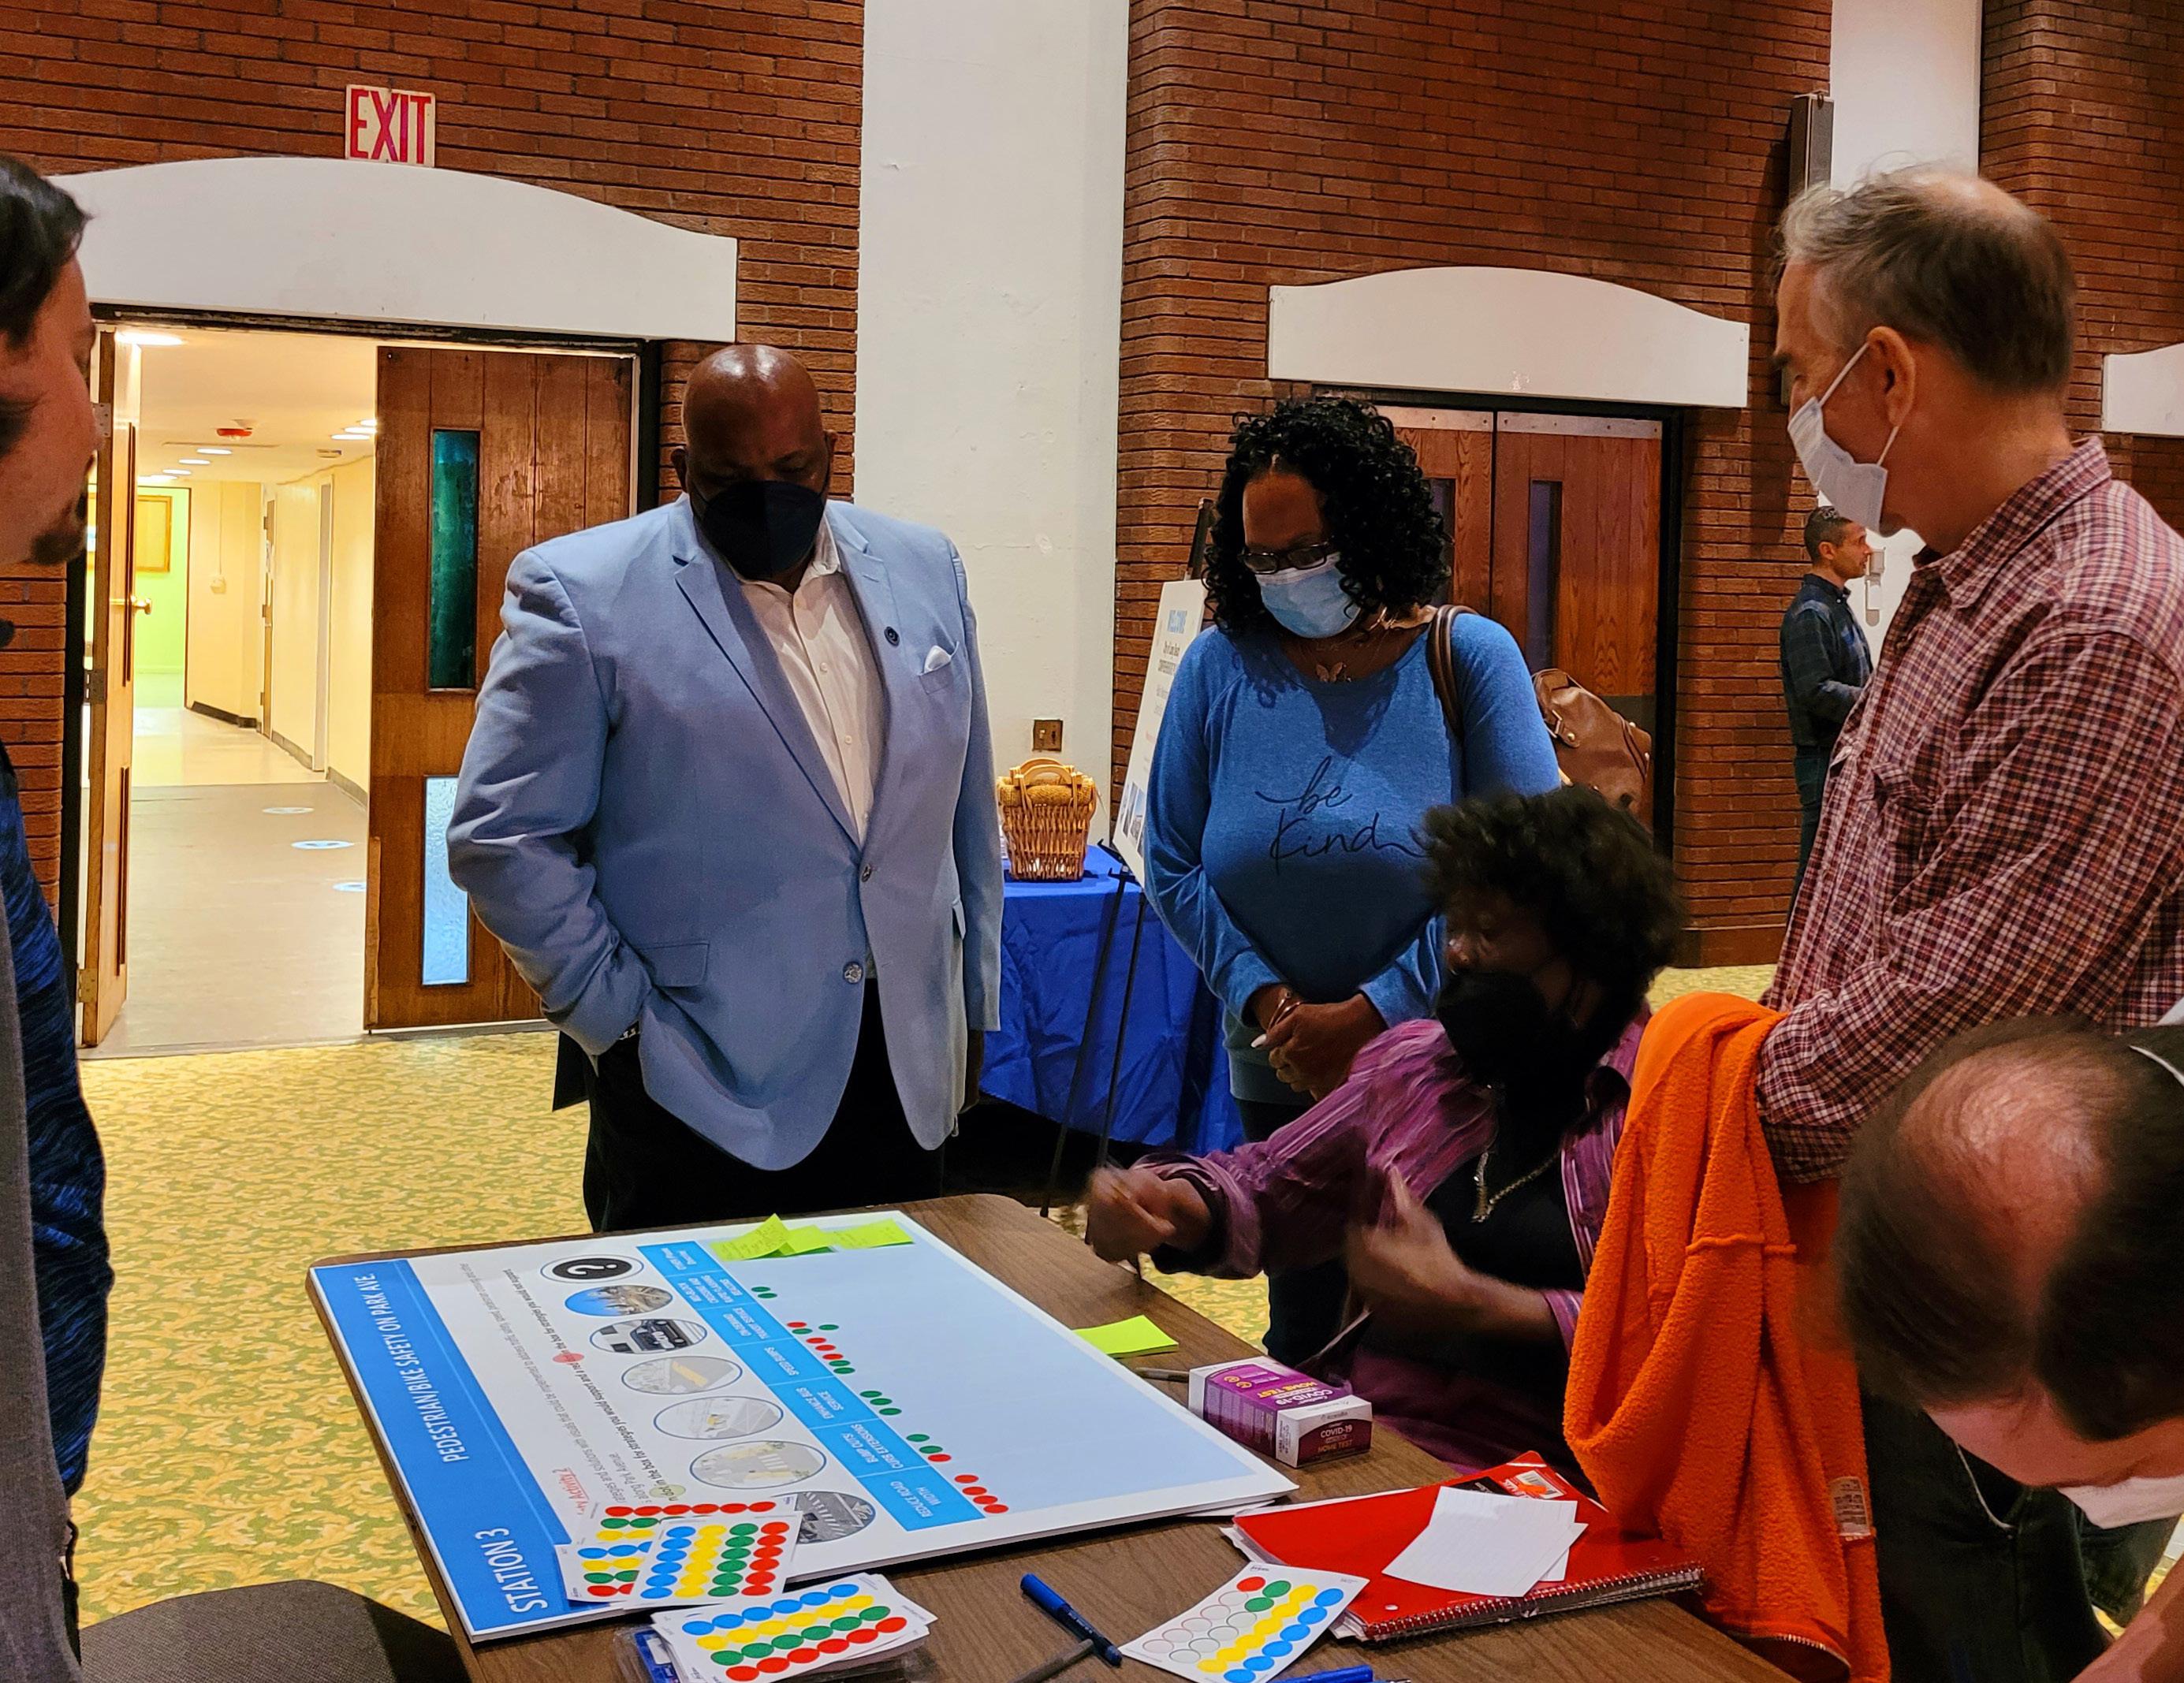
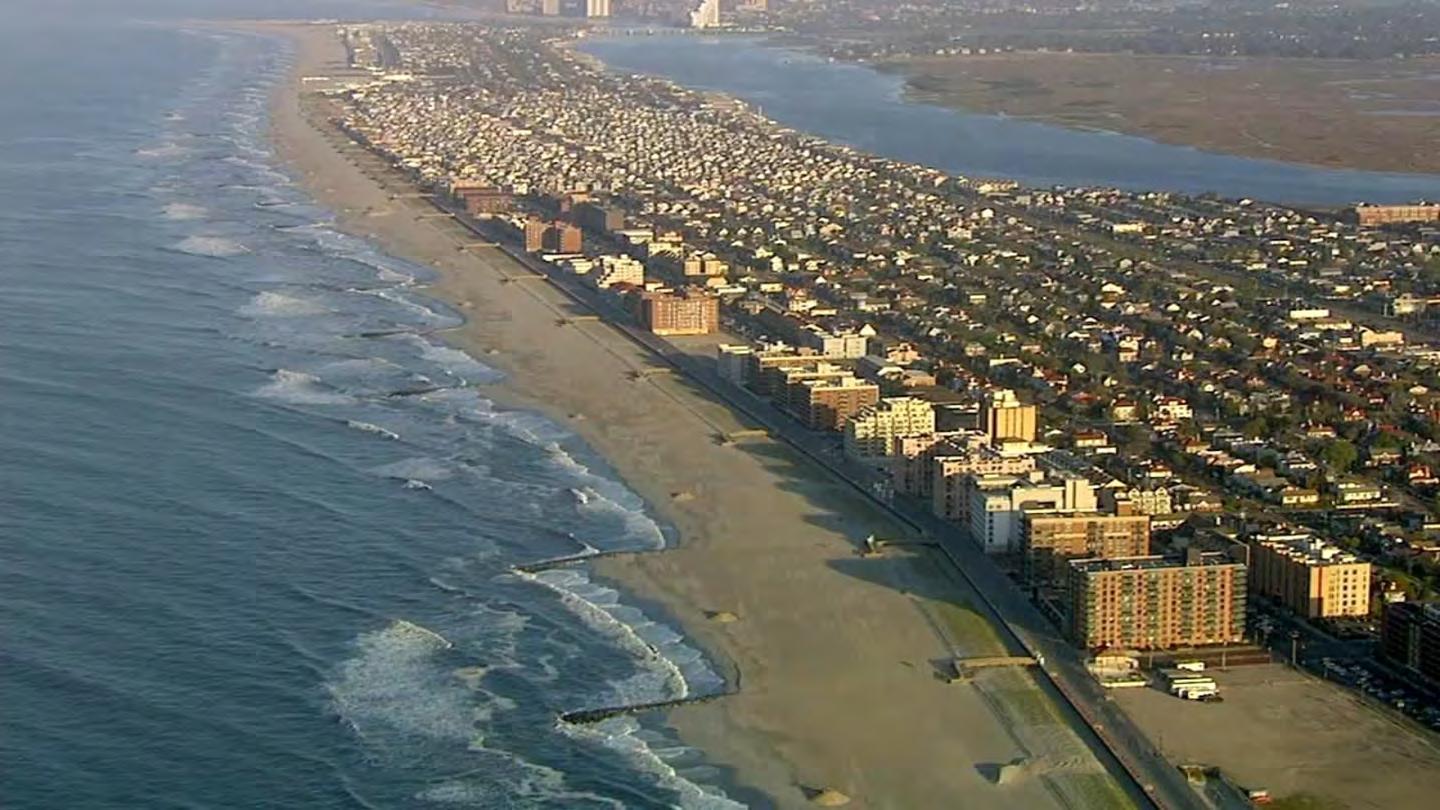

Most Long Beach survey respondents believe there is a good quality of life in Long Beach. 72.67% of respondents answered “good” or “excellent” for the question, “How would you rate the overall quality of life in Long Beach?” Below are 2022 community survey questions and results to be considered for the 2022 Comprehensive Plan update.
Question 15: How would you rate the overall quality of life in Long Beach?
Excellent: 18.10%
Good: 54.57%
Average: 23.17%
Poor: 3.89%
Very Poor: 0.27%
Most respondents (62.60%) see themselves living in Long Beach in a decade. The most common reason for why respondents don’t see themselves living in Long Beach in a decade is because of the cost of living (69.39%). Most respondents (87.25%) feel at least somewhat or an occasional connection with the community. Few respondents do not feel a connection to the community (11.67%). The Beach and Boardwalk play a very large role in why respondents choose to live/work in Long Beach (86.70% of respondents identified this as a reason). Below are 2022 community survey questions and results to be considered for the 2022 Comprehensive Plan update.
Question 11: Do you see yourself living in Long Beach 10 years from now?
Yes: 62.60%
No: 13.18%
Don’t know/not sure: 24.22%
Question 12: If you answered no to the previous question why don’t you see yourself living in Long Beach? (Check all that apply)
Move closer to family: 7.55%
Empty nest (children grow and no longer living at home): 6.73%
Commute (move closer to job): 2.45%
Cost of living in Long Beach: 69.39%
Lifestyle opportunities: 18.78%
School system: 10.83%
Other: 27.76%
Common answers:
Congested/overcrowding!!!!
No parking!!!!
Taxes!
Crime increasing!
Affordability / cost of living!
Warmer climate
Climate change
Lack of transportation
Noisy
Hurricane vulnerability
No hospital
No bay
Change in atmosphere and connectiveness to community
Feelings of city council prioritizing tourists over residents
Criticisms of city management
Work-related issues
Not dog-friendly enough
Too expensive
Too much construction
Mice
Retirement
Need more space
Needs more green space
Looking for larger home
Lack of upkeep for infrastructure
Litter
Question 13: In general, do you feel connected to and engaged with your community in Long Beach?
I feel very connected to and engaged with my community: 39.60%
I feel somewhat or occasionally connected to and engaged with my community: 47.65%
I don’t feel connected to or engaged with my community by choice: 3.80%
I don’t feel connected to or engaged with my community and I wish I did:
7.87%
Other: 1.08%
Common reasons for feeling disconnected from community in Long Beach:
Since Hurricane Sandy, major changes have decreased sense of community
No opportunity for input
Covid-19
No hospitals/quality medical care!
Political reasons
Loss of recreational classes (someone mentioned no longer having the arthritis water classes at the pool affecting their social experience)
Neighborhood relationships: people who have lived in Long Beach for a while feel new people are not neighbor-friendly New residents feel as though unless you grew up in LB/had family growing up there, you have little say
Example Quotes:
“Long Beach lost its sense of community. Feel disconnected where once felt very connected. Starbucks was the beginning of the end.”
“Too political to get involved”
“I did before Sandy feel very connected to neighbors. Unfortunately, many people new to the area are not neighborfriendly and I don’t even know who lives in many of the houses on my street.”
“If you aren’t someone who has had generational growing up here you don’t count”
“Covid-19 has put a dent in our socialization/community engagement plans, but we hope to get more involved when he rates decline”
Question 14: Please select the reasons you choose to live/work and continue to live/work in Long Beach
Born in Long Beach: 14.48%
Location/commute: 36.38%
Economic opportunities/development: 3.26%
School system: 9.50%
Sense of community: 46.06%
Downtown Long Beach: 20.27%
Quality of life: 55.02%
Culture and community character: 30.41%
Beach, boardwalk, and waterfront: 86.70%
City parks and recreational facilities: 20.54%
Affordability of housing: 3.62%
Access to public transportation: 23.44%
Close to family: 28.42%
Other: 5.16%
Partner grew up in Long Beach
Diversity/being from a minoritized group and feeling safe Grew up here
Work
Friends
Walkability/bikeability
Community amenities
Question 33: What do you like most about the City of Long Beach? (openended)
Common answers:
Beach, ocean!!!
Beach activities
Surfing
Boardwalk
Sense of community!!!
Diversity
Inclusivity
Friendly people
Safe, family-friendly community
Eclectic vibe
Small city feel
Events
Transportation
Biking culture
Walkability
LIRR
Businesses
Restaurants
Farmers market
Events/fairs
Music/art community
Natural environment
Proximity to NYC
Quality drinking water
Qualities of the town:
Peaceful
Quietness
Safety
Good temperature
Laid back vibe
Quotes:
“The city/suburban/beach vibe and community
“Local traditions (Polar Bear plunge, Electric Light Parade, Arts in the Plaza, concerts on the beach) that we’re excited to share with our kids”
“The strong bonds that people feel towards the city, the people and the natural beauty of this town.”
“I love being close to ocean and boardwalk which is very clean. Love to be able to walk/bike ride to most areas.”
“Long Beach has a small town community spirit that is unique. People from all backgrounds can enjoy living here together, and many often volunteer and donate their time, money and skills to the community. This makes us a happy city.”
“It's still a family friendly community where kids can still ride bicycles without parents worrying.”
Improved infrastructure is a change that Long Beach survey respondents would like to see in the future. 40.87% of respondents selected “improved roadways, drainage, utilities, and other infrastructure” as a response to the question, “What change would do the most to create the City you want in the future?” Below are 2022 community survey questions and results to be considered for the 2022 Comprehensive Plan update.
Question 34: What change would do the most to create the City you want in the future?
New housing choices: 9.33%
New employment opportunities:
2.94%
More restaurants, shops, and entertainment: 10.14%
Improved roadways, drainage, utilities and other infrastructure: 40.87%
Improved parks and recreation facilities: 7.10%
Enhanced historic preservation: 2.13%
Enhanced youth services and programs: 3.55%
Enhanced arts and cultural offerings:
7.40%
Other (please specify): 16.53%
Common answers
Transportation Parking
Address doubleparking issue
Bike lanes/infrastructure
Improved road infrastructure
Appearance/Aesthetic
Cleaning up litter Climate
Change work
Green energy
Improved parks
Better schools
Addressing double parking Dogfriendly
Lower taxes
Addressing/taxing Airbnb/VRBO
Addressing illegal twofamily/multifamily homes
(illegal renting)
Avoiding overdevelopment/less crowding
More art/cultural activities and offerings
Youth/teen services
More employment offerings
Affordable housing
More stores/shopping/restaurants/ entertainment
Recreational marijuana
Survey respondents believe that there are not enough affordable senior housing (age restricted) and affordable housing options in Long Beach. 52.26% of respondents believe there are not enough affordable senior housing options that are age-restricted while 47.58% of respondents believe there are not enough general affordable housing options. Below are 2022 community survey questions and results to be considered for the 2022 Comprehensive Plan update.
Question 9: What type of housing do you see yourself living in 10 years from now?
In my current home: 56.80%
In a larger single-family home: 17.39%
In a smaller single-family home: 7.09%
In senior housing: 2.64%
In an apartment: 6.35%
In a condominium or townhouse: 9.73%
Question 10: Does Long Beach have too many, about the right amount, or not enough of the following housing types:
Small, single-family homes
Too many: 6.48%
About the right amount: 70.42%
Not enough: 23.10%
Large, single-family homes
Too many: 15.40%
About the right amount: 72.06%
Not enough: 12.53%
Two-family homes
Too many: 27.08%
About the right amount: 55.56%
Not enough: 17.36%
Condominiums or townhouses
Too many: 40.66%
About the right amount: 47.66%
Not enough: 11.68%
Apartments
Too many: 35.87%
About the right amount: 45.55%
Not enough: 18.58%
Affordable senior housing (age restricted)
Too many: 8.00%
About the right amount: 39.74%
Not enough: 52.26%
Affordable housing (not age restricted)
Too many: 17.47%
About the right amount: 34.95%
Not enough: 47.58%
Assisted living facilities
Too many: 16.77%
About the right amount: 60.09%
Not enough: 23.14%
According to survey responses and open-ended answers, biking safety, cross-walk safety, parking, diversity of businesses, and aesthetics are major areas of concern in Long Beach’s commercial corridors. Below are 2022 community survey questions and results to be considered for the 2022 Comprehensive Plan update.
Question 19: How do you feel about the following statements about Long Beach’s Central Business District (Park Avenue)?
There is a good mix of shops, restaurants, offices, and amenities
Agree: 66.88%
Neutral: 19.30%
Disagree: 13.82%
It is thriving
Agree: 38.13%
Neutral: 42.99%
Disagree: 18.88%
It is visually attractive
Agree: 24.88%
Neutral: 35.30%
Disagree: 39.81%
It is within walking distance of my home
Agree: 66.85%
Neutral: 15.98%
Disagree: 17.17%
I feel comfortable walking to Park Avenue
Agree: 76.03%
Neutral: 15.10%
Disagree: 8.88%
I feel comfortable crossing Park Avenue
Agree: 49.55%
Neutral: 19.05%
Disagree: 31.41%
I feel comfortable biking on Park Avenue
Agree: 11.14%
Neutral: 18.86%
Disagree: 70.01%
Sidewalks are safe and adequate
Agree: 37.32%
Neutral: 32.35%
Disagree: 30.32%
Parking is easy
Agree: 15.81%
Neutral: 19.47%
Disagree: 64.71%
The buildings feel appropriate in size relative to the setting
Agree: 52.08%
Neutral: 30.62%
Disagree: 17.3%
They are easily accessible by public transportation
Agree: 53.65%
Neutral: 34.88%
Disagree: 11.47%
There are entertainment and cultural attractions
Agree: 39.87%
Neutral: 28.82%
Disagree: 31.31%
Other Safety
Common answers: Aesthetics
Uniform/attractive store facades
Too much trash
Needs more sanitation
Needs more trash cans
More decorations and horticultural upkeep
Businesses
Needs to be a cultural venue (have cultural attractions)
More entertainment/ music/bookstore/café
Farmer’s market lacking
Vacant stores in shopping center where Rite Aid and Stop and Shop are Needs more diverse businesses (too many bars and nail salons)
People seem to think Bright Eye Beer was a good addition
Outdoor dining
Movie theater reopened
Hardware store
High quality stores
Nightlife
Longer pedestrian traffic lights needed across Park Ave!!!!!!
More supervision/patrolling on foot
More signage for walking/don’t walk signs needed
Need to enforce no biking on sidewalks
Potholes and sunken spots in roads
Bike Infrastructure
Places to park bike
Bike lane (very dangerous) on Park Ave should be added
Parking
More parking
Double parking issue Buildings
Too much
development/overbuilding apartments
Do not like Superblock
Post office box on south side of Park Ave Activities
More multi-cultural events
Teen activities
Question 20: How do you feel about the following statements about Long Beach’s West End Business District?
There is a good mix of shops, restaurants, offices, and amenities
Agree: 68.46%
Neutral: 20.78%
Disagree: 10.76%
It is thriving
Agree: 65.11%
Neutral: 27.71%
Disagree: 7.18%
It is visually attractive
Agree: 43.10%
Neutral: 32.74%
Disagree: 24.16%
It is within walking distance of my home
Agree: 43.26%
Neutral: 13.67%
Disagree: 43.07%
I feel comfortable walking to Beach Street
Agree: 67.98%
Neutral: 17.80%
Disagree: 14.22%
Agree: 48.97%
Neutral: 28.93%
Disagree: 22.10%
Sidewalks are safe and adequate Parking is easy
Agree: 3.53%
Neutral: 7.61%
Disagree: 88.85%
The buildings feel appropriate in size relative to the setting
Agree: 57.50%
Neutral: 28.52%
Disagree: 13.98%
They are easily accessible by public transportation
Agree: 44.18%
Neutral: 37.56%
Disagree: 18.26%
There are entertainment and cultural attractions
Agree: 37.98%
Neutral: 32.52%
Disagree: 29.51%
Common answers: Other
Aesthetics: Garbage needs to be cleaned
Too noisy
Sidewalks too narrow and crowded, taken up by restaurants
More trees/horticulture
Activities: Night life can be too rowdy
Needs more variety (limited to bars)
Safety:
More patrolling at night Difficult to cross street
Businesses: Needs better variety (limited to bars, no culture)
More art
Biking: More places to park bike
Transit: Needs more public transit at night Needs better public transit in the area in general Needs more parking
Question 21: What is your current employment status?
Employed full-time: 64.44%
Employed part-time: 7.40%
Student: 0.46%
Not employed: 1.01%
Retired: 20.48%
Stay-at-home parent: 3.29%
Other: 2.93%
Common answers:
Self-employed
Business owner
On medical disability
Working multiple jobs
Employed part-time and stay-at-home parent
Question 23: If you do work, where do you work?
Long Beach: 22.17%
Manhattan: 17.19%
Queens: 6.45%
Brooklyn: 2.26%
Town of Hempstead: 6.79%
Elsewhere in Nassau County: 19.23%
Suffolk County: 3.17%
Bronx: 1.24%
Work from home: 12.56%
Other: 8.94%
Common answers:
Hybrid
New Jersey
Oceanside
All over NY state
Westchester County
Nassau and Suffolk County
All over Long Island
Mineola
Question 24: Please select whether you agree or disagree with the following statements regarding economic development:
Long Beach has a good blend of residential, commercial, and industrial uses
Agree: 54.74%
Neutral: 29.92%
Disagree: 15.34%
Long Beach should grow its tax base through additional commercial development
Agree: 48.44%
Neutral: 24.22%
Disagree: 27.35%
Long Beach should grow its tax base through further industrial development
Agree: 22.74%
Neutral: 23.97%
Disagree: 53.30%
Long Beach should increase housing supply to support the local economy
Agree: 37.56%
Neutral: 24.50%
Disagree: 37.94%
Business Districts should be a central focus of development
Agree: 61.51%
Neutral: 27.70%
Disagree: 10.79%
Long Beach should develop vacant parcels along the Bayfront
Agree: 60.68%
Neutral: 19.28%
Disagree: 20.04%
Question 25: In general, which statement most accurately describes where you shop for goods and services?
I frequently leave Long Beach for shopping/dining: 29.90%
I primarily shop/dine in Long Beach: 28.10%
I spend an equal amount of time shopping/dining in Long Beach as I do elsewhere: 42.10%
Question 26: If you choose where to see more concentration of business development/activity in Long Beach, where would you like to see it occur?
Central Business District (Park Avenue): 48.95%
West End: 4.30%
At the beach/boardwalk: 35.09%
Other (please specify): 11.66%
Common answers:
Bayfront/waterfront!!
East end!!
Hospital area
Use vacant buildings before development
North Park/Riverside behind Stop & Shop
Many respondents do not support development
Park Ave
North Park
Question 27: What types of businesses would you like to see more of in Long Beach?
Neighborhood goods/services: 31.06%
Food and beverage: 17.16%
General merchandise, apparel, soft goods, furnishings, etc.: 37.10%
Other (please specify): 14.67%
Common answers:
More diverse restaurants (outside of Italian food) !!
Bakery
Ice cream
Hardware store
Local businesses !
Long Beach merchandise store
Waterfront dining
CBD/cannabis store !!
Community gathering areas
General merchandise stores (furniture stores, soft goods, apparel, shoes, hair supplies etc) !!
Book stores
Grocery store
Offices
Upscale restaurants
Minority-owned businesses !!
Black owned business
Beauty/barber shops
Restaurants
Grocery stores
Businesses for people of color
Entertainment for kids and families
Mini-golf
Bowling alley !!
Arcade theater
Rock climbing
Indoor skate park/roller rink
Art galleries
Live music venue
Dietary-specific restaurants
Vegan Kosher
Locally-grown/organic
No residential development
Long Beach survey responders primarily drive alone to work (59.00%) while most respondents only ride the LIRR a few times per year (52.16%) and never (67.45%) use the Long Beach bus service. Improving and managing parking throughout the city is a priority of Long Beach survey respondents. Among the suggested improvements to Long Beach’s transportation system in the survey, improving and managing parking throughout the City received the highest percentage of respondents selecting “most important.” Below are 2022 community survey questions and results to be considered for the 2022 Comprehensive Plan update.
Question 22: If you do work, what is your primary travel mode to work?
Drive alone: 59.00%
Carpool of vanpool: 1.37%
Long Island Railroad (LIRR): 17.88%
NICE bus: 0.68%
Long Beach bus system: 0.34%
Bicycle: 2.51%
Walk: 3.30%
Work from home: 14.46%
Hired service (Taxi, uber, car service, etc.): 0.46%
Question 28: How often do you use the Long Island Railroad? (In pre-and post- COVID times)
Almost every day: 7.06%
A few times per week: 9.71%
A few times per month: 18.24%
A few times per year: 52.16%
Never: 12.84%
Question 29: How often do you use the Long Beach bus service? (in preand post-COVID times)
Almost every day: 1.77%
A few times per week: 3.15%
A few times per month: 6.19%
A few times per year: 21.44%
Never: 67.45%
Question 30: Which improvements to Long Beach’s transportation system are most important? (1 is most important)
Planning for new technologies, such as EV charging stations, ridesharing drop-off ones, etc.
1: 12.40%
2: 8.61%
3: 12.63%
4: 14.81%
5: 17.80%
6: 33.75%
Improving and expanding the bicycle network and bike safety
1: 22.36%
2: 24.77%
3: 18.58%
4: 12.84%
5: 12.39%
6: 9.06%
Reducing traffic congestion
1: 18.51%
2: 20.28%
3: 21.82%
4: 19.46%
5: 12.15%
6: 7.78%
Making it safer and easier to walk around- sidewalk and streetscape improvements
1: 14.14%
2: 20.63%
3: 22.25%
4: 21.31%
5: 13.90%
6: 7.76%
Improve public transportation throughout Long Beach including to the West End, Recreation Center, LIRR Station, Beach/Boardwalk and East End
1: 7.50%
2: 11.36%
3: 14.55%
4: 18.41%
5: 26.24%
6: 21.94%
Improve and manage parking throughout the city
1: 34.43%
2: 17.16%
3: 13.14%
4: 10.91%
5: 11.55%
6: 12.82%
Question 31: If you could add more parking in Long Beach, where would you want to see it located?
Common answers Locations
West End !!!!!!
Central !!
Near the beach !!
Medians on boulevards
On Broadway
Along Park Ave
Shore Road
Westholme
East End President streets
Near train station
Other parking suggestions
Discounted meter rates for local residents
Single level lots could have 2 levels to improve number of spaces but not obstruct views
Parking garage linked with public transit
“use lines to demarcate parking spaces; create diagonal parking in areas where possible; consider diagonal parking on one side of beech st in west end”
Residents should be given priority over out-of-towners
“Along Park Ave, have meters and/or Long beach residential stickers. Near the beach, limit some spaces for LB residents only. I often cannot park on Penn St at 10 am in the summer on a Sunday to go to church because beachgoers have takes all the spots.”
MANY other suggestions
The Long Beach survey respondents believe that most community facilities are adequate or excellent. However, many respondents find that city infrastructure needs improvement. The following facilities or services had the highest percentage of respondents selecting “needs improvement” out of the options, “excellent”, “adequate”, “needs improvement”, and “no opinion/don’t know”: local road maintenance (78.38%), sidewalk conditions (63.79%), bike lanes (63.62%), parking (79.30%), and code enforcement (36.95%). Below are 2022 community survey questions and results to be considered for the 2022 Comprehensive Plan update.
Question 16: How would you rate the quality of each of the following facilities or services in the City?
Long Beach Public Schools
Excellent: 18.94%
Adequate: 31.47%
Needs Improvement: 19.21%
No opinion/Don’t know: 30.38%
Long Beach Public Library
Excellent: 32.36%
Adequate: 39.00%
Needs Improvement: 11.91%
No opinion/Don’t know: 16.73%
Recreation programs/special events
Excellent: 26.25%
Adequate: 40.93%
Needs Improvement: 23.43%
No opinion/Don’t know: 9.39%
Police Department
Excellent: 24.55%
Adequate: 44.09%
Needs Improvement: 24.36%
No opinion/Don’t know: 7.00%
Fire Department
Excellent: 46.49%
Adequate: 36.65%
Needs Improvement: 6.93%
No opinion/Don’t know: 9.94%
Senior services and programs
Excellent: 7.25%
Adequate: 29.57%
Needs Improvement: 17.63%
No opinion/Don’t know: 45.55%
Public transportation
Excellent: 18.83%
Adequate: 45.98%
Needs Improvement: 19.10%
No opinion/Don’t know: 16.09%
Local road maintenance
Excellent: 2.27%
Adequate: 18.17%
Needs Improvement: 78.38%
No opinion/Don’t know: 1.18%
Sidewalk conditions
Excellent: 3.37%
Adequate: 32.21%
Needs Improvement: 63.79%
No opinion/Don’t know: 0.64%
Parks/playgrounds
Excellent: 13.31%
Adequate: 44.76%
Needs Improvement: 31.36%
No opinion/Don’t know: 10.57%
Bike lanes
Excellent: 3.47%
Adequate: 24.50%
Needs Improvement: 63.62%
No opinion/Don’t know: 8.41%
Parking
Excellent: 2.11%
Adequate: 16.48%
Needs Improvement: 79.30%
No opinion/Don’t know: 2.11%
Commerce
Excellent: 7.86%
Adequate: 32.38%
Needs Improvement: 19.61%
No opinion/Don’t know: 40.15%
Beach
Excellent: 59.18%
Adequate: 30.36%
Needs Improvement: 9.73%
No opinion/Don’t know: 0.73%
Boardwalk
Excellent: 59.18%
Adequate: 30.18%
Needs Improvement: 10.09%
No opinion/Don’t know: 0.55%
Permitting and licensing services
Excellent: 3.39%
Adequate: 27.08%
Needs Improvement: 26.17%
No opinion/Don’t know: 43.37%
Code Enforcement Sanitation
Excellent: 3.77%
Adequate: 31.34%
Needs Improvement: 36.95%
No opinion/Don’t know: 27.94%
Excellent: 43.44%
Adequate: 37.80%
Needs Improvement: 15.66%
No opinion/Don’t know: 3.10%
Question 35: How do you find out about community events?
Newspaper (Long Island Herald or Newsday): 25.33%
Social media (facebook, twitter, etc.): 70.30%
City website: 35.50%
City email blasts: 24.01%
Word of mouth: 42.73%
Other (please specify): 4.68%
Common answers:
Friends
Chamber of Commerce Emails
Instagram Patch.com
Mailings
Library
Flyer
LB Yearly Calendar
Church
City Council/Civic Meetings
Community Groups
Survey respondents have expressed wanting a performing arts center or more community events targeted towards all different age groups. Specifically, 36.95% of survey respondents have answered there are too few recreational programs for adults. Respondents also mentioned needing safer bike lanes and areas to bike (45.15% of people answer “too few” for the places to bike, skate, or skateboard in Long Beach. Below are 2022 community survey questions and results to be considered for the 2022 Comprehensive Plan update.
Question 17: Does Long Beach have too many, about the right amount, or too few of the following:
Multi-purpose fields (soccer, football, lacrosse)
Too Many: 0.18%
About the right amount: 42.84%
Too Few: 29.82%
Don’t know: 27.16%
Ball fields (baseball and softball)
Too Many: 0.09%
About the right amount: 45.64%
Too Few: 26.91%
Don’t know: 27.36%
Tennis courts
Too Many: 0.46%
About the right amount: 33.52%
Too Few: 35.08%
Don’t know: 30.94%
Basketball courts
Too Many: 1.01%
About the right amount: 40.24%
Too Few: 25.97%
Don’t know: 32.78%
Playgrounds and playscapes
Too Many: 0.28%
About the right amount: 55.75%
Too Few: 28.89%
Don’t know: 15.09%
Places to bike, skate, or skateboard
Too Many: 0.82%
About the right amount: 40.20%
Too Few: 45.15%
Don’t know: 13.83%
Recreational programs for young children
Too Many: 0.83%
About the right amount: 39.06%
Too Few: 20.50%
Don’t know: 39.61%
Recreational programs for teens
Too Many: 0.28%
About the right amount: 20.35%
Too Few: 31.95%
Don’t know: 47.42%
Recreational programs for adults
Too Many: 0.46%
About the right amount: 32.35%
Too Few: 36.95%
Don’t know: 30.24%
Recreational programs for seniors
Too Many: 1.01%
About the right amount: 22.29%
Too Few: 28.72%
Don’t know: 47.98%
Question 18: Are there any community amenities, recreational facilities, or services that Long Beach is lacking? (Open-ended)
Community Amenities
Performance center !!
Art, cultural, and musical amenities
Bay access Hospital
Dog park
Community gardens/green
roofs/green space
Trees
Places to drink alcohol on the beach
Recreational Facilities
Tennis/pickle ball courts
Outdoor communal areas
Outdoor pool
Services
Workforce development focus on environmental conservation, renewables, offshore wind, and urban planning
Free shuttles
Street cleaning / Trash management
More community events and proper advertising for them
Adult programming
Teen leadership activities
Teen center activities for younger kids
Swimming lessons
Homelessness services
Veterans services
Infrastructure
Safer bike lanes
Enforcement of not riding bikes on sidewalks
Safer pedestrian walkways
Bike racks
MANY more suggestions
[No Survey Questions Related]
Survey respondents listed as a priority the need to prevent flooding and storm surges due to sea level ride and climate change. Many of the open-answered responses supported putting effort into all suggested preservation action steps. Below are 2022 community survey questions and results to be considered for the 2022 Comprehensive Plan update.
Question 32: What is the most important action needed to preserve Long Beach’s environment and protect the City from future storms?
Prevent flooding due to sea level rise, storm surges and daily flooding events: 38.48%
Transition to renewable energy and reduce the City’s carbon footprint: 4.77%
Improve water quality: 11.88%
Protect the sources of drinking water (Lloyd Aquifer): 7.92%
Improve the City’s infrastructure (roads, bulkheads, public water, sewer, etc.): 28.43%
Encourage homeowners to adopt green infrastructure such as rain gardens, rain barrels, porous pavement, etc.: 2.34%
Other (please specify): 6.19%
Common answers:
All of the above !!!
Drinking water !!
Water quality
Bulkhead between Monroe and Franklin Keep robust marshland and berms
Garbage concerns
Limit impermeable surfaces, improve hard surface drainage Stop overdevelopment
[No Survey Questions Related]
Below are 2022 community survey questions and results to be considered for the 2022 Comprehensive Plan update.
Question 36: Would you be interested in attending a public workshop related to this planning process?
Yes: 48.12%
No: 15.53%
Unsure: 36.35%
Below are 2022 community survey questions and results from select open-ended questions to be considered for the 2022 Comprehensive Plan update tallied by Long Beach staff. Results are recorded as number of responses, not percentages.
Question 3: Which of the following statements best describes your relationship to Long Beach?
I live in Long Beach full time: 1016
I live in Long Beach part time/seasonally: 69
I work in Long Beach: 77
I both live and work: 197
I am a visitor to Long Beach: 37
I own a business in Long Beach: 76
I own a residential property in Long Beach other than my home: 83
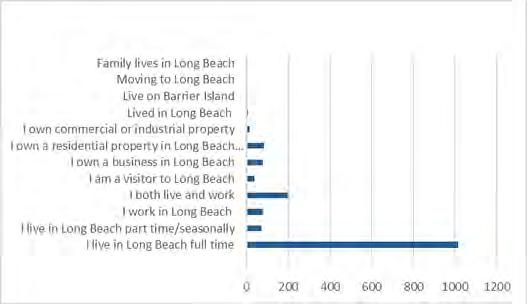
I own commercial or industrial property: 13
Lived in Long Beach: 6
Live on Barrier Island: 2
Moving to Long Beach:
Family lives in Long Beach: 2
Question 6: Please describe who lives in your household
I live alone: 317
Couple with no children: 354
Couple with no children under the age of 18 at home: 162
Couple with children under the age of 18 living at home: 291
Single-parent with children under the age of 18: 40
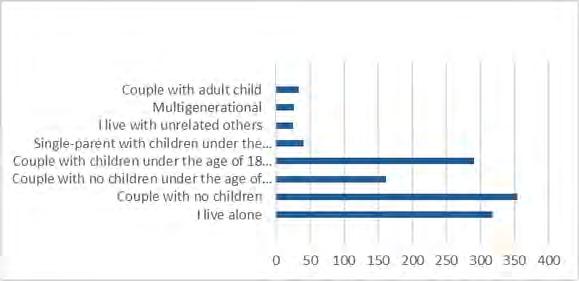
I live with unrelated others: 25
Multigenerational: 27
Couple with adult child: 33
Question 7: Which type of housing do you currently live in?
Single-family home: 617
Two-family, three-family or 4-family home: 188
Condominium or townhome: 184
Apartment: 173
Assisted living or senior housing: 6
Co-op: 38
Question 8: Do you own or rent your current home?
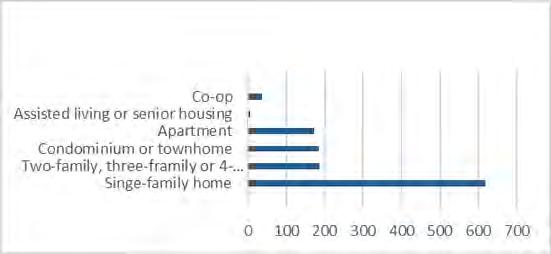
Own: 956
Rent: 251
Co-op: 5
Family owns: 4
Question 12: If you answered no to the previous question, why don't you see yourself living in Long Beach?
Move closer to family: 37
Empty nest: 34
Commute: 13
Cost of Living: 373
Lifestyle Opportunities: 196
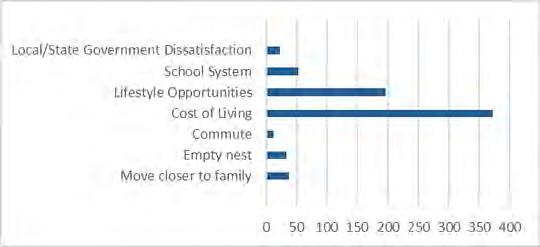
School System: 53
Local/State Government Dissatisfaction: 23
Question 13: In general, do you feel connected to and engaged with your community in Long Beach?
I feel very connected to an engage with my community: 438 I feel somewhat or occasionally connected to an engaged with my community: 528

I don't feel connected to or engaged with my community by choice: 44
I don’t feel connected to or engaged with my community, and I wish I did: 90 I've felt previously connected and engaged with my community, but no longer: 8
Question 14: Please select the reason you choose to live/work and continue to live/work in Long Beach.
Born in Long Beach: 160
Location/commute: 405
Economic Opportunities/ Development: 36
School System: 107
Sense of community: 616
Downtown Long Beach: 224
Quality of life: 608
Culture and community character: 337
Beach, boardwalk and waterfront: 959
City parks and recreational facilities: 267
Affordability of housing: 41
Access to public transportation: 259
Close to family/friends: 322
Question 18: Are there any community amenities, recreational facilities, or services that Long Beach is lacking?
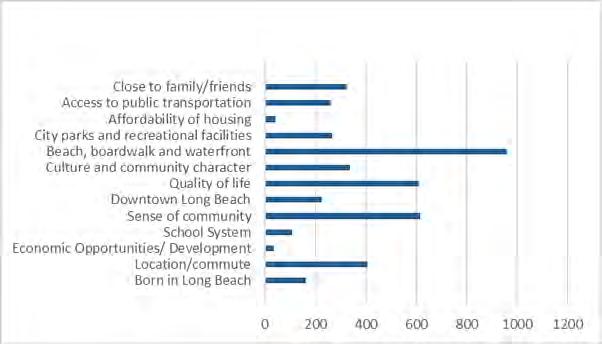
Outdoor Pool: 93
Youth Services/Programs: 39
Dog Friendly Amenities: 58
Bike Lanes: 60
Bike Racks: 29
Hospital: 2
Amusements/Entertainment (Bowling, Arcade, Movie Theater, Roller Rink, etc.): 49
Pickle Ball/Tennis Court: 23
Shaded Area on Boardwalk: 7
Cultural Resources (Performing Center, Arts Center, Galleries, etc.): 40
Boat Docks, Piers, Marinas, Kayaks, Canoes, etc.: 8
Boardwalk and Waterside Dining: 32
Senior Services/Programs: 40
E-mobilitiy Amenities: 9
Shuttle/Trolley Service: 13
Improved Signage/Aesthetics: 3
Green Space (Benches, Parks, Picnics, Trees, Open Space, Grass): 39
Improved Sanitation: 37
Pedestrian Friendly Events/Development: 14
Adult Services/Programs: 21
Law Enforcement: 20
Parking: 25
Beach Furniture: 9
Retail: 9
Bayfront Activities: 10
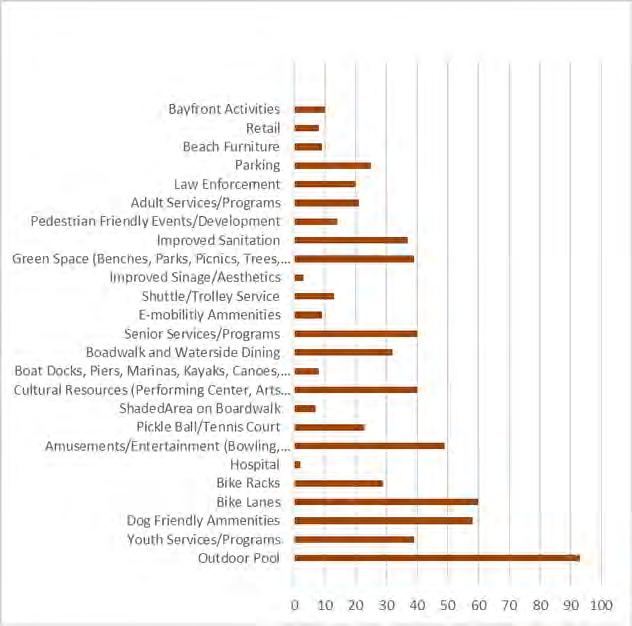
Question 27: What types of businesses would you like to see more of in Long Beach?
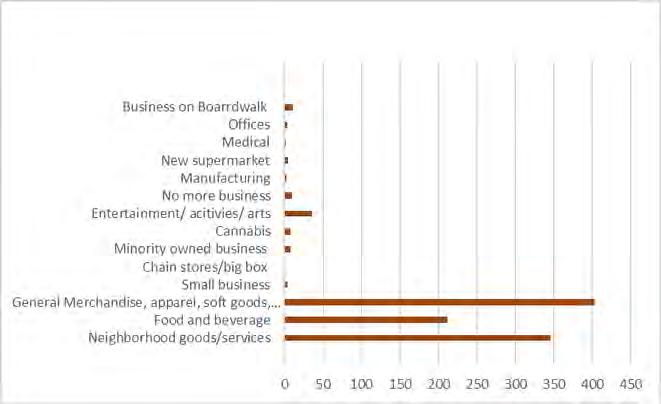
Neighborhood goods/services: 346
Food and beverage: 212
General Merchandise, apparel, soft goods, furnishings, etc.: 403
Small business: 4
Chain stores/big box: 1
Minority owned business: 8
Cannabis: 8
Entertainment/ activities/ arts: 36
No more business: 10
Manufacturing: 3
New supermarket: 5
Medical: 2
Offices: 4
Business on Boardwalk: 11
Question 31: If you could add more parking in Long Beach, where would you want to see it located?
West End: 309
Central: 68
Boardwalk/Beach: 263
LIRR/Park Ave Central/Stop and Shop/City Hall: 107
East End: 52
Neptune/Pacific: 3
Vacant Lots/Parking Garage: 63
No More Parking/Stricter regulations: 31
Everywhere: 47
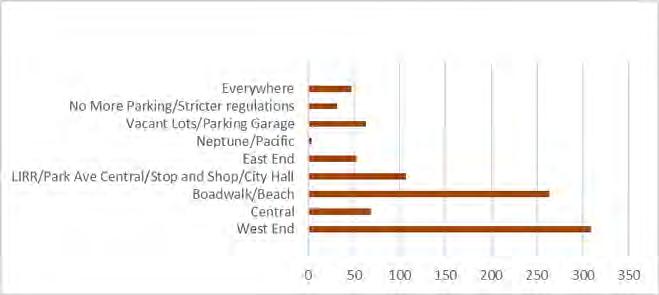
Question 32: What is the most important action needed to preserve Long Beach's environment and protect the City from future storms?
Prevent flooding due to sea level rise, storm surges and daily flooding
events: 382
Transition to renewable energy and reduce the city's carbon footprint: 48
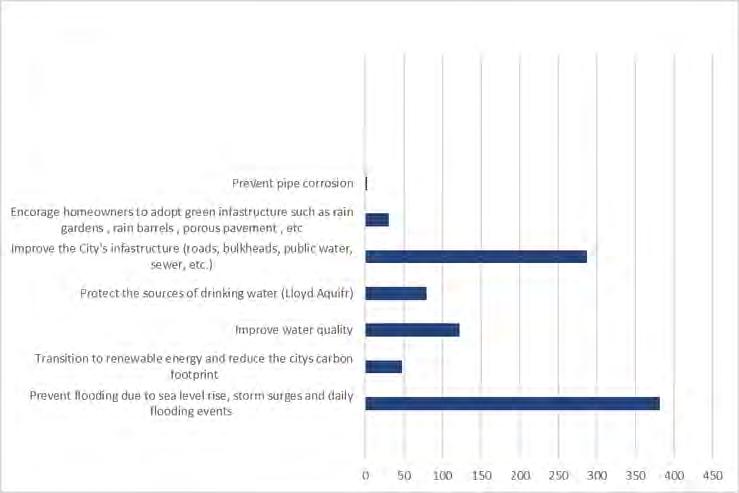
Improve water quality: 122
Protect the sources of drinking water (Lloyd Aquifer): 79
Improve the City's infrastructure (roads, bulkheads, public water, sewer, etc.): 287
Encourage homeowners to adopt green infrastructure such as rain gardens, rain barrels, porous pavement , etc.: 30
Prevent pipe corrosion: 2
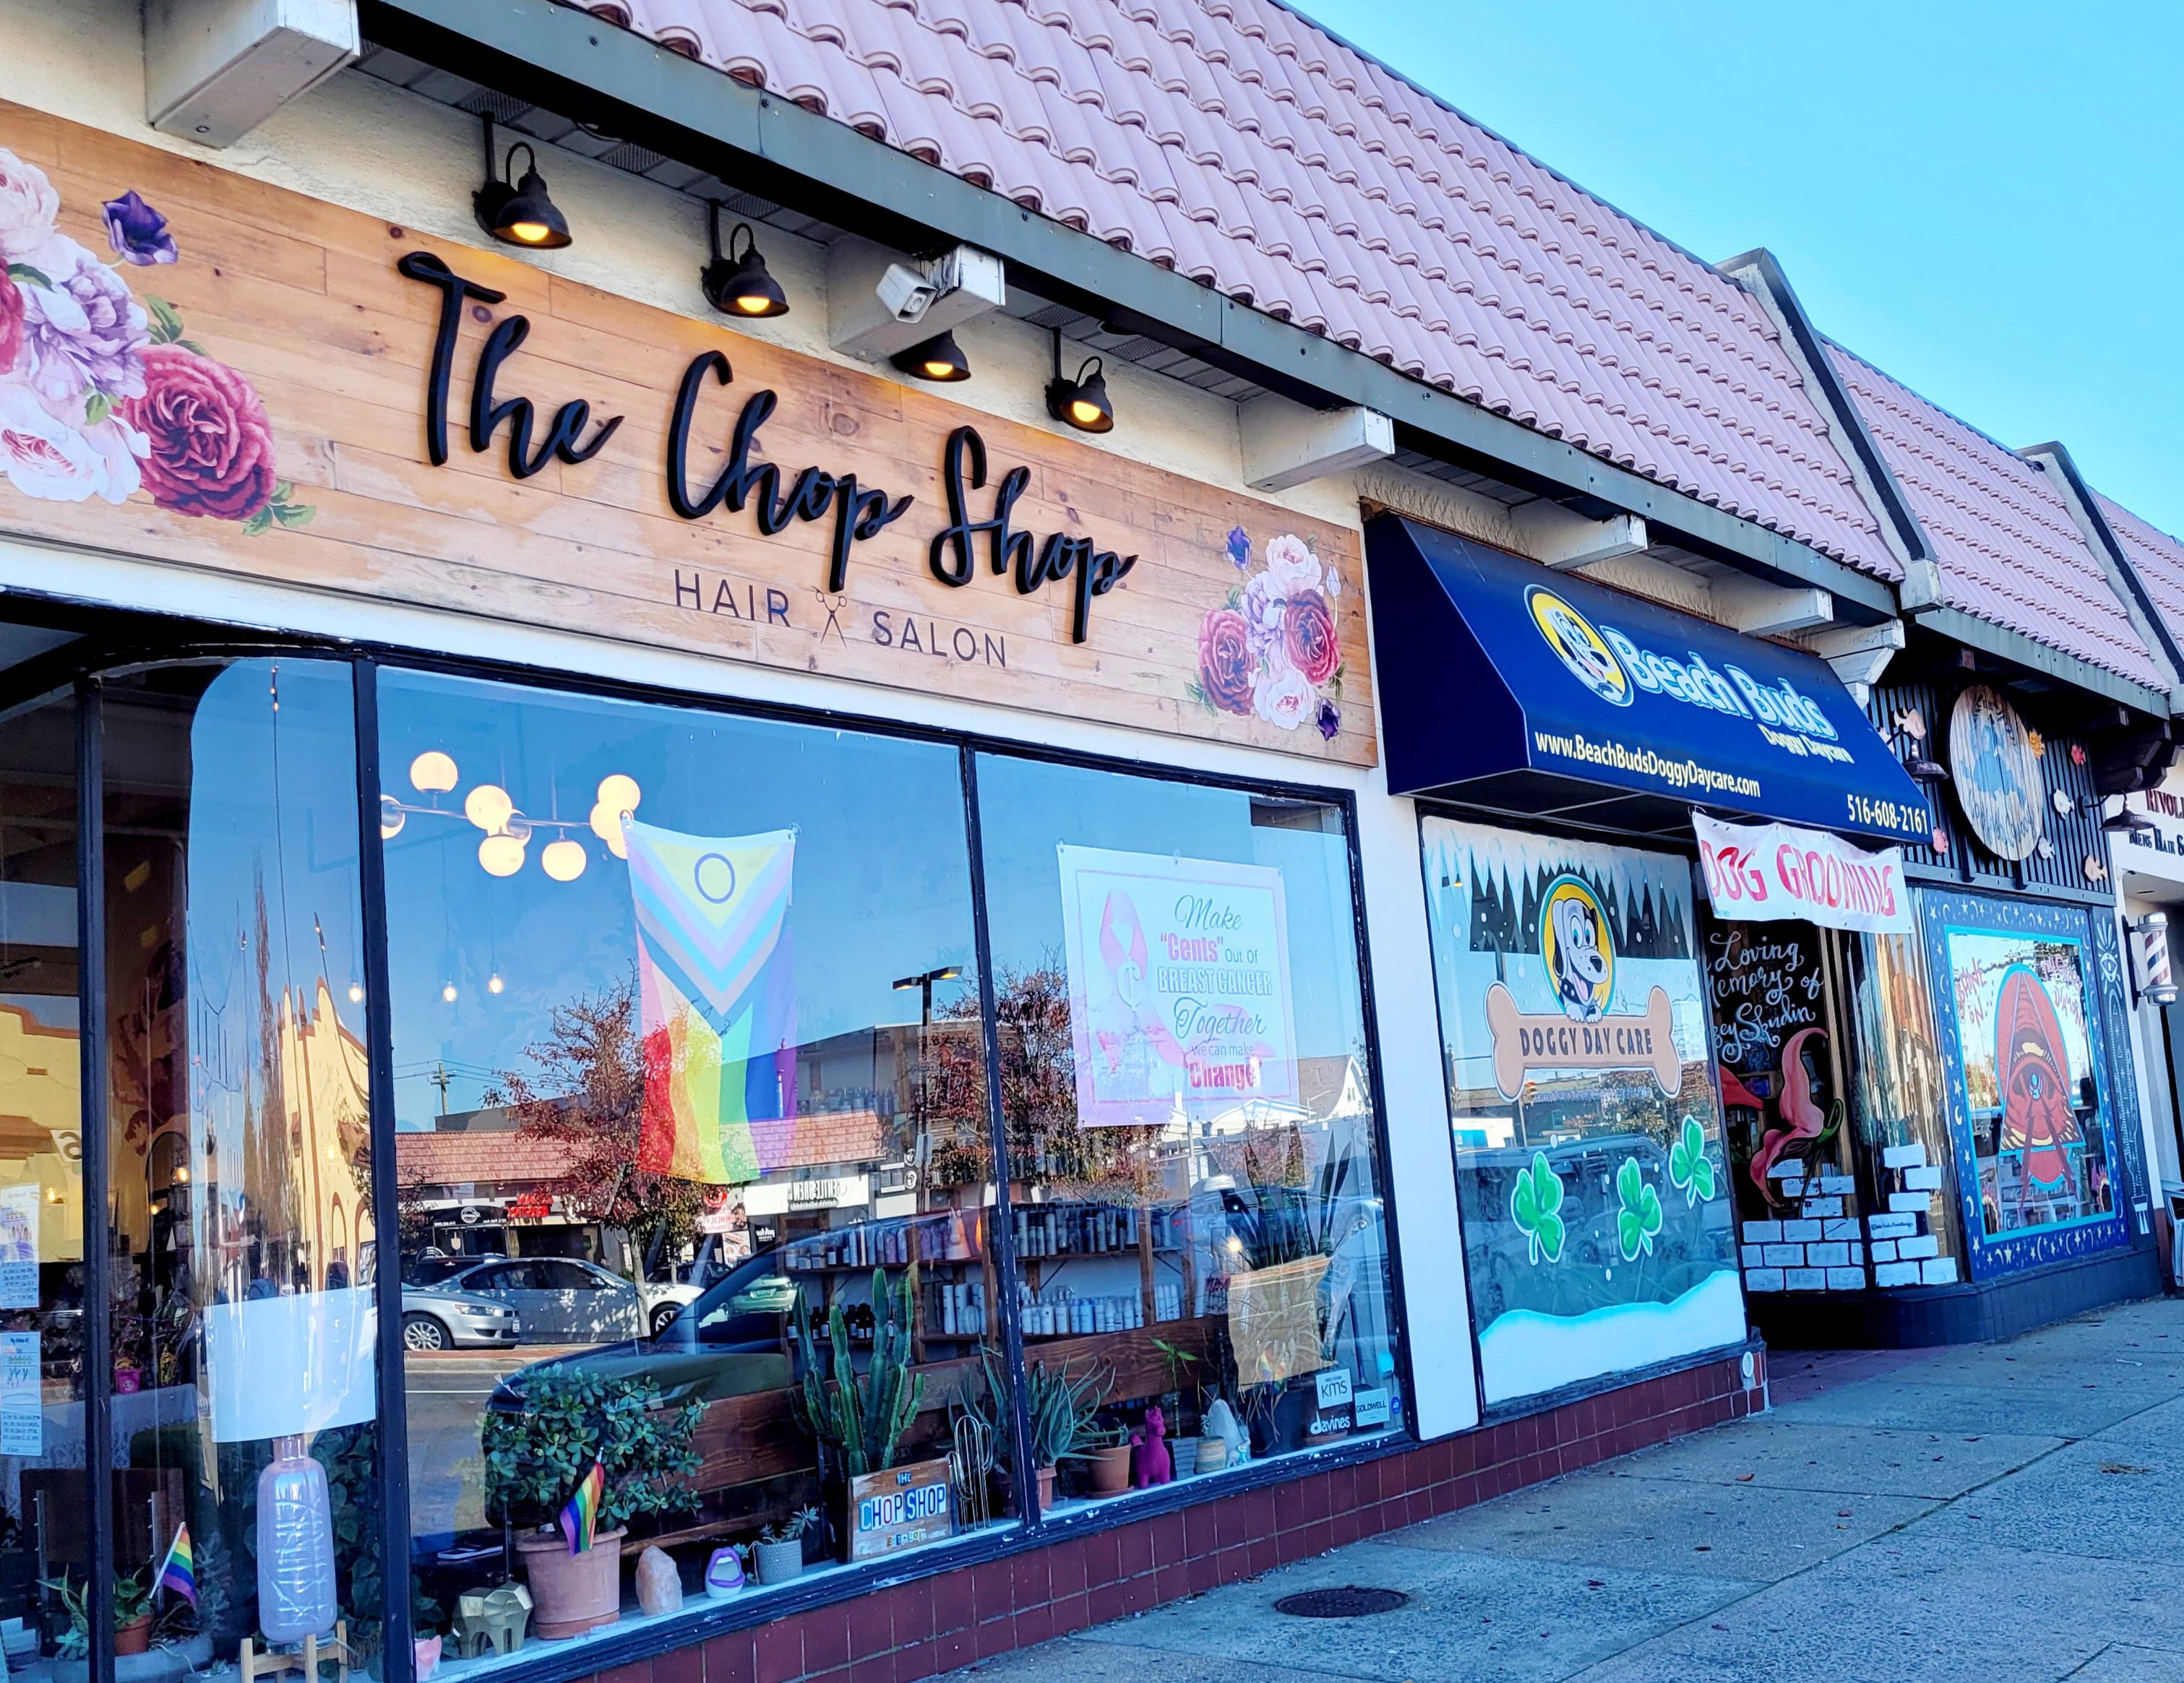
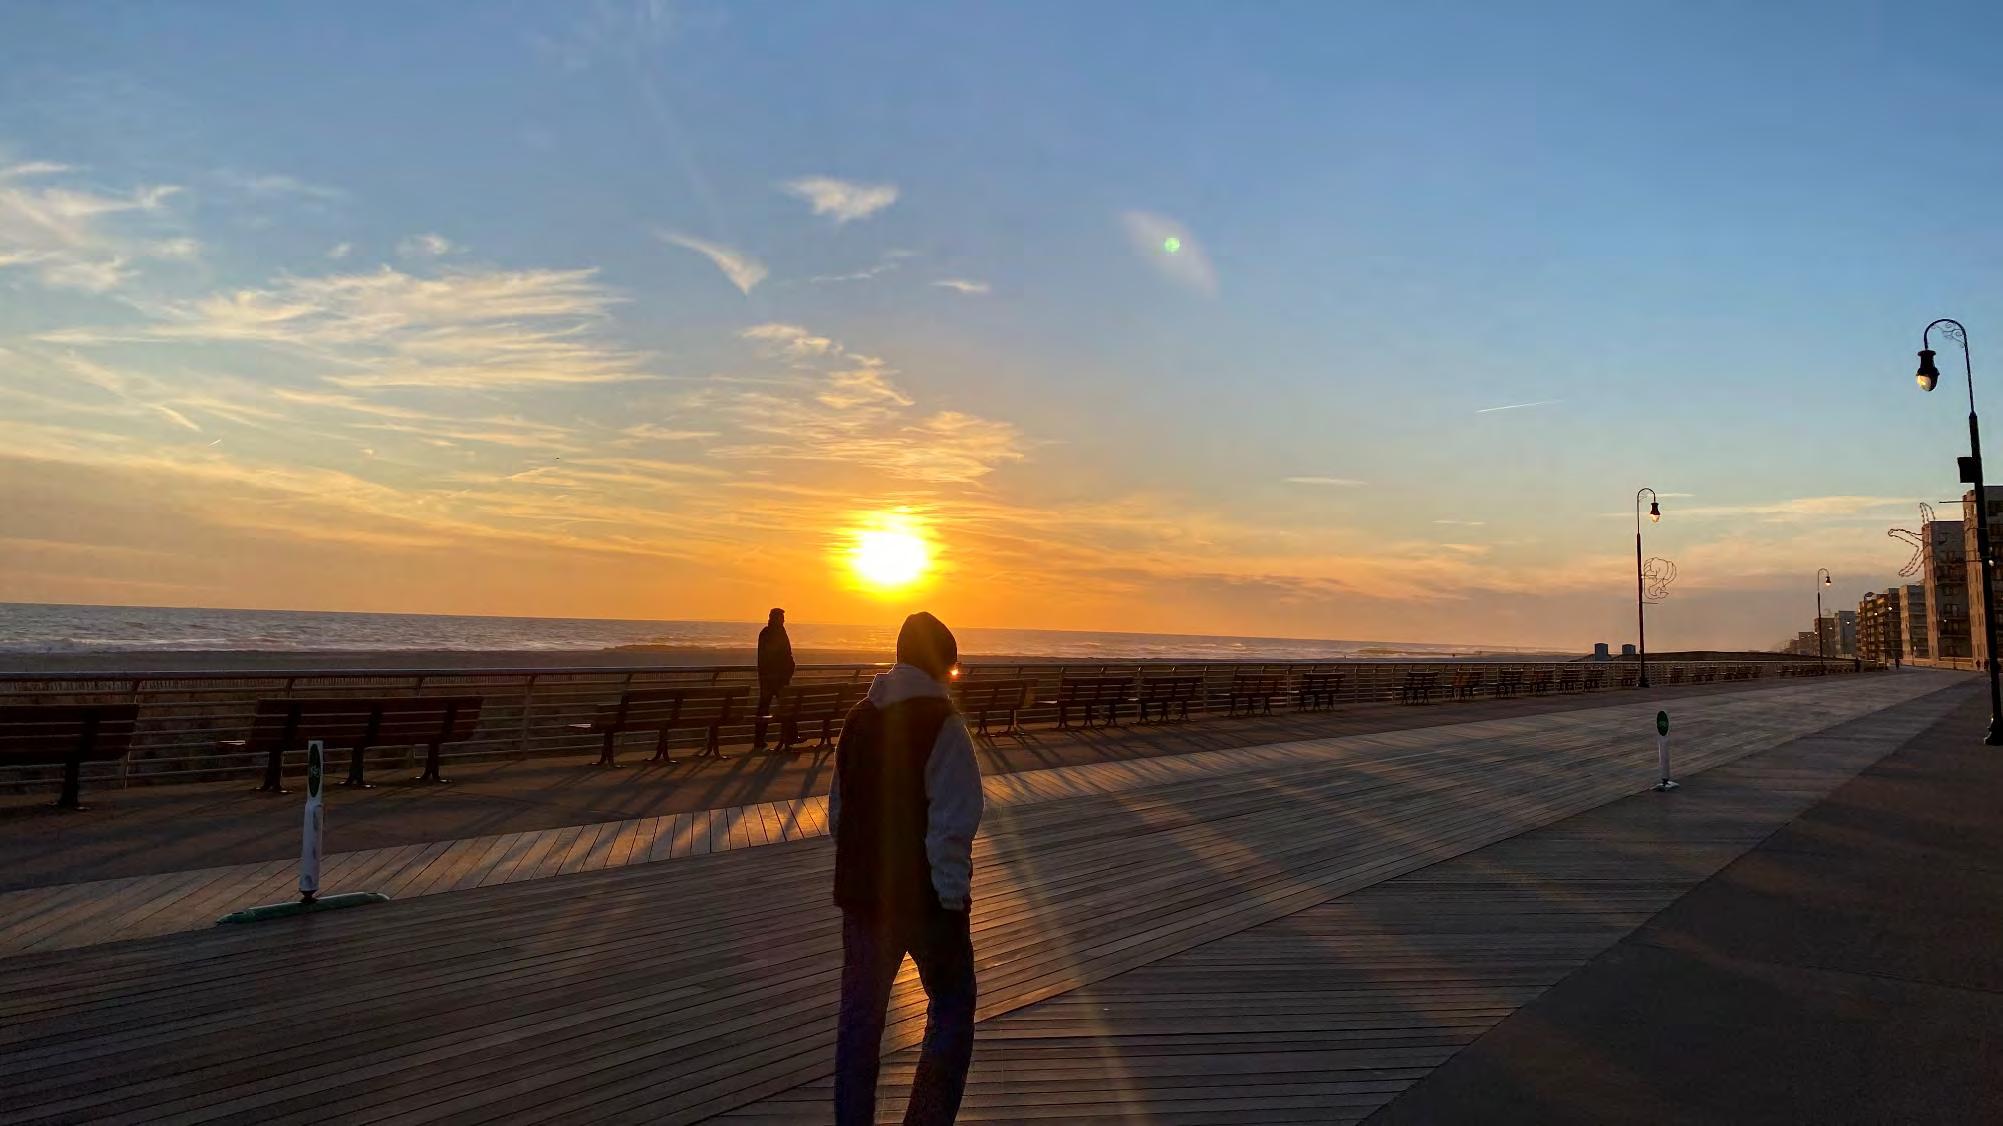
A) Study Area Overview
Streetsense is an experience-focused strategy and design collective that creates brands people love and places people love to be. Powered by in-depth insights and an interdisciplinary approach, we enhance brands and places, drive consumer demand, and foster community.
Information conveyed, data gathered and analyzed, and recommendations made within this report are intended to provide information in regard to the subject matter covered. The content presented and conclusions reached are, on the date presented, believed to be an accurate representation of facts and conditions.
B) Diagnostic
• Physical Assessment
• Business Environment
• Market Scan
• Administrative Capacity
C) Key Findings
www.streetsense.com

SAFETY DEVELOPING VIBRANCY FROM ASSESSMENT TO STEWARDSHIP
Our Approach
BUSINESS ENVIRONMENT
MARK ET DEM AND
PHYSICAL ENVIRONMENT
ADMINISTRATIVE CAPACITY
STORE DENSITY
Characterized bya concentrated area of offerings that allow customers to cross-shop withconvenience
TENANT MIX
Characterized by a mix of offerings that meet the needs of the dominant shopper - including retail, restaurant, professional services, and entertainment/experiential businesses

CUSTOMER BASE
Characterized by a diverse and stable customer base that can support business year-round
ACCESSIBILITY
Characterized by comfortable,convenient, and safe pathways to purchase by a mix of travel modesincluding walking, cycling,micromobility, public transportation, and private vehicle.
VISIBILITY
Characterized by an organized and vibrant landscape of wayfinding signage and storefront signs that heighten visibility of businesses to potential customers
WALKABILITY
Strong cohesive physical environment marked by co-located businesses and limited gaps in the physical environment.
LEADERSHIP
Characterized by a collaborative network of leaders that oversee the management and maintenance of the public realm, as well as downtown programs andactivities.
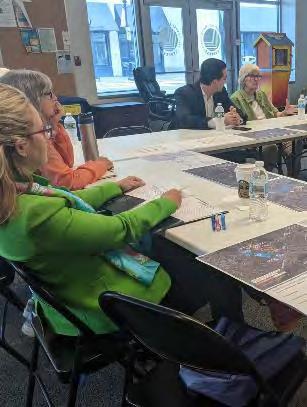
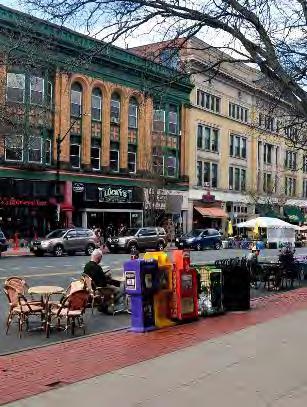
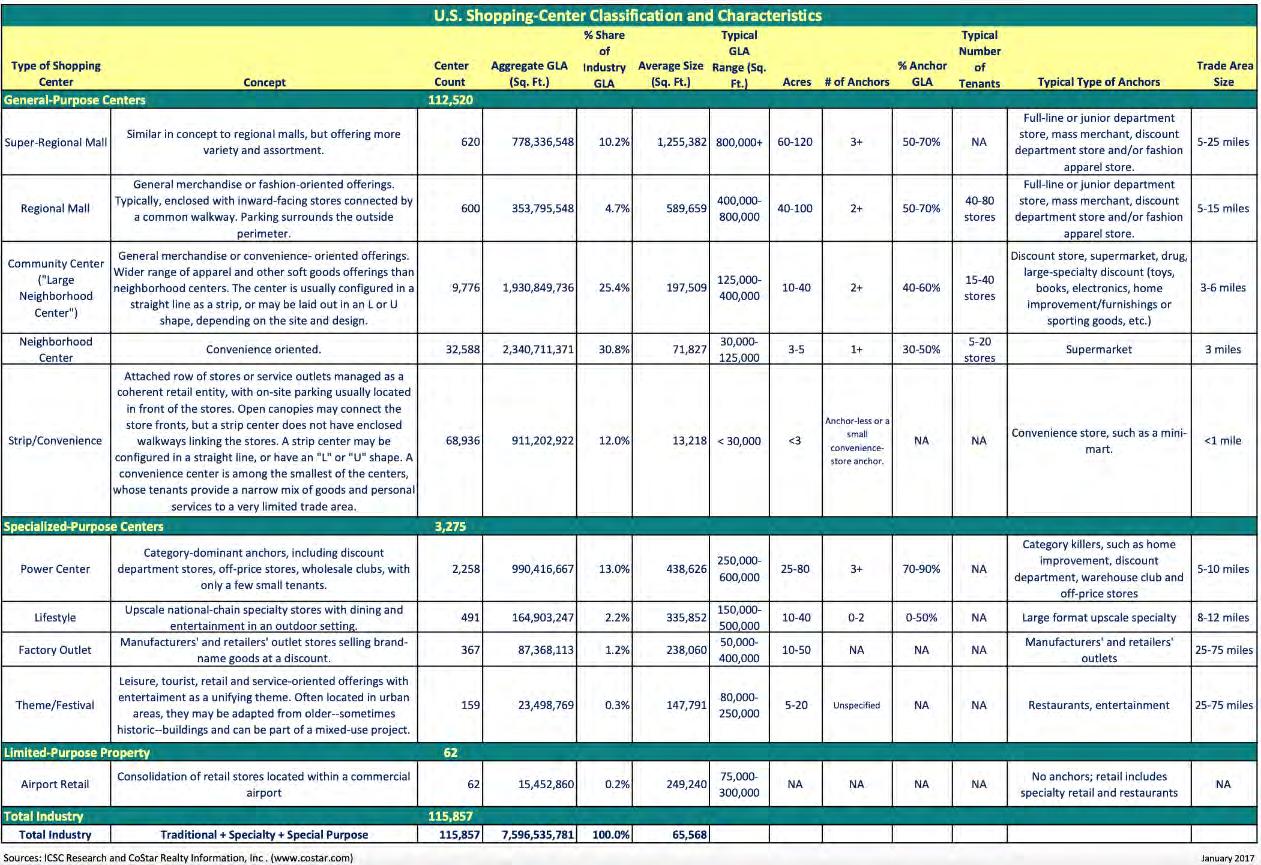
The DNA of Commercial Districts: District classification enables us to understand the ecology of each shopping environment and build a strategy informed by their function and market fundamentals.

Park has the largest retail concentration on the Island, functionally serving as Long Beach's "downtown".
Park and Neptune serve a predominantly local customer base. Beach serves both locals and visiting customers.
Boardwalk is more seasonal in nature and caters to beachgoing visitors.

Gross Leasable Area per Capita refers to the amount of retail per person in the defined market area.

At 23.1 SF per person, Long Beach tracks slightly below the national average of 23.5 SF per person.
When the population of the Barrier Islands is included (Atlantic Beach, Lido Beach and Point Lookout) the GLA per person falls to 19.8.
Our approach to judging long beach’s physical environment considers elements of the public and private realm
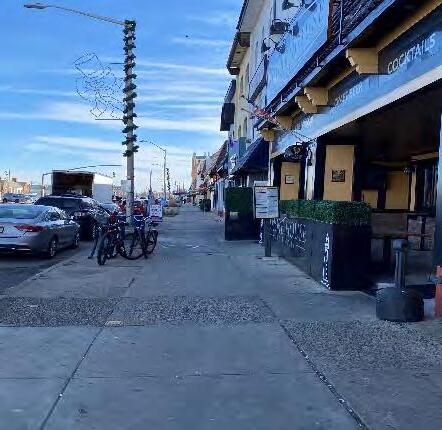
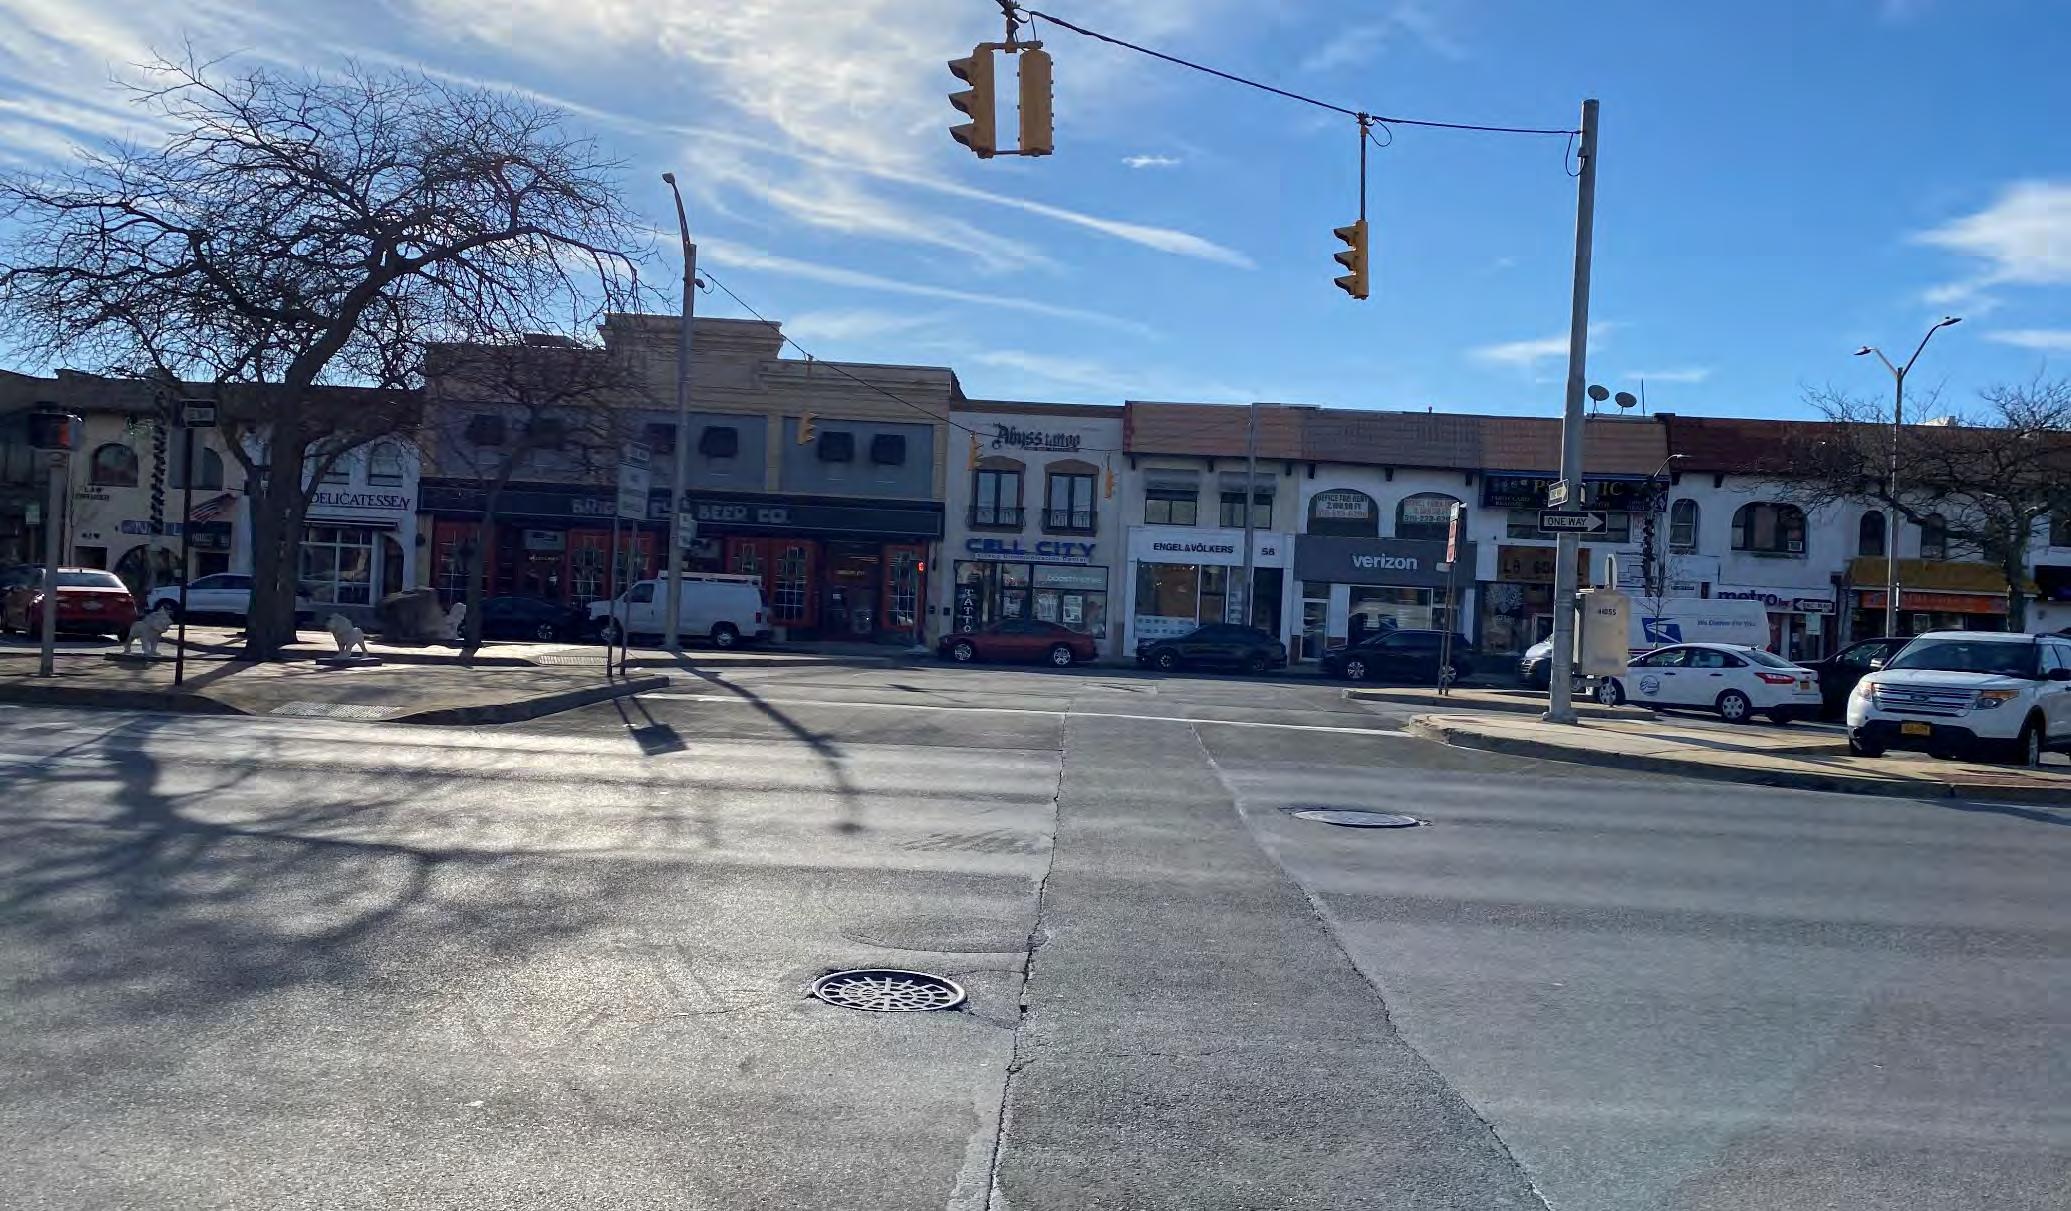
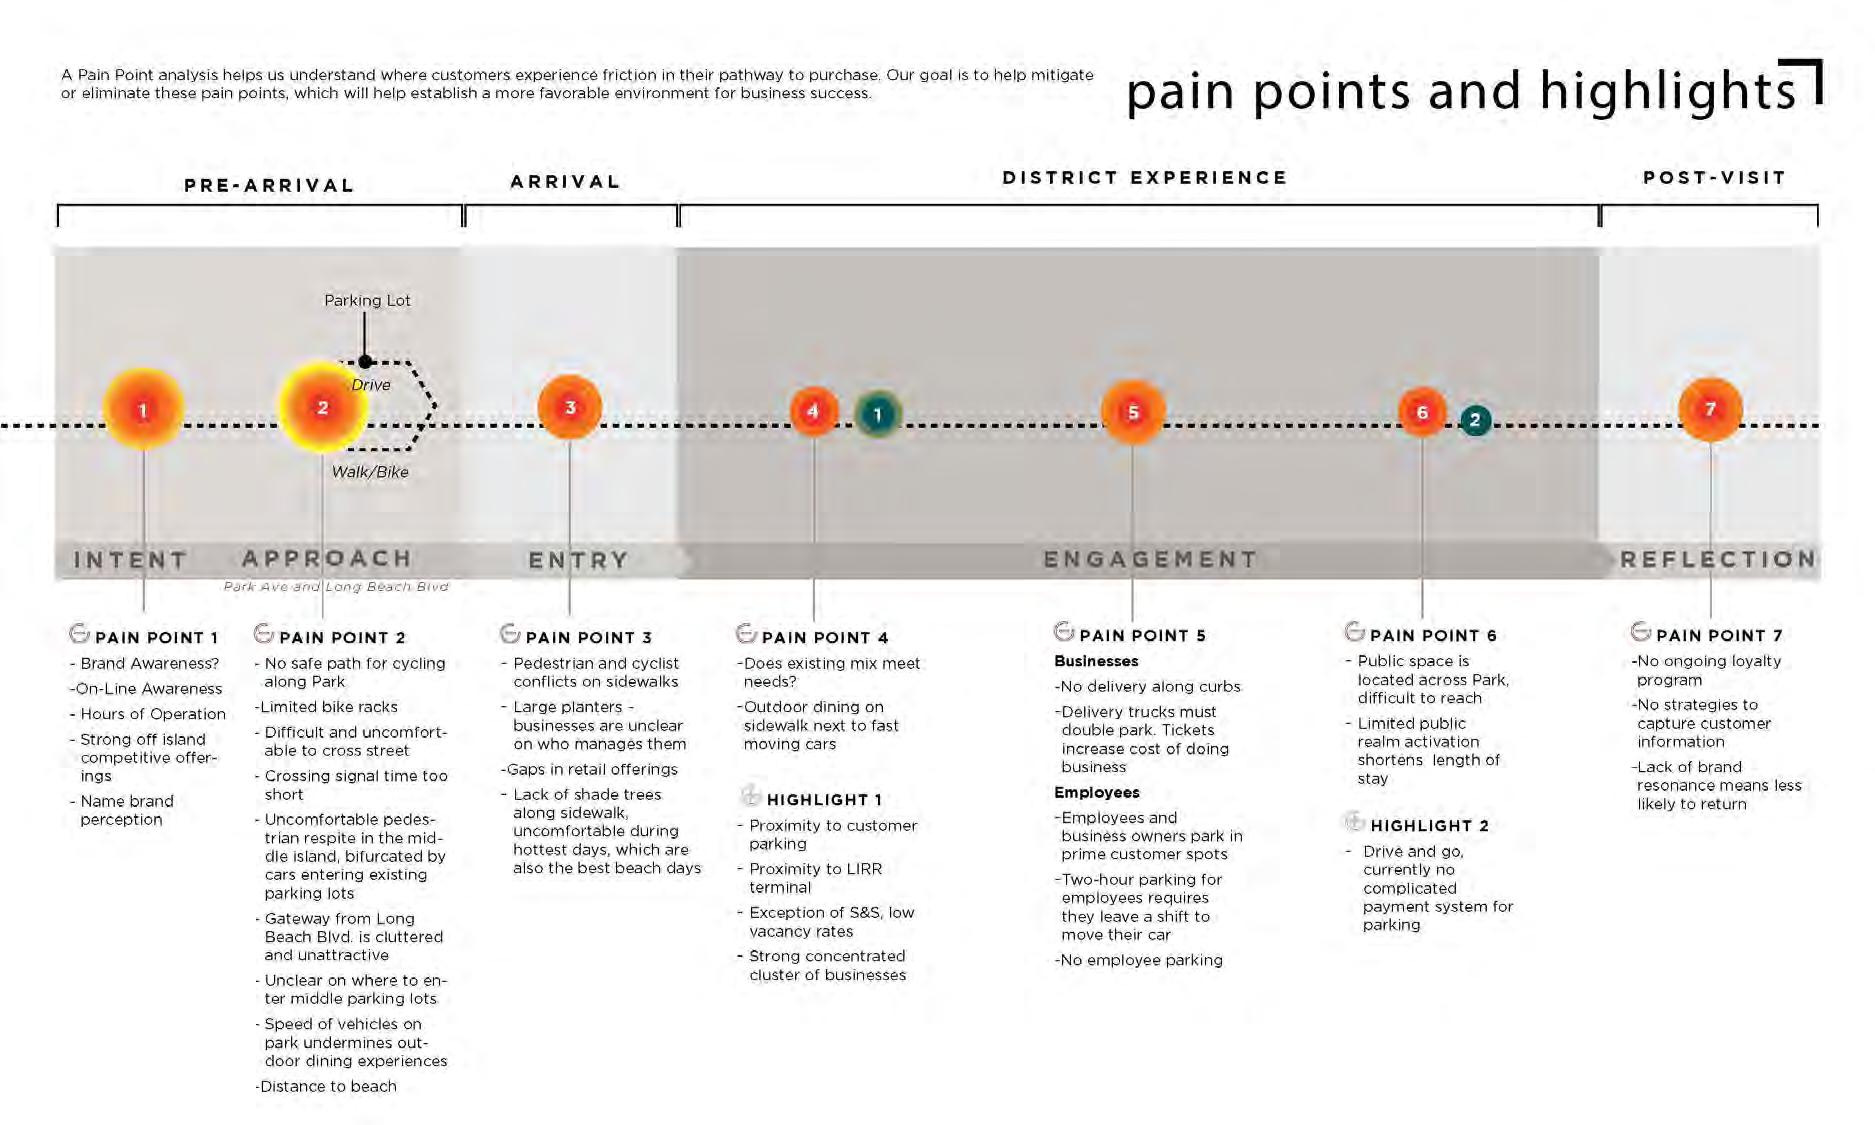
*Based on publicly owned lots and street parking
• Parking is tight b/c neither Beech nor Park are true “downtown environments” with mixed use characteristics.
• LIRR parking must be part of the solution for Park Ave. Current challenges of crossing Park Ave. diminish the utility of parking at this location.
• More robust nonautomobile infrastructure can help offset the need for more parking
• The long beach bus system is an underutilized resource for visitors
• Meters help with turnover in downtown environments
• Low Car Ownership
• Robust transit
• Mixed use
Parking Spaces per 1,000 SF of Retail
• High Car Ownership
• Some transit
• Mostly residential
• High Car Ownership
• No Transit
• Residential only
**These ratios do not include the 400+ Superblock temporary beach season parking as that will no longer serve as parking in the future**

There are two existing city owned properties at the entrance of Long Beach which present about 109,972 SF of opportunity for redevelopment.
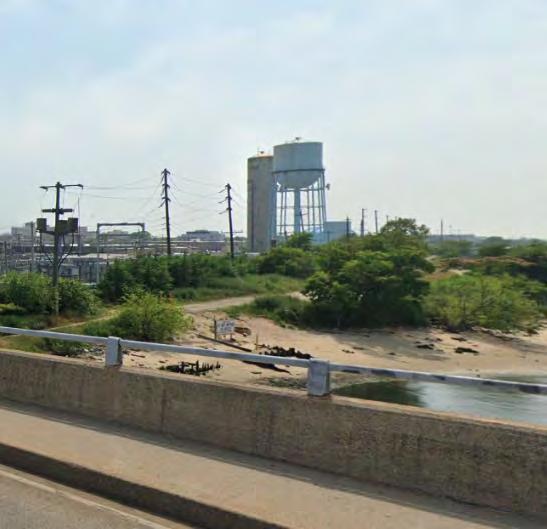

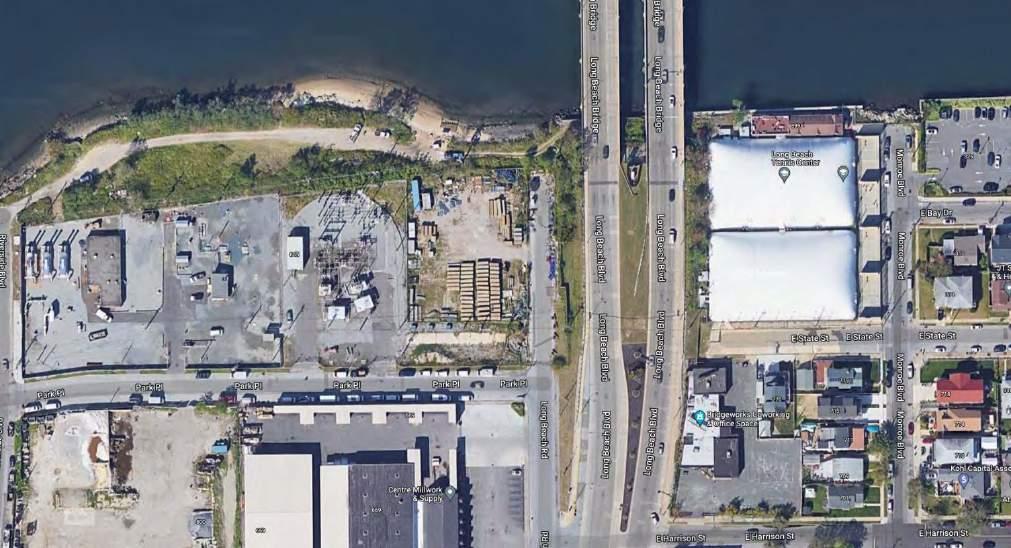
Private Realm C A+ B+ A C
The private realm scored low die to its lack of business signage and distance decay.
Businesses along Beech St present exceptional infrastructure.
Businesses on the Boardwalk could have more consistent windows and signage.
Businesses along Beech St present exceptional infrastructure.
Business facades are in poor condition.
Public Realm B B+ B+ A- C
Roadbeds and crosswalks are in poor condition and unsafe. There is a strong lack of walkability due to signage and automobile dominance.
There is a lack of street trees and benches, and signage does not encourage walkability.
Roadbeds and crosswalks upon entry are in unsafe condition.
Roadbeds and crosswalks are in satisfactory condition. There is a lack of pedestrian furniture.
There is no pedestrian infrastructure present. Sidewalks are in poor condition.
Challenging or Moderate Conditions - Improvements and/or Targeted Enhancements Required
Good Shape – Focus on tweaks and maintenance

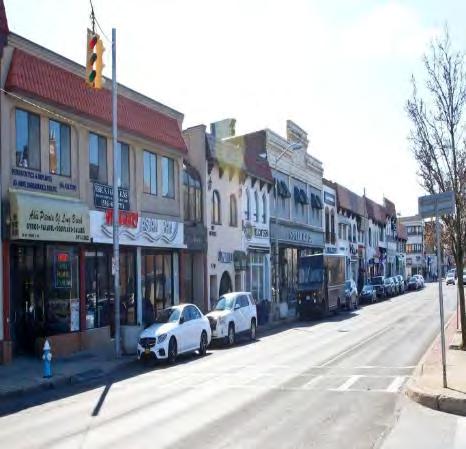
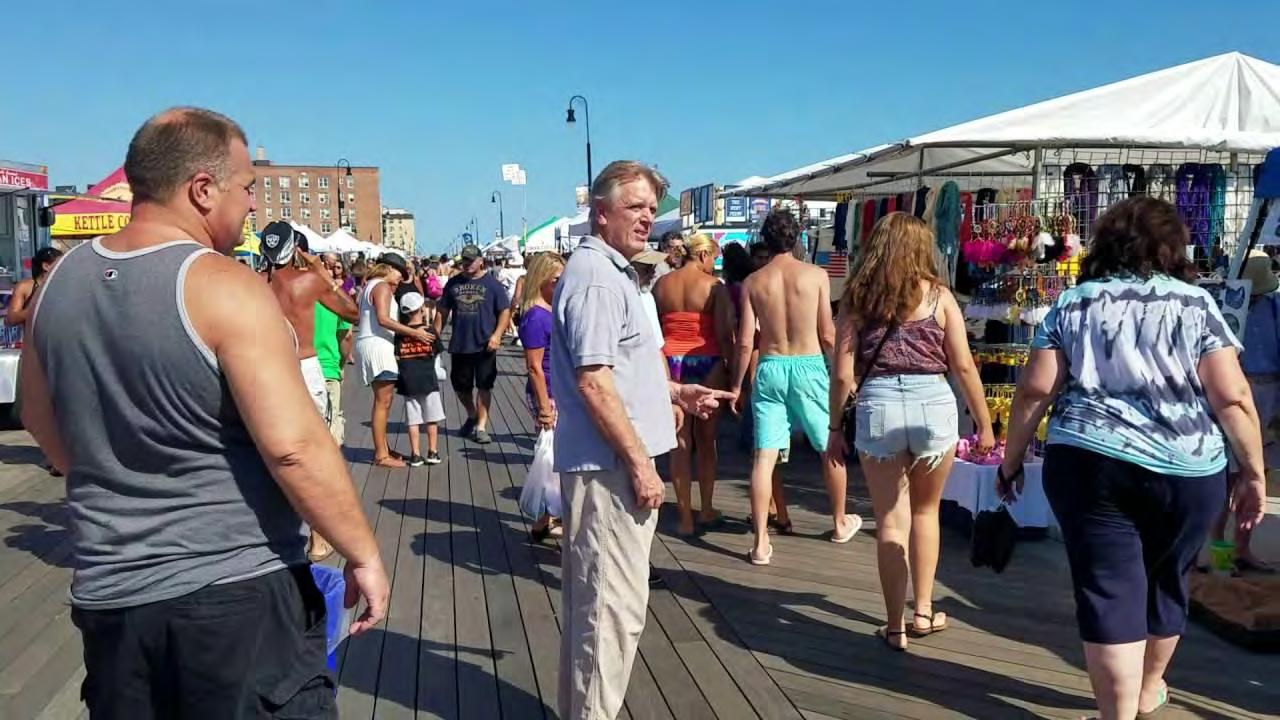

NG&Sretailers rely on spending from nearby residents, students, and employees. NG&Sis “conveniencebased” retail that must be located within close proximity to a customer’s place of work or home with easy access (by foot/bike/transit, private vehicle) an/or convenient parking. Generally, customers will travel to the nearest NG&S offering available to them.
F&B retailers can attract customers from a larger trade area than NG&Sretailers, especially when they are clustered. A greater number of patrons will be interested in a collection of F&B establishments that cover a variety of options that serve food or alcohol that is consumed on premises.

GAFO retailers face a tremendous amount of retail competition, both from brick-and-mortar stores and online, for a relatively small percentage of household expenditures. GAFO retailers attract customers from farther distances, but rely on exposure and foot traffic generated by anchors.

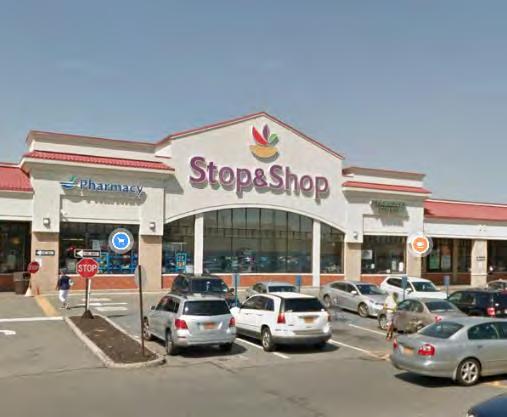
Long Beach has a greater concentration and density of Food and beverage than Nassau County. It is a dining destination, particularly in the warmer months.
People leave Long Beach for general merchandise, apparel, furnishings, and other (GAFO) retail needs. Long Beach will find it difficult to compete in these categories as Long Island malls will remain powerful destination drivers.

Similar to its competitors, Long Beach serves mainly as a food and beverage destination.

• Beech and Boardwalk are dining destinations, particularly in the summer months.
• Park and Neptune/Pacific are locally serving business districts.


Long Beach (excluding stop & shop center)
Long Beach (including stop & shop center)
Low vacancy rates suggest strong economic development fundamentals and opportunities for additional retail offerings. Typically, vacancy rates over 10-12% are a cause for concern.
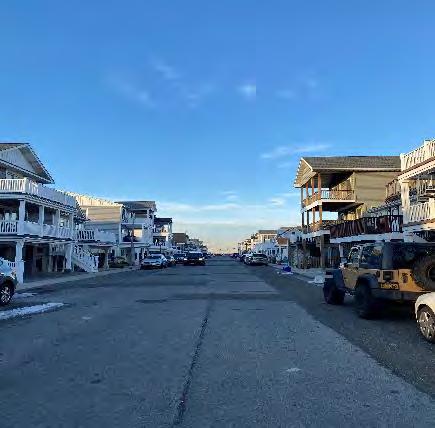

• The dominant Long Beach customer seeks known brands and contemporary offerings at moderate price points.
• The secondary Long Beach customer is open to higher price points and more “trendy” offerings.
City Lights (36%)
• Households range from single person to married-couple families, with and without children. A blend of owners and renters, single-family homes and towns homes, midrise and high-rise apartments.
Urban Chic (23 %)
• Busy, well-educated and connected professionals consisting of married-couple families and singles $69K
• Couples that have already transitioned to empty nesters or are still home to adult children. Families own older, single-family homes and maintain their standard of living with dual incomes. These consumers have higher incomes and home values and much higher net worth
• This group mainly consists of married couples without children or married couples with older children is highly educated and earns more than three times the US household income. Their neighborhoods are older and located in the suburban periphery of the largest metropolitan areas, especially along the coasts.
$92K Median Household Income
43
Median Age
$173K
Median Household Income
47
Median Age

A retail gap analysis measures the relationship between estimated retail supply (i.e., current retail sales) and retail demand (i.e., resident spending).
When retail sales exceed resident spending, businesses are selling more than residents are buying (or there is a retail surplus).
When resident spending exceeds retail sales, then resident spending is ‘leaking’ out of the trade area.
$0

$4,970,234 – Furniture and Home Furnishing Stores
$10,200,615 – Sporting Goods, Hobby, Book and Music Stores
The boundary of the City of Long Beach has an annual leakage of half a billion dollars. The retail gap analysis showed that local stores are not fully capturing local household expenditures in any retail category. This presents opportunities to grow retail offerings in Downtown.
$11,465,801 – Misc. Store Retailers
$12,612,365 – Building Material Equipment and Supplies Dealers
$14,579,049 – Health and Personal Care Stores
$14,863,010 – Electronics and Appliance Stores
$32, 422,384 – Food Services and Drinking Places
$36,195,943 – Clothing and Accessory Stores
$59,946,533 – General Merchandise Stores
$82,755,866 – Food and Beverage Stores
$99,893,917 – Motor Vehicle and Parts Dealers
Collectively there is an opportunity for approximately 200K+ square feet of retail across categories aligned with the City’s commercial districts, including neighborhood goods/services, food/beverage, and general merchandise, apparel, Furnishings/Other in Long Beach. The most significant opportunities are in F&B.
**Capture rates consider post covid environments

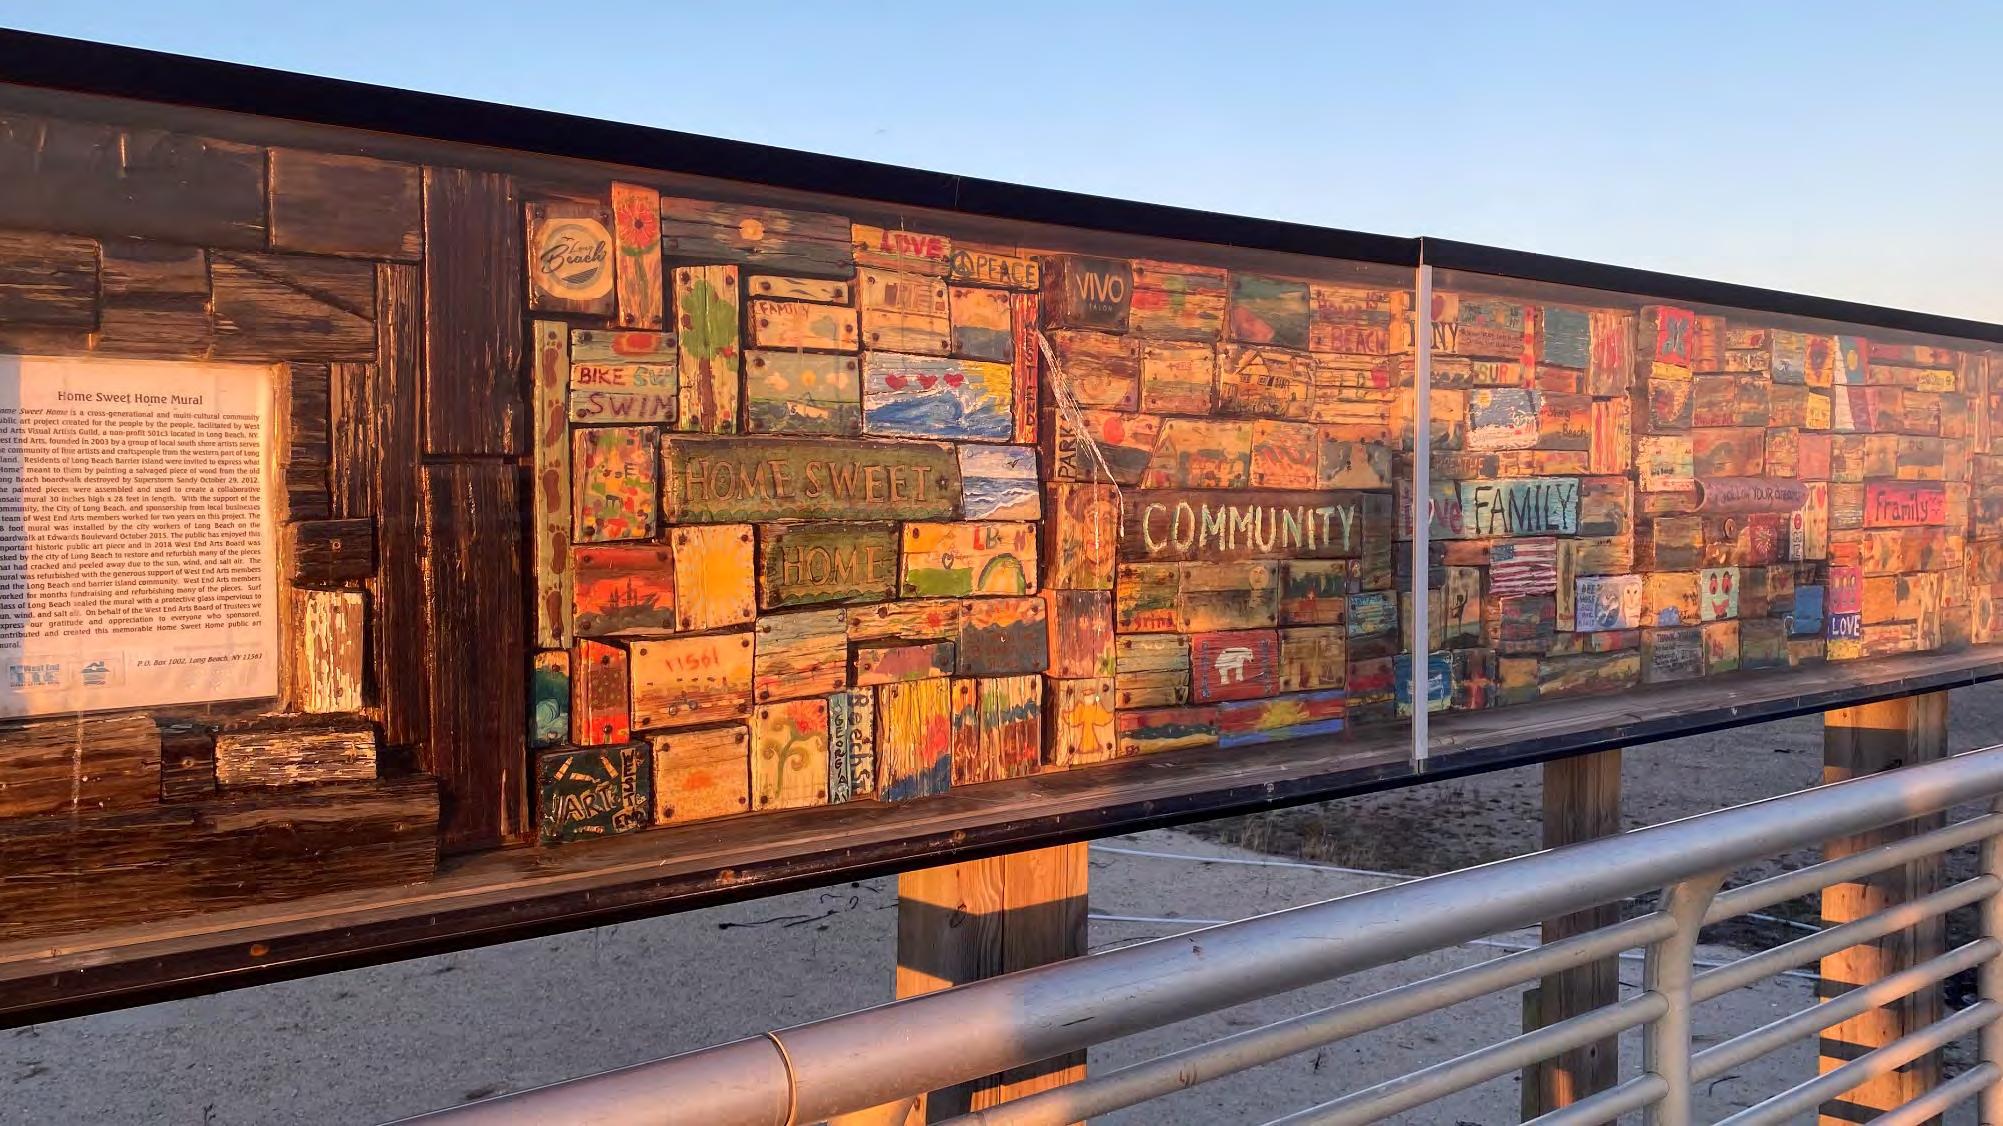
There is a need for more coordination between Long Beach organizations and greater alignment with greater Long Island tourism.

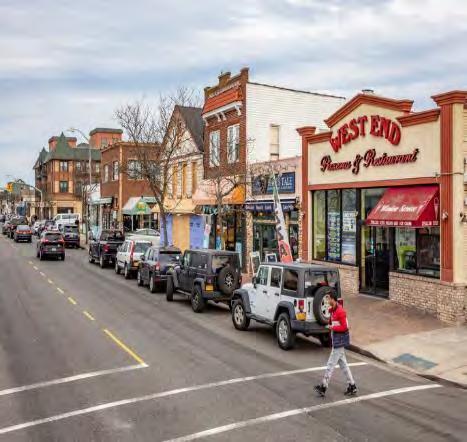

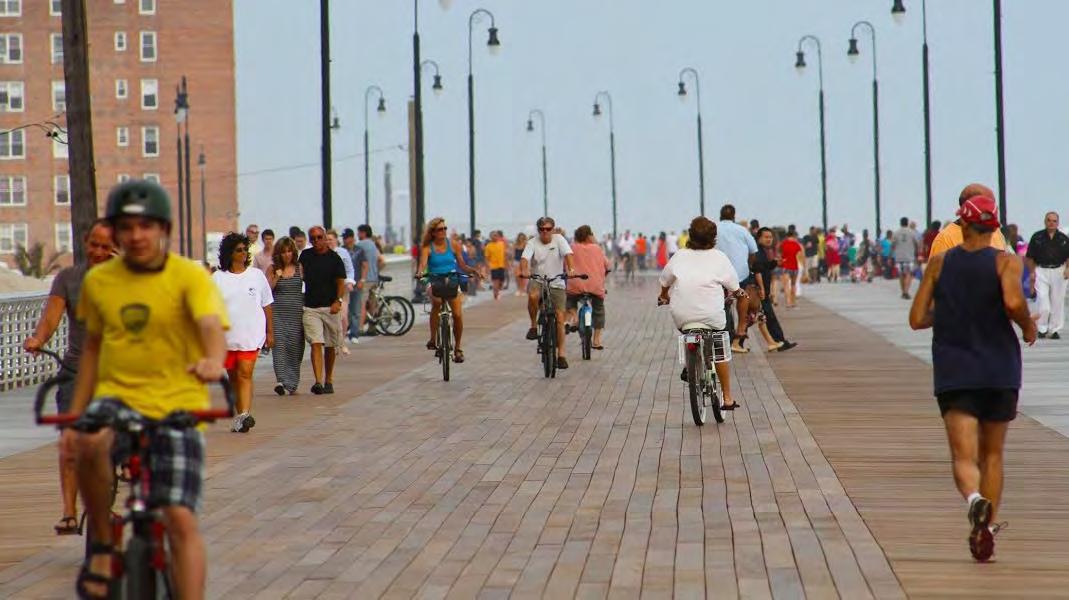
• Significant opportunities exist in large parcels ripe for redevelopment, including city hall.
• There is market demand to support mixed-use redevelopment that will diversify tenant mix through growth in residential demand.
• At present, parking challenges are further exacerbated by a difficult street crossing, which makes it uncomfortable to at a distance, and the failure to accommodate alternative mobility options which makes driving more likely.
• Park Avenue offers a unique combination of site assemblage opportunities, public ownership of key assets, accessibility to regional transit, and an existing commercial hub that make it well positioned to serve as the location of a redevelopment of this nature.
• Pedestrian amenities are needed across all districts, including blade signs, pedestrian lighting, street furniture, trash bins, bike racks, etc. These are also branding opportunities.
• Pedestrians and cyclists do not have consistent and comfortable safe passage between districts, diminishing the likelihood of cross-shopping and undermining customer retention. Once residents find their way to their cars, the likelihood is that they will leave the Island for their shopping needs.
• There are no wayfinding signs that help pedestrians gauge distances to districts and offerings, particularly while at the Beach.
• The growth in e-mobility will make excellent road conditions a priority.
• There are opportunities for partnerships that reduce duplication of effort and take advantage of existing programs (i.e., downtown deals travel pass)
• There is an opportunity to improve tourism marketing within the region and particularly among LIRR users
• Increasing marketing and promotion offerings and online presence of businesses


• Eliminate restriction on residential development within targeted TOD area to leverage growing hybrid work movement
• Eliminate parking requirements for existing buildings when there is a change of use. The current Parking Waiver is costly and unnecessary business expense.
• Work with the chamber to offer a mercantile licensure program for home-based businesses.
• Encourages walkability
• Increases awareness of businesses
• Emphasizes pedestrian comfort over automobiles


Sidewalks
Sidewalks should be wide enough to accommodate both the flow of customers and spillover retail/dining activity. In addition, sidewalks should be clean and well-maintained to ensure the safety and comfort of pedestrians.
Sidewalks should facilitate a variety of activities, including resting, people-watching and socializing. Street trees and benches are key amenities that support such activities and should be made available without disrupting the flow of pedestrians.
Street lighting improves pedestrian visibility and personal safety, as well as aids in geographic orientation.

A wayfinding system supports overall accessibility of a commercial district. It benefits pedestrians and bicyclists, and directs motorists to park and walk. Without clear visual cues, customers may find it difficult to park or may be less aware of local offerings.
Roads should be well-maintained to ensure safety of drivers and pedestrians. Crosswalks that are unsafe or inconvenient to customers may undermine accessibility between stores and overall shopper experience.
More than 75% of sidewalks in the study area are cleaned, well-maintained and accessible to multiple users across different ages and abilities.
About 50% of sidewalks in the study area are cleaned and well-maintained.
More than 25% of sidewalks in the study area pose challenges to the pedestrian experience (including narrow sidewalks and lack of cleanliness/maintenance).
There are no sidewalks in the study area.
Street trees and benches are readily available throughout the study area. They are well-designed, well-maintained, and offer shade and comfort to pedestrians.
Although street trees and benches are available across the study area, these amenities have not been cleaned or well-maintained, and require improvements.
Limited availability of street trees and benches creating uncomfortable pedestrian experience.
There are no street trees and benches in the study area
More than 75% of the study area utilizes a range of lighting strategies to ensure safety of pedestrians and motorists, as well as highlight the identity and history of an area.
There is a comprehensive and cohesive wayfinding system that offers geographic orientation to pedestrians, cyclists, and motorists. Signage reflect the brand and identity of the area.
About 50% of the study area is serviced by street lighting that supports pedestrian visibility and safety.
Street lighting on the primary street in the study area does not support pedestrian visibility and safety
There is no street lighting in the study area
Roads are designed to balance the needs of motorists, cyclists, and pedestrians and create a safe environment for all users.
Wayfinding in the study area is primarily geared towards directing motorists across the study area. There is limited signage to identify key assets and destinations to pedestrians.
Roads are designed primarily to move motor vehicles across the study area efficiently, with limited crosswalks for pedestrians.
Limited to no signage available throughout the study area.
There is no wayfinding/signage in the study area.
Roads are hazardous to all users. The study area is not connected by any major roads

Window
Storefronts that maintain a minimum of 70% transparency ensure clear lines of sight between the business and the sidewalk to enhance attractiveness of storefront, as well as improve safety for the business, customers, and pedestrians.
Attractive window displays and spillover retail/restaurant activity on sidewalks or adjacent parking spaces can help contribute to overall district vibrancy.
More than 75% of storefronts maintain windows with at least 70% transparency.
About 50% of storefront windows maintain windows with at least 70% transparency.
Signage can help customers identify the location of storefronts and businesses from a distance. Signage should also reflect the visual brand and identity of tenants to help attract new customers.
Awnings can provide shade during warmer months, enabling comfortable outdoor dining arrangements for customers. However, they must be well-maintained and designed in coordination with other elements of the storefront.
Storefronts that use high-quality and durable building materials, as well as paint and color to differentiate from other businesses, can dramatically improve the appearance of the commercial district to potential customers.
Storefront interior lighting after business hours help enliven the corridor and boost security on the street.
More than 75% of storefronts feature an attractive window display and/or spillover merchandise and dining areas that align with the brand and identity of the district.
More than 75% of storefront signs reflect the unique brand identity of tenants and can be easily seen from more than 10 ft distance.
More than 75% of properties in the study area have retractable awnings that have been well-maintained and cleaned.
About 50% of storefronts maintain an attractive window display with limited spillover merchandise and/or dining areas.
More than 25% of storefronts have windows with limited transparency.
All storefronts are boarded up and/or have limited transparency.
About 50% of storefronts have clear signage that reflect basic business information and can easily be seen from adjacent sidewalks.
About 50% of properties in the study area have functioning awnings that have been well-maintained and cleaned.
More than 25% of storefronts have spillover merchandise display and outdoor dining that pose challenges to the pedestrian experience.
There is no spillover retail/restaurant activity in the district
More than 25% of storefronts have signage that does not communicate names of business or types of products/services being offered.
More than 25% of properties in the study area do not have awnings and/or have awnings that are unusable or have not been cleaned and maintained.
Storefronts in the study area do not have signage.
Storefronts in the study area are not equipped with awnings
More than 75% of properties have well-maintained façades. Limited structural enhancements are required.
Although most properties in the study area have clean and well-maintained façades, there is at least one significant property requiring structural façade improvements.
More than 25% of properties require significant building façades improvements, including power washing, painting, and structural enhancements.
All properties in the study area require significant façade improvements
More than 75% of storefronts have lighting that help illuminate sidewalks.
About 50% of storefronts have some interior lighting that help illuminate sidewalks.
More than 25% of storefronts have interior lighting that help illuminate sidewalks. All storefronts in the study area are shuttered and dark at night.
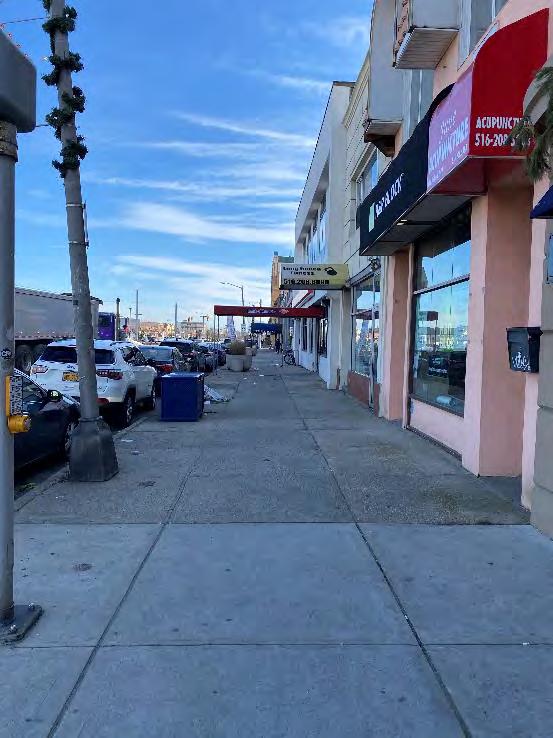
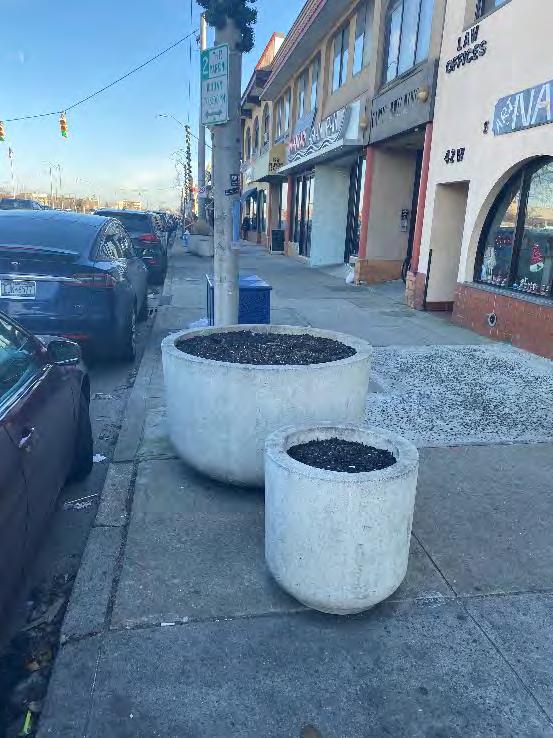
C - Minimal amount of greenery, little to no benches
 A – Wide sidewalks
B – Adequate street lighting

C – No wayfinding within the district or pointing visitors to other districts
C – Weathered roadbeds and crosswalks
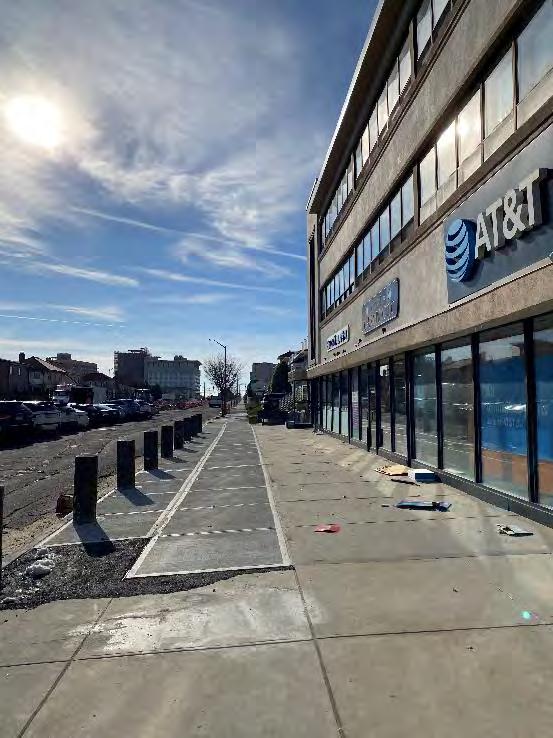
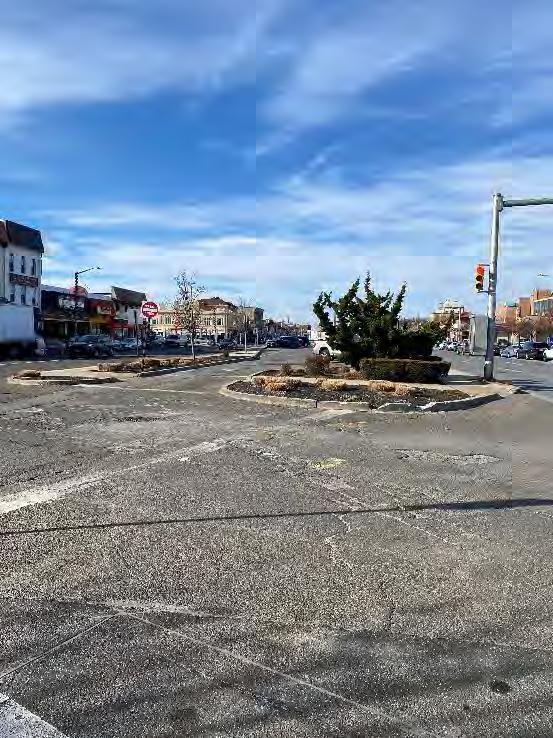
• Sidewalks – A

• Street Trees & Benches – C
• Lighting – B
• Wayfinding/Signage – C
• Roadbed & Crosswalks - C
**TOD and Park Ave improvements pending
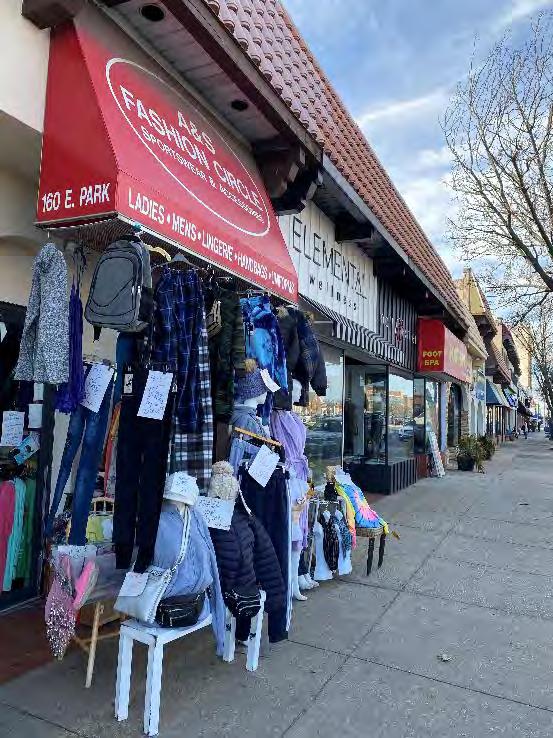
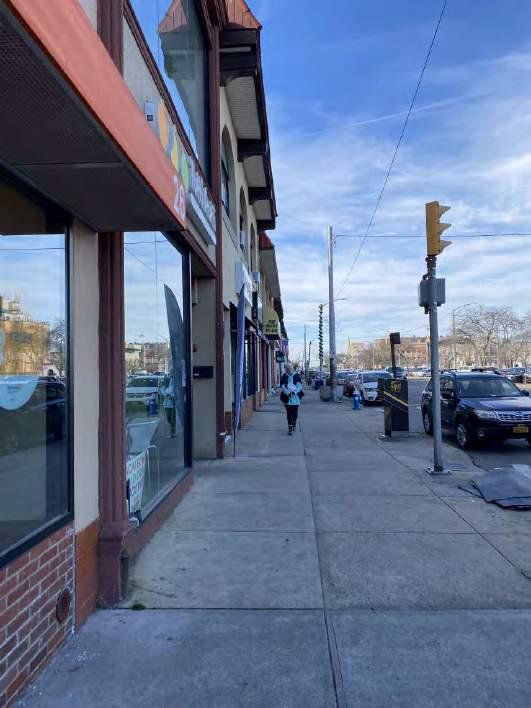

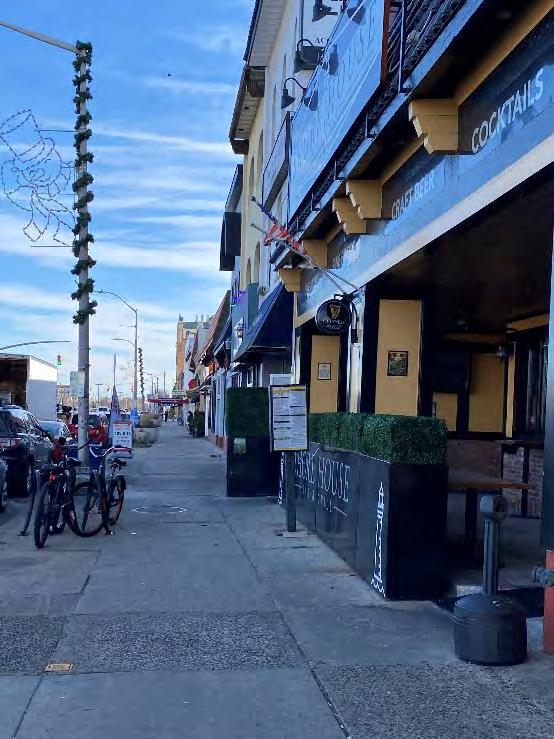
B – Limited blade signage
B – Some businesses have multiple forms of signage
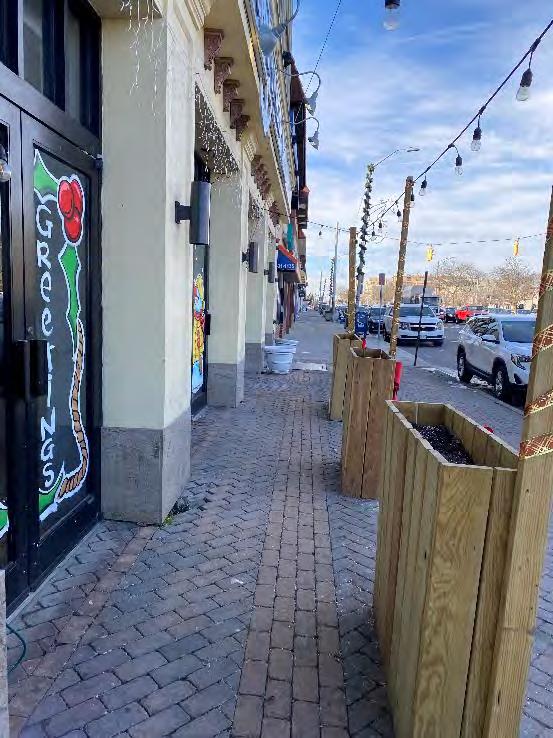
C – Minimal outdoor dining

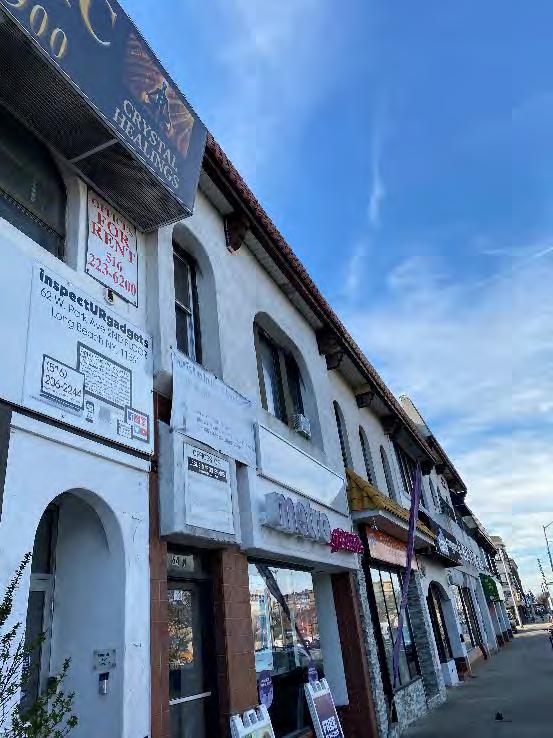


B – Most businesses have adequate lighting
B – Most facades are maintained
• Window – A
• Outdoor Display/Dining – C
• Signage – B

• Awning – A
• Façade – B
• Lighting – B
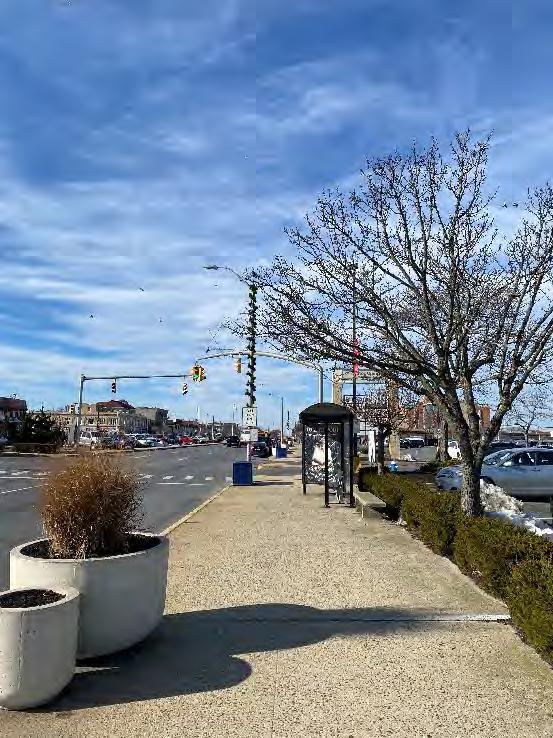

A – Adequate benches and public space
A – Sidewalks are in adequate condition

B – Streetlights present

C – Roadbeds and crosswalks in poor condition – distance decay
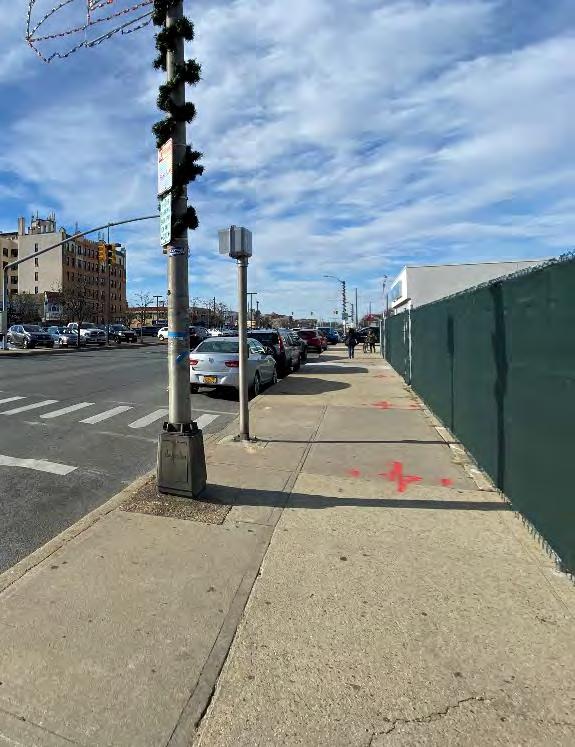
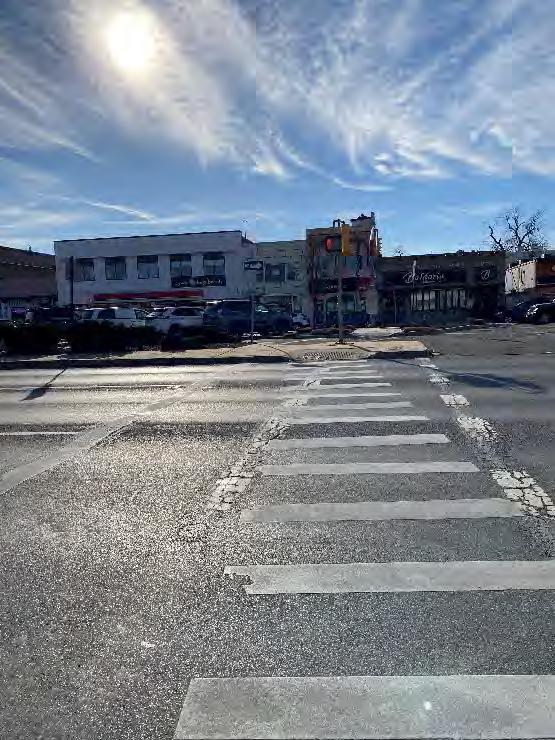 172 ft
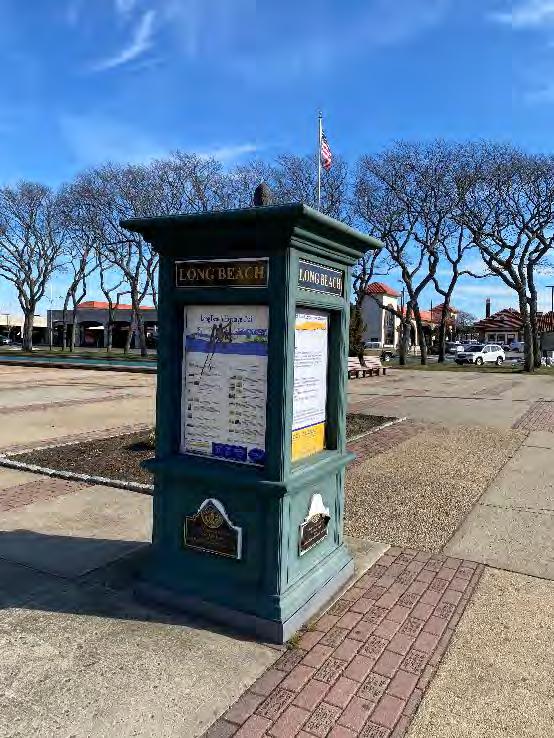
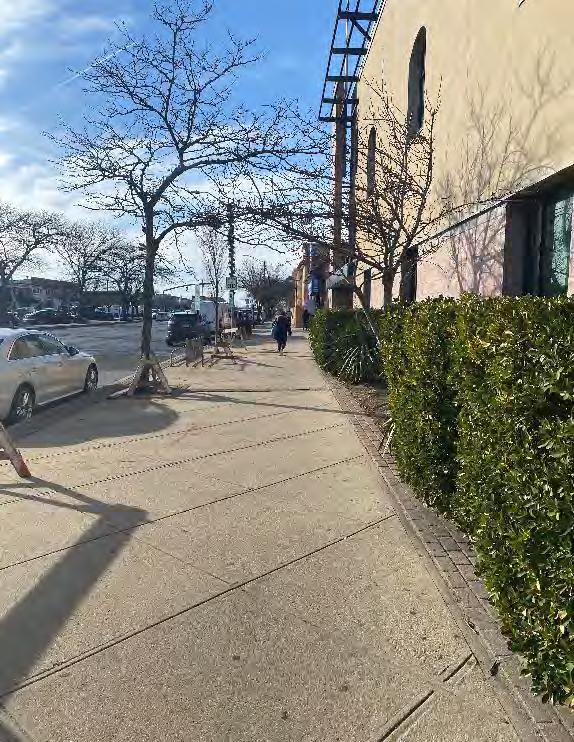
C – Minimal signage is vandalized
B – Few street trees and greenery present


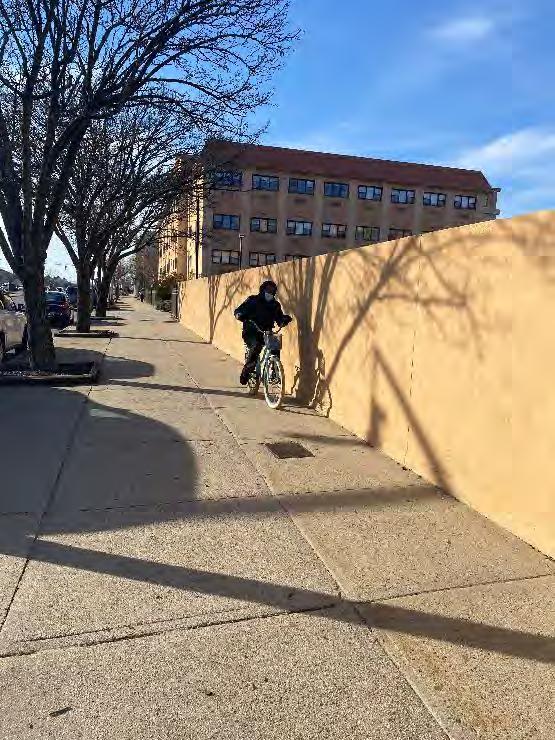
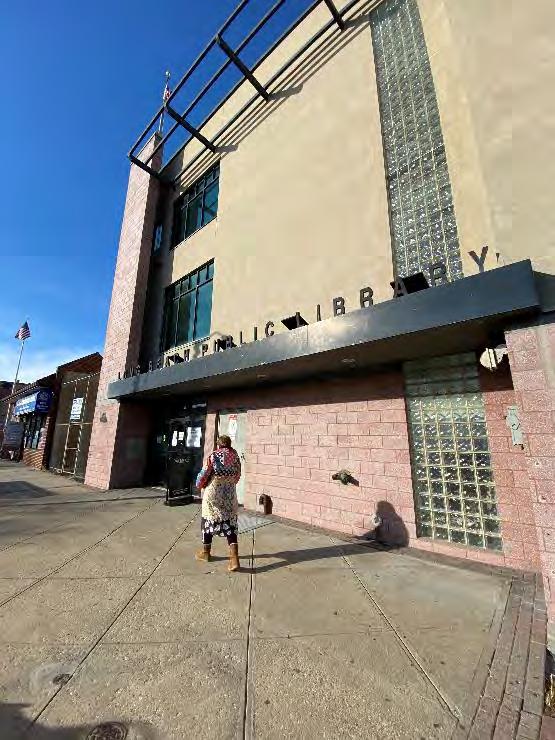

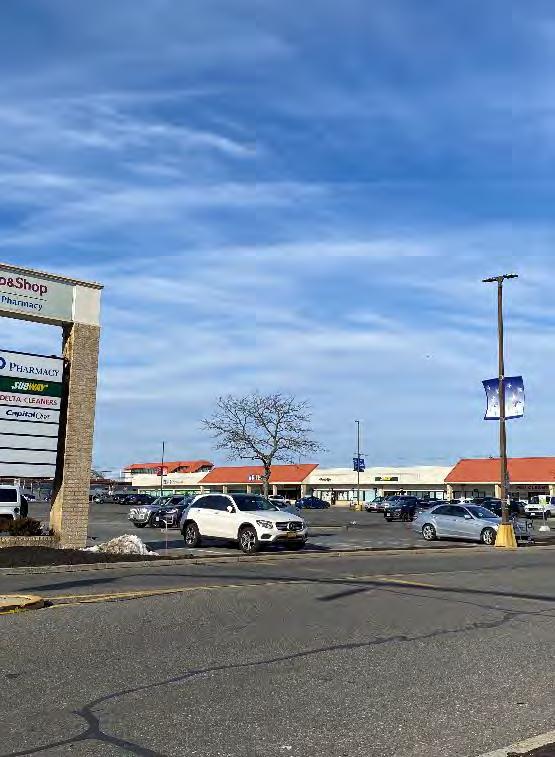

C – minimal outdoor dining
C – Facades are not apparent to pedestrians and/or vacant
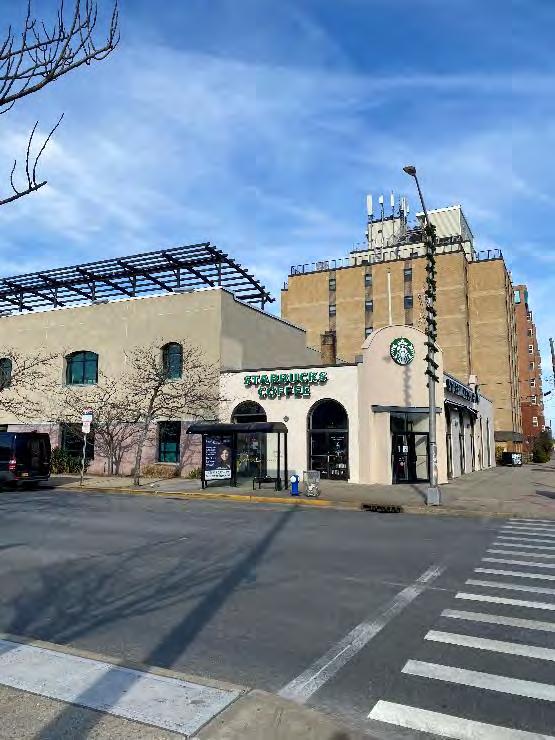

C – minimal awnings present
C – Pedestrian signage is lacking
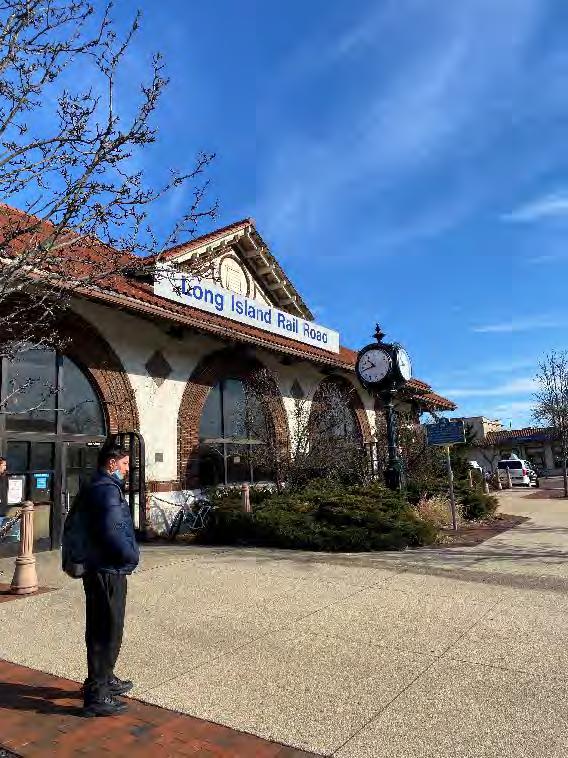
C – Wide curb cuts limit walkability and create pedestrian discomfort
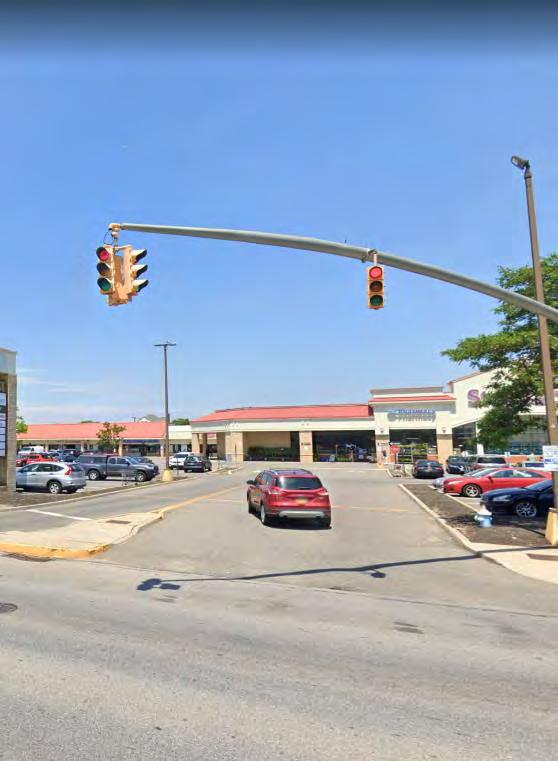
Window
Outdoor Display/Dining
Signage – C • Awning – C
Façade – C • Lighting – B

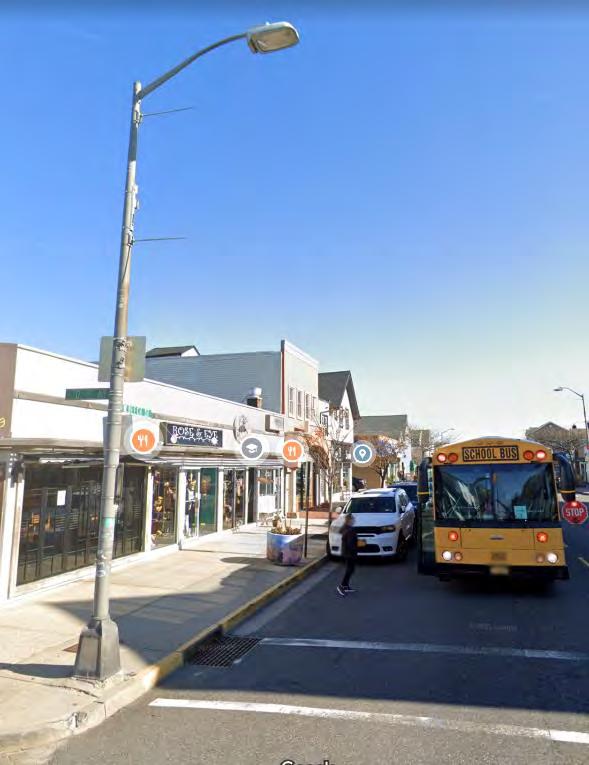
sidewalk lighting
B – Sidewalks are in satisfactory condition
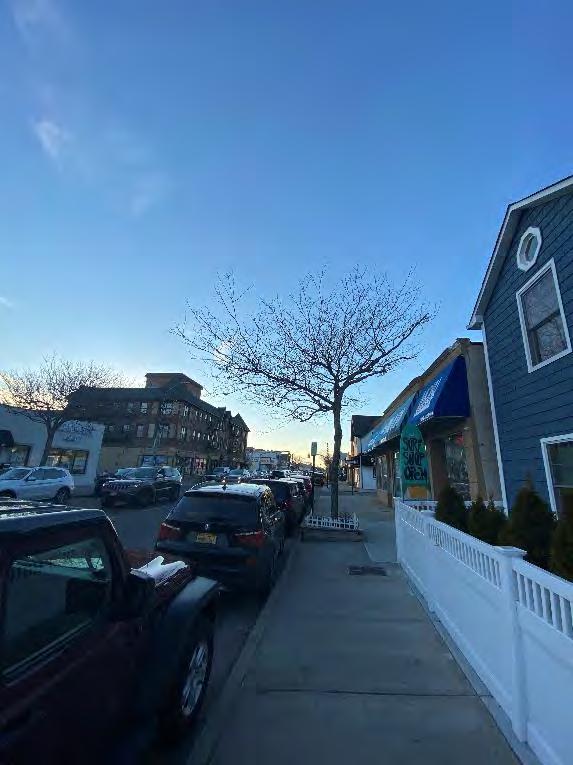
A – no curb cuts throughout sidewalk
 C – Lack of
B – Few street trees benches
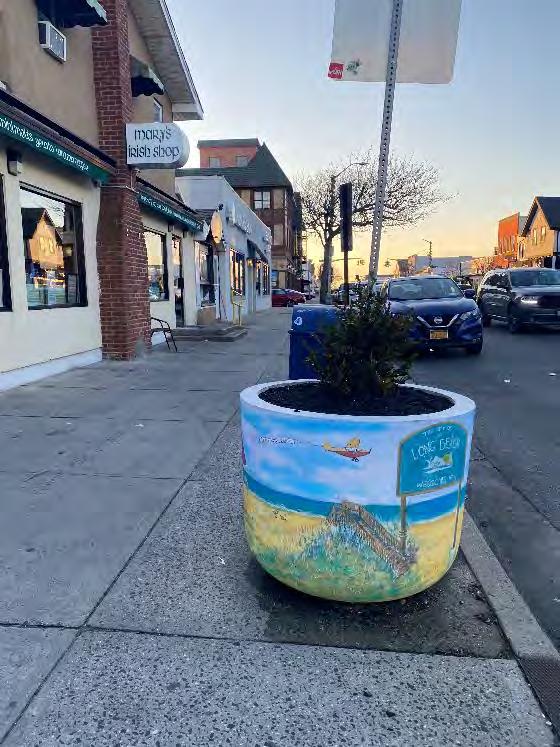
B – Satisfactory Signage

B – limited signage identifies the district
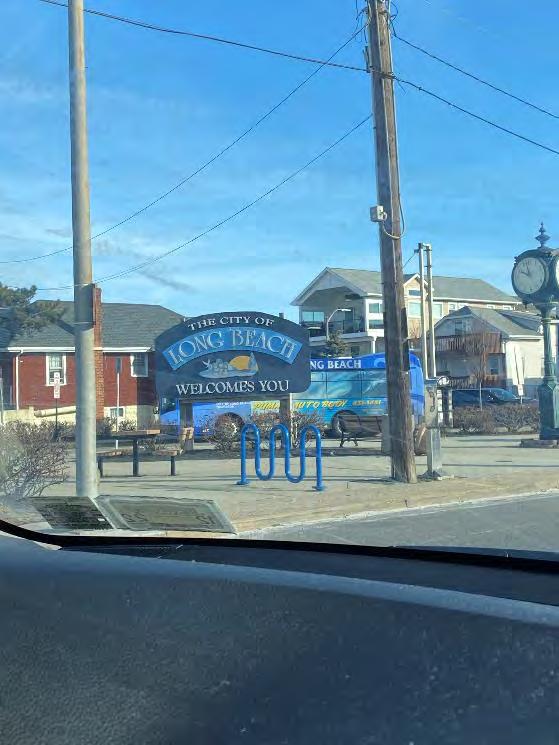
B – Satisfactory roadbeds & crosswalks
B – Alternative methods navigating the district in satisfactory condition

• Sidewalks – B

• Street Trees & Benches – B
• Lighting – A
• Wayfinding/Signage – B
• Roadbed & Crosswalks - B
A – Businesses have adequate lighting

A – Outdoor dining present at multiple businesses
A – Exceptional signage present
A – Awnings present at most businesses
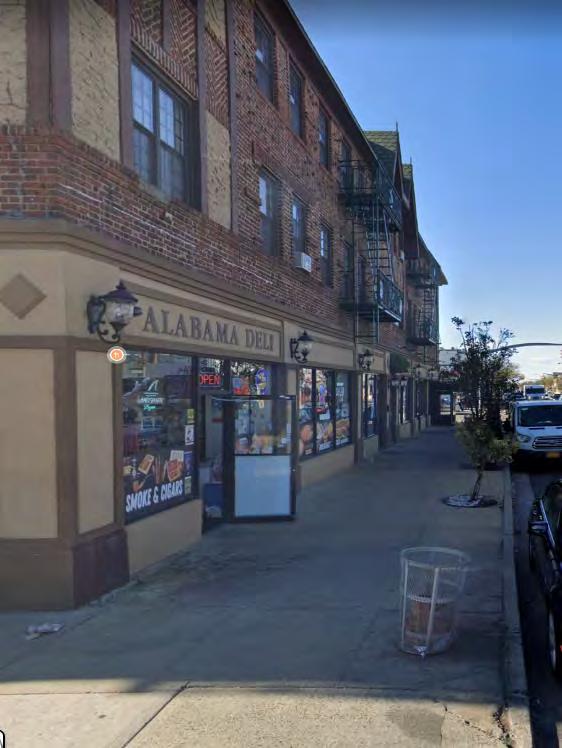
A – strong concentration of retail offerings

C – Lack of blade signage
A – Well maintained facades

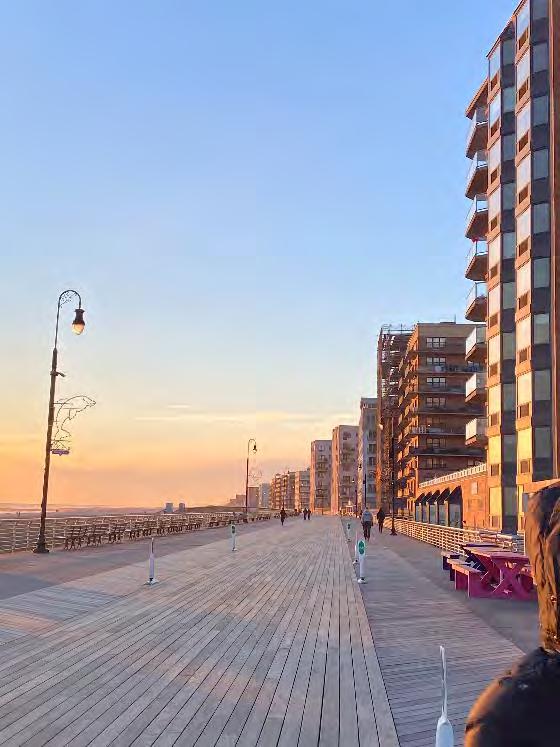
A – Adequate lighting
A – Shared bike lanes present
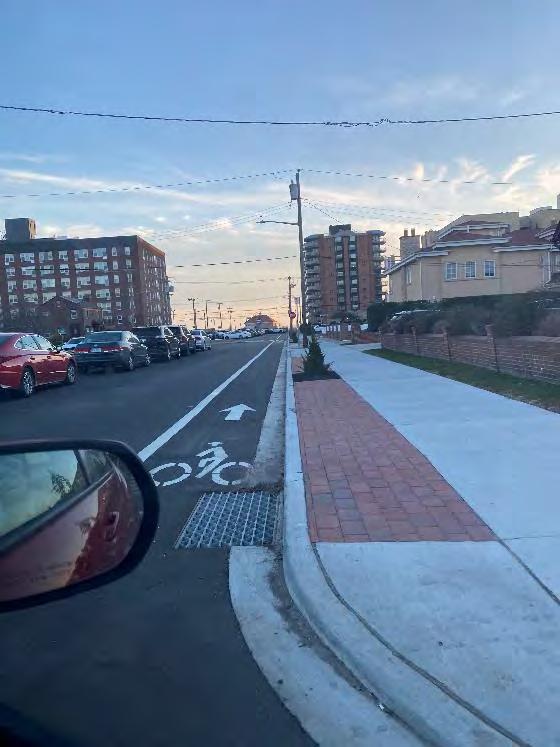
A – Exceptional sidewalks

A – Several benches
C – Limited informational pedestrian/cycling signage pointing to corridor distance
B – Weathered crosswalks and roadbeds leading up to boardwalk – improvements underway
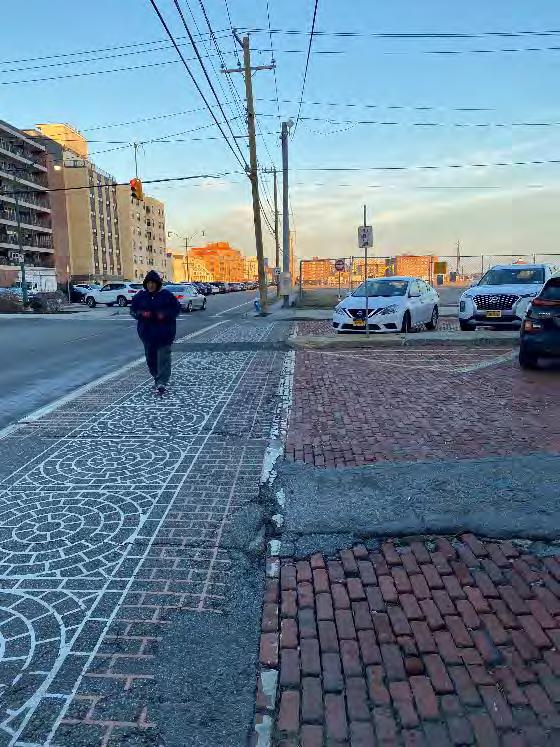
 A – Signage along boardwalk

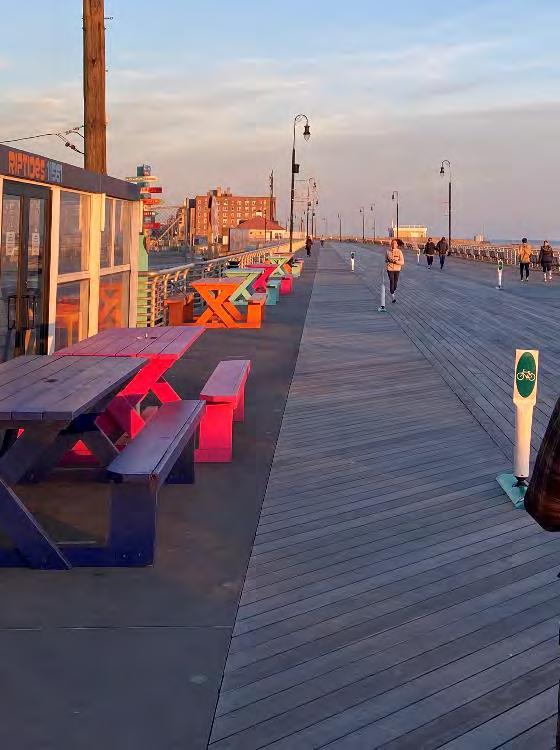
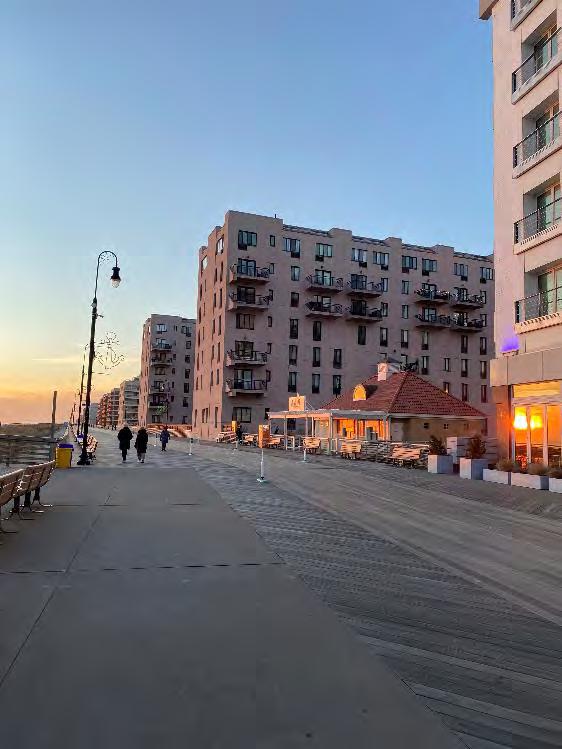
 A – Outdoor dining present
C – Signage/awnings at some establishments
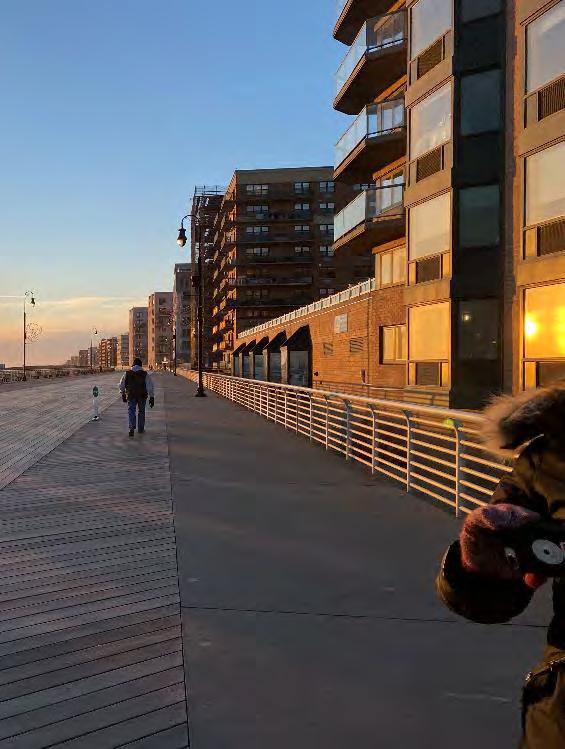
B – Windows present at some establishments

A – Exceptional lighting
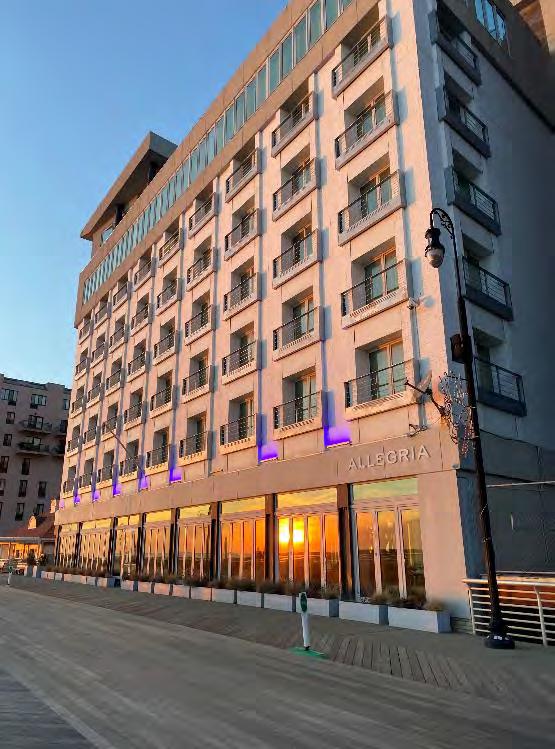 A – Well maintained facades
• Window – B • Outdoor Display/Dining – A • Signage – B • Awning – B • Façade – A • Lighting – A

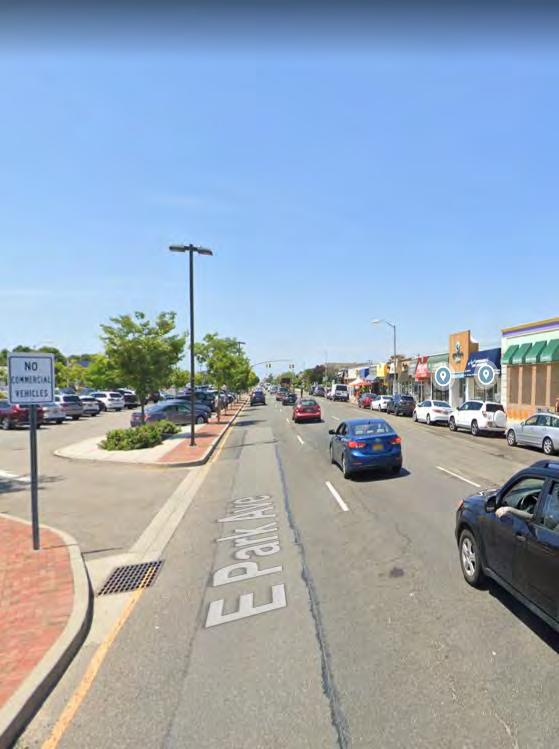
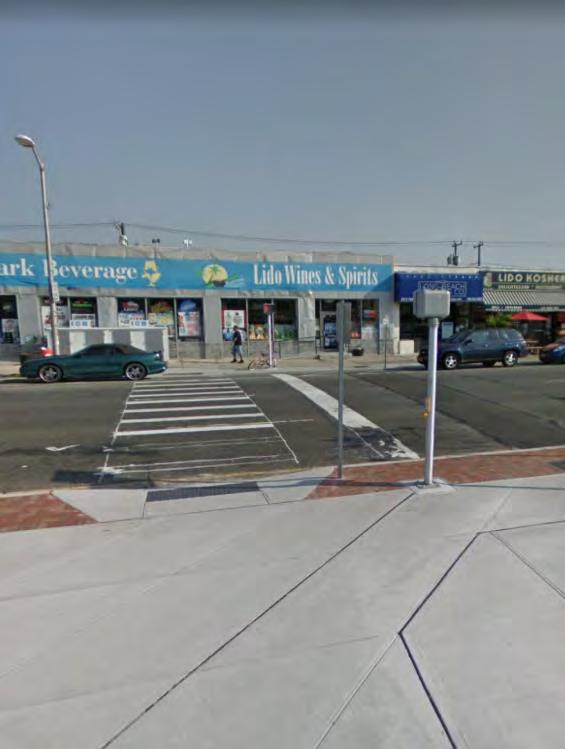
 B – Satisfactory roadbeds and crosswalks
A – Exceptional lighting
B – Street trees present – lack of benches
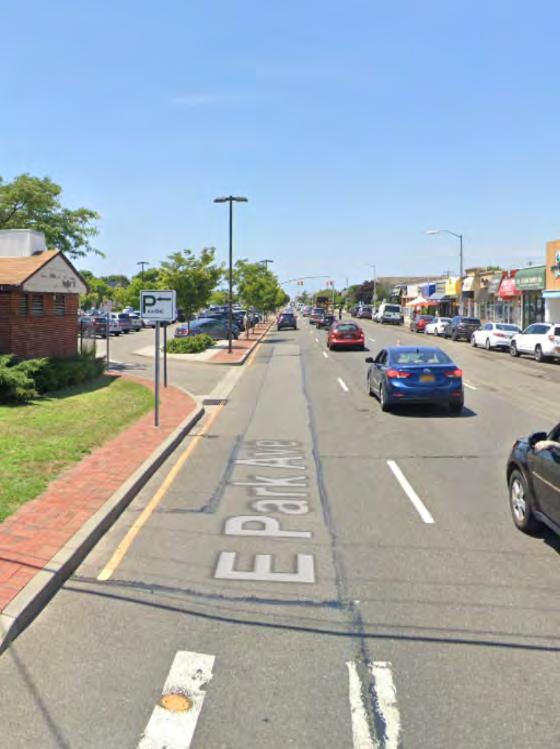
A – Good signage throughout
C – No pedestrian sidewalk lighting
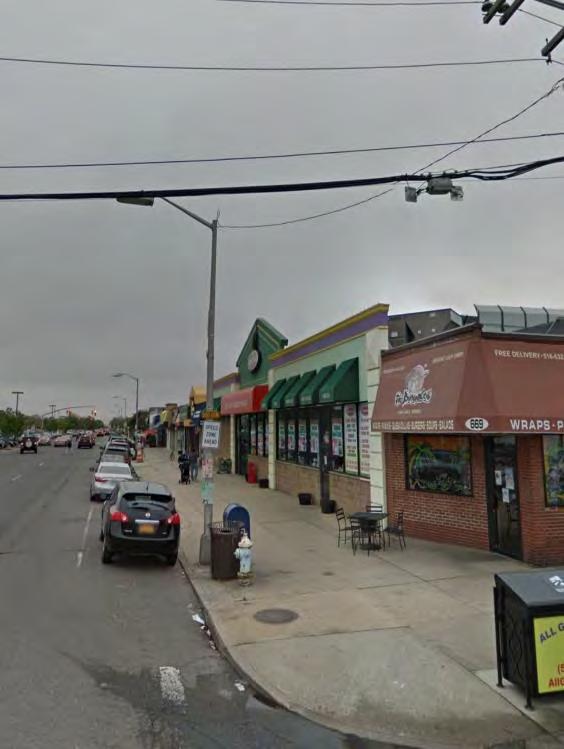
A –Exceptional sidewalks


C – Lack of blade signage

A – Awnings present at most businesses
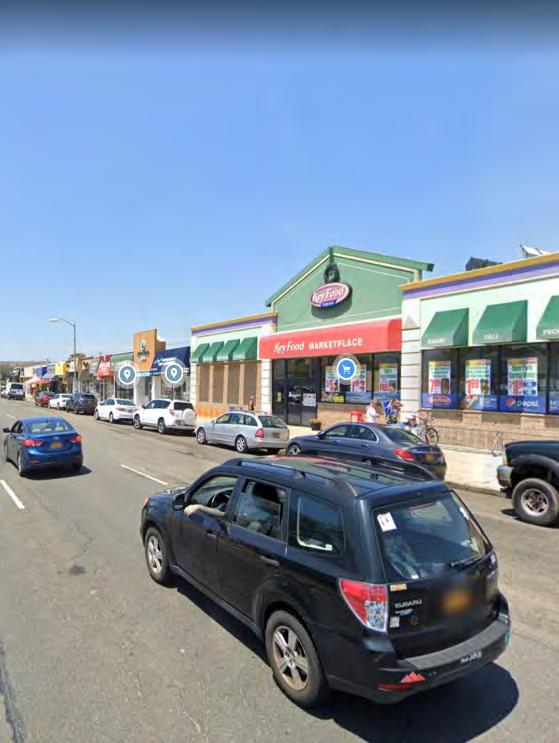
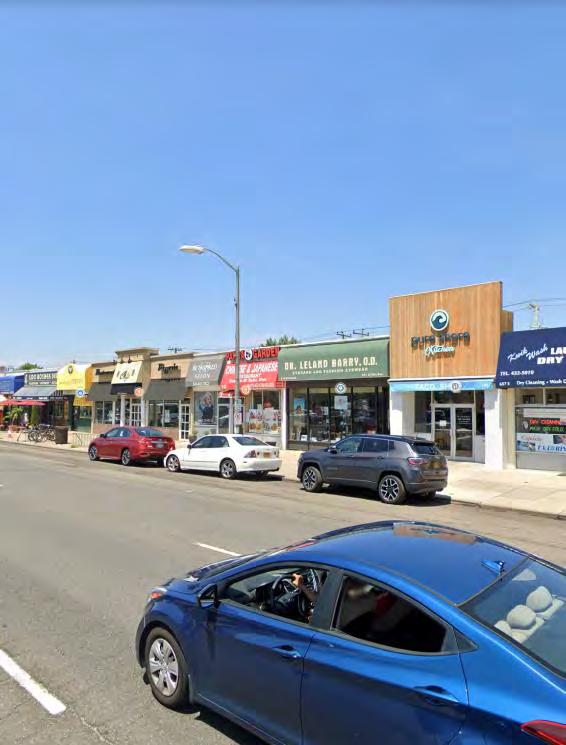
A – Well maintained facades
A – Lighting present at most businesses
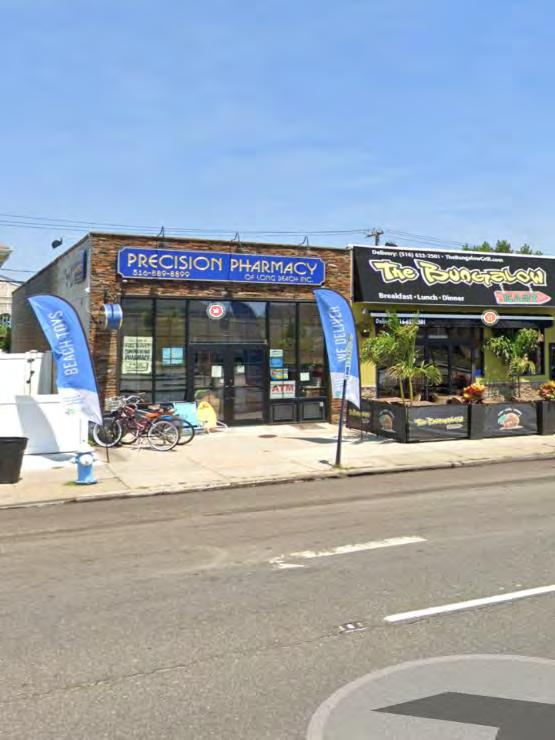
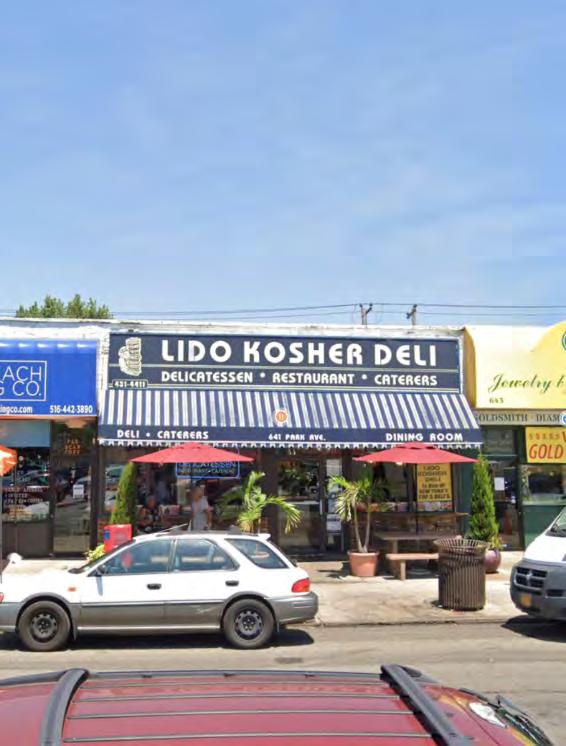
 A – Good signage
A – Outdoor dining present

Banner signage throughout
Welcome sign
Storefronts in poor condition
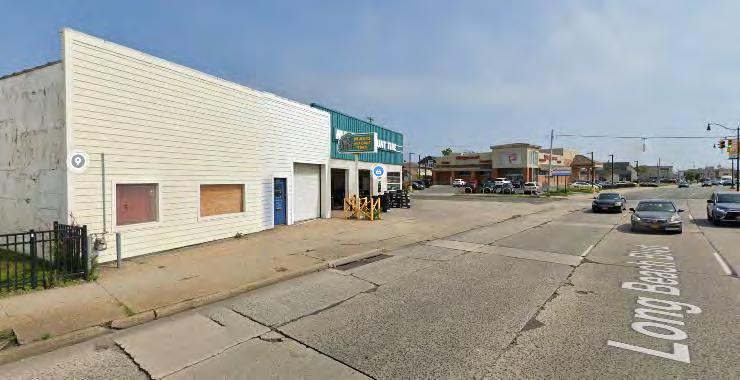
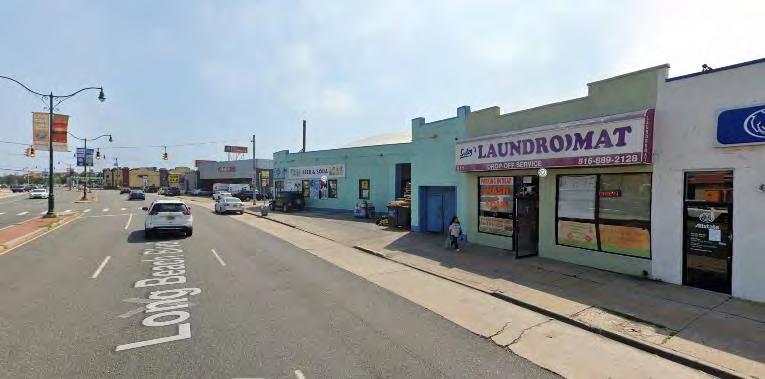
Roadbeds/sidewalk
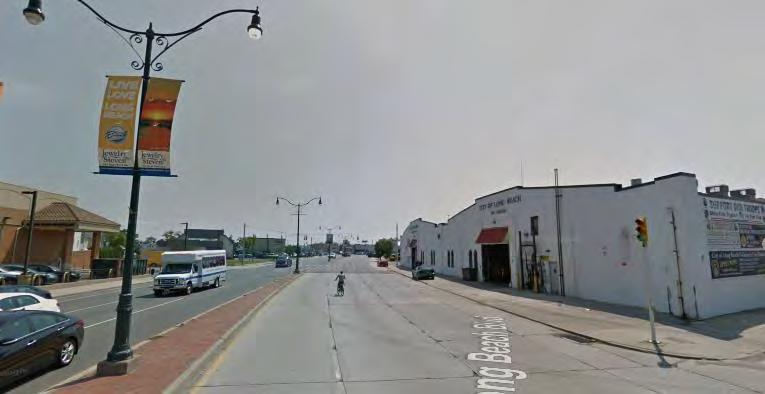
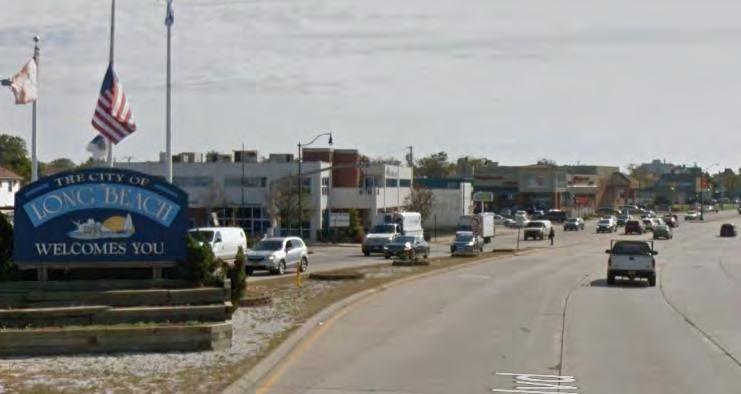
s in poor condition
 Lacks pedestrian infrastructure
• Sidewalks – C

• Street Trees & Benches – C
• Lighting – C
• Wayfinding/Signage – B
• Roadbed & Crosswalks - C
• Window – C
• Outdoor Display/Dining – N/A
• Signage – B-

• Awning – B-
• Façade – C
• Lighting – B-

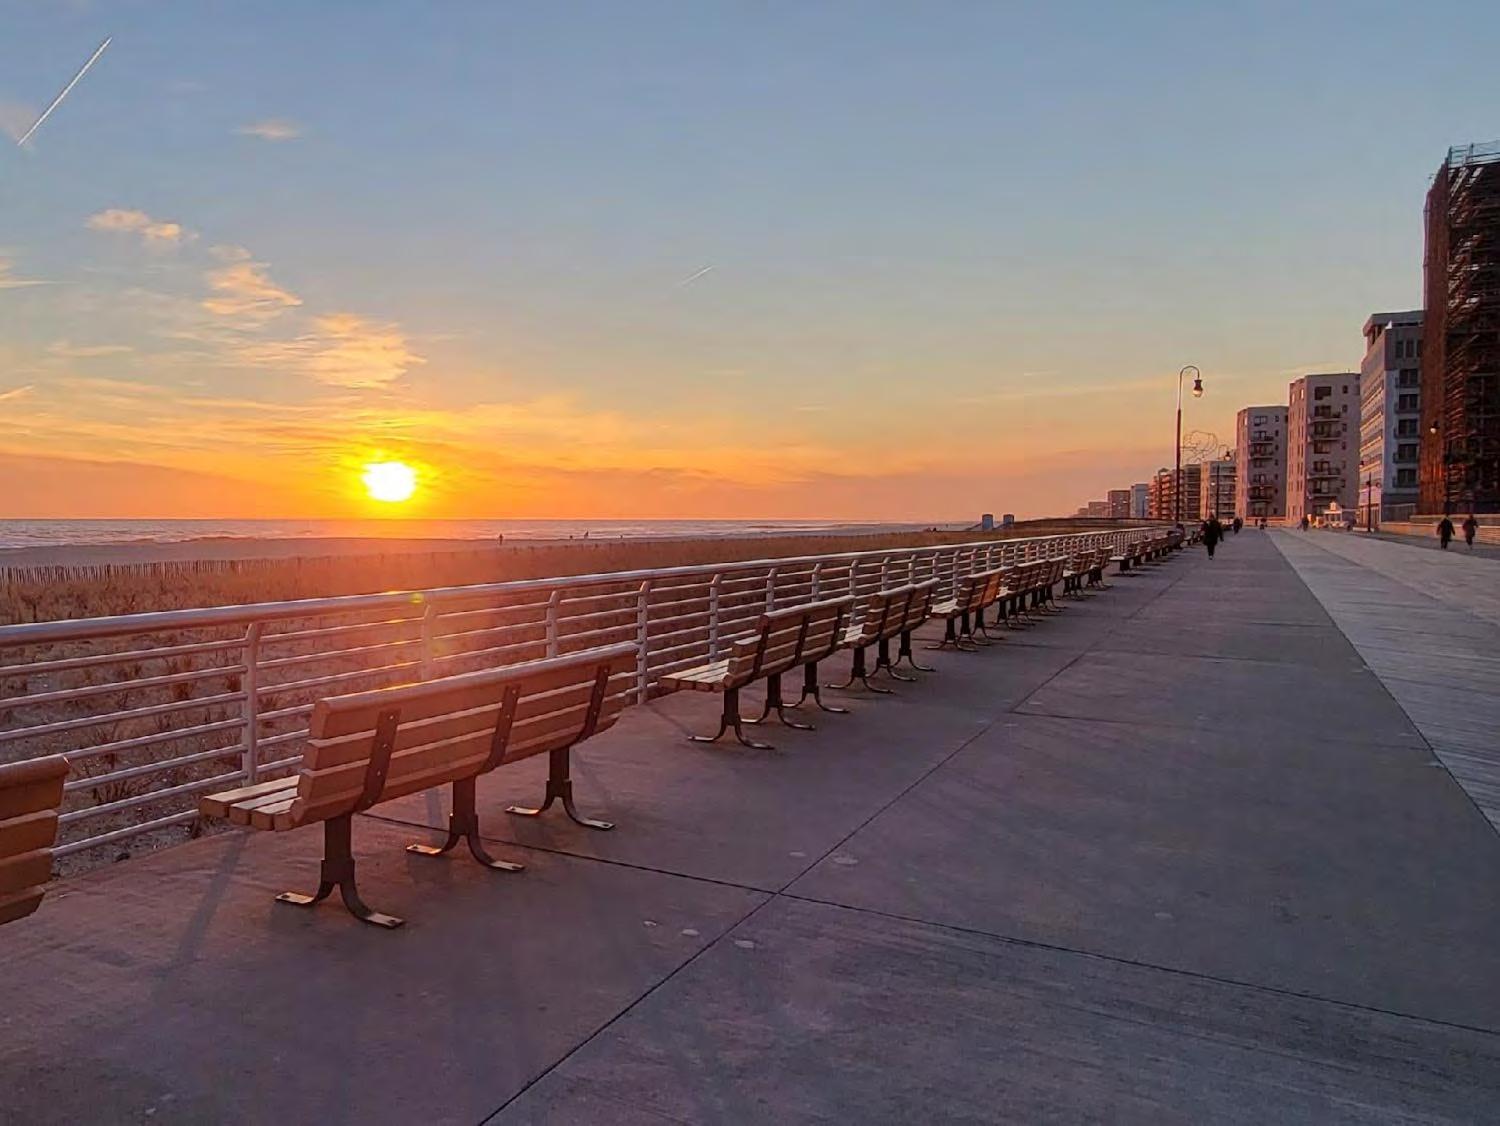
Demographics
Land Use + Zoning
Housing
Economic Development + Commercial Corridors
Transportation + Circulation
Community Facilities + Infrastructure
Parks, Recreation + Open Space
Cultural + Historic Resources
Natural Resources
Climate Resilience

This analysis is to serve as a snapshot of Long Beach today.
It uses the most recent and publicly available data including but not limited to:

2020 U.S. Census (Not all 2020 Census data is currently available)
2019 American Community Survey
Others as noted
Data sources as of July 2022.
There may be errors and omissions in this preliminary analysis due to the nature of the data, however, all data points will be updated as the data becomes available and upon further review by the consultant, City Staff and the PAB.
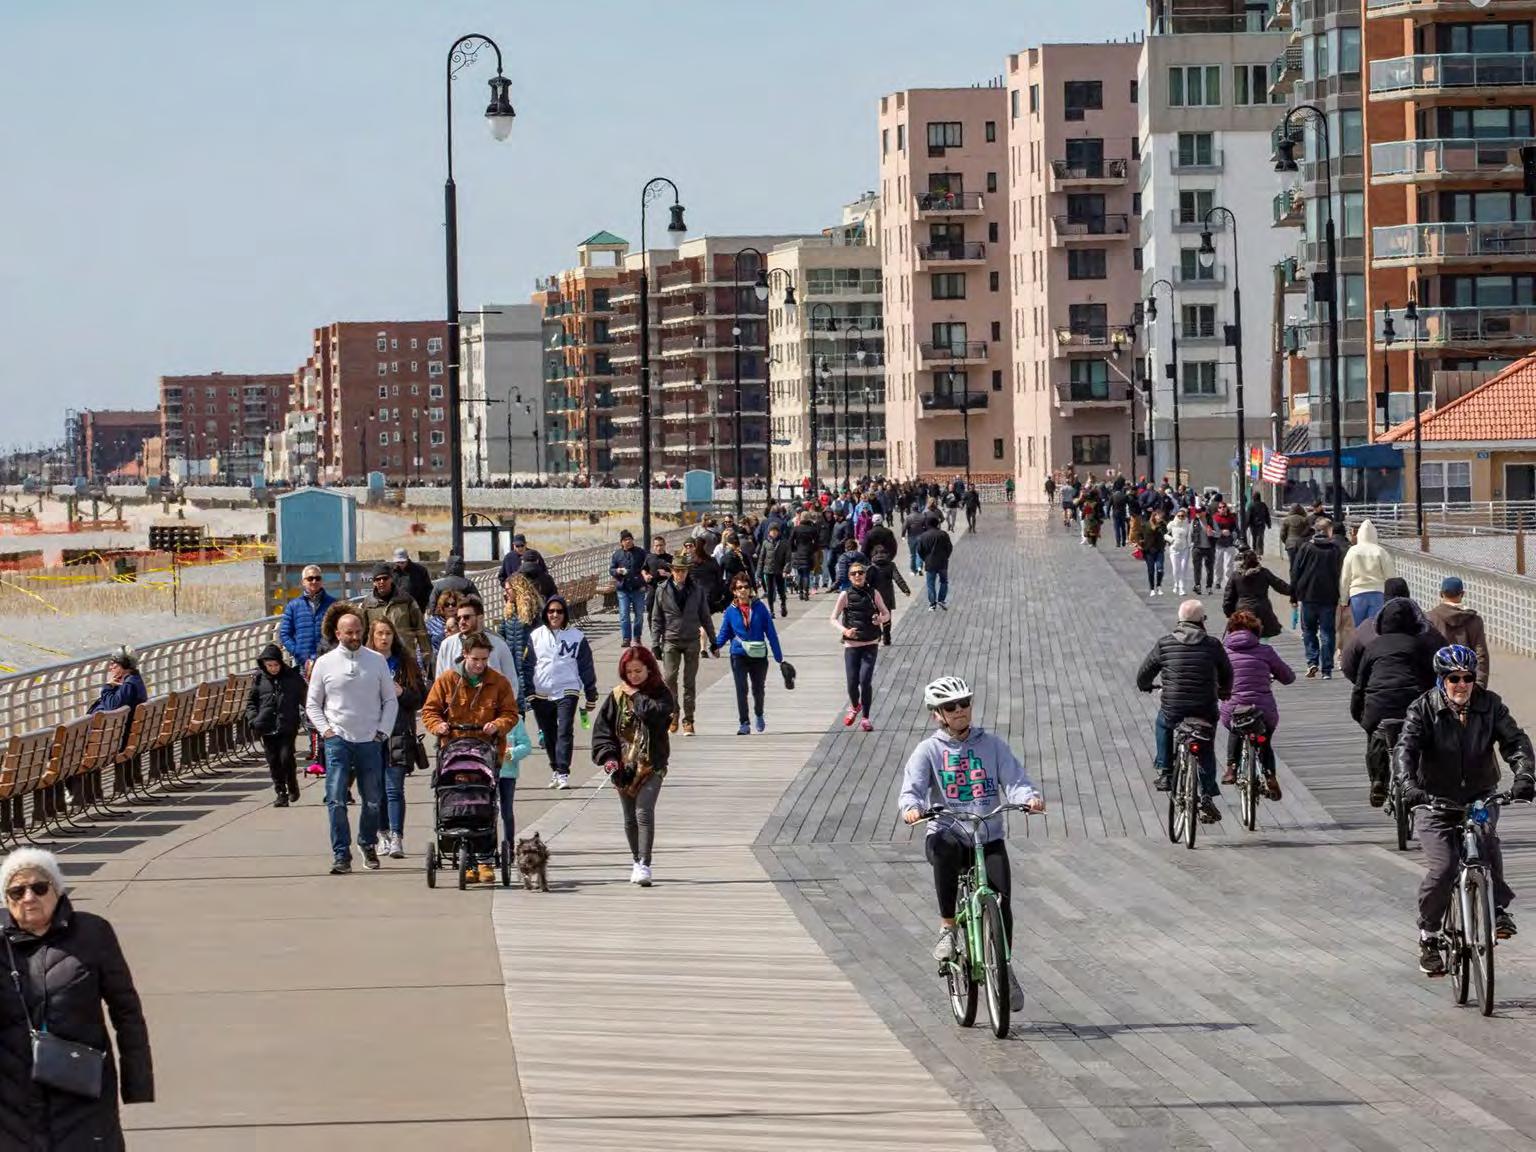
Long Beach experienced its fastest population growth from the 1950s to 1970s.
Population has been relatively stable since 1970; 1.1% decline from 2000-2020
ESRI population projections show an 8% decline between today and 2026, however, other City indicators point to continued stabilization and slight growth.
Sources: U.S. Census Bureau Decennial Census, 1950-2010. Projected Population by ESRI
Population Projections provided by ESRI rely on a number of census data sets along with private, and proprietary methods. Population projections rely on the recent past to give insight on the near future.

The combined population density of Long Beach is 15,655/mi2. (>10,000 category) and is higher than most adjacent communities
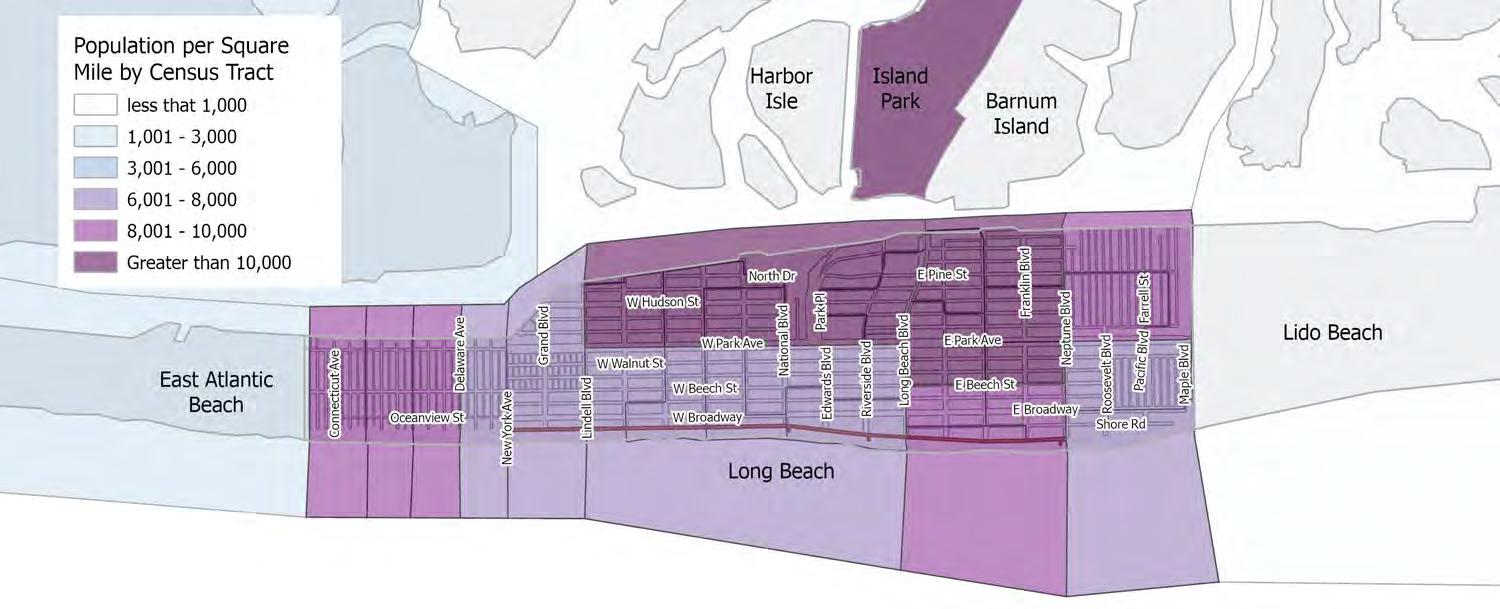
Island Park is also in the >10,000 persons/mi2 category while East Atlantic Beach and Atlantic Beach fall in the 2,000-4,999.9 persons/mi2 category. Lido Beach falls in the 50.099.9 persons/mi2 range.


Older adult (55-79) population grew between 2010 and 2019.
Population aging in place.
Greatest drop is in older working age adults (40-44) and older children (15-19). As of 2019, Long Beach’s median age was 44.9 years old, older than the County and State.

Nassau County 2020
Racial Composition
Long Beach 2020
Racial Composition
White
Black or African American
American Indian and Alaska Native
Asian
Native Hawaiian and Other Pacific Islander
Some other race alone
Two or more races
Hispanic or Latino (all races)
The population of Long Beach and Nassau County is diversifying.

Nearly all racial or ethnic groups have grown since 2010 except the African American population which decreased 7.0% in Long Beach since 2010.
13.4% of the Long Beach population is foreign-born.
Nassau County is more diverse than Long Beach (see details on next slide).

2.31 Average Household Size in Long Beach

2.99 Average Household Size in Nassau County
Average household size in Long Beach is increasing. As of 2019 average household size is 2.31, up from 2.18 in 2010.
Long Beach has smaller household and family sizes compared to Nassau County.
ACS 2019
High School Diploma or Less Some College Associates Degree Bachelor's Degree Graduate Degree

5YR American Community Survey 2019
▪ Almost 50% of adults aged 25 years old and over have a Bachelor’s degree or higher – higher than State (36.5%) and County (46%).
▪ Median Household income in Long Beach is about 42% higher than New York State but 16% lower than Nassau County.

▪ The population of Long Beach has a higher level of education attainment (previous slide) but lower salary than that of Nassau County as a whole.


There are fourteen designated low- and moderate-income (LMI) census block groups in Long Beach where at least 51% of persons are LMI individuals based on 2010 US Census information supplied by the County.
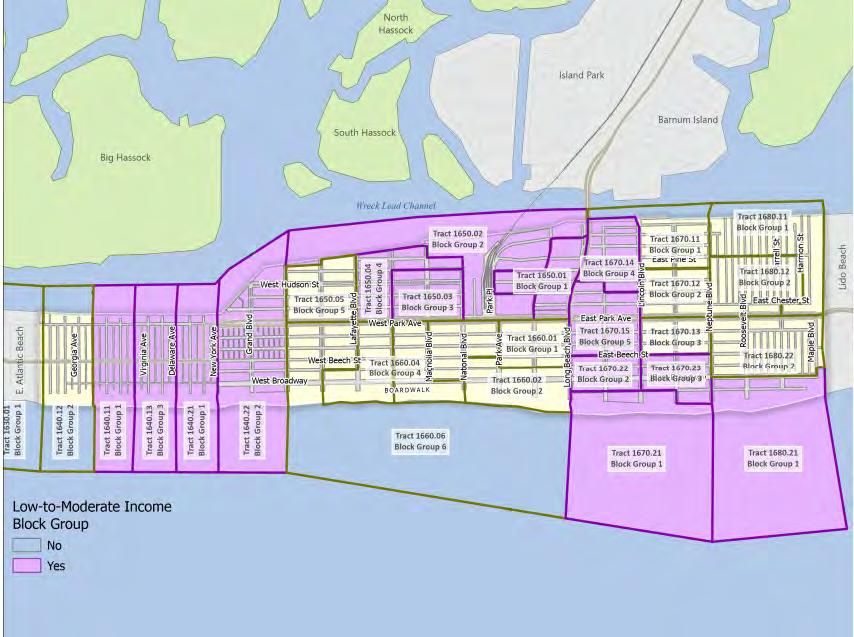

School enrollment in Long Beach declined by 15% between 2005 and 2020.
▪ The 2012-2013 dip in enrollment was due to Superstorm Sandy.
▪ Enrollment has remained relatively stable over the last 3 years.

Population is remaining stable.
Long Beach population is denser than adjacent communities.
Older adult (55-79) population growing.
Older working adults (45-49) and early 20s populations are declining.
Less diversity than Nassau County and African-American population has declined.
Household size is 2.31 – lower than Nassau County.
Higher education but lower salaries than Nassau County.
Fourteen (14) US Census Blocks Groups qualify as LMI.
Public school enrollment has declined but stable.

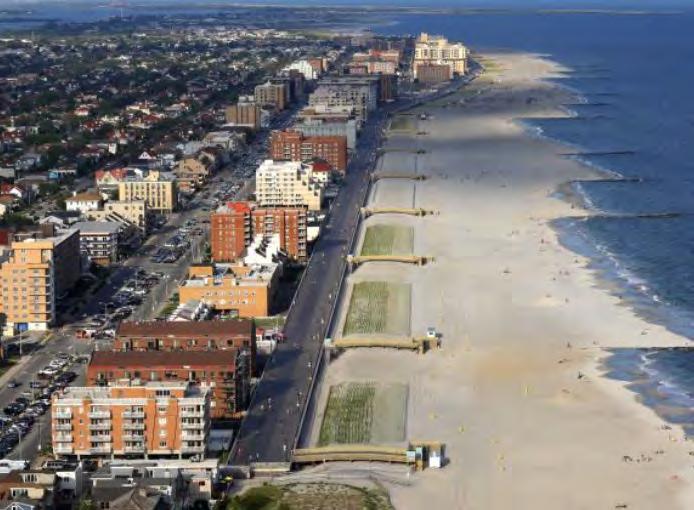
The City’s downtown is organized around the City Hall government center and multimodal transportation center that act as the hub of the main commercial district.
Public facilities, industry and institutions define the central portion of the City’s Bayfront.

48% of the City is designated as residential. Single-Family is most dominant, with 59% of residential land being single-family.
15.9% is designated as government, community services, and recreational uses.

City of Long Beach and SLR

Traditional grid pattern featuring wide boulevards and narrow side streets.

81% residential uses mixed with commercial areas and other uses.
Current zoning has been in place since 1980s.
Impacts land use decisions being made today under different conditions and preferences including resiliency needs.
Bayfront –
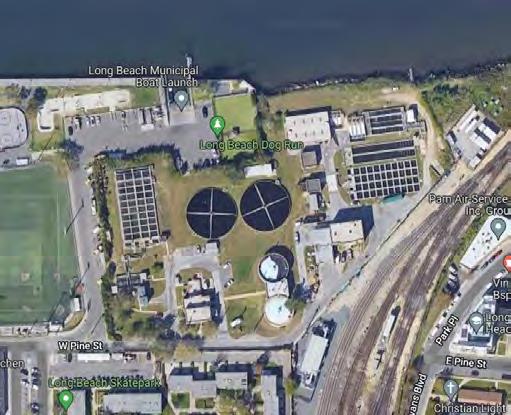
Sewage
treatment plant
(to be converted to a pump station)
Stop & Shop site
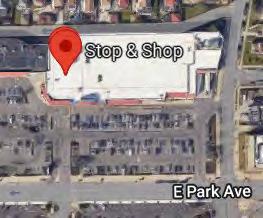

City Hall/Plaza/Parking Lot
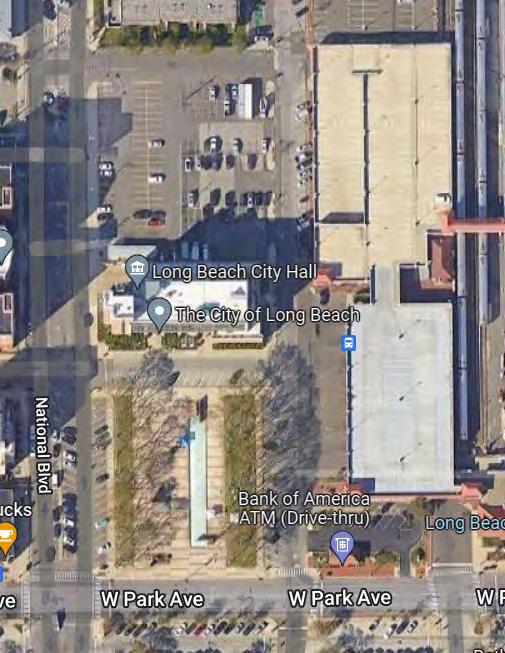
• Residential land uses are the dominant existing land use at 48 %.
• Commercial & Industrial land uses make up 3.8% of land.
• The current zoning map and regulation date from the 1980’s. There have been some amendments to the Zoning Code but are in need of a review and update.
• The City’s current Comprehensive Plan dates from 2007; an update was undertaken in 2018 but was not adopted.
• The City has identified several opportunity sites including the City Hall/Plaza/LIRR parking garage sites, the Stop and Shop site along E. Park Avenue, the Bayfront Sewage Treatment Plant, and several other sites along the Bayfront between the LIRR and Long Beach Boulevard.

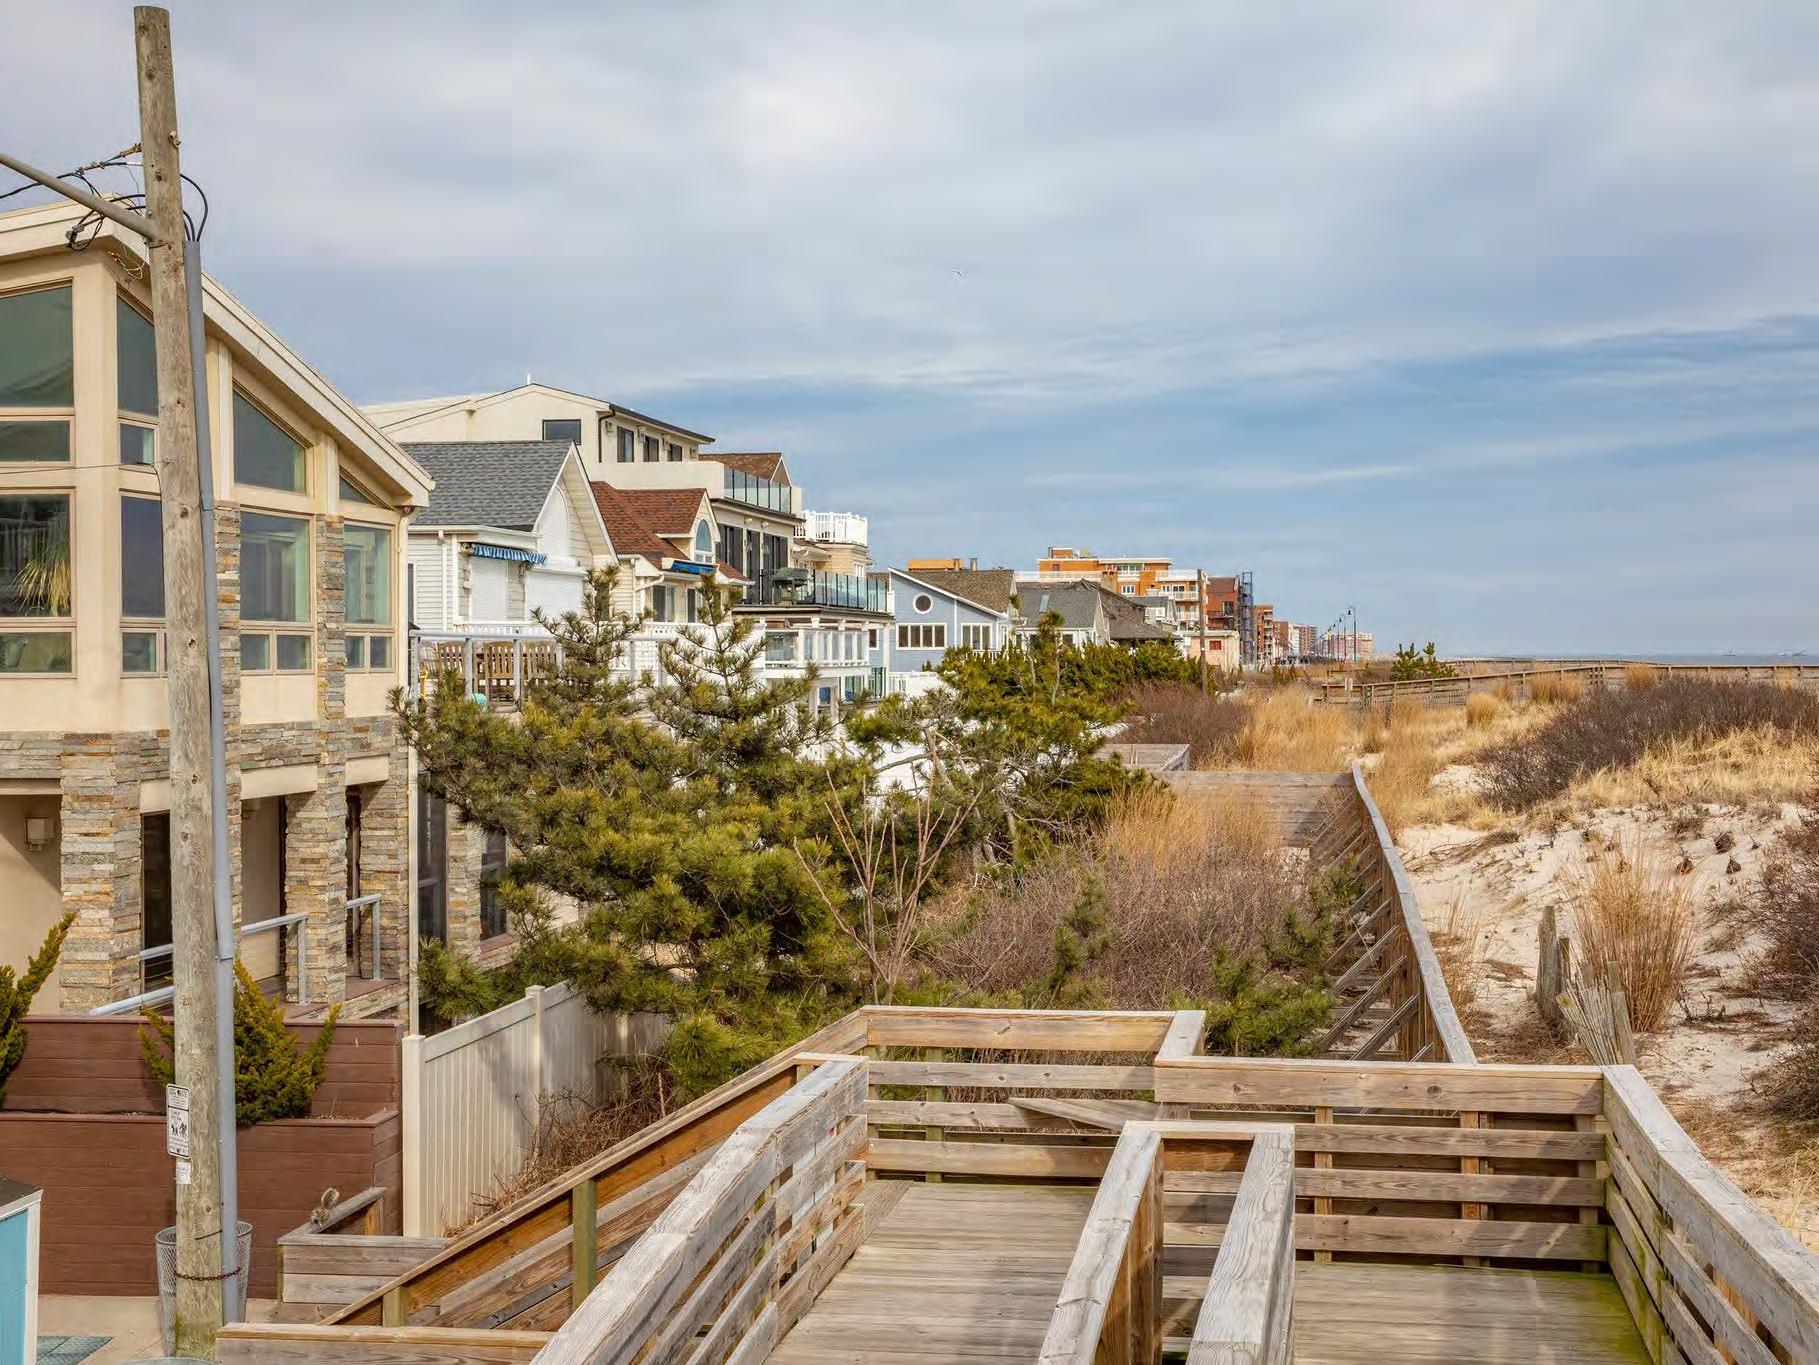
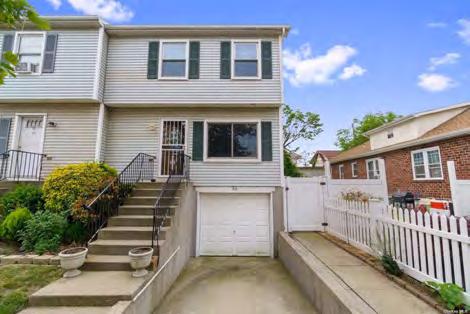
Long Beach neighborhoods have unique identities and offer diverse housing options as well as challenges.
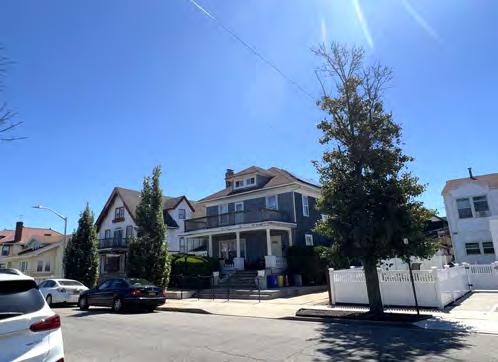
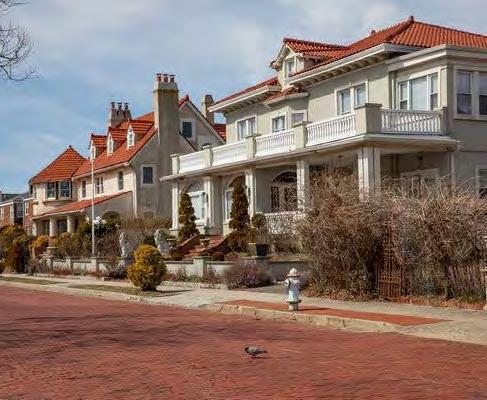
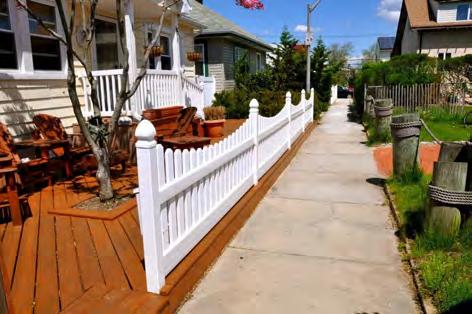
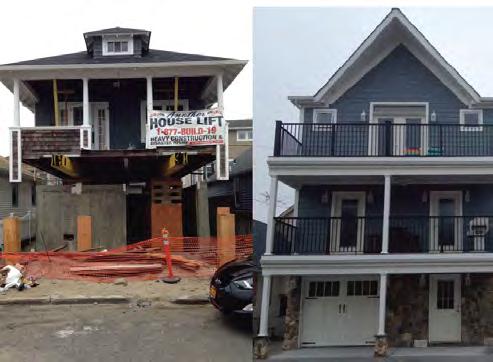

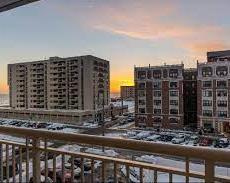
Long Beach neighborhoods have unique identities and offer diverse housing options as well as challenges.
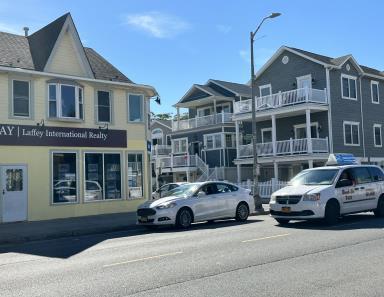
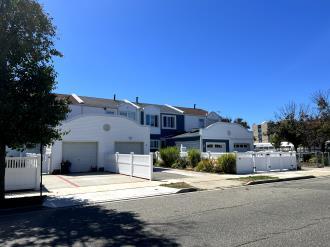
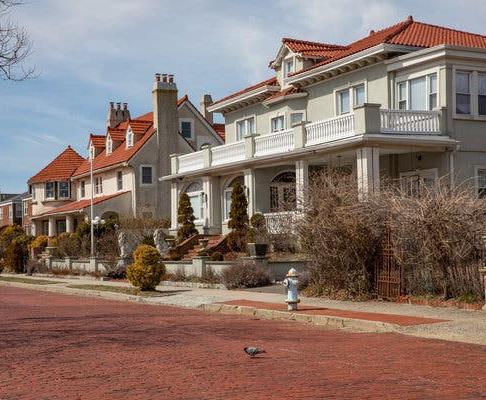


Long Beach Housing Tenure (2019)

Nassau County Housing Tenure (2019)
Owner-Occupied Renter-Occupied
Owner-Occupied Renter-Occupied
Nassau County, as a whole, has a significantly higher portion of housing that is owner-occupied at 80.6% compared to 57.5% in Long Beach.
Long Beach Owner Occupied Housing Units by Type
Long Beach Renter Occupied Housing Units by Type
Mobile Homes, 1% Boat, RV, van, etc., 1%
MultiFamily, 42%
Single Family, 58%
Single Family, 21% Multi-Family, 77%
• A majority of owner-occupied housing are single-family homes (58%) while most renter-occupied homes are multi-family units (77%).

20 to 49 units, 4.9%
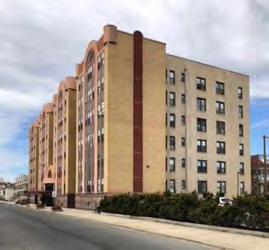
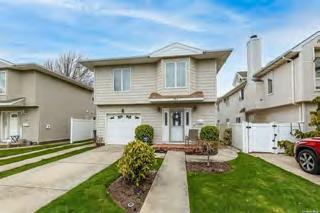

50+ units, 26.6%
Single family detached, 38.7%
10 to 19 units, 1.9%
5 to 9 units, 2.8%
Two-family, 16.5% 3 or 4 family, 4.1%
Single-family attached, 4.2%
• Single-family detached (38.7%) is the most common housing type and multi-family with 50+ units (26.6%) is the next most common.
• Long Beach’s unit sizes by number of bedrooms is fairly evenly split with 3bedroom units being the highest at 29.1%. Nassau County has less diverse unit sizes and has greater percentage of larger units.

• Approximately 48% of Long Beach housing units are 3-bedroom or larger while approximately 75% of Nassau County’s are 3-bedroom of larger.

Source: City of Long Beach, 2010 US Census, 2020 US Census

Long Beach Housing Building Permits
5 new multi-family dwellings since 2012
493 one- and two- family dwellings since 2012

Balancing resiliency with neighborhood character is a challenge as homes were rebuilt and elevated above FEMA Base Flood Elevation. After Superstorm Sandy, 10% to 15% (approx. 1200 units) of the housing stock was required to be raised. The new heights of homes alter the traditional streetscape.
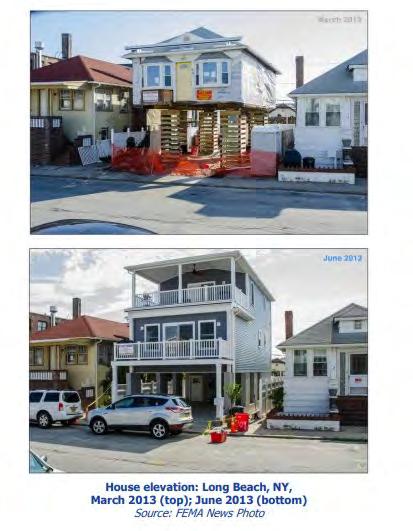
Second-story additions and raised building elevations have altered the neighborhood scale.
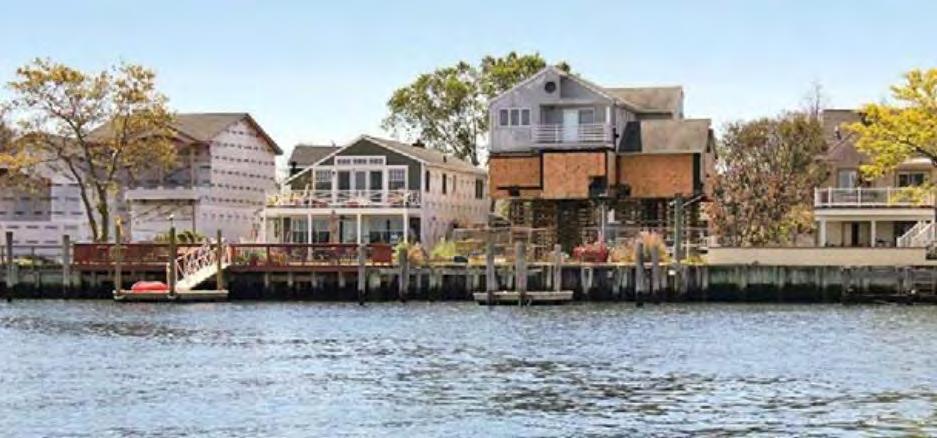
Median home values are higher in Long Beach than Nassau County, despite incomes being lower, exacerbating housing affordability issues.


Nearly half of all homes are now valued between half a million and a million dollars.
Only 3.5% of homes are valued less than $199,999. Source:

5-Year Long Beach Median and Average Home Sale Prices
Median Sale Price Average Sale Price
5-Year Nassau County Average Median Home Sale Prices
Home prices in Long Beach rose 22% between 2020 and 2021, largely a result of COVID – New York City residents seeking housing outside the City.
Nassau County average median home sale prices have also rapidly increased since 2019
Source: Redfin


Rental costs in Long Beach are distributed evenly across a number of price points but many units are renting at very high costs
Almost 25% of units cost more than $2,500
About 12% of units cost less than $999 but this does not guarantee all affordability needs are being met (to be reviewed further in Comp Plan)
• Based on the number of people in a family and income level, people fall in different income categories (low, very low, and extremely low) and meet qualifications of rental assistance/qualifications.

▪ The Department of Housing and Urban Development (HUD) recommends that no more than 30% of household income be spent on housing. This includes mortgage or rent, property taxes, HOA fees, insurance, and utilities.
▪ Households that spend more than 30% of their income on housing may have difficulty affording other necessities such as food, clothing, transportation, and medical care.
▪ Renters are more likely to be cost burdened than homeowners.
▪ 36% of Long Beach households (5,195) qualify as low-income (earning less than 80% of AMI) compared to 24.6% of Nassau County households (88,520). Long Beach has more subsidized housing units than other County communities.

Most households earning <80% of the AMI are cost burdened in Long Beach and 74% that earn <30% AMI are severely cost burdened (spend 50% or more of household income on housing).
Portions of income spent on housing by owners are similar in Long Beach and Nassau County.
34.4% of Long Beach owner-occupied households spend more than 30% of their income on housing costs.


Most renter households earning >80% of AMI are cost burdened in Long Beach and 67% that earn <30% AMI are severely cost burdened (spend 50% or more of household income on housing).
Portions of income spent by renters on housing are similar in Long Beach and Nassau County.
44.4% of Long Beach renter-occupied households spend more than 30% of their income on housing costs and are considered cost burdened.
Source: ACS 5-Year Estimates, Table B25072, B25093
Almost half (46.2%) of seniors 65 years and over are spending more than 30% of their income on housing costs and are considered cost burdened.
Seniors are more likely to be cost burdened than younger households.

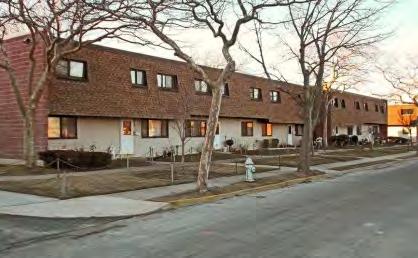
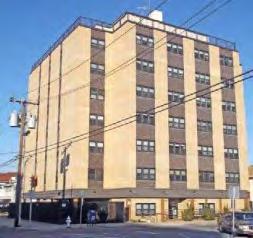
389 Section 8 rental vouchers available Presently there are 299 vouchers issued


Unique neighborhoods.
Lower home-ownership rates than Nassau County (even though Long Beach has high-rise units which offer more opportunities).
Diverse house types - SF at 38.7% and MF +50 at 26.6%.
Even spread of bedrooms types/units, better than County.
Home prices are rising at a high rate.
Rental prices are rising too.
36% of populations qualify as low income (>80% AMI).

Cost burden for Owners (34.4%) vs. Renters (44.4%) vs. County (about the same).
Older adults more likely to be cost burdened.
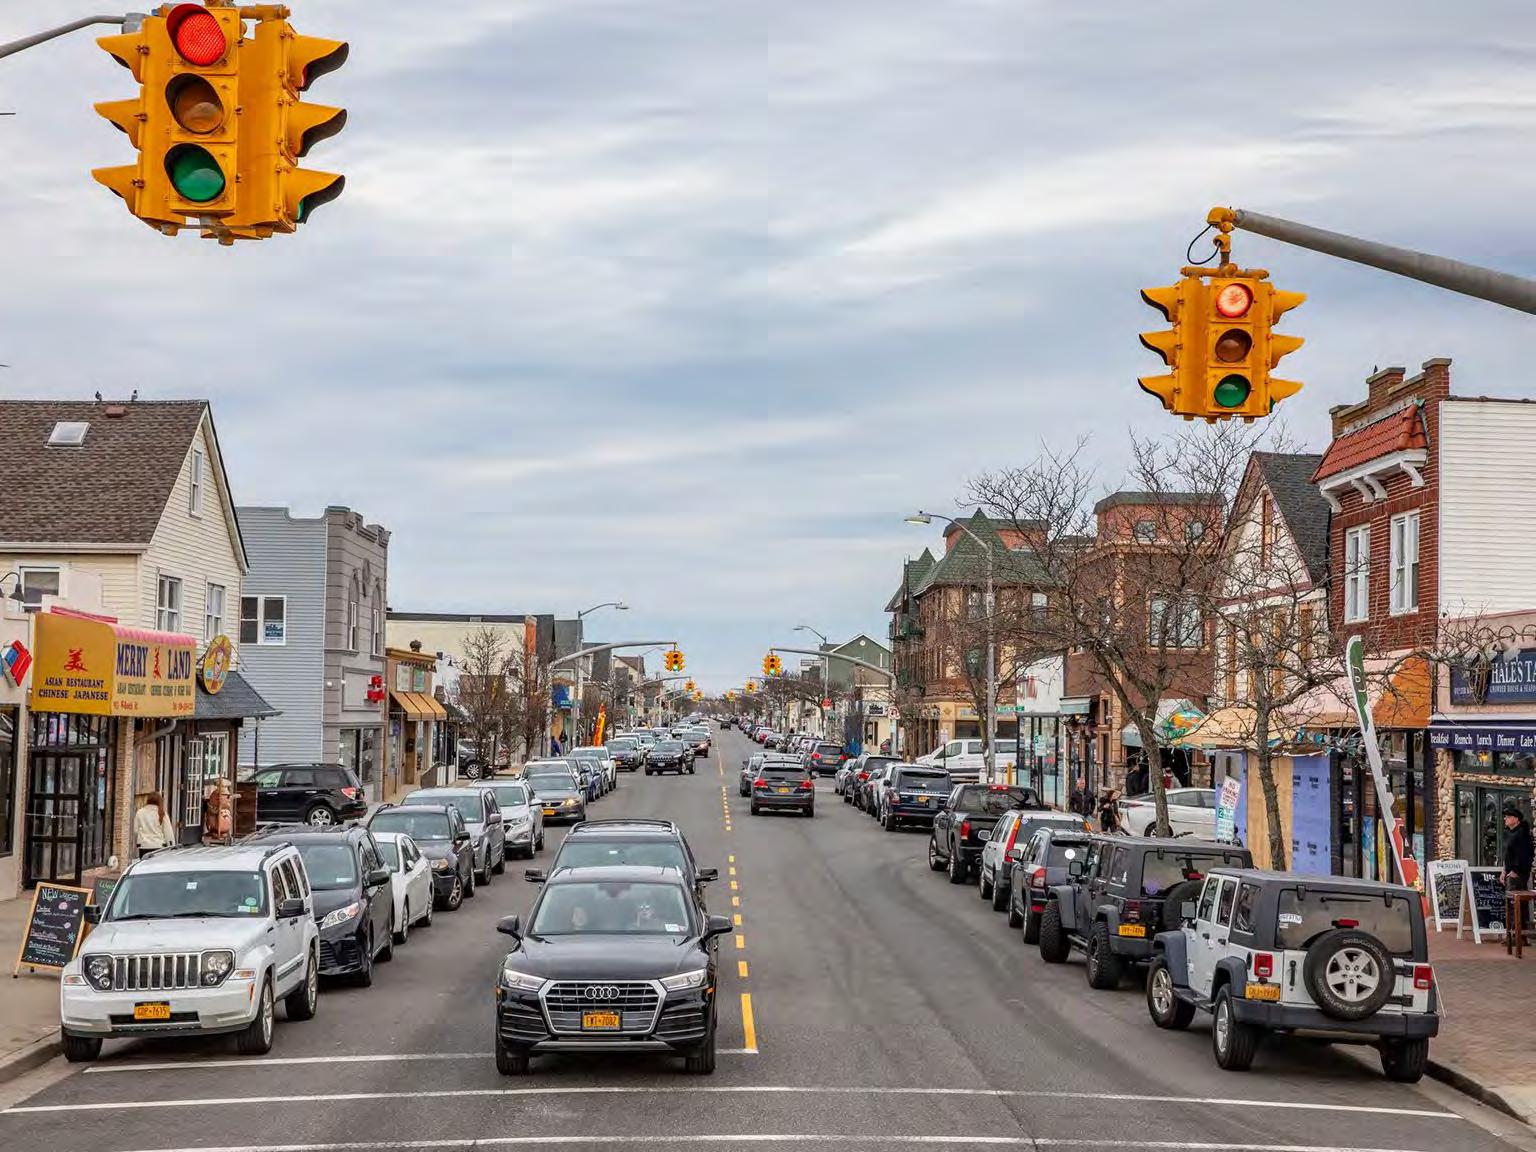
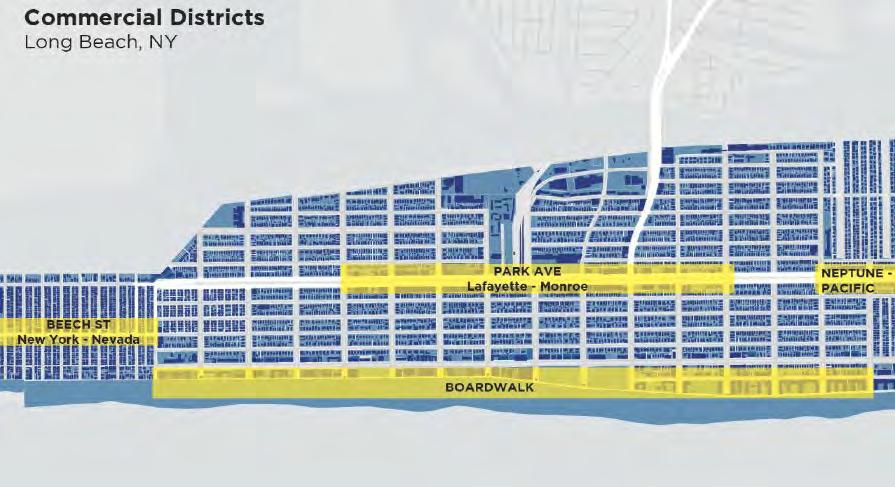

Collectively there is a total of 200K+ square feet of retail opportunity across categories aligned with the City’s commercial districts, including neighborhood goods/services, food/ beverage, and general merchandise, apparel, furnishings/other in Long Beach.
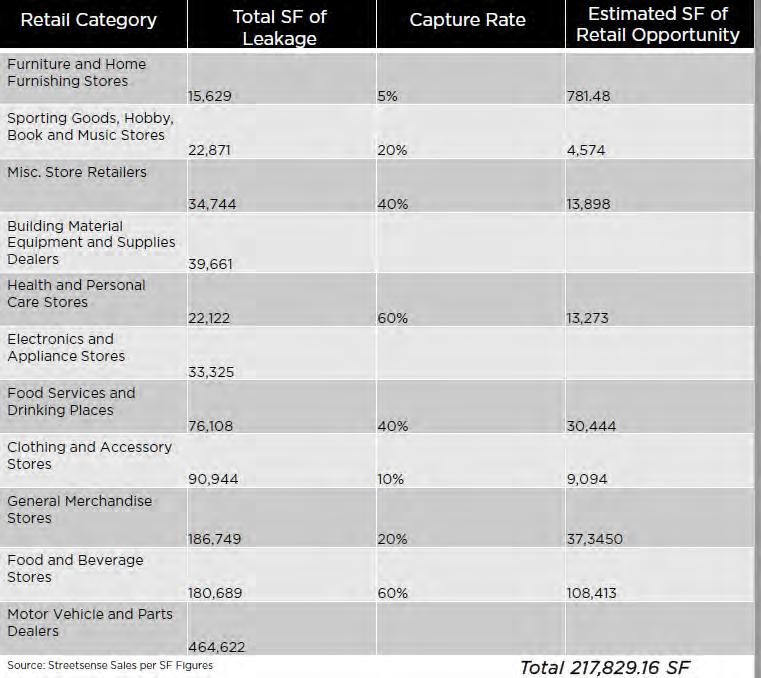

Streetsense subconsultant is analyzing current commercial area conditions and making recommendations.
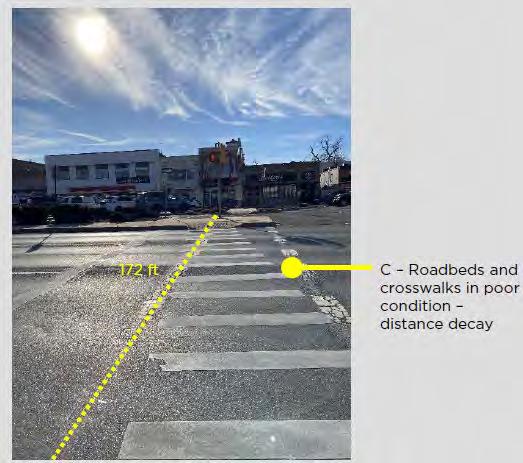
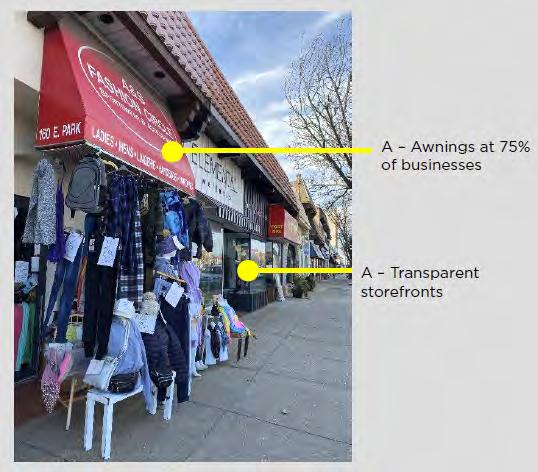
Presented by Streetsense at the June 2, 2022 Workshop.

1,042 businesses in Long Beach

45% Services
28% Retail
13% Finance, Insurance, Real Estate
3% Government
$987,903,000 in sales in 2021
7,301 employed in Long Beach
Total workforce population of 18,582
16% in educational services
13% in health and social services
10% in scientific and tech services
9% in retail trade
1,527 (20.9%) employed by Long Beach City government and school district

72% of Long Beach workers live outside of Long Beach
Potential jobs-housing mismatch
Source: ESRI & GovSalaries

Overall, Long Beach gained an estimated 305 jobs between 2010 and 2019.
The largest gains were in construction, the largest losses were in public administration and wholesale trade.
Largest workforce is in the education sector.
Source: ACS 2010, 2019


Unemployment rate had declined significantly from 2012 peak but increased dramatically due to the COVID pandemic - unemployment rose to nearly 8%.
In 2021, the rate has lowered and is currently 4.5%.
Long Beach’s unemployment rates have paralleled Nassau County’s over the last 20 years.
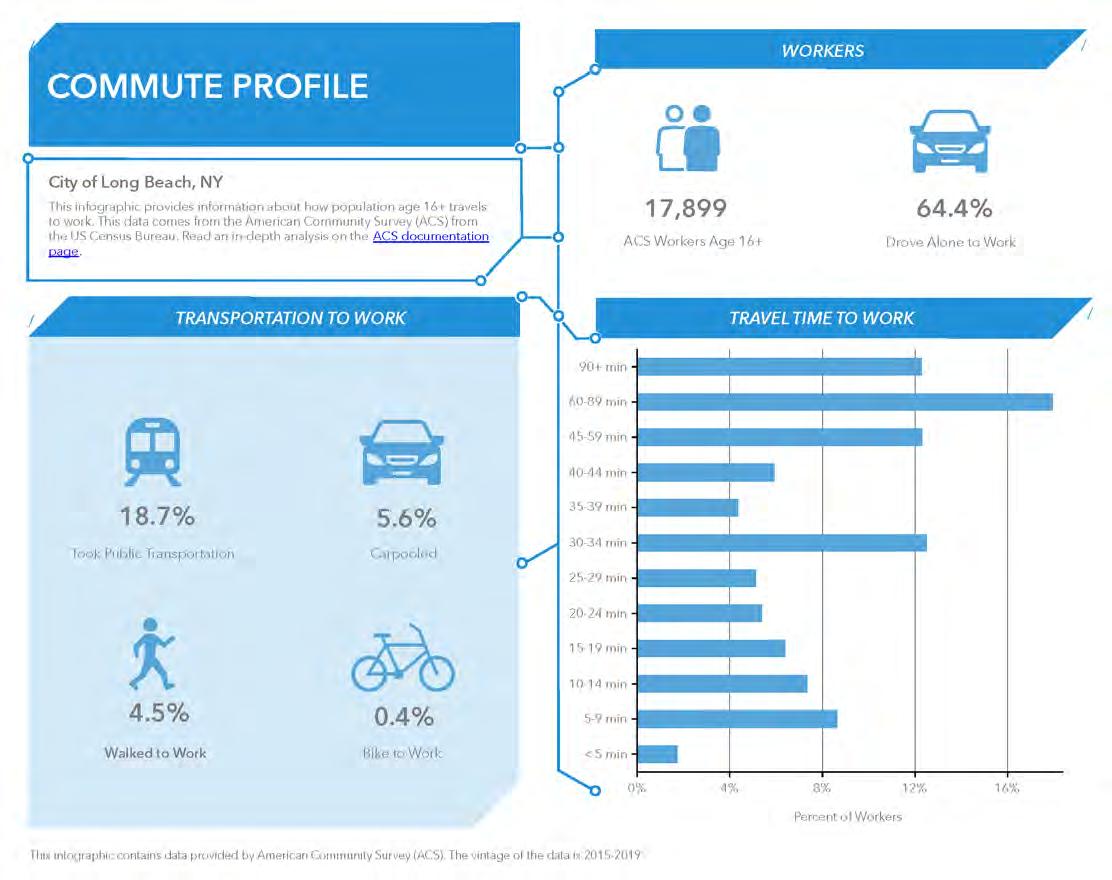

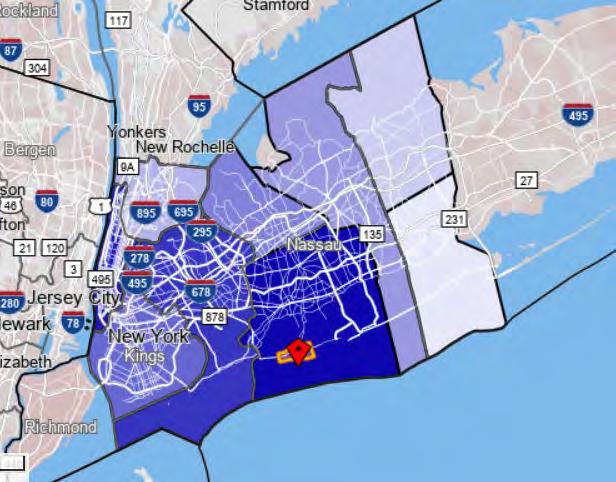


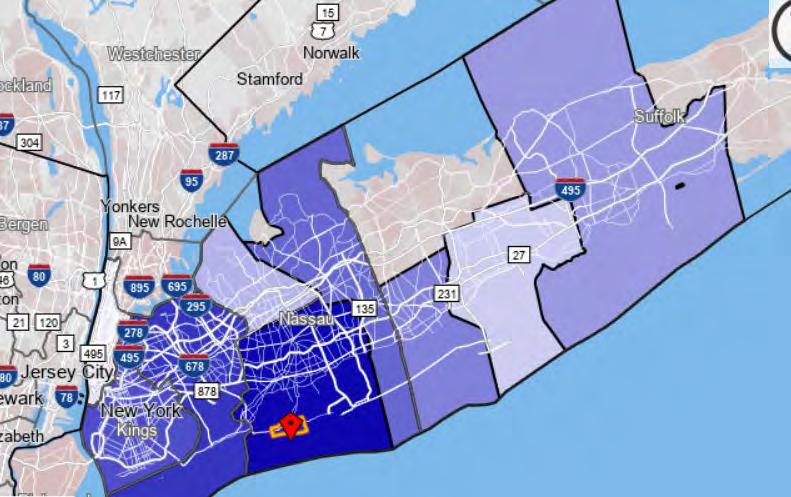
Four main commercial districts with abundant retail opportunity.
Largest employment sectors are in educational services, health and social services, and scientific and tech services.

Greatest number of businesses are primarily in services, retail, finance, insurance, and real estate trends.
Most of Long Beach workers live outside Long Beach so there is a potential jobs and housing mismatch.
o Over 50% of workers spend more than 30 min. to travel to work
o 64.4% workers drive alone to work (which is lower than County and National averages)
Shiftsin employment sectors in the last 10 years include:
o Employment gains in construction and losses in public administration and wholesale trade.
o Employment sector with greatest % loss is in agriculture, forestry, fishing and hunting, and mining industry.
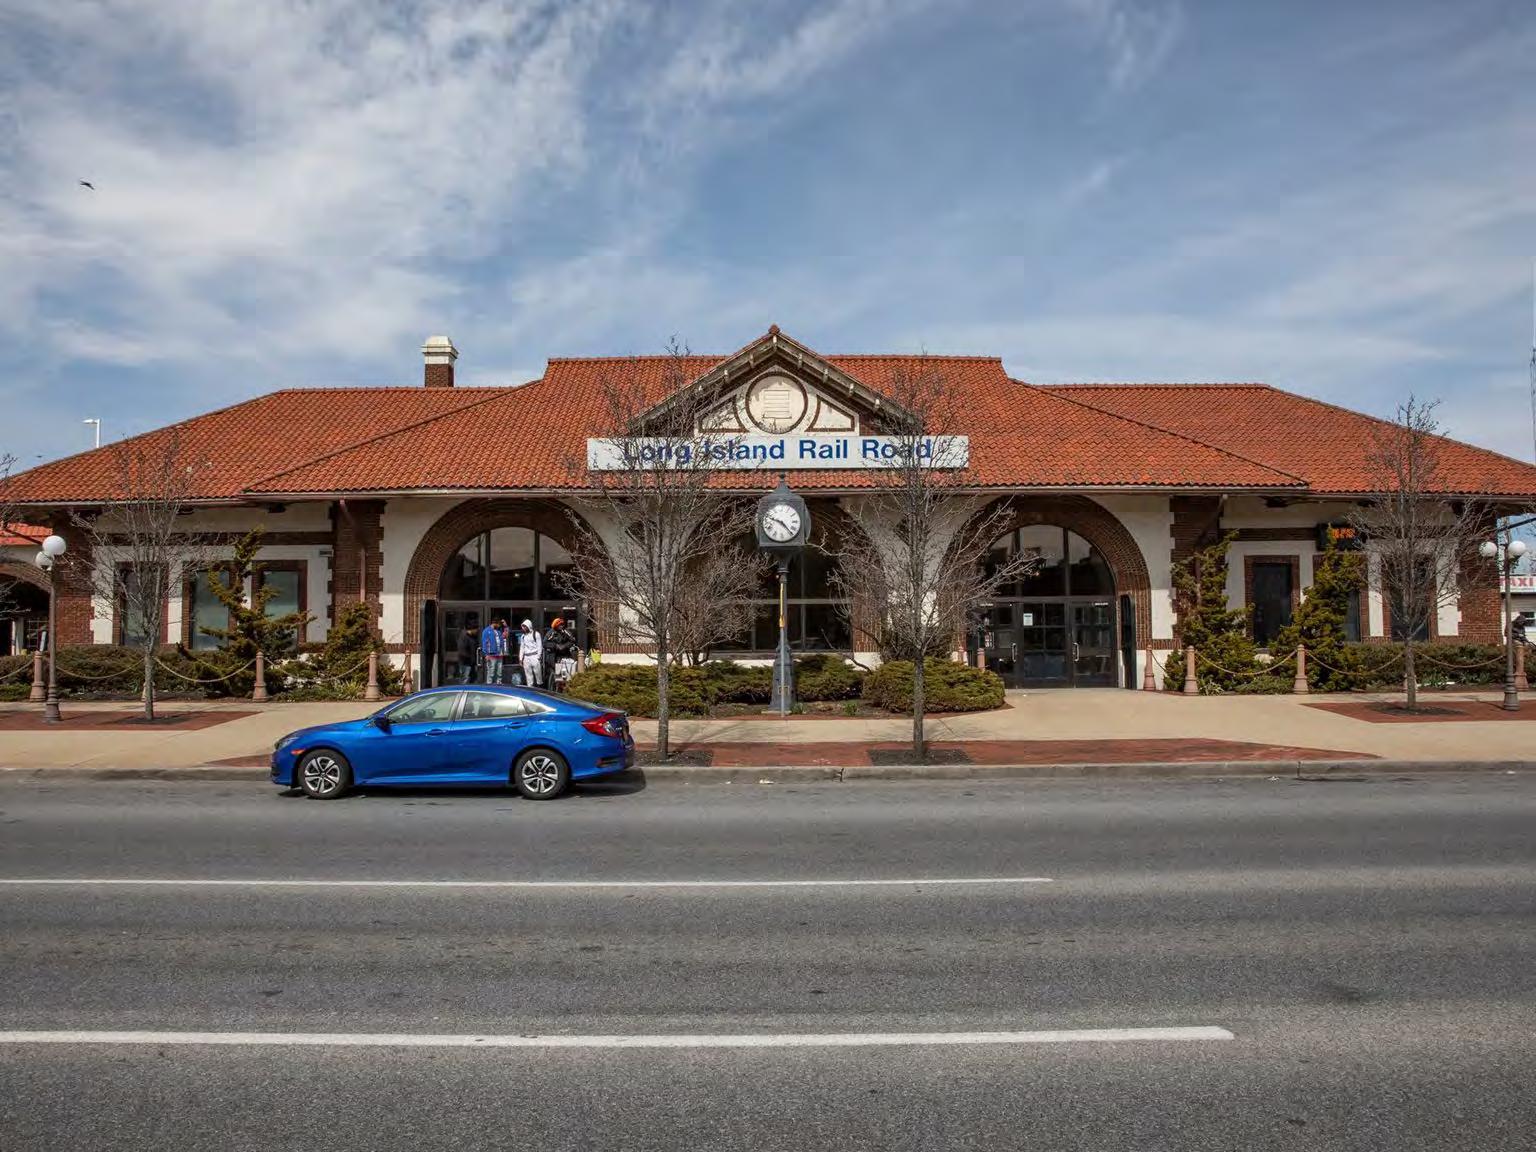
Functional Classification is a roadway hierarchy that is used to determine eligibility for state and federal transportation funds.
▪ Roads classified as collectors and arterials may be eligible for state and federal funding programs, including: Long Beach Boulevard (County Minor Arterial), Park Avenue (City Principal Arterial Other), and several other City Major Collectors shown in blue below.

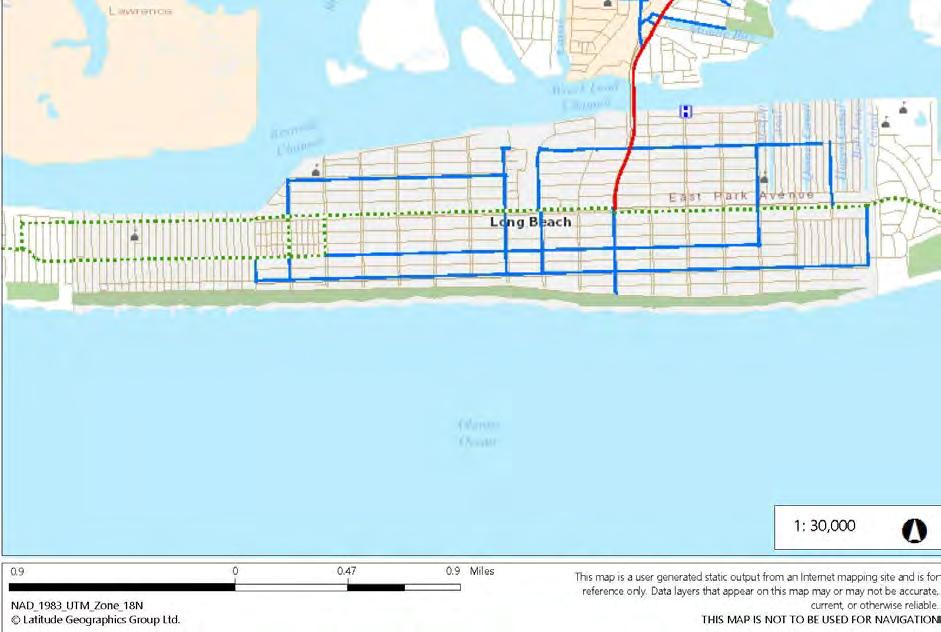
▪ Access to the Long Beach barrier island is through 3 bridges and the LIRR.
Source: NYS DOT

▪ Major points of traffic volume are along E. Park Avenue and Long Beach Blvd.
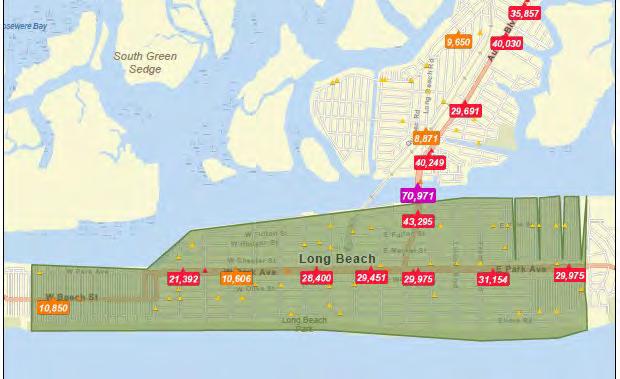
▪ Long Beach Boulevard Bridge holds the highest traffic volume since this is a major north/south ingress/egress to the City.

Source: ESRI
o Traffic volumes around the LIRR Station and along W. Park Ave. are lower than E. Park Ave. and Long Beach Boulevard.
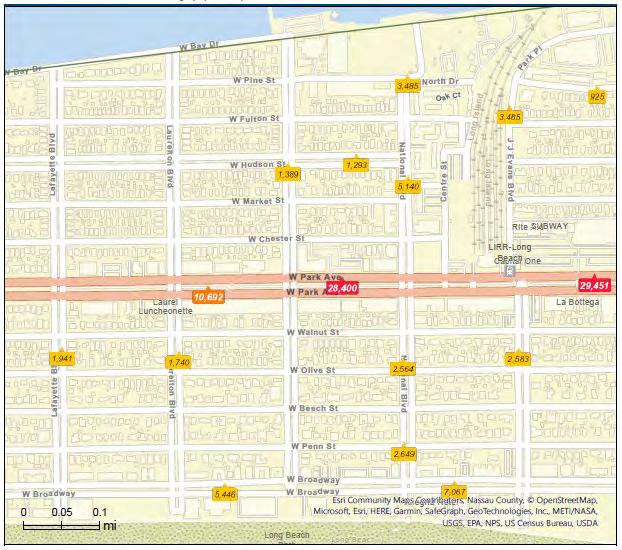
o Traffic volumes reduce further west of the LIRR Station and into the neighborhoods except along Broadway.


LIRR ridership declined during COVID, but numbers are expected to recover 80% of its prepandemic ridership by 2026
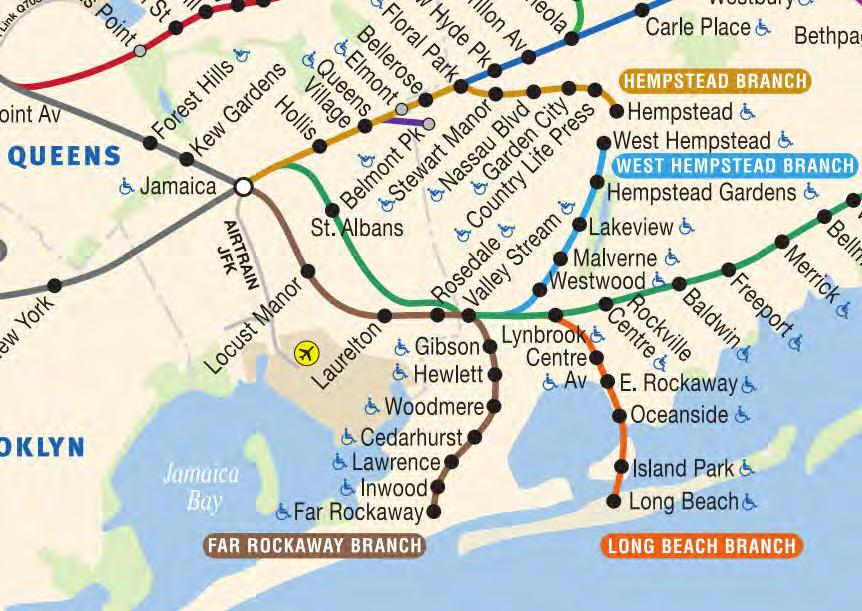
Non-commuter ridership is recovering faster than commuter ridership
Total ridership is between 4-5 million trips per month, as of early 2023
Source: MTA Metrics
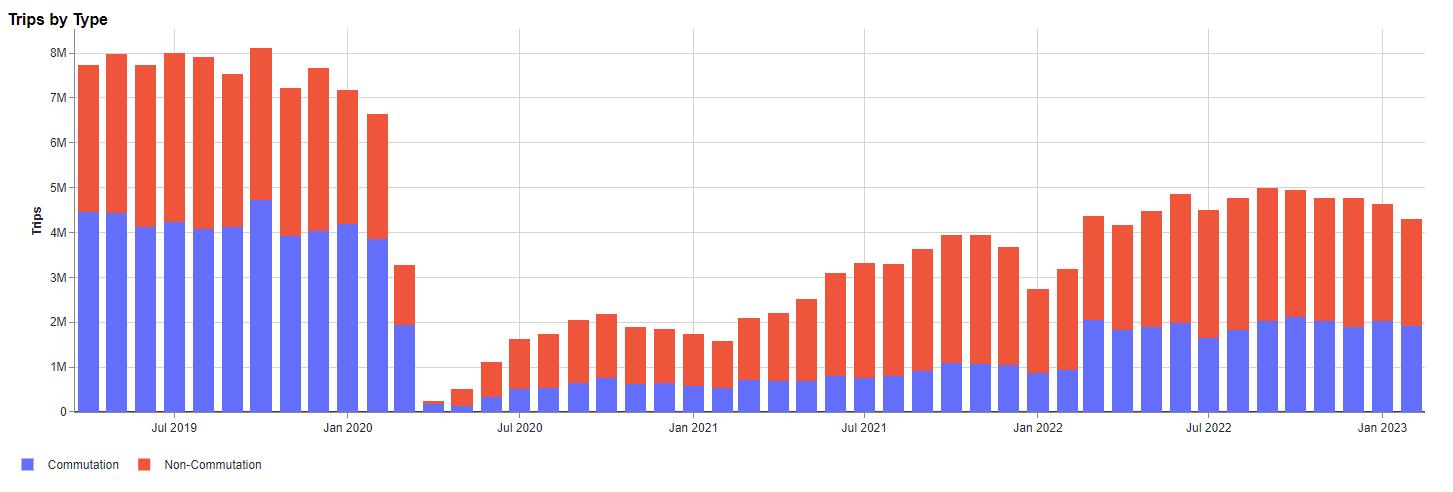

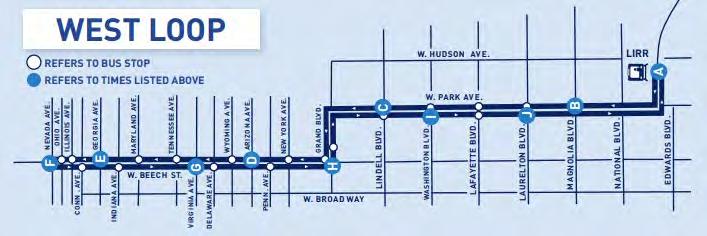

Bus ridership had averaged between 15,000 to 20,000 total riders per month pre-COVID.
Since COVID, numbers have begun to recover but are only around 7,500 riders per month.
Source: Nassau County GIS
Existing bike network consists of the Boardwalk as well as Edwards Blvd., West Bay Drive, Ocean View Avenue, and Broadway.
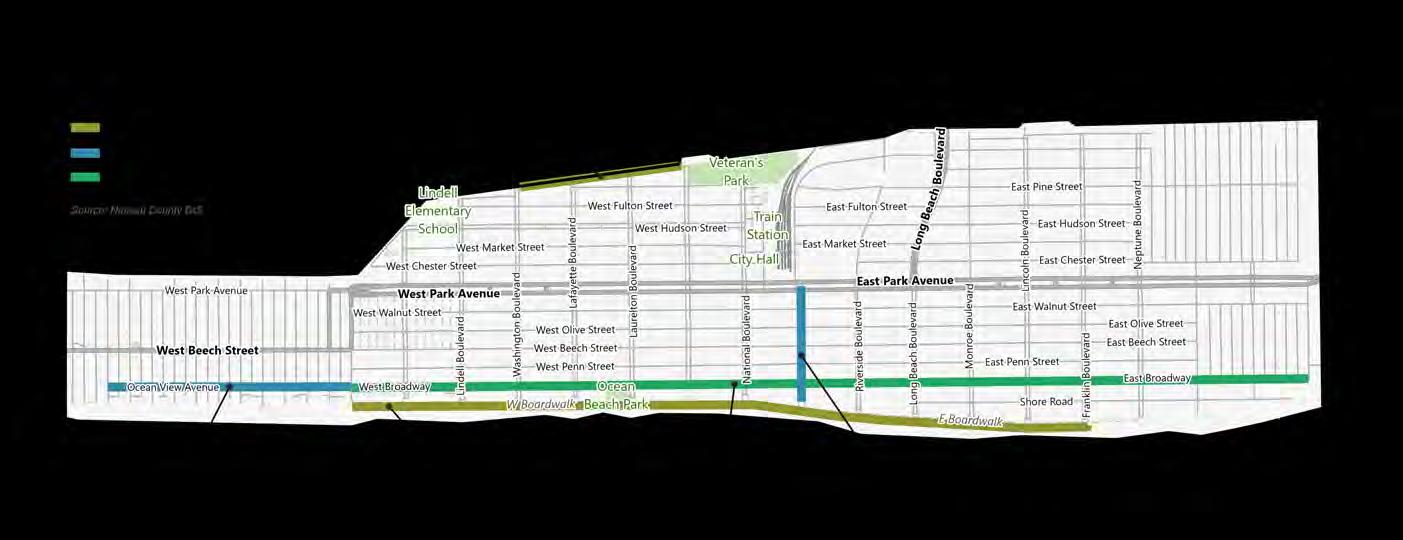
Lack of a fully connected network, particularly from north to south.

Bike Score is a method of measuring a community’s bike ability based on bike lanes, landscape, road connectivity, amenities, and percent of people who bike to work. Scored out of 100, the higher the score, the more bike-friendly a community is considered.
The Long Beach Bike Score (53) is less than the national average Bike Score of 67. However, City bike usage is high per City indicators and the bike network should be expanded.

• WalkScore, an organization that measures the walkability, transportation, and bike ability of communities in the US, Canada, and Australia, shares data collected from their three rating systems, Walk Score, Transit Score, and Bike Score. The score indicates how well a location is served by pedestrian & biking infrastructure and public transportation. Higher score indicates better infrastructure, connectivity & network.
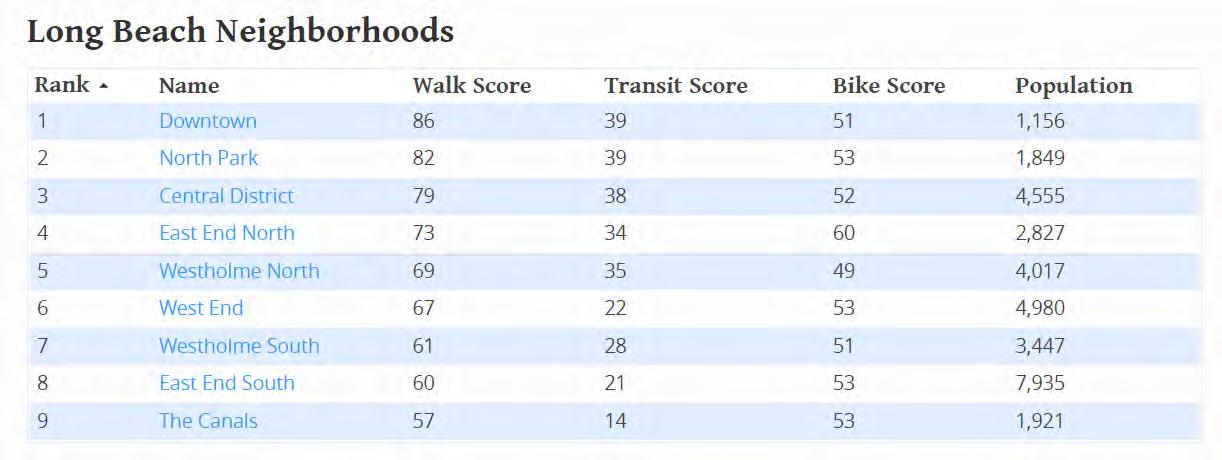
• Downtown has the highest walk and transit score while East End has the highest bike score. Comp Plan will explore ways to improve score for all neighborhoods.

▪ The Walk Score for Long Beach is 68, while the national average Walk Score for US cities with over 200,000 people is 49. No Walk Score data is available for the average score for smaller US cities.
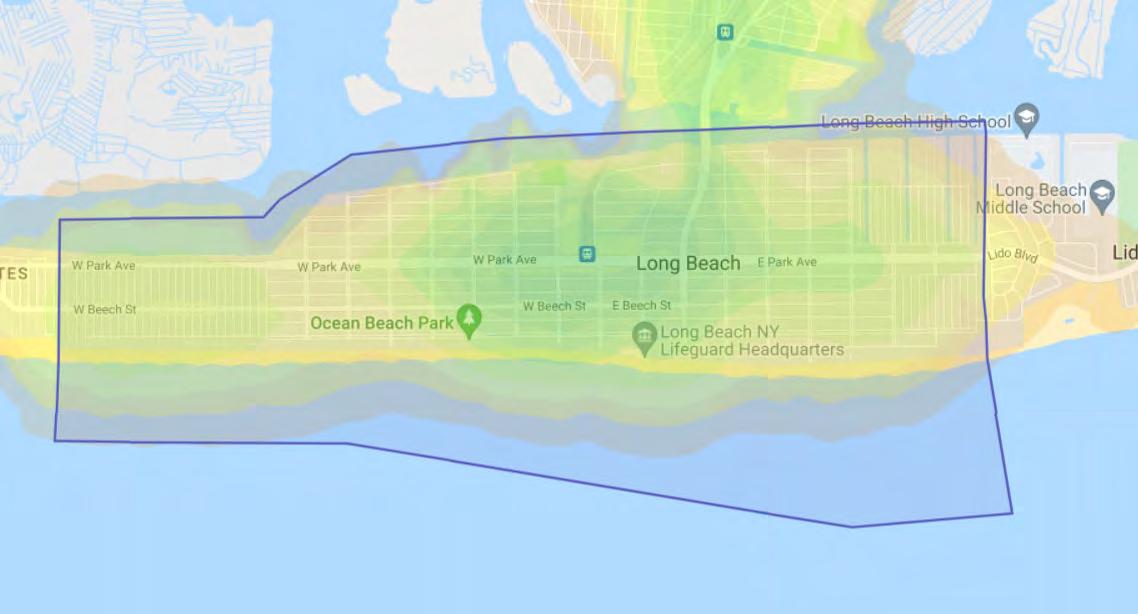

▪ The Walk Score is based on the distance to amenities nearby, population density, road metrics, and other data.
▪ The most walkable areas in the City are within the central commercial corridor.
Source: 2019 ACS 5-Year Estimates
▪ While the WalkScore, BikeScore, and TransitScores indicate that Long Beach commuting scores are less than the national averages, ACS Commuter Data shows that a higher percentage of Long Beach commuters take public transit, walk, and bike more than the national average.

▪
Complete Streets are safe, comfortable, and convenient for travel for everyone, regardless of age or ability– motorists, pedestrians, bicyclists, and public transportation riders.
▪ Over the last decade, Long Beach has received grant funding for the Complete Streets program and other built infrastructure projects which improved bike lanes, crosswalks, and curb extensions.

▪ The Edwards Boulevard Reconstruction Project was a major Complete Streets project by the City. Other projects have included Neptune Boulevard and National Boulevard. Complete Streets projects in the planning stage include the Park Avenue commercial area.
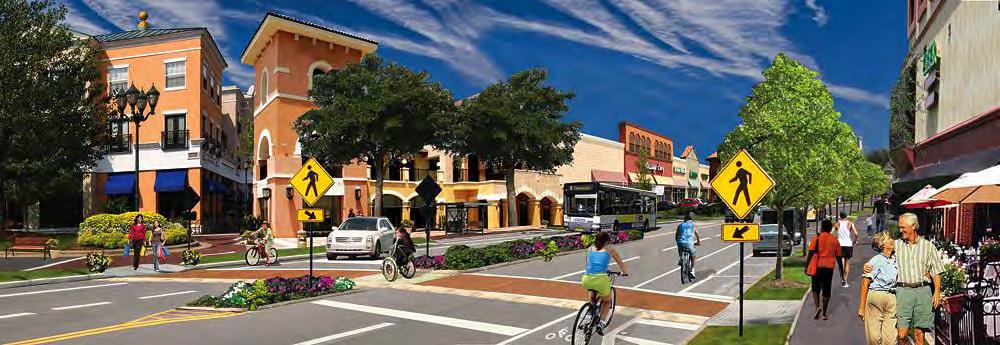
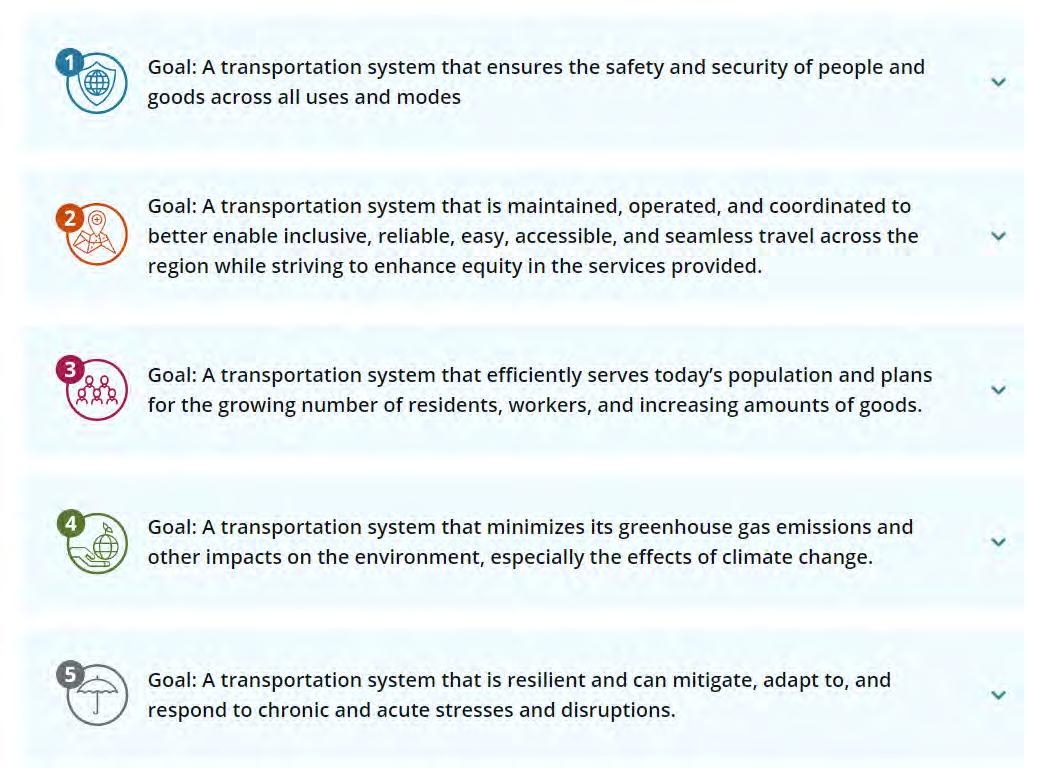

Highest traffic volumes are along E. Park Ave & Long Beach Blvd.
Long Island Railroad connects Long Beach to the larger NYC metropolitan area and New England rail system.

Rail and bus ridership experienced a sharp decrease due to COVID. Numbers have begun to recover but still below pre-COVID numbers.
Strong bike network along Boardwalk/Broadway but lack of a fully connected bike network, particularly from north to south.
Walkable areas are greatest in the central commercial corridor.
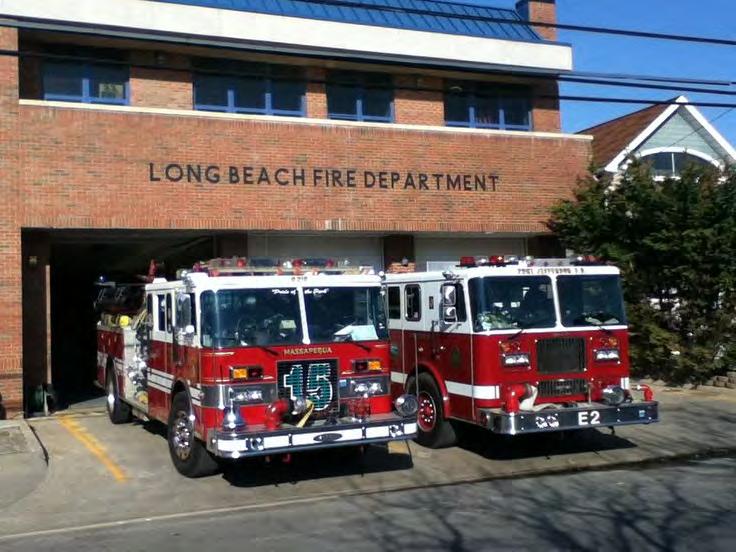
Publicly-Owned
City Hall
Library (2)
MLK Center
Rec. Center/Ice Arena
Magnolia Senior Center
Beach Park
Fire Department (3)
Police Department
4 elementary schools, LBMS, LBHS

Long Beach NY Public
Transportation Bus Garage
US Post Office-Long Beach
Long Beach Train Station
Non-publicly owned
MSSN Freestanding
Emergency Department
Places of Worship
RECENTLY COMPLETED + ONGOING IMPROVEMENTS
Reconstruction of Edwards Blvd. between Park and Broadway
Reconstruction of Lifeguard Headquarters at Riverside Blvd.
Comfort stations at New York and Neptune Blvd.
Northshore Bulkhead project
Drainage Improvements Project
Rehabilitation of the City/LIRR Parking Garage
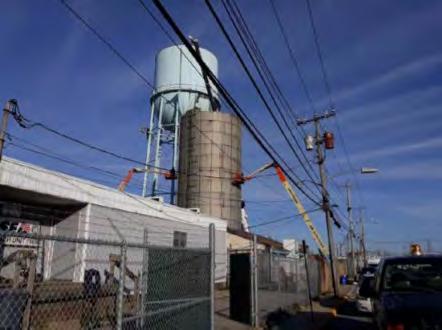

Rehabilitation of City Hall Facade
Walks utility upgrades
Ice Arena hazard mitigation
MLK hazard mitigation
Animal Shelter Hazard Mitigation
150 West Pine Hazard Mitigation
Rehabilitation of City Hall elevators
Replacement of Pool Liner at Recreation Center
Continue Roadway Reconstruction
Reconstruction of Doyle (Chester to Pine)
Continue Asphalt Overlay Program
Continue Tide Flex Valve Replacement
Streetscape Initiative Improvements

Public Safety (PD Vehicles, Precinct and Technology Upgrades)
Building Improvements
Design, Permitting, and Construction of Federal and State Funded Bulkhead Projects
Sewer Upgrade Projects
Water Distribution System Upgrades
Continued flood protection efforts - New York Rising program + FEMA funds.
Planning for conversion of Wastewater Treatment Plant to pump station at Nassau County’s Bay Park facility.
Future redevelopment opportunities at the Bayfront.
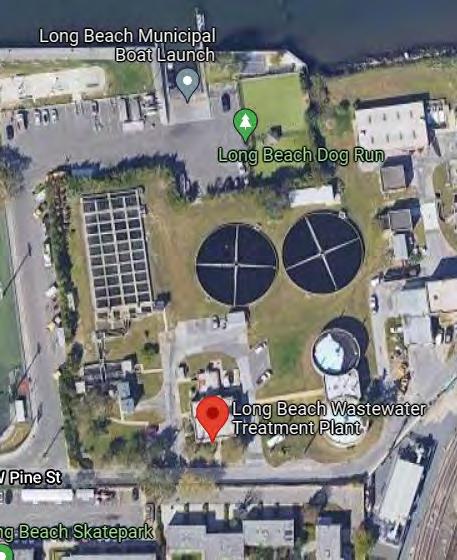
Many upcoming and planned infrastructure improvements. Future redevelopment opportunities, especially at the Bayfront.
Currently, lacking emergency medical and other medical facilities within the City. The City is expecting the Mt. Sinai Pavilion to be up and running in 2023, which will provide a host of services not currently provided. The City should partner with the community and other partners to identify ongoing healthcare needs within the community and seek to address them.

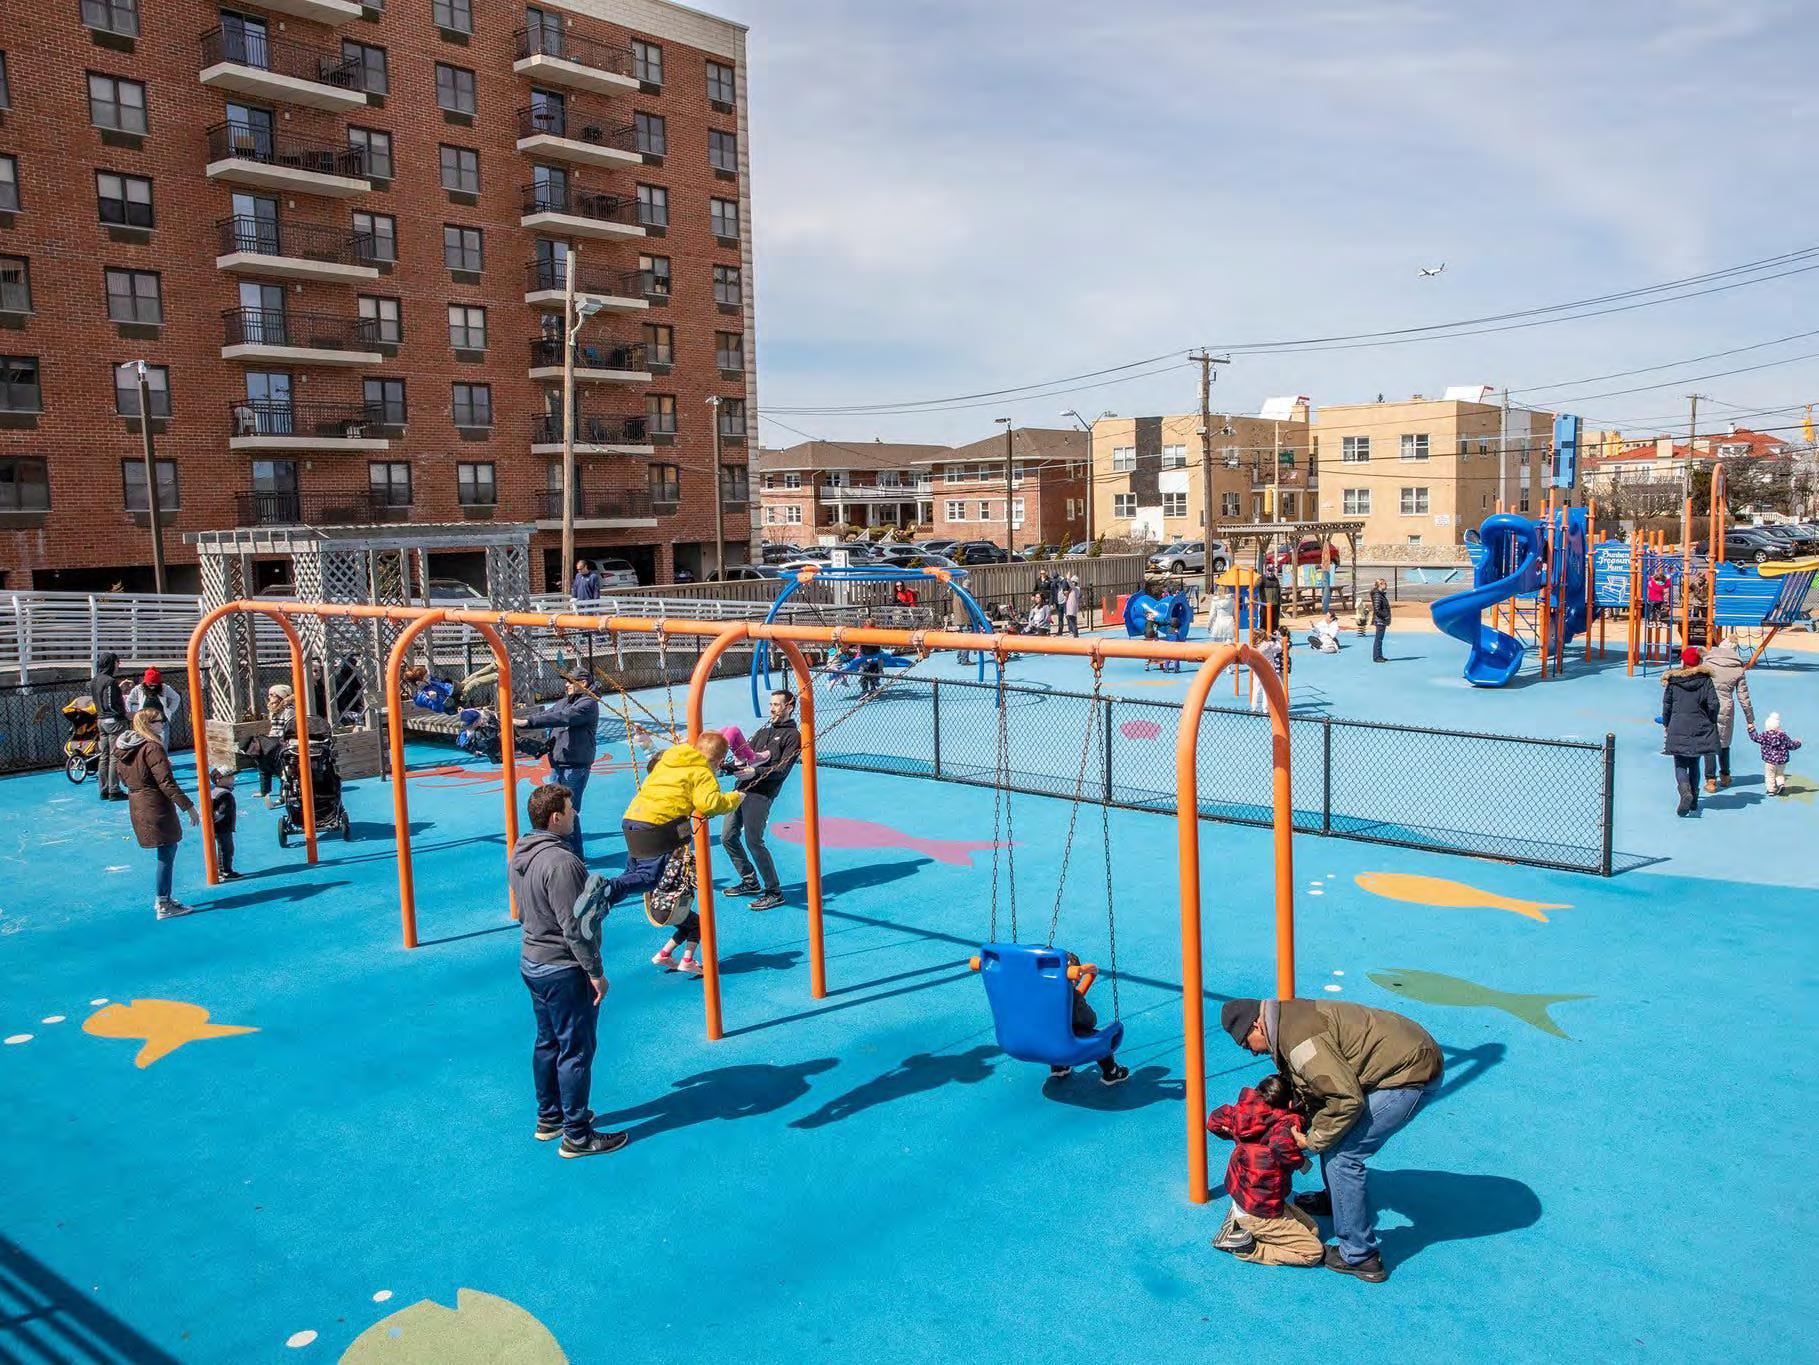
Georgia Avenue Park
Georgia Avenue, West Beech Street
Magnolia Playground
Magnolia Boulevard, West Broadway
Veteran Memorial Playground and Park, Municipal Fishing Pier, and Department of Recreation Campus*
700 Magnolia Boulevard
Sherman Brown Park
Riverside Blvd. & E. Pine St.
Leroy Conyers Park
Park Place
Pacific Playground
Shore Road, Pacific Boulevard
Clark Street Playground
100 Clark Street
Beach Park
3.5 miles of oceanfront, and
2.5 miles of boardwalk
*Includes pool, fitness center, ice arena, playground, basketball courts, fields, skate park, fitness trail
Source: City of Long Beach

8% of Long Beach’s City land is used for parks and recreation, including 11 parks.
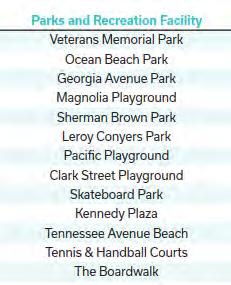
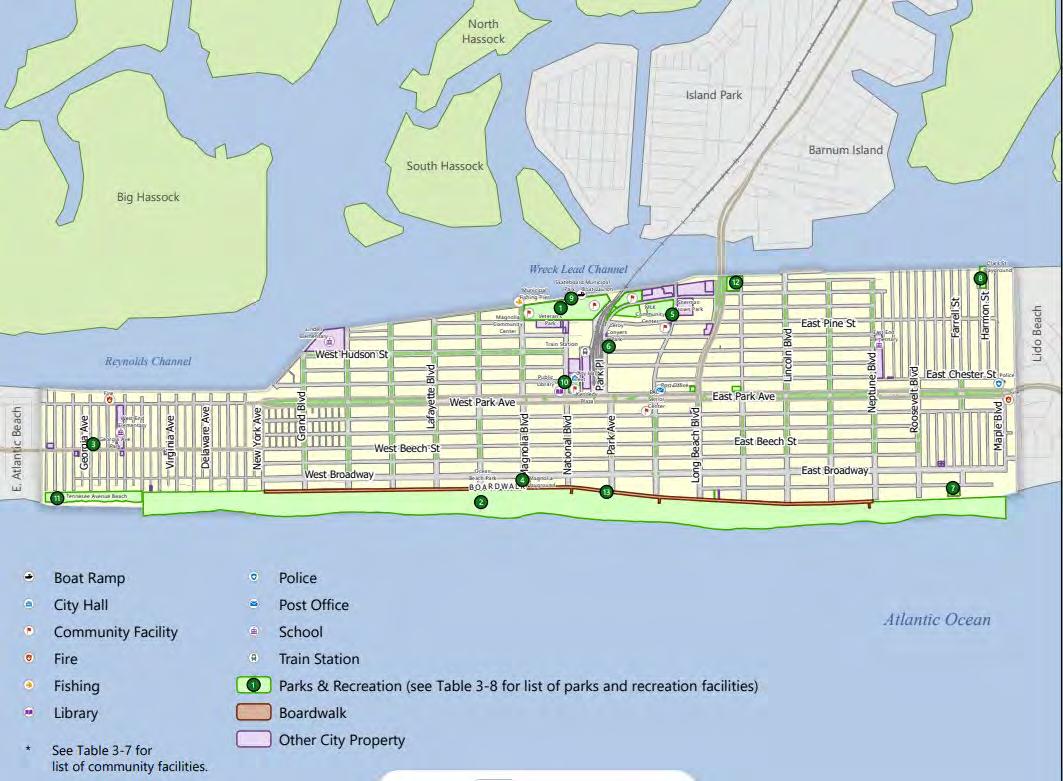
Passive, green recreational space is limited.
The beach serves as the primary open space/recreational opportunity.
99% of City residents live within a 10-minute walk from a park (Trust for Public Land)
Long Island has an island-wide goal of attaining a 10% open space buffer (New York State Department of Environmental Conservation (NYS DEC)).

Source: City of Long Beach


2.2-mile boardwalk, stretching from New York Avenue to Neptune Boulevard.

Built in 1914 and rebuilt in 2013 and includes walking and biking lanes.
Concession stands were added in 2016.
3.5 miles of Atlantic Ocean beach.
Extensive beach, open space and boardwalk along Atlantic Ocean serves as a primary recreational opportunity
A variety of active recreation parks and facilities throughout the City
Passive, green open space is limited

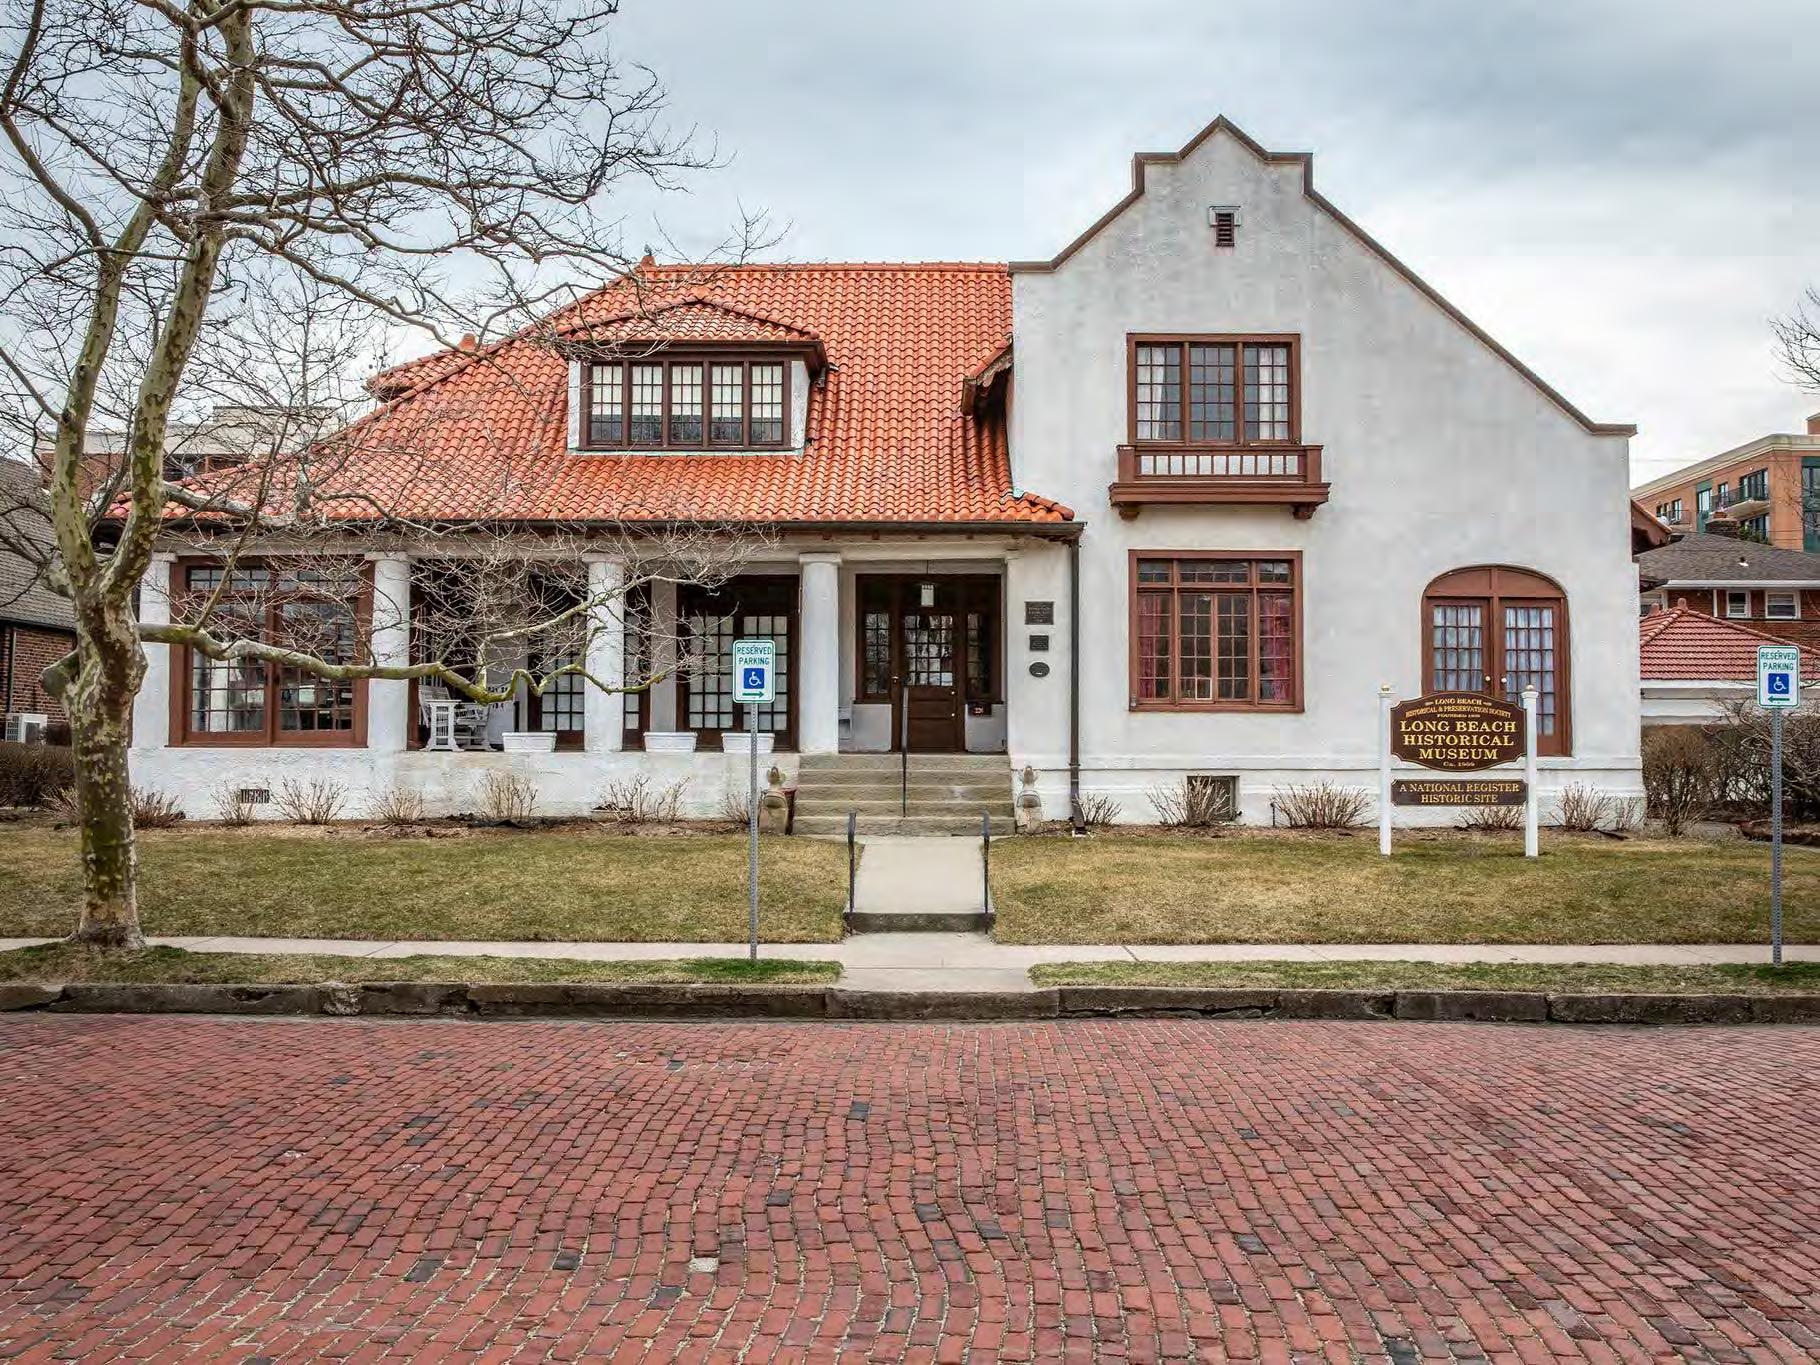
Centennial celebration in 2022.
Long Beach is a community on Long Island and was founded in 1880.
The first Long Beach Hotel was built then and with the railroad arriving in 1882, Long Beach continued growing as a resort community.
William Reynolds purchased Long Beach in 1907 to create a planned community and created the area known as Long Beach today by dredging Reynolds Channel, filling in the wetlands, and constructing many of the City’s homes, the Boardwalk, the medians and street malls, and the sewer system.
The City of Long Beach was incorporated in 1922, allowing greater control of government services.

During the 1930s and 1940s, the City became more of a year-round community and during the post-World War II era, the City saw a decline of tourist/guests.
In the 1970s, many of the old hotels were used as long-term stay facilities and, subsequently, much of the hotel sites were redeveloped for market-rate multifamily housing or nursing homes.

Pauline Felix House (151 West Penn St.) – National Register
Samuel Vaisberg House (257 West Olive St.) – National Register
Cobble Villa (657 Laurelton Blvd.) – National Register
Barkin House (84 East Olive St.) – National Register
Granada Towers (305 Riverside Blvd.) – National Register
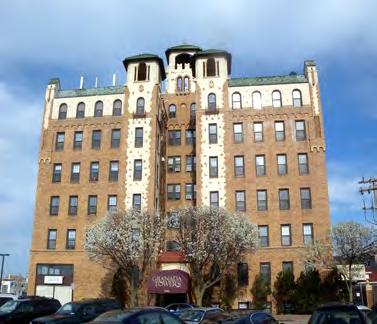
US Post Office – Long Beach (101 East Park Ave.) – National Register/ Local Landmark
Long Beach Historical Museum (226 West Penn St.) – National Register/Local Landmark
LIRR Station Building – Local Landmark
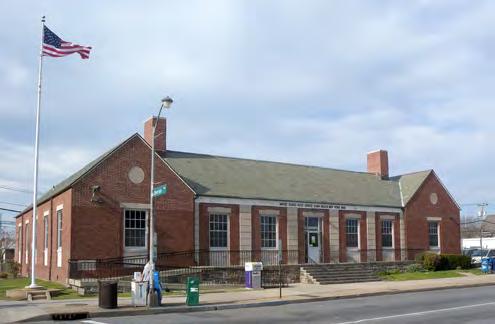
St. James Church (220 West Penn St.) – Local Landmark
Source: National Register of Historic Places and City of Long Beach
Landmark Preservation Ordinance passed in 1995, creating a Landmarks
Preservation Commission, composed of members of the Architectural Review Board.
9/11 Memorial
Beech St. and Virginia Ave.
Holocaust Memorial at Kennedy Plaza
W. Park Ave between Center St. and National Blvd.
John F. Kennedy Memorial
1 W. Chester St.
Red Brick District
W. Penn St. between Lafayette Blvd. and National Blvd.
Shine's Bar on the West End
55 California St.
Laurel Diner
300 W. Park Ave.
Edna Buckman Kearns Historic Marker
Entrance of the boardwalk at National Blvd.
The Wreck of The Mexico Historical Marker
Boardwalk at Lincoln Blvd.
Source: Long Beach Island Landmarks Assoc. and City of Long Beach
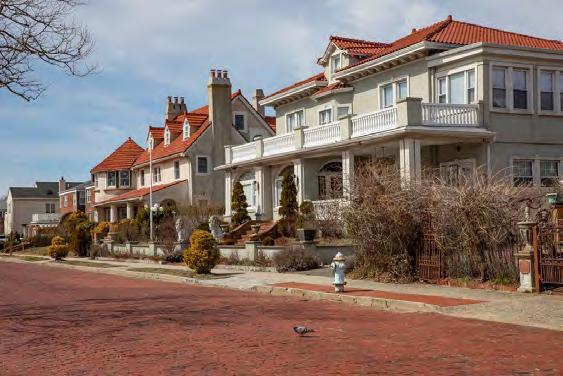

• Unique and rich history and various local landmarks and locations that are on the National Register of Historic Places

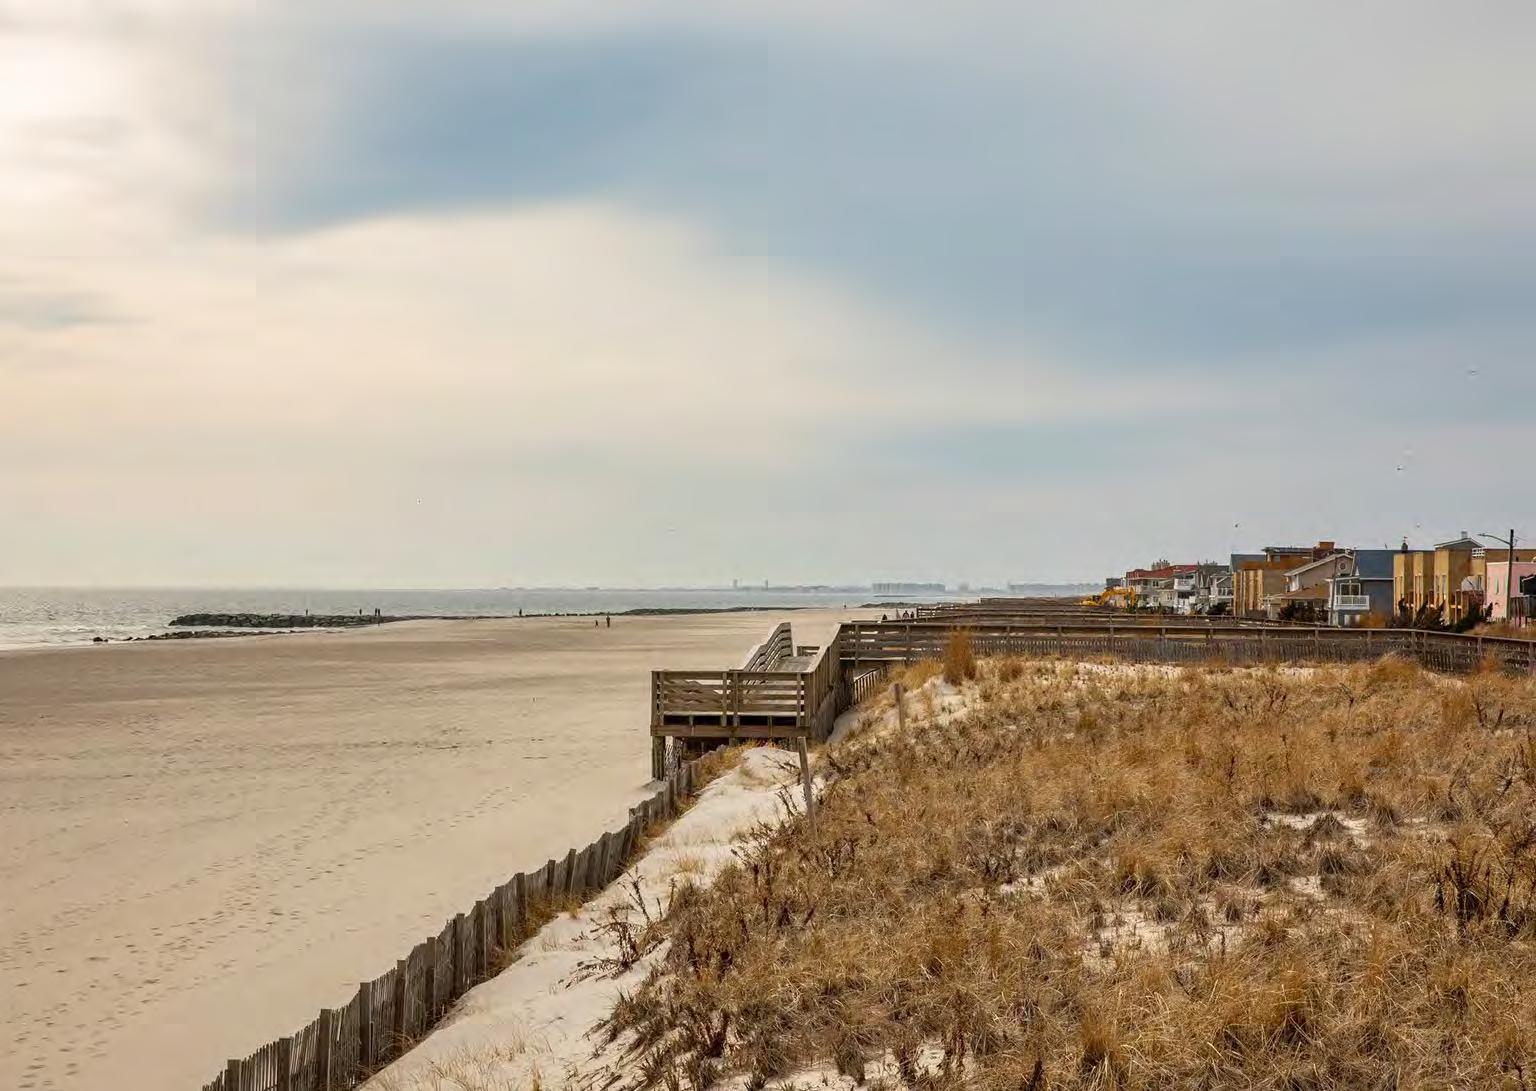
The City of Long Beach is located within the Western Bays section of the 70 mile long South Shore Estuary
The South Shore Estuary Reserve Act designates the estuary as an area of statewide importance and serves to protect and manage this natural resource
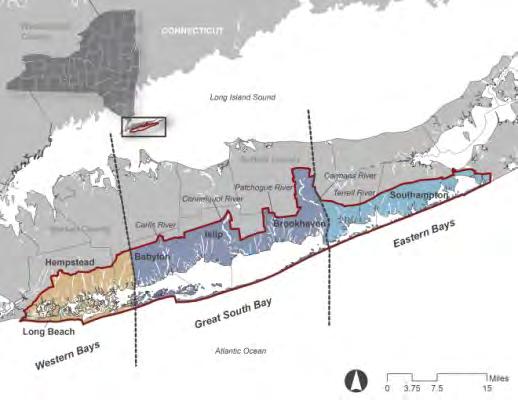

Most of Long Beach’s wetlands have been infilled to make way for development.
Wetlands are important in mitigating storm related flooding in the region.
Impervious cover (roadways, sidewalks, rooftops, etc.) has replaced wetlands, resulting in an increase in flood risk, rates of stormwater runoff, and levels of pollutants entering waterways.
Long Island Wetlands Circa 1900
Riverine and Lacustrine Water

Marine and Estuarine Water
Palustrine Vegetated Wetlands
Tidal Flats
Estuarine Vegetated Wetlands
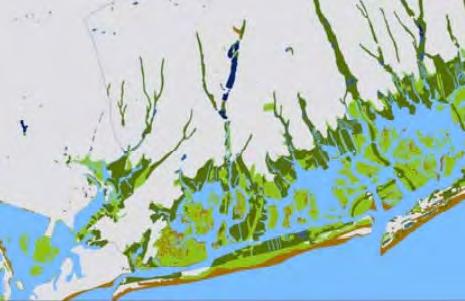
Source: National Association of Wetland Managers
Percent Developed Imperviousness 0% 50% 100%
Source: Cornell University Geospatial Information Repository

No remaining wetlands in Long Beach except the intertidal zone along the southern coast which is designated as an Estuarine and Marine Wetland according to the NY State DEC

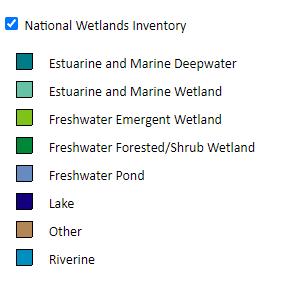
It provides important habitat for many coastal plant and animal species and recreational space for residents and visitors


Source: New York State Department of Environmental Conservation Environmental Resource Mapper
NY DEC identified significant natural communities (dark pink) across Reynolds Channel from Long Beach with a 1/2 mile suggested buffer (light pink).

NY DEC suggests potential impacts to the significant natural communities should be considered for any work or projects within the buffer areas.
The beach in Long Beach is also considered a significant natural community according to NY DEC but a buffer is not warranted in this case.

Excessive nutrients from sewage treatment release and untreated stormwater outfall have deteriorated the water quality in the vicinity of the City.
The habitat for fish, shellfish, fowl, and animals has deteriorated, and shellfishing beds are deteriorated and no longer viable. Recreational use of the Channel has also been limited.
Improving water quality in Reynolds Channel is important to protect this natural resource and clean-up plans are currently underway. The clean-up project will eliminate 65 million gallons of treated sewage from being released into the bay.
Within 3 years of project completion, it is expected that the bay will return to good health. Maintaining the health of the wetland ecosystem, post project, is a priority.
Drainage Outfall
Source: City of Long Beach
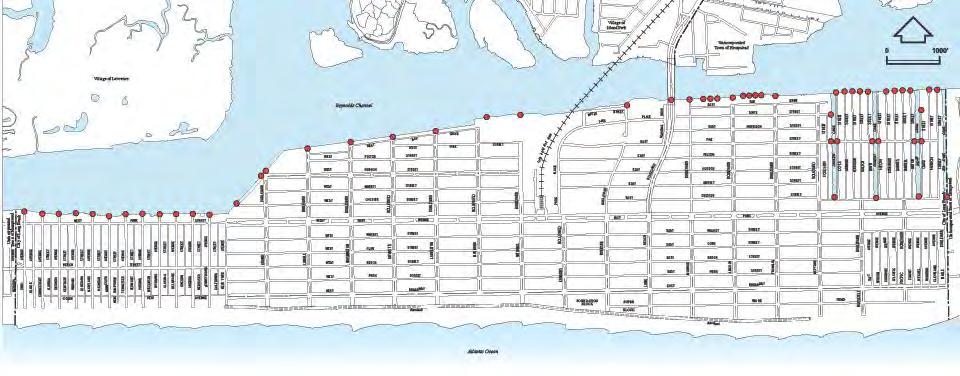

Long Beach’s southern oceanfront provides many economic, social, and environmental benefits:
Foundation of the Long Beach tourism industry

Protection against flooding and storm surge
Habitat for many important plant and animal species
Dune restoration efforts by the U.S. Army Corps of Engineers have resulted in a more attractive and functional beachfront with greater social and environmental benefits including greater protection from future storms.
Source: City of Long Beach

The Lloyd Aquifer supplies 400 million gallons of fresh water per day to over 2.8 million people in both Nassau and Suffolk counties
The aquifer is a limited resource and is the only source of fresh water for Long Beach
Continued pumping depletes this resource and may lead to saltwater intrusion into the aquifer
Sea level rise may increase likelihood of saltwater intrusion
Source: U.S. Geological Survey (USGS)
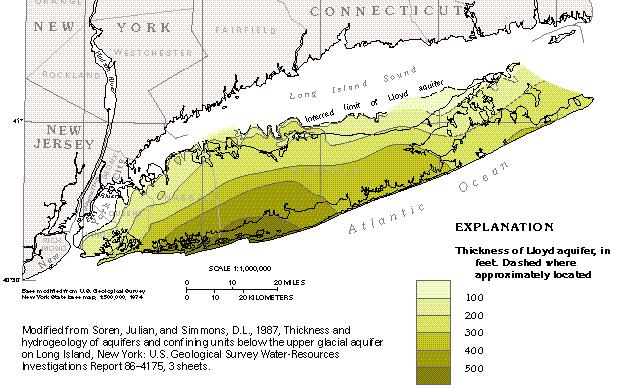

The USGS is currently studying groundwater throughout Long Island to study the effects of saltwater intrusion.
Long Beach is a strong advocate with other municipalities against increased usage of the aquifer and has assisted in preventing the creation of new pumping uses.
Programs for public education and outreach are available but few ordinances exist to regulate water usage.
The lack of permeable surfaces in Long Island restricts the infiltration of stormwater, further exacerbating issues related to water use and aquifer recharge rate.
Long Beach is part of the South Shore estuary, which spans over 70 miles throughout both Nassau and Suffolk counties
Extensive wetland habitat loss, experienced through urbanization, has limited the landscape’s ability to support ecological diversity and naturally mitigate flooding
Sewage treatment release and stormwater runoff have degraded water quality in the surrounding area and is currently being addressed through the Nassau county and Long Beach consolidated project.
The health of the remaining wetland ecosystems within and around the City should be considered in Long Beach planning initiatives
The beaches and dunes of the southern waterfront provide many resiliency, environmental, social, and economic co-benefits
The Lloyd Aquifer is a limited resource at-risk for overuse and saltwater intrusion

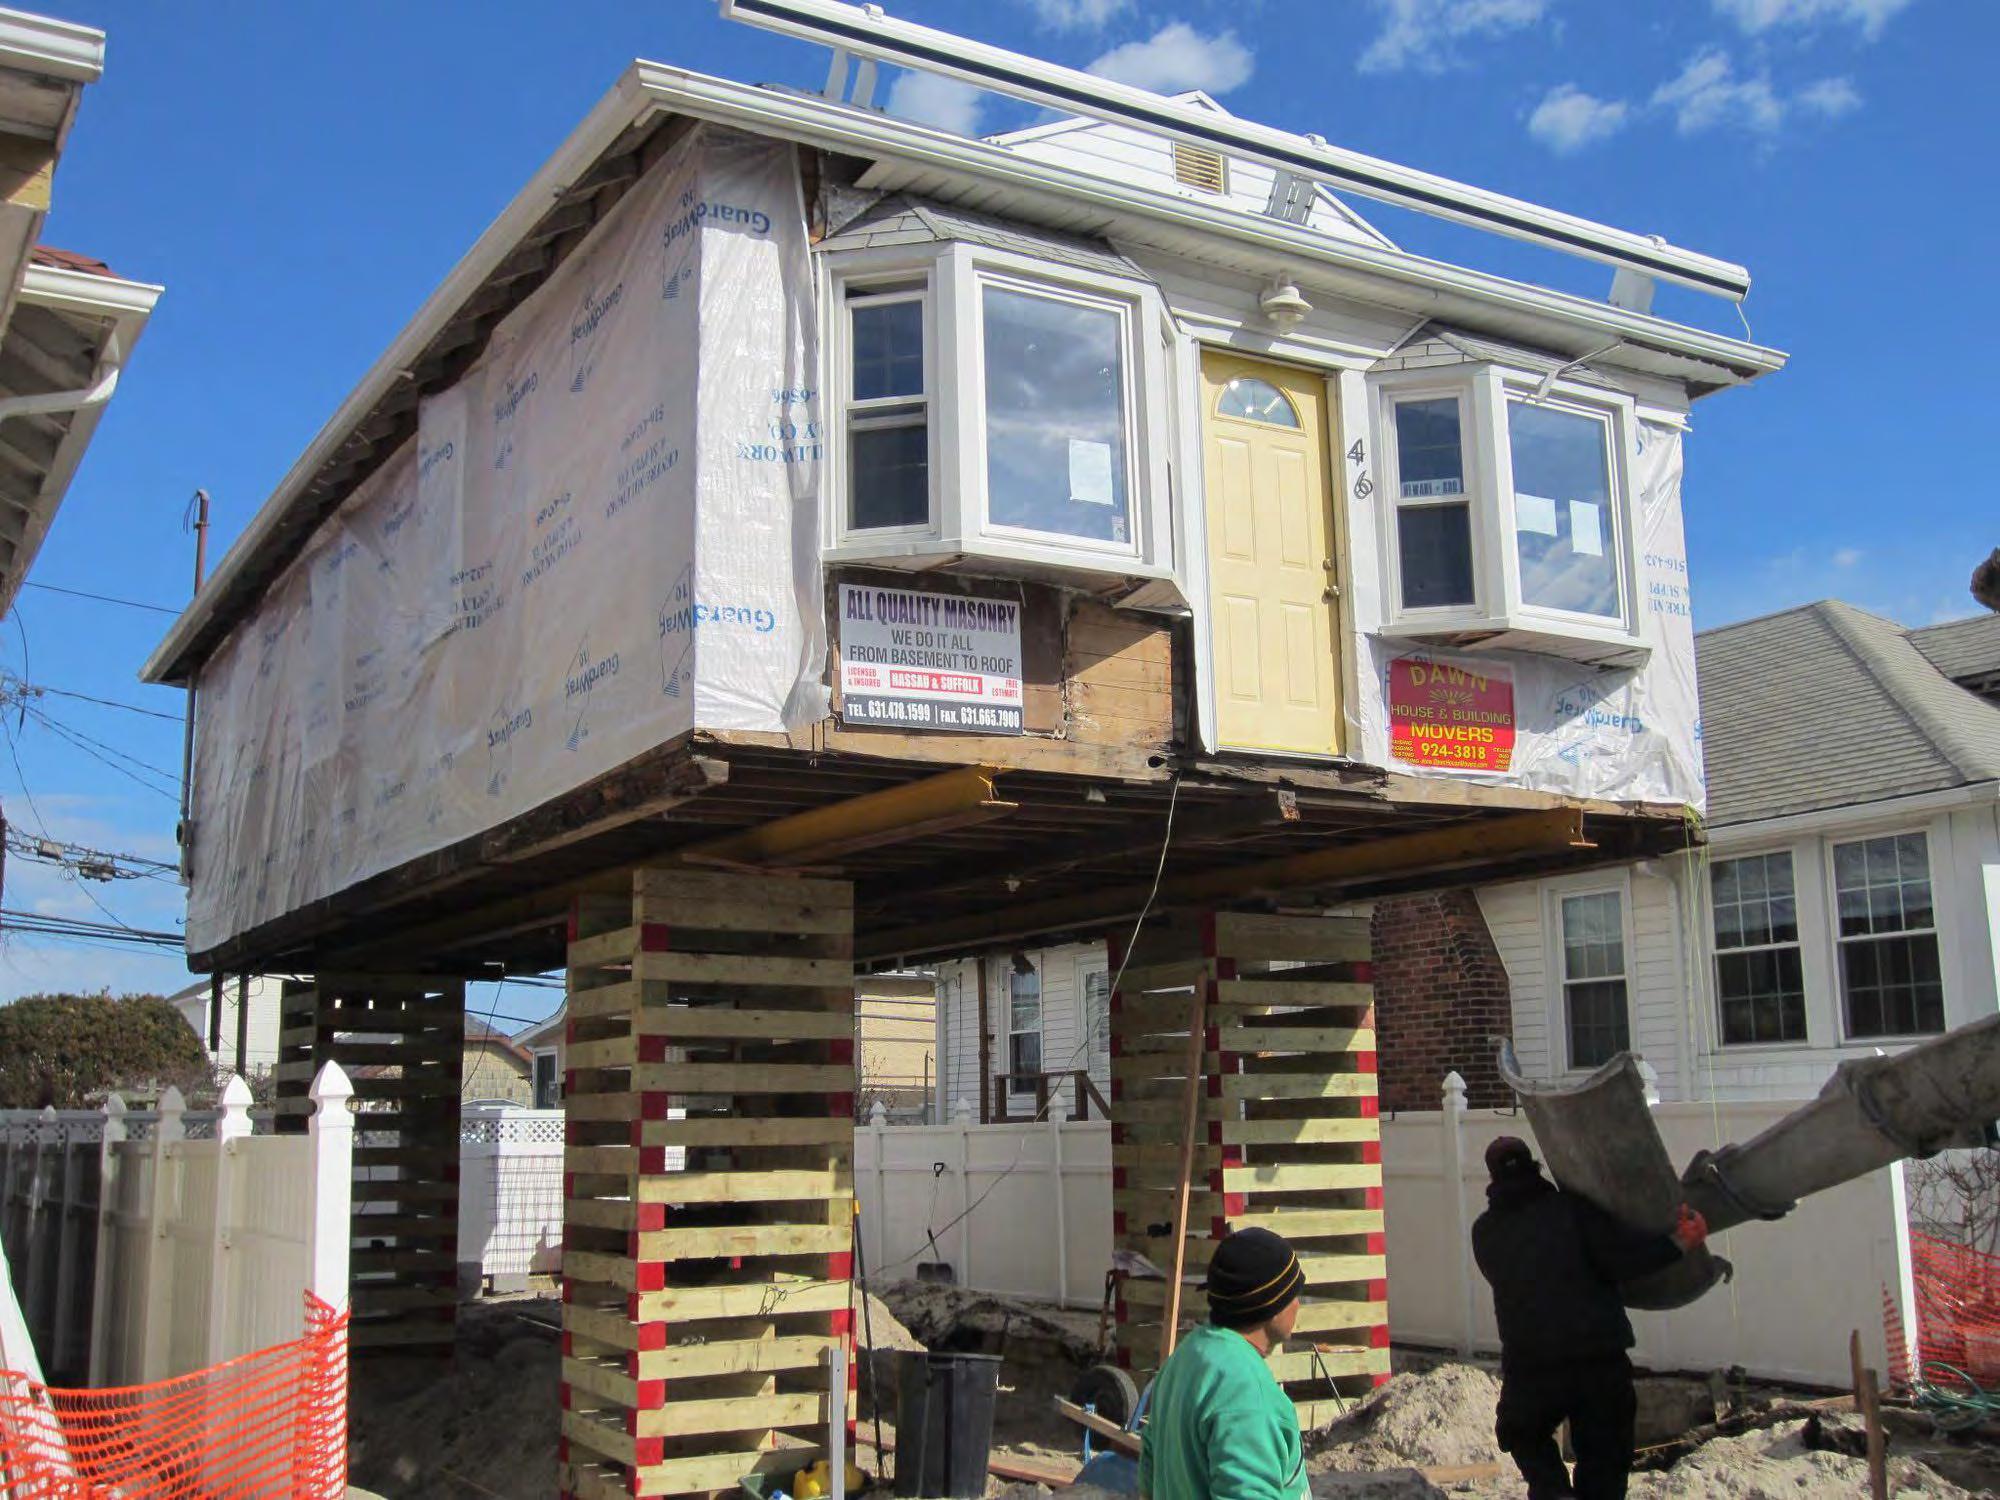
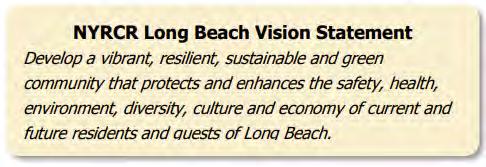
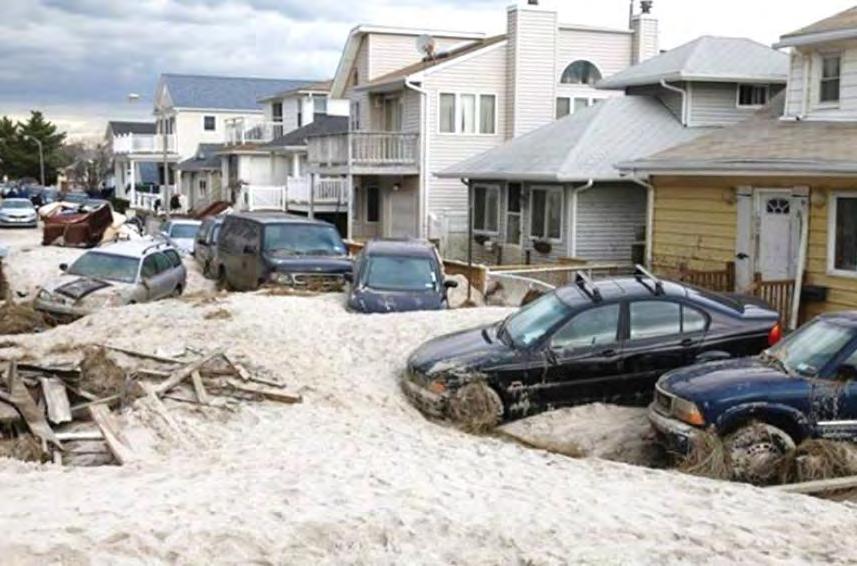
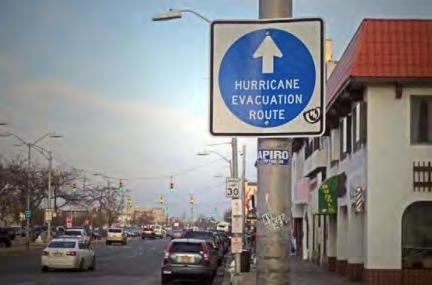

The New York State Hazard Mitigation Plan defines resilience as:
The capacity to maintain continuity and recover quickly from difficulties, or a measure of flexibility and responsiveness.
A resilient community or state is capable of withstanding disaster because it carefully manages the natural environment; creates a built environment that incorporates mitigation practices; and develops land management practices and ordinances that protect the land, its structures and its people.

A resilient system can resume pre-event functionality in a relatively short time. Thus, a community is resilient when it maintains continuity and recovers quickly despite experiencing disaster events.
Source: MitigateNY
Required to receive non-emergency disaster funding

Not required to consider climate change
Primarily concerned with economic loss
Limited mandate over county and municipalities
Source: Nassau County

Goal 1: Build stronger by promoting mitigation actions that emphasize sustainable construction and design measures to reduce or eliminate the impacts of natural hazards now and in the future.
Goal 2: Build and support local capacity to prepare for, respond to, and recover from disasters.

Goal 3: Protect existing property including public, historic, private structures, state-owned/operated buildings, and critical facilities and infrastructure.
Goal 4: Increase awareness of hazard risk and mitigation capabilities among stakeholders, citizens, elected officials, and property owners to enable the successful implementation of mitigation strategies.
Goal 5: Develop and implement long-term, cost effective, and resilient mitigation projects to preserve or restore the functions of natural systems.
Goal 6: Improve coordination between land use and redevelopment planning to encourage safe, economically sound investments.
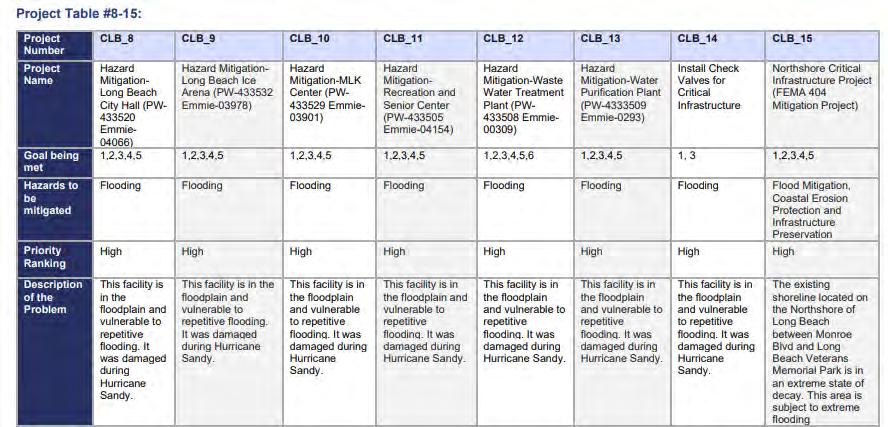
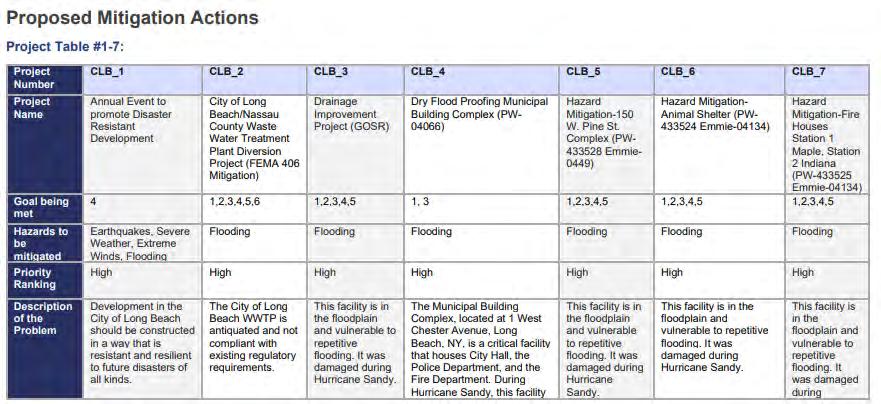

Nassau County Primary Hazards of Concern:
▪ Coastal Hazards, flooding, hurricanes, severe winter weather, extreme temperatures, wind
Increase the flood resilience for the City of Long Beach
Meet the needs of the City of Long Beach as well as state and federal requirements
Meet planning requirements allowing the City of Long Beach to remain in the CRS program by earning credit under Activity 510 at Level 7

Coordinate existing plans and programs so that highpriority initiatives and projects to mitigate possible disaster impacts are funded and implemented.
Create a linkage between the FMP and established plans of the City of Long Beach and Nassau County to ensure they can work together in achieving successful mitigation.
Source: City of Long Beach
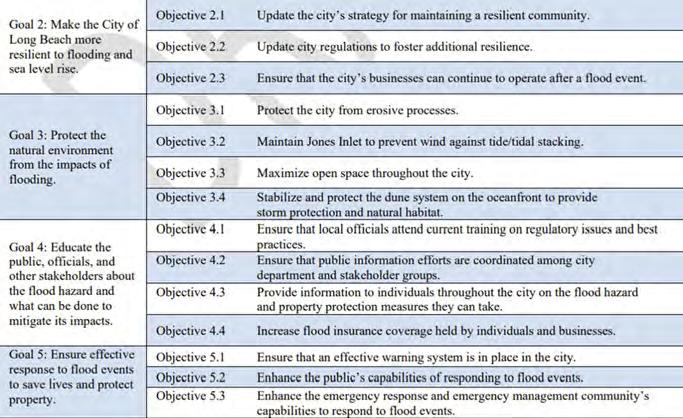
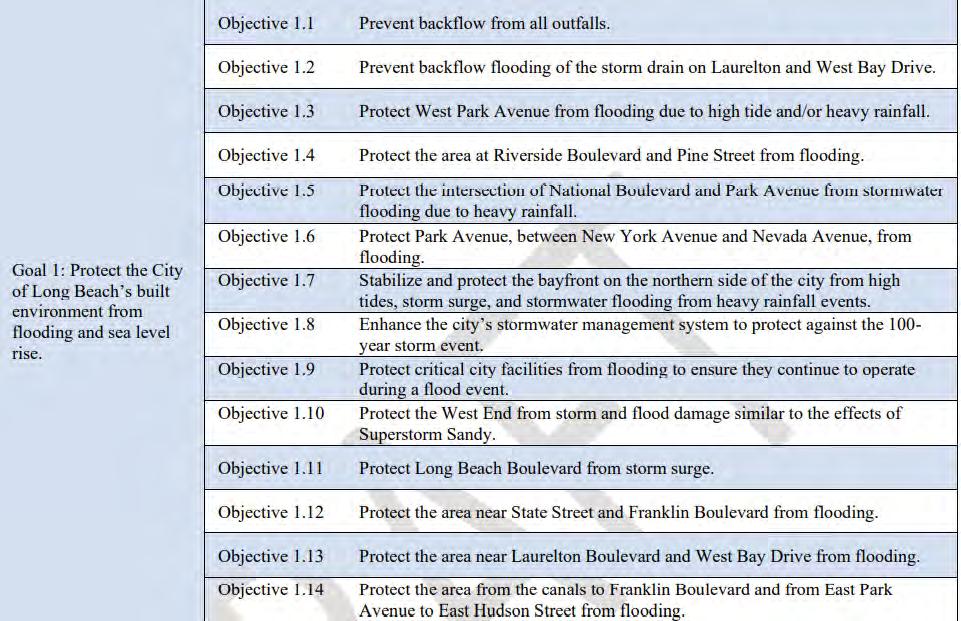
Goal 1: Protect the City of Long Beach’s built environment from flooding and sea level rise.
Goal 2: Make the City of Long Beach more resilient to flooding and sea level rise.

Goal 3: Protect the natural environment from the impacts of flooding.
Goal 4: Educate the public, officials, and other stakeholders about the flood hazard and what can be done to mitigate its impacts.
Goal 5: Ensure effective response to flood events to save lives and protect property.
Source: City of Long Beach
3.0°F to 5.5°F increase by 2050
Nassau County (1950-2100)
Source: NYSERDA, NOAA
Global average temperatures are rising with severe heat events becoming more frequent
Greenhouse gas emissions are a top contributor to increasing temperatures
Lowering GHG emissions can lessen severity of rising temperatures
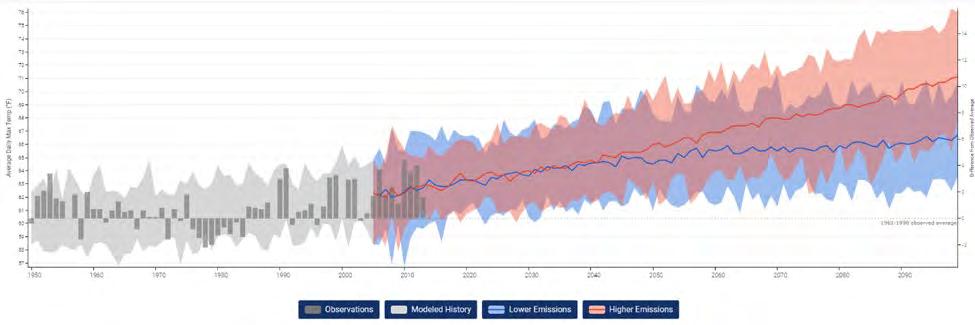
Increased temperatures have a direct effect on increased levels of precipitation


Min. Projection
Max Projection
Observed Event
Annual precipitation may increase up to 10% by 2050
Source: New York Climate Change Science Clearinghouse
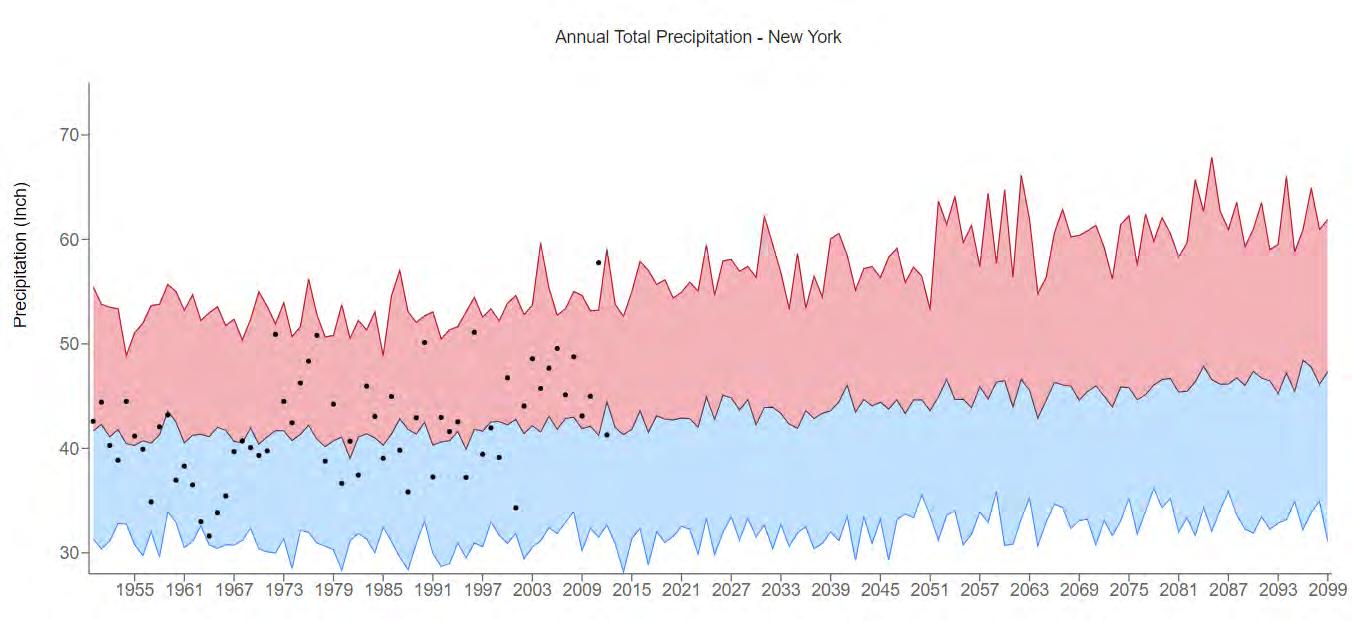
Severe rainfall events are becoming more frequent.
Increased rainfall intensifies issues related to sea level rise and flooding.
Increased rainfall can overload City sewer and storm drains.

Increase in Sea Level of 8” to 30” by 2050
Source: Army Corps of Engineers
Projection curve is based on data from the Coastal Assessment Regional Scenario Working Group (CARSWG) and the NY State Community Risk and Resiliency Act (NYCRR)
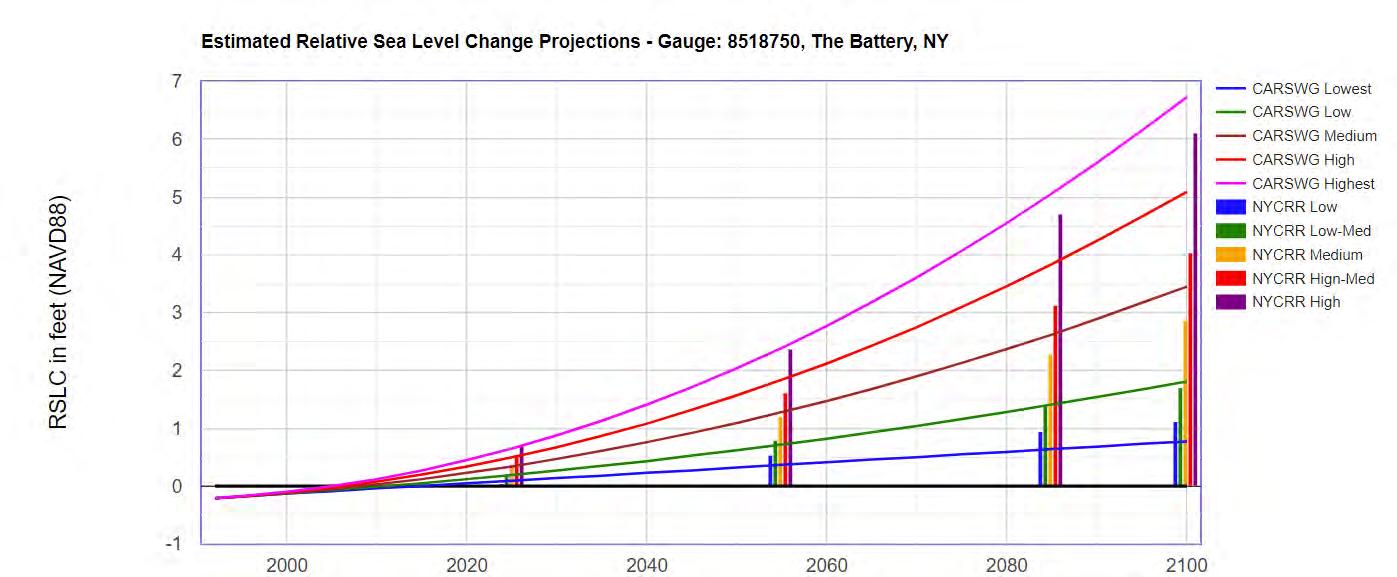
Sea levels continue to rise at an accelerating rate
Severe flood events are becoming more frequent and intense


Projections are based on IPCC Sea Level Rise Models with adjustments for possible rapid ice melt scenarios
2-10” in 2020’s
8-30” in 2050’s
13-58” in 2080’s
15-72” in 2100’s
Increased threat to life and property, risk of infrastructure failure.
Increased risk of shoreline retreat, erosion, and loss of critical habitat.
Source: NY CRRA
The City has not established a specific projection for planning purposes. Tetratech has recommended high-medium projections be used for planning purposes.
10 Year Storm (current floodplain)
Current conditions, 1 in 10 chance yearly
As sea levels rise, the floodplain moves farther inland in low lying areas
Long Range
2050-2080’s
10 Year Storm + 1 foot sea level rise (2050’s-2080’s)
Distant Future
2080-2100’s
10 Year Storm + 1.5 foot sea level rise (2080’s-2100’s)
Source: New York Climate Change Science Clearinghouse Sea Level Rise Mapping

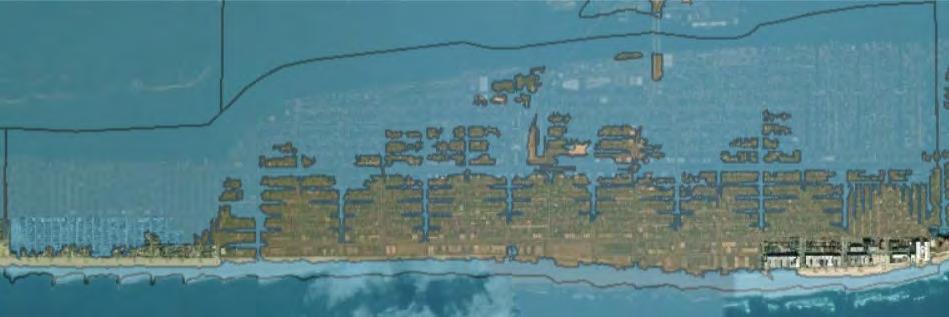


Source: Trust for Public Land Urban Heat Island Severity for U.S. Cities
An urban heat island occurs when a city experiences much warmer temperatures than nearby rural areas. The difference in temperature between urban and less-developed rural areas has to do with how well the surfaces in each environment absorb and hold heat.
Heat islands can affect communities byincreasing summertime peak energy demand, air conditioning costs, air pollution and greenhouse gas emissions, heat-related illness and mortality, and water quality.
The greatest heat island areas of the City are in the West End neighborhood.

Source: Trust for Public Land Urban Heat Island Severity for U.S. Cities
City of Long Beach Tree
Replanting Master Plan
Source: City of Long Beach


The West End neighborhood experiences some of the most severe heat island effects in Long Beach
The “State” streets in the West End were not included in the 2015 Tree Replanting Master plan due to the lack of planting strips along the roadways. Possible tree planting in this area is dependent on property owner participation.
Other heat island areas include: the North Park neighborhood, the City Hall area, and the oceanfront west of Long Beach Blvd.

FEMA All of Long Beach is within a high-risk flood area with a 1% or greater chance of flooding, as identified by FEMA where mandatory flood insurance is required.
Zone VE (Coastal High Hazard Area) has a 1% or greater chance of flooding and an additional hazard associated with storm waves. These areas have a 26% chance of flooding over the life of a 30-year mortgage.
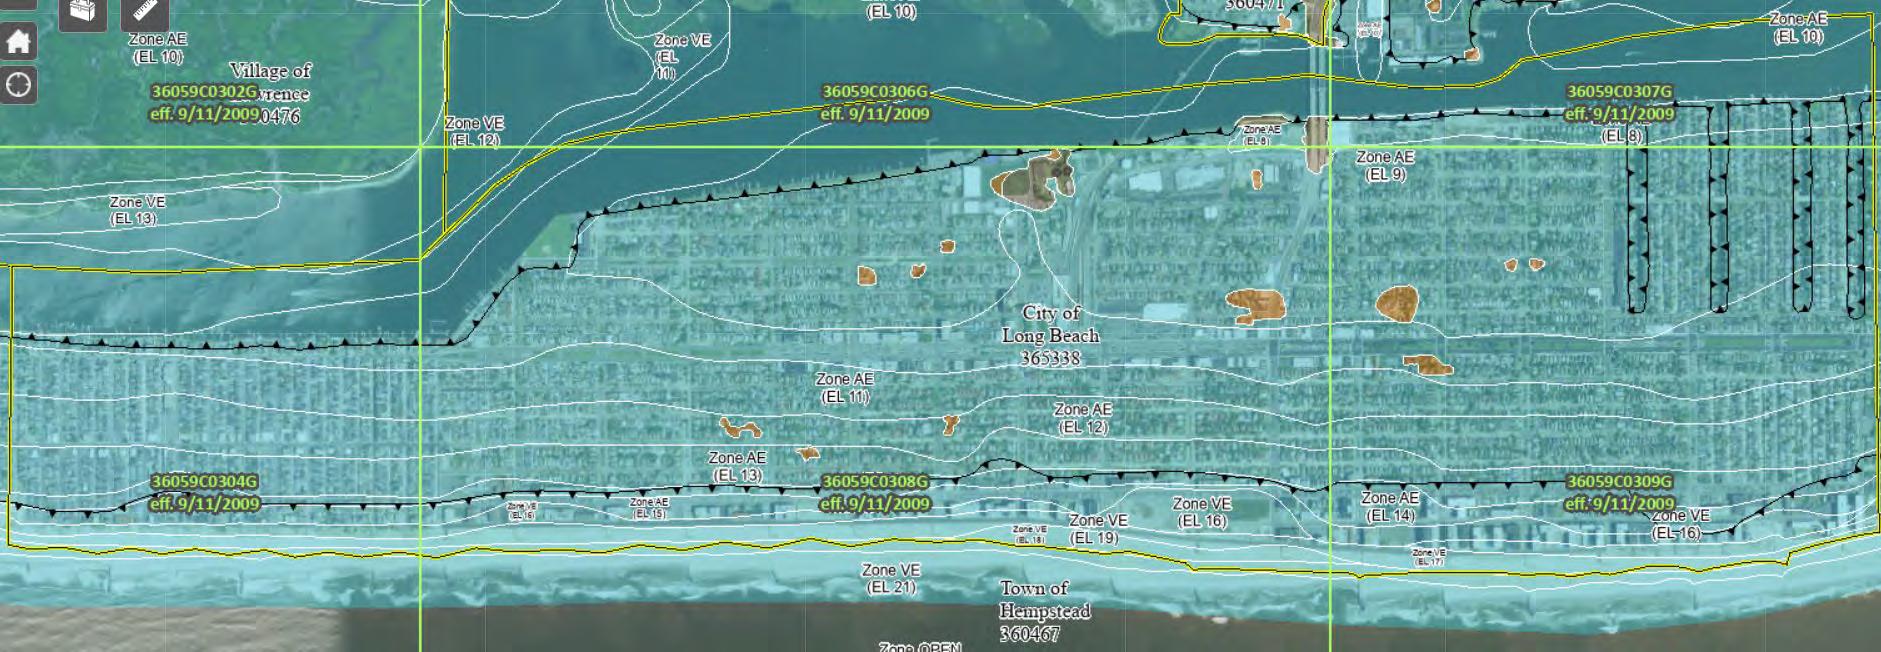
Long Beach has lowered and maintained a Community Rating System (CRS) Level of 7, reducing Flood Insurance costs by 15%.


building a greenhouse gas inventory,
upgrading streetlights to more efficient LED technology,
adopting rooftop solar on government buildings,
conducting a climate vulnerability assessment,
participating in the National Flood Insurance Program’s Community Rating System,
hosting climate-related public events, etc.
Global average temperatures are rising with severe heat events becoming more frequent, leading to:
Increase infrequency of severe rainfall events
Rapidly accelerating rise in sea levels
Increase in frequency of severe flooding
Increased threat to life and property
Lowering GHG emissions has the potential to lessen the severity of rising temperatures.
The Heat Island effect is an issue in some Long Beach neighborhoods especially in the West End neighborhood.
All of Long Beach is within a high-risk flood area with a 1% or greater chance of flooding, as identified by FEMA where mandatory flood insurance is required. Long Beach has lowered it’s FEMA CRS Level to a 7, reducing Flood Insurance costs by 15%.
Long Beach has a Bronze Certification in the NY Climate Smart Communities Program.

Sources for the various figures, tables, and photographs appearing in the City of Long Beach Comprehensive Plan 2022–2032 are as follows:
Figures
Figure 1-1: City of Long Beach
Figure 2-1: SLR
Figure 3-1: U.S. Census, 1950-2010; Projected Population by Esri
Figure 3-2: 2019 ACS 5-Year Estimates
Figure 3-3: U.S. Census (1990, 2000, 2010) and 2019 ACS 5-Year Estimates
Figure 3-4: 2010 and 2019 ACS 5-Year Estimates
Figure 3-5: 2019 ACS 5-Year Estimates
Figure 3-6: 2019 ACS 5-Year Estimates
Figure 3-7: 2019 ACS 5-Year Estimates
Figure 3-8: City of Long Beach
Figure 3-9: Esri
Figure 3-10: Nassau County; City of Long Beach; SLR
Figure 3-11: City of Long Beach; SLR
Figure 3-12: Orthoimagery via Nearmap, March 2023
Figure 3-13: City of Long Beach; SLR
Figure 3-14: 2019 ACS 5-Year Estimates
Figure 3-15: 2019 ACS 5-Year Estimates
Figure 3-16: 2019 ACS 5-Year Estimates
Figure 3-17: 2019 ACS 5-Year Estimates
Figure 3-18: FEMA
Figure 3-19: 2019 ACS 5-Year Estimates
Figure 3-20: 2019 ACS 5-Year Estimates
Figure 3-21: Long Beach City Assessor
Figure 3-22: 2019 ACS 5-Year Estimates
Figure 3-23: U.S. Department of Housing and Urban Development, Comprehensive Housing Affordability Strategy, 2014-2018
Figure 3-24: 2019 ACS 5-Year Estimates
Figure 3-25: New York State Department of Labor
Figure 3-26: New York State Department of Transportation
Figure 3-27: New York State Department of Transportation
Figure 3-28: Esri
Figure 3-29: Nassau County Department of Public Works
Figure 3-30: City of Long Beach; SLR
Figure 3-31: City of Long Beach; SLR
Figure 3-32: Trust for Public Land
Figure 4-1: Streetsense
Figure 4-2: Streetsense
Figure 5-1: City of Long Beach; SLR
Tables
Table 3-1: U.S. Census, 2010 and 2020
Table 3-2: Nassau County; City of Long Beach; SLR
Table 3-3: City of Long Beach; U.S. Census, 2010 and 2020
Table 3-4: U.S. Department of Housing and Urban Development, Comprehensive Housing Affordability Strategy, 2014-2018
Table 3-5: 2010 and 2019 ACS 5-Year Estimates
Table 3-6a: WalkScore
Table 3-6b: 2020 ACS 5-Year Estimates
Table 3-7: City of Long Beach; SLR
Table 3-8: City of Long Beach; SLR
Table 3-9: City of Long Beach; SLR
Table 3-10: New York Department of Environmental Conservation’s Community Risk and Resilience Act