BOWIE-MITCHELLVILLE AND VICINITY MASTER PLAN Existing Conditions Report August 2020
BOWIE-MITCHELLVILLE AND VICINITY MASTER PLAN
Abstract
Date August 2020
Title Bowie-Mitchellville and Vicinity Master Plan: Existing Conditions Report
Author The Maryland-National Capital Park and Planning Commission
Subject Bowie-Mitchellville and Vicinity Master Plan: Existing Conditions Report
Source of copies The Maryland-National Capital Park and Planning Commission 14741 Governor Oden Bowie Drive Upper Marlboro, MD 20772
Series number 323202306
Number of pages 296
The intent of the document is to analyze existing conditions for the Bowie-Mitchellville and Vicinity area using the eight planning elements outlined in the 2014 Plan Prince George’s 2035 Approved General Plan. The project will cover four planning areas in the northeastern part of the County:
PA 71A: Bowie and Vicinity
PA 71B: City of Bowie
PA 74A: Mitchellville and Vicinity
PA 74B: Collington and Vicinity
The Maryland-National Capital Park and Planning Commission
Casey Anderson, Chairman
Elizabeth M. Hewlett, Vice Chairman Officers
Anju Bennett, Acting Executive Director
Joseph Zimmerman, Secretary-Treasurer
Adrian R. Gardner, General Counsel
The Maryland-National Capital Park and Planning Commission (M-NCPPC) is a bicounty agency, created by the General Assembly of Maryland in 1927. The Commission’s geographic authority extends to the great majority of Montgomery and Prince George’s Counties: the Maryland-Washington Regional District (M-NCPPC planning jurisdiction) comprises 1,001 square miles, while the Metropolitan District (parks) comprises 919 square miles, in the two counties.
The Commission has three major functions:
• The preparation, adoption, and, from time to time, amendment or extension of the General Plan for the physical development of the Maryland-Washington Regional District.
• The acquisition, development, operation, and maintenance of a public park system.
• In Prince George’s County only, the operation of the entire county public recreation program.
The Commission operates in each county through a Planning Board appointed by and responsible to the County government. All local plans, recommendations on zoning amendments, administration of subdivision regulations, and general administration of parks are responsibilities of the Planning Boards.
The Prince George’s County Planning Department:
• Our mission is to help preserve, protect and manage the County’s resources by providing the highest quality planning services and growth management guidance and by facilitating effective intergovernmental and citizen involvement through education and technical assistance.
• Our vision is to be a model planning department of responsive and respected staff who provide superior planning and technical services and work cooperatively with decision makers, citizens, and other agencies to continuously improve development quality and the environment and act as a catalyst for positive change.
Prince George’s County Planning Department
PRINCE GEORGE’S COUNTY PLANNING BOARD
Elizabeth M. Hewlett, Esq., chairman
Dorothy F. Bailey, vice chair
Manuel R. Geraldo
William Doerner A. Shuanise Washington
MONTGOMERY COUNTY PLANNING BOARD
Casey Anderson, chairman
Natali FaniGonzalez Gerald R. Cichy Tina Patterson Partap Verma
Prince George’s County
County
Angela Alsobrooks, County Executive
Council
The County Council has three main responsibilities in the planning process: (1) setting policy, (2) plan approval, and (3) plan implementation. Applicable policies are incorporated into area plans, functional plans, and the general plan. The Council, after holding a hearing on the plan adopted by the Planning Board, may approve the plan as adopted, approve the plan with amendments based on the public record, or disapprove the plan and return it to the Planning Board for revision. Implementation is primarily through adoption of the annual Capital Improvement Program, the annual Budget, the water and sewer plan, and adoption of zoning map amendments.
COUNCIL MEMBERS
Thomas E. Dernoga, 1st District
Deni Taveras, 2nd District
Dannielle M. Glaros, 3rd District
Todd M. Turner, 4th District, Council Chair
Jolene Ivey, 5th District
Derrick Leon Davis, 6th District
Rodney C. Streeter, 7th District
Monique Anderson-Walker, 8th District
Sydney J. Harrison, 9th District
Mel Franklin, At-large
Calvin S. Hawkins, At-large, Council Vice Chair
Clerk of the Council: Donna J. Brown
Prince George’s County Planning Department
Figure 5 . Population by Age in Bowie-Mitchellville and Vicinity and Prince George’s County (2018)
Figure 6 Population Growth or Decline by Age in Bowie-Mitchellville and Vicinity and Prince George’s County (2010–2018)
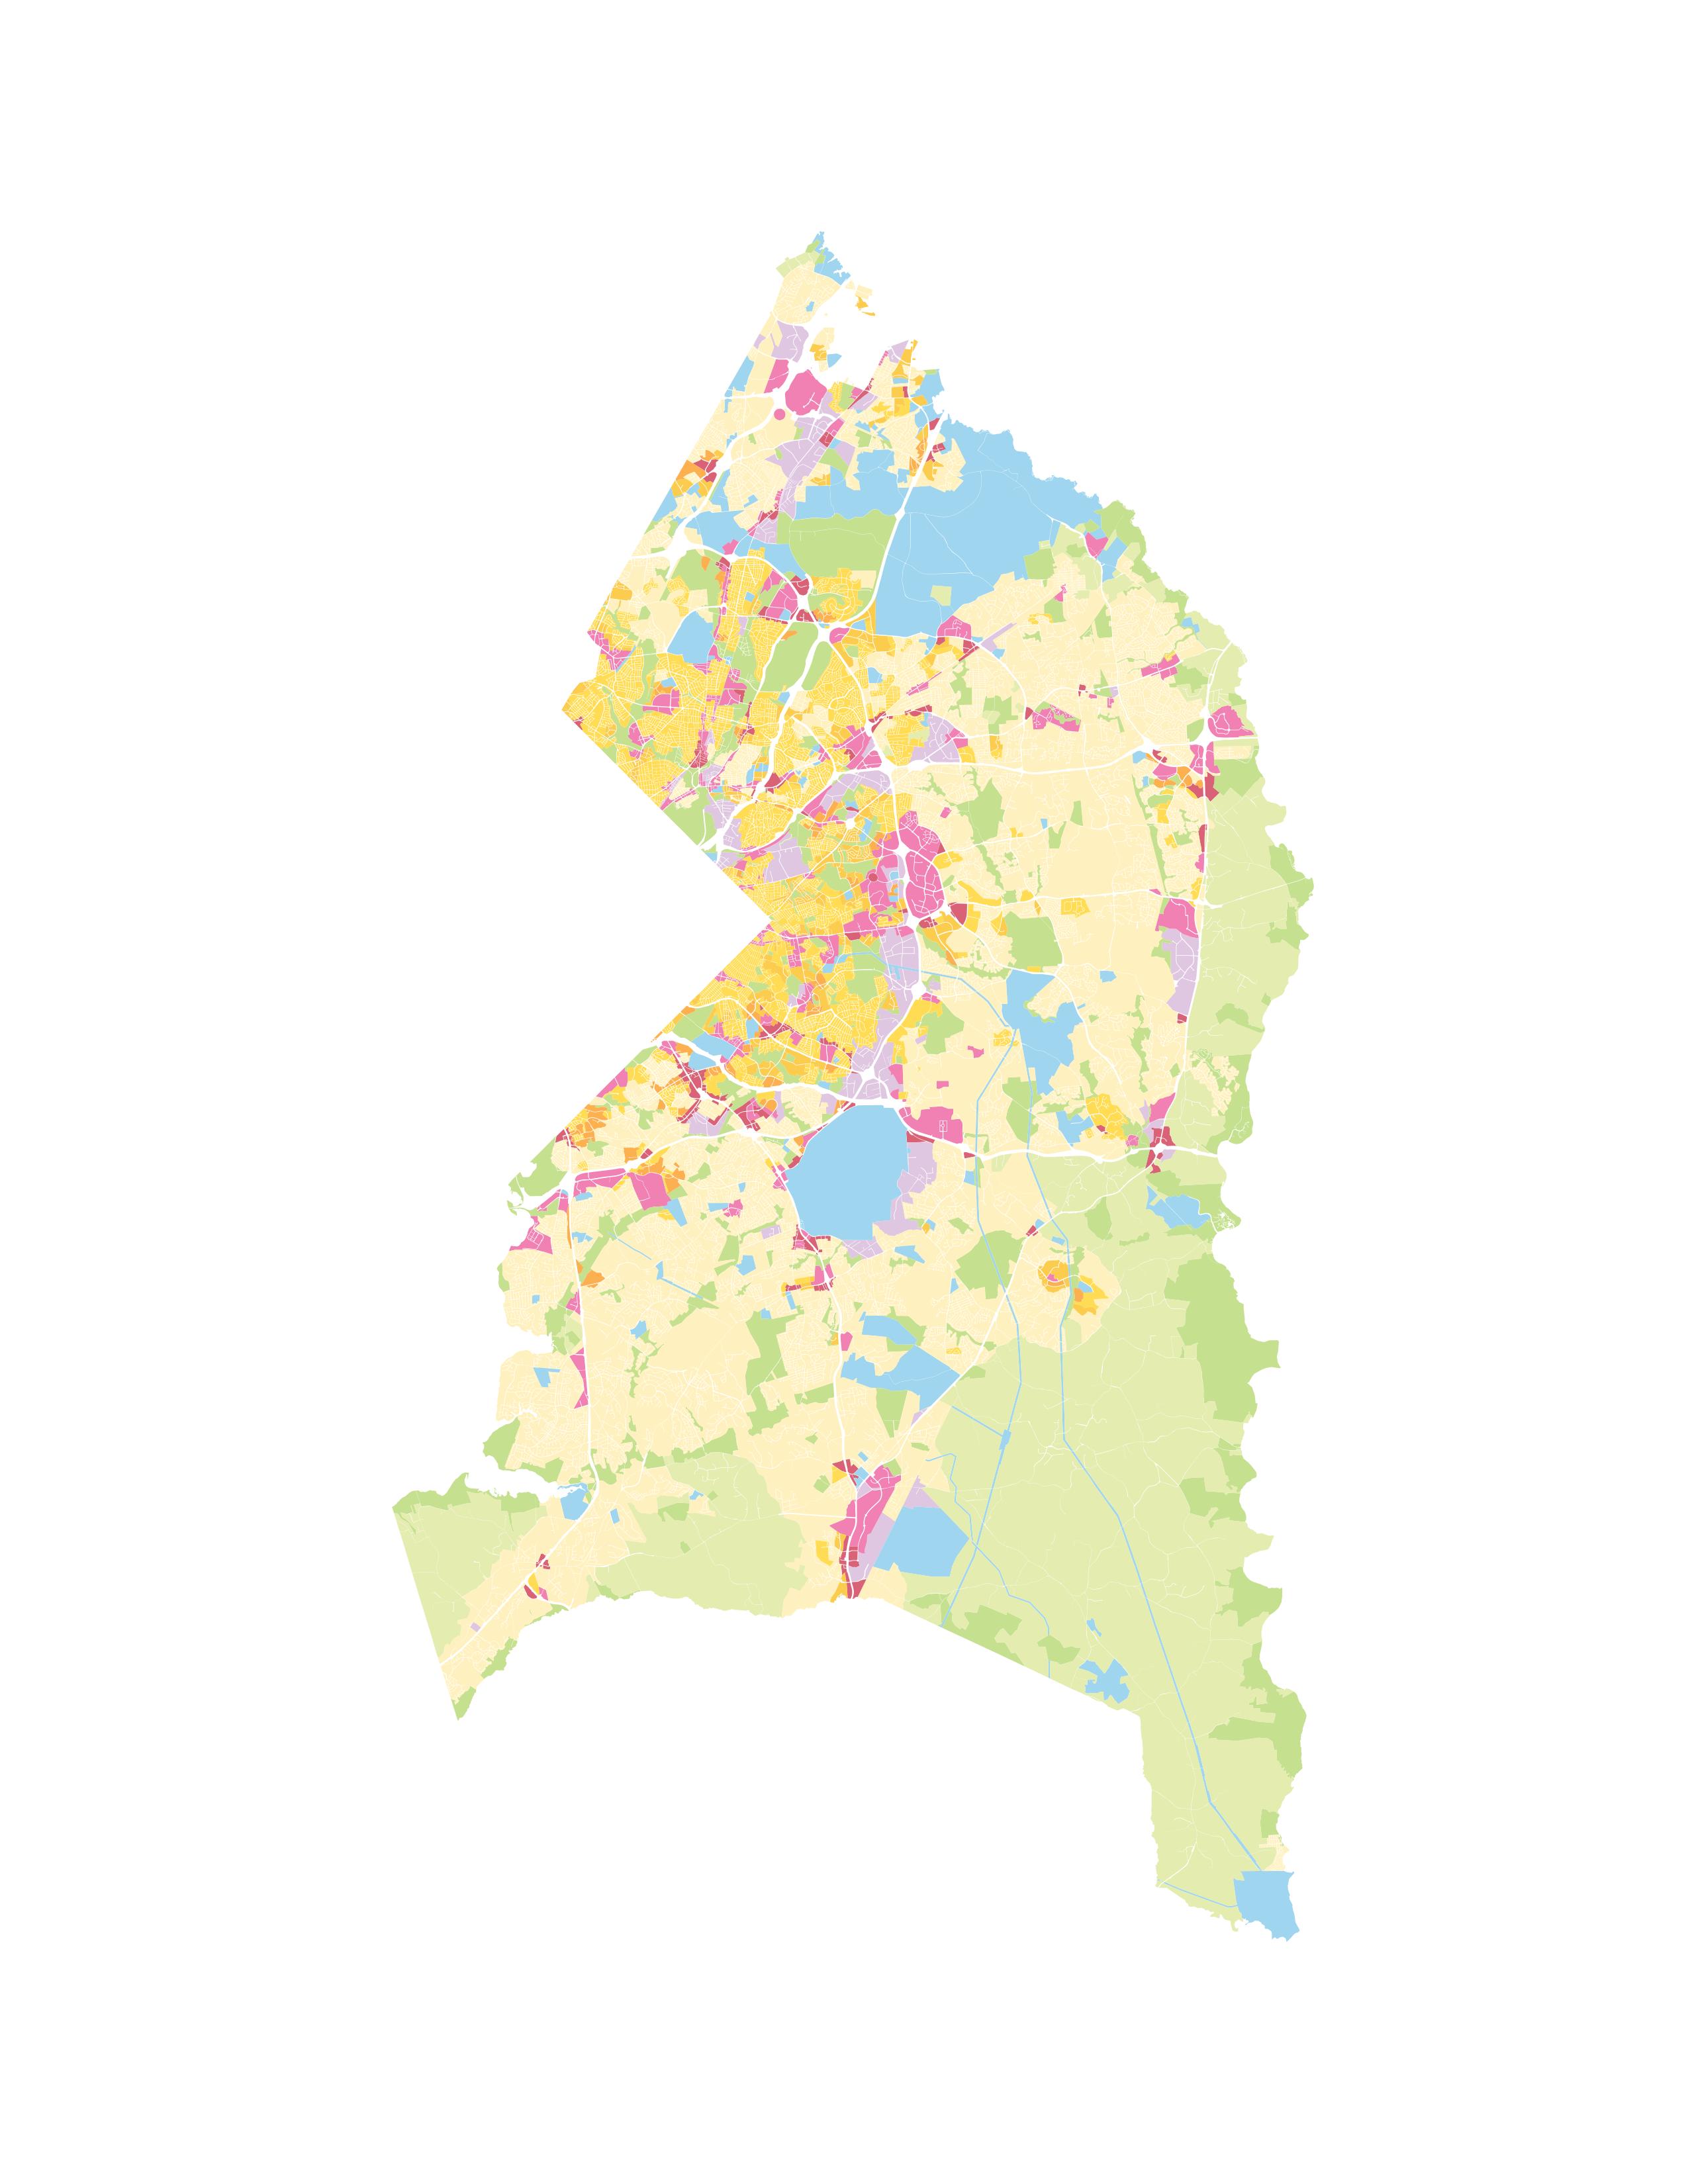
Figure 41 Existing Land Use, County and Master Plan Area
Figure 42 Existing and Generalized Future Land Use (as Percentage of Total Land Use) .
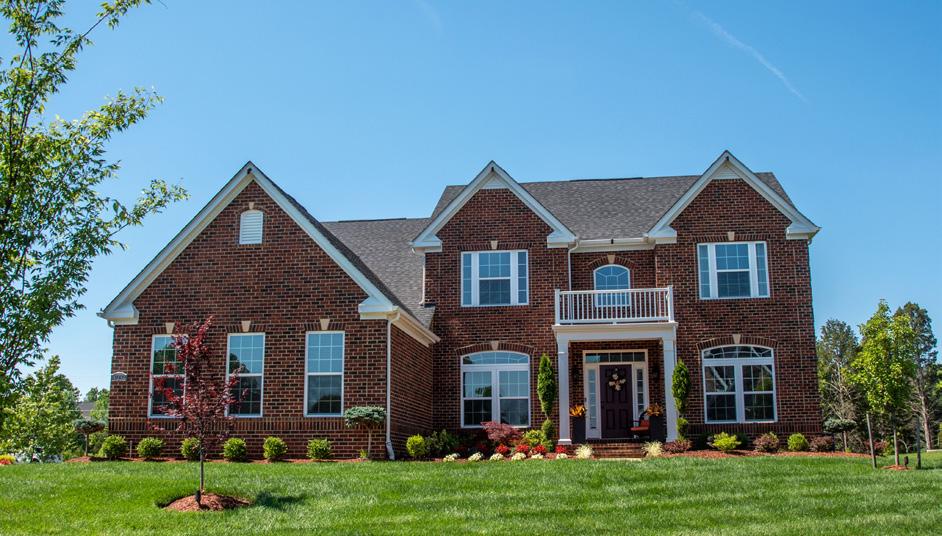
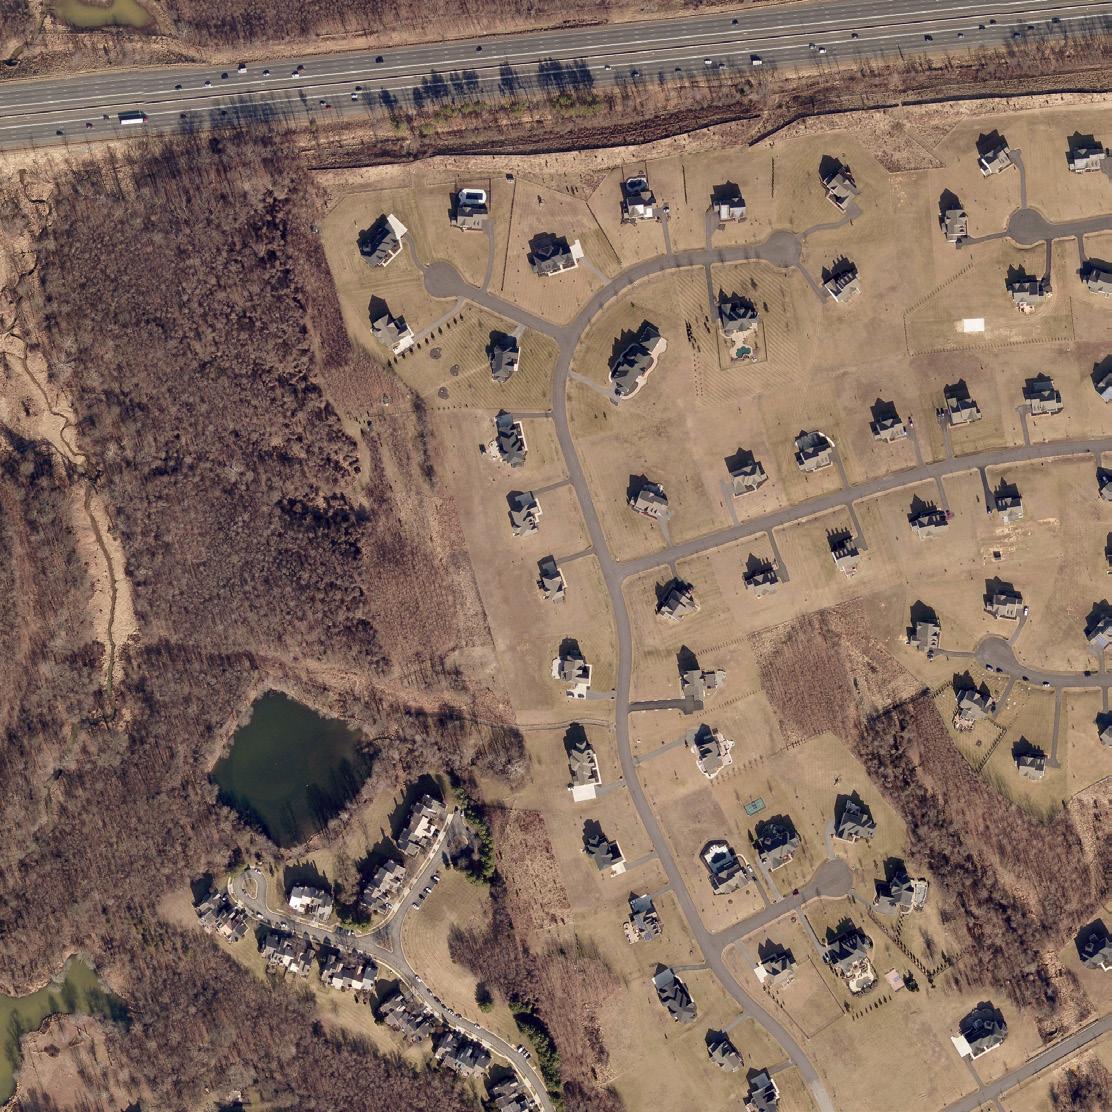
Figure 43 Single-Family Detached Residences in the City of Bowie, Zoned Residential 80 (R-80) and Residential 55 (R-55)
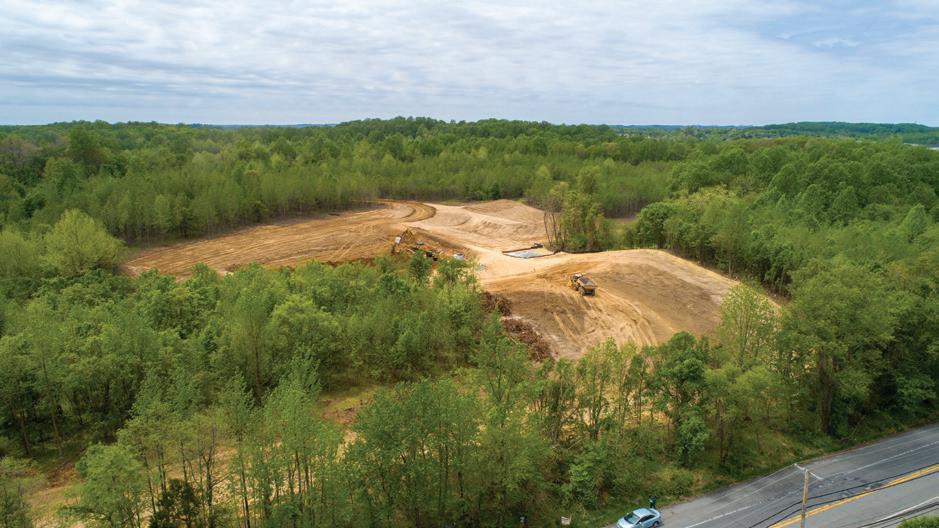
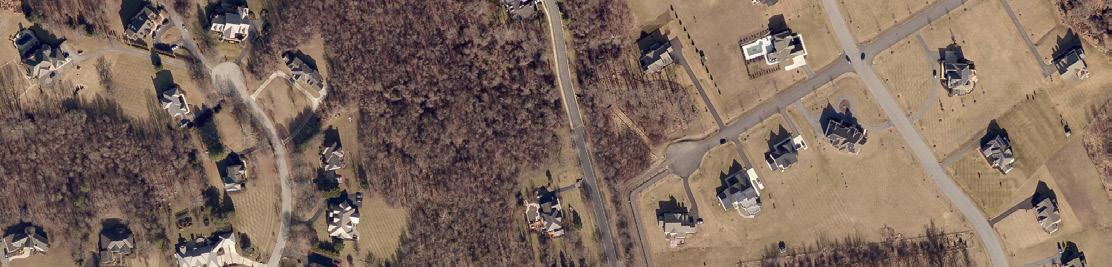
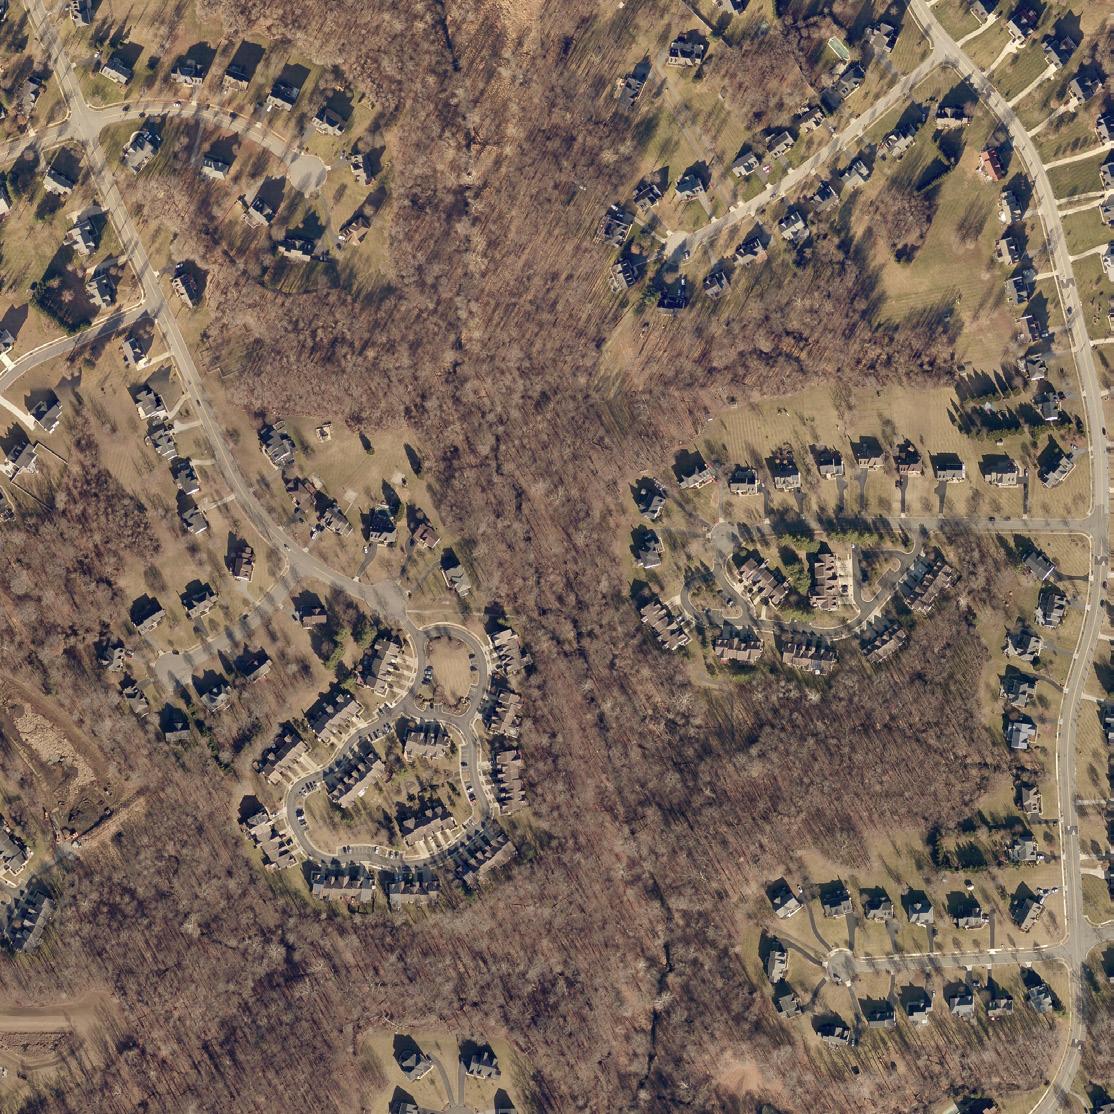
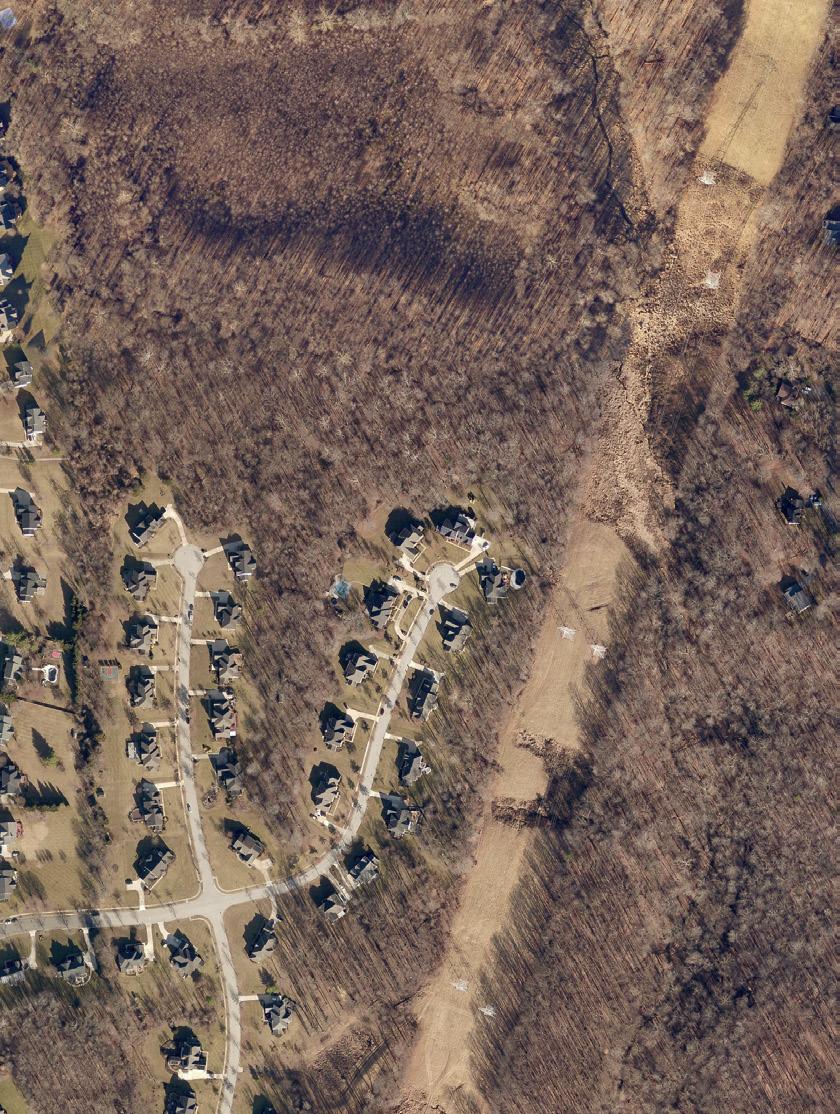
Figure 44 Recent Development in the Residential-Agricultural (R-A) Zone South of US 50 and West of Church Road
Figure 45 Residential Construction History (2001–Present)
Figure 46 Nonresidential Construction History: Existing Parcel Development Date (1900–2020)
Figure 47 Nonresidential Construction History: Existing Parcel Development Date and Acreage (1900–2020)
Figure 48 Ownership of Vacant Land in the Master
Figure 49 Street Network in the
Figure 50 Street Network with Low Connectivity
Section 1
Introduction and Context
Prince George’s County Planning Department
Sources: GIS Data Catalogue, Prince
George’s County Planning Department, DC Open Data.
What kind of future does Bowie-Mitchellville and Vicinity envision and how can planning be in service to this future?
Report Objectives
This existing conditions report is part of the BowieMitchellville and Vicinity Master Plan process, commissioned by The Maryland-National Capital Park and Planning Commission (M-NCPPC). The purpose of this report is to provide M-NCPPC with a snapshot of the challenges and opportunities that exist today, and to inform the development of the upcoming master plan. This report is guided by the overarching principles in the Blueprint for Tomorrow chapter of the 2014 Plan Prince George’s 2035 Approved General Plan (Plan 2035) and is structured around seven core elements that align closely with plan elements from this countywide plan: housing and neighborhoods; economic prosperity and market analysis; land use, zoning and urban form; transportation and mobility; community heritage, culture, and design; healthy communities; and public facilities. These elements, described in greater detail later in this introduction, reflect the wide spectrum of planning questions that will guide the upcoming master plan.
This report has been developed through a combination of data analysis and stakeholder engagement. It will be followed by a playbook of urban design strategies, which builds off of the findings in this report to offer specific recommendations for planning and urban design strategies to consider in the master plan process. This report, and the playbook that follows, seek to lay the foundation for M-NCPPC’s upcoming Bowie-Mitchellville and Vicinity Master Plan that will revisit the vision for the BowieMitchellville and Vicinity area. By examining present conditions, drawing guidance from countywide planning objectives, and presenting core challenges and opportunities, this report represents an important step toward planning a more livable, walkable, vibrant, connected, healthy, and sustainable BowieMitchellville and Vicinity area.
What kind of future does Bowie-Mitchellville and Vicinity envision, and how can planning be done in service to this future? In preparation for the upcoming master planning process, this existing conditions report provides the foundation for planners and stakeholders to begin to ask important questions about the future of the master plan area:
• Does Bowie-Mitchellville and Vicinity want to see change? If so, what kind of change?
• What role does Bowie-Mitchellville and Vicinity wish to play in the future of Prince George’s County? In the Washington, D.C. metropolitan region?
• Does Bowie-Mitchellville and Vicinity want to attract millennials? Does Bowie-Mitchellville and Vicinity want to focus planning efforts on accommodating aging in place for the aging population?
• Does Bowie-Mitchellville and Vicinity want to see growth in the coming years, and if so what kind of growth?
• What will be the implications of these changes for land use, transportation, development, the built and natural environment, and the health and vibrancy of local communities?
While this report does not provide answers to these questions, it aims to plant the seeds for future planning and conversations by equipping stakeholders and the public with key information needed to understand Bowie-Mitchellville and Vicinity, and prioritize its planning needs.
This existing conditions report presents a comprehensive snapshot of current conditions in Bowie-Mitchellville and Vicinity. It presents both a thorough overview of the master plan area and detailed profiles of specific subareas, known as focus areas. To facilitate a meaningful and contextual understanding of Bowie-Mitchellville and Vicinity’s planning needs, it focuses on challenges and opportunities for planners to consider for focus areas and the master plan area overall.
GROWTH POLICY
Map 2. Growth Policy Map for Prince George’s County
REGIONAL TRANSIT DISTRICTS
BA - Branch Avenue Metro
CP - College Park/UM Metro/M Square Purple Line
G - Greenbelt Metro
LTC - Largo Town Center Metro
NC - New Carrollton Metro
NH - National Harbor
PGP - Prince George’s Plaza Metro
S - Suitland Metro
LOCAL CENTERS
1. Konterra
2. Muirkirk MARC
3. Takoma/Langley Crossroads
4. UMD West*
5. UMD Center*
6. UMD East *
7. West Hyattsville
8. Port Towns
9. Riverdale MARC
10. Riverdale Park*
11. Beacon Heights*
12. Annapolis Road/Glenridge*
13. Seabrook MARC
14. Bowie MARC
15. Landover Metro
16. Cheverly Metro
17. Landover Gateway
18. Bowie
19. Capitol Heights
20. Addison Road
21. Morgan Boulevard
22. Southern Avenue Metro
23. Naylor Road Metro
24. Westphalia
25. Oxon Hill
26. Brandywine
*Future Purple Line Centers
Master Plan Area Overview
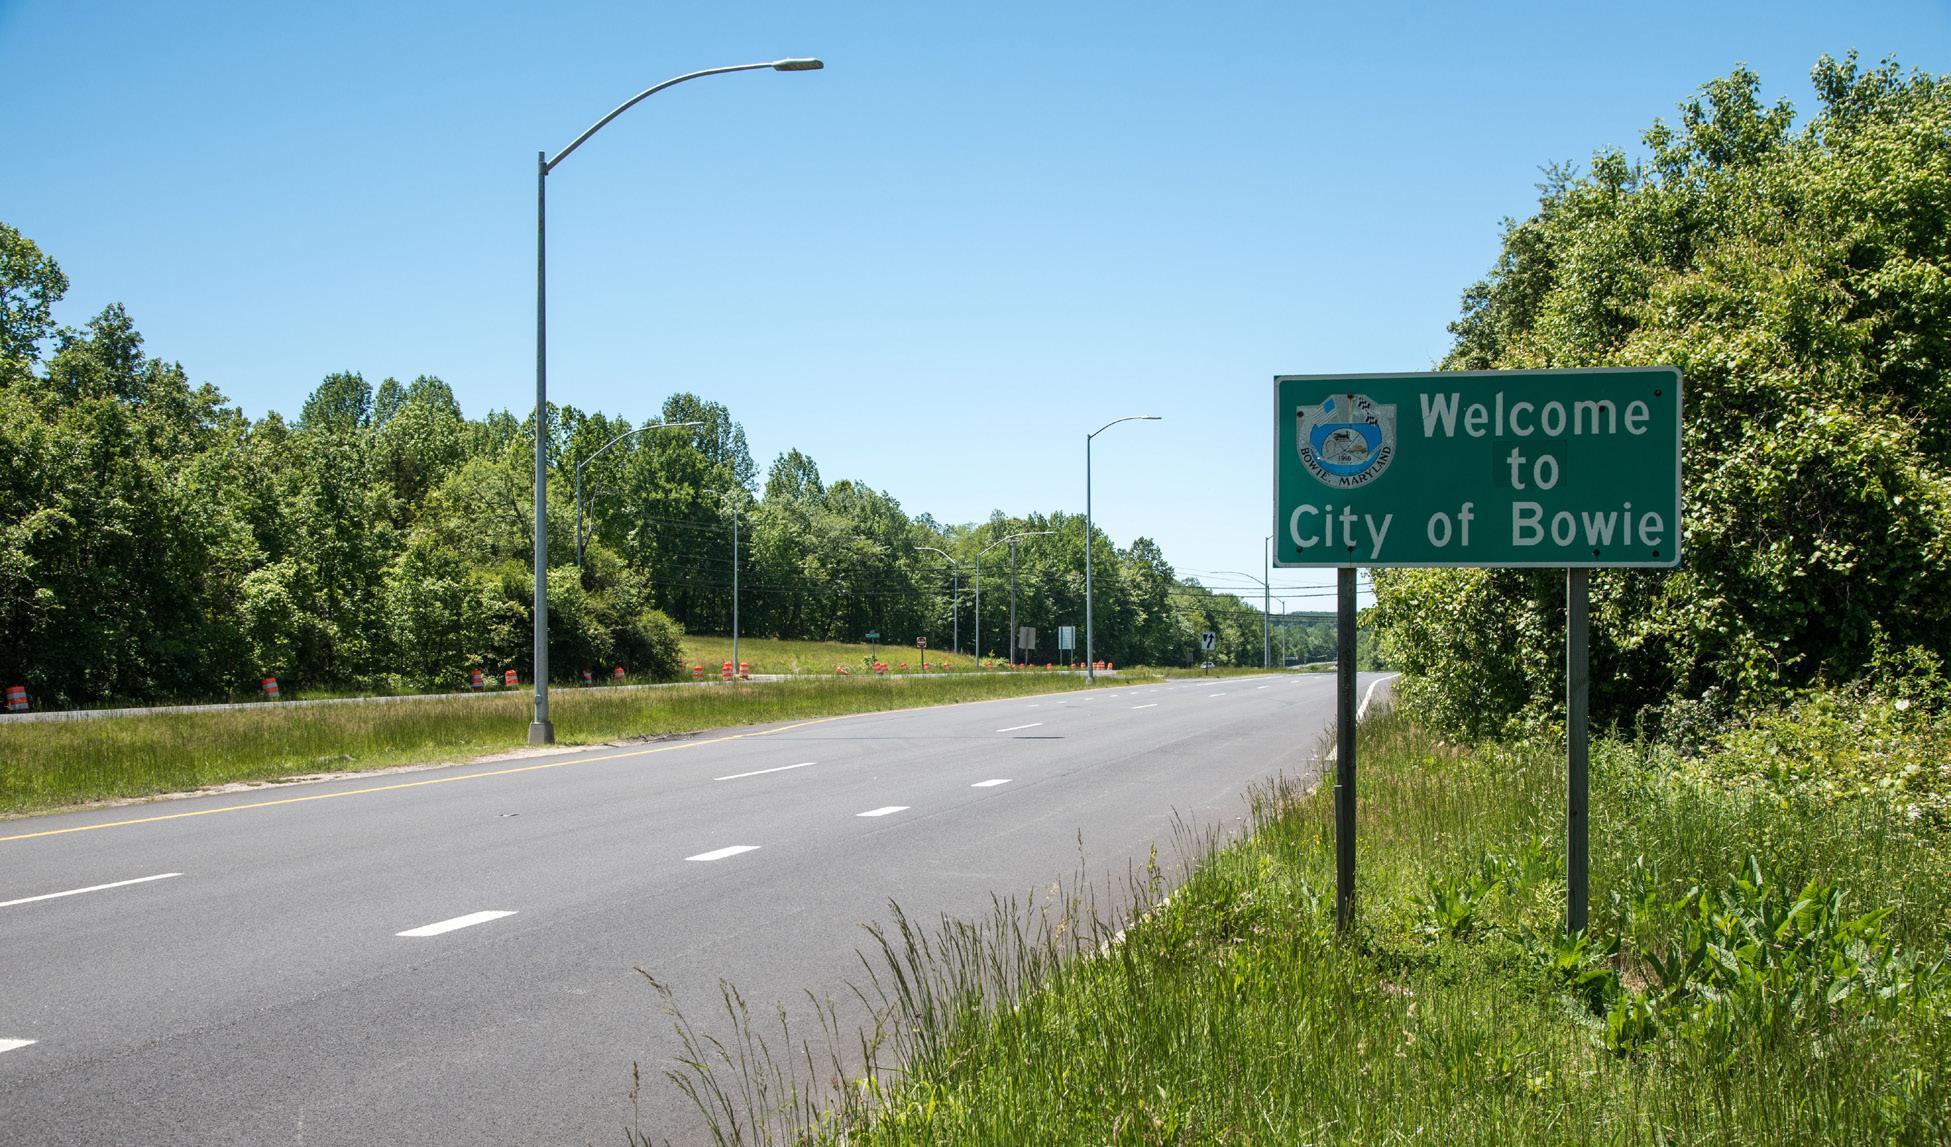
The Bowie-Mitchellville and Vicinity master plan area occupies 59 square miles in Prince George’s County, Maryland. It is comprised of four planning areas in the northeastern portion of the County—PA 71A, PA 71B, PA 74, and PA 74B. It is located less than 20 miles east of downtown Washington, D.C., and about 16 miles west of Annapolis, the capital of Maryland. Located in the northeast quadrant of Prince George’s County, the master plan area is bordered by the Patuxent River and the Anne Arundel County boundary to the east, and MD 193 (Enterprise Road) to the west. Running through the master plan area are portions of key local and regional transportation corridors; US 301 (Crain Highway) and MD 197 (Laurel Bowie/Collington Road) run north to south and MD 214, MD 50 (John Hanson Highway), and MD 450 (Annapolis Road) each run east to west through the master plan area.
The master plan area includes the incorporated City of Bowie. As a municipality, the City of Bowie maintains its own jurisdiction over many aspects of public life including water, waste management, trash, recycling, parks, and trails.1 Bowie is led by a locally elected mayor and city council. The master plan area also includes the adjacent unincorporated areas of Mitchellville and Collington, as well as other established communities and agricultural areas that surround them.
As of 2019, the master plan area has a population of approximately 88,590, which constitutes almost 10 percent of the total population of Prince George’s County.2 The population in the master plan area is growing faster than that of the County as a whole. In the next five years, the master plan area population is expected to grow at an annual growth rate of about 1.2 percent (as compared to the County’s annual growth rate of 0.5 percent), for a projected population of 89,633 by 2024.3
Plan 2035 was approved in May 2014 and includes comprehensive recommendations to guide future development in Prince George’s County. This master planning process refers to the visions set forth in this general plan. It is instructive to note where BowieMitchellville and Vicinity fits into the larger County context as outlined in the general plan. Under this plan, both the City of Bowie and the Bowie MARC Station are classified as local centers. Bowie is a local town center—an auto-accessible center that anchors its surrounding suburban subdivisions. Bowie State University (BSU) is one of the master plan area’s notable assets and has been the site of its own planning efforts in recent years. The Bowie MARC Station is recognized in Plan 2035 as a local campus center, which is a transit-accessible center serving university and community needs, including student housing. The Bowie Local Town Center and its immediate surroundings are classified as an employment area or designated economic submarket.4
This planning process grows out of recent studies and planning efforts in Bowie-Mitchellville and Vicinity, including the 2006 Approved Master Plan for Bowie and Vicinity, 2017 Prince George’s County Resource Conservation Plan, 2010 Bowie State MARC Station Sector Plan, and 2009 Prince George’s County Master Plan of Transportation. 5 It considers what has been learned and implemented as a result of these recent plans, and where there is opportunity to continue planning that is already in progress. The plan elements and strategies from Plan 2035 have greatly informed this report and provide the basis for its structure. Other recent plans are referenced throughout the report. See Appendix B. Overview of Selected Recent Plans on page page 217 for a summary of some relevant planning efforts.
1 See: “Bowie, Prince George’s County, Maryland.” n.d. Maryland Manual On-Line. Accessed March 17, 2020. https://msa. maryland.gov/msa/mdmanual/37mun/bowie/html/b.html.
2 Neustar Population Trend Report (2020).
3 Ibid.
4 See PLAN 2035: Prince George’s Approved General Plan, page 106, for further detail.
5 A selection of reviewed plans can be found in “Appendix B. Overview of Selected Recent Plans” on page 228.
Sources: GIS Data Catalogue, Prince George’s County Planning Department, M-NCPPC.
Vicinity
Collington Trade Zone
Collington and Vicinity (74B)
Mitchellville and Vicinity (74A)
City of Bowie (71B)
Bowie and Vicinity (71A)
Focus Area
What kinds of housing are needed to support the needs of the current population and attract future populations?
Approach and Plan Elements
Plan 2035 is guided by the three themes of work, live, and sustain to guide County planning and development in the decades to follow. These themes promote, respectively, a diverse and thriving economy; livable, safe, and healthy communities; and an environmentally sound and sustainable future. In service of these larger objectives, the plan sets forth eight key planning elements. This report makes every effort to align with the guidelines established in Plan 2035. It is organized around a set of core elements, which correspond to seven of the eight elements outlined in the countywide plan.6
HOUSING AND NEIGHBORHOODS
This lens considers housing and neighborhoods, with an emphasis on aging in place, housing affordability, and increasing the County’s supply of multifamily housing in response to both market demand and larger planning objectives—particularly, increased density and mixture of uses near transportation hubs as part of transit-oriented development (TOD). Plan 2035 favors a range of housing types that meet the needs of all households, including millenials and senior residents. Millennials, defined as those between 15–29 years of age at the time Plan 2035 was written, are now between 23 and 39 years of age. Future planning can target millennial residents and facilitate the aging in place of Baby Boomers (those born between 1944 and 1964) through the development of multifamily housing with transit access.
One of the principal challenges facing the County in relation to this element is a lack of housing stock that meets the needs and preferences of current and future residents, especially millennials/young professionals, and seniors. Another challenge facing the County is that of housing cost burden and affordability. As such, this analysis looks at housing cost burden for homeowners and renters, and assesses the potential of mixed-income and affordable housing.
KEY QUESTIONS
• What are the dominant housing types currently seen in the master plan area?
• What kinds of housing are needed to support the needs of the current population, and attract future populations?
• What kinds of pressure is the master plan area facing in terms of housing stock and affordability?
6 The Plan 2035 general plan also includes an element for natural environment. In this report, related analyses fall under the Healthy Communities plan element. Please see the Appendix H. Bowie-Mitchellville and Vicinity Master Plan Natural Environmental Existing Conditions Report (2020) for an in-depth report on existing conditions as they relate to this element.
Bowie-Mitchellville and Vicinity Master Plan: Existing Conditions Report
What drives the local economy in Bowie-Mitchellville and Vicinity?
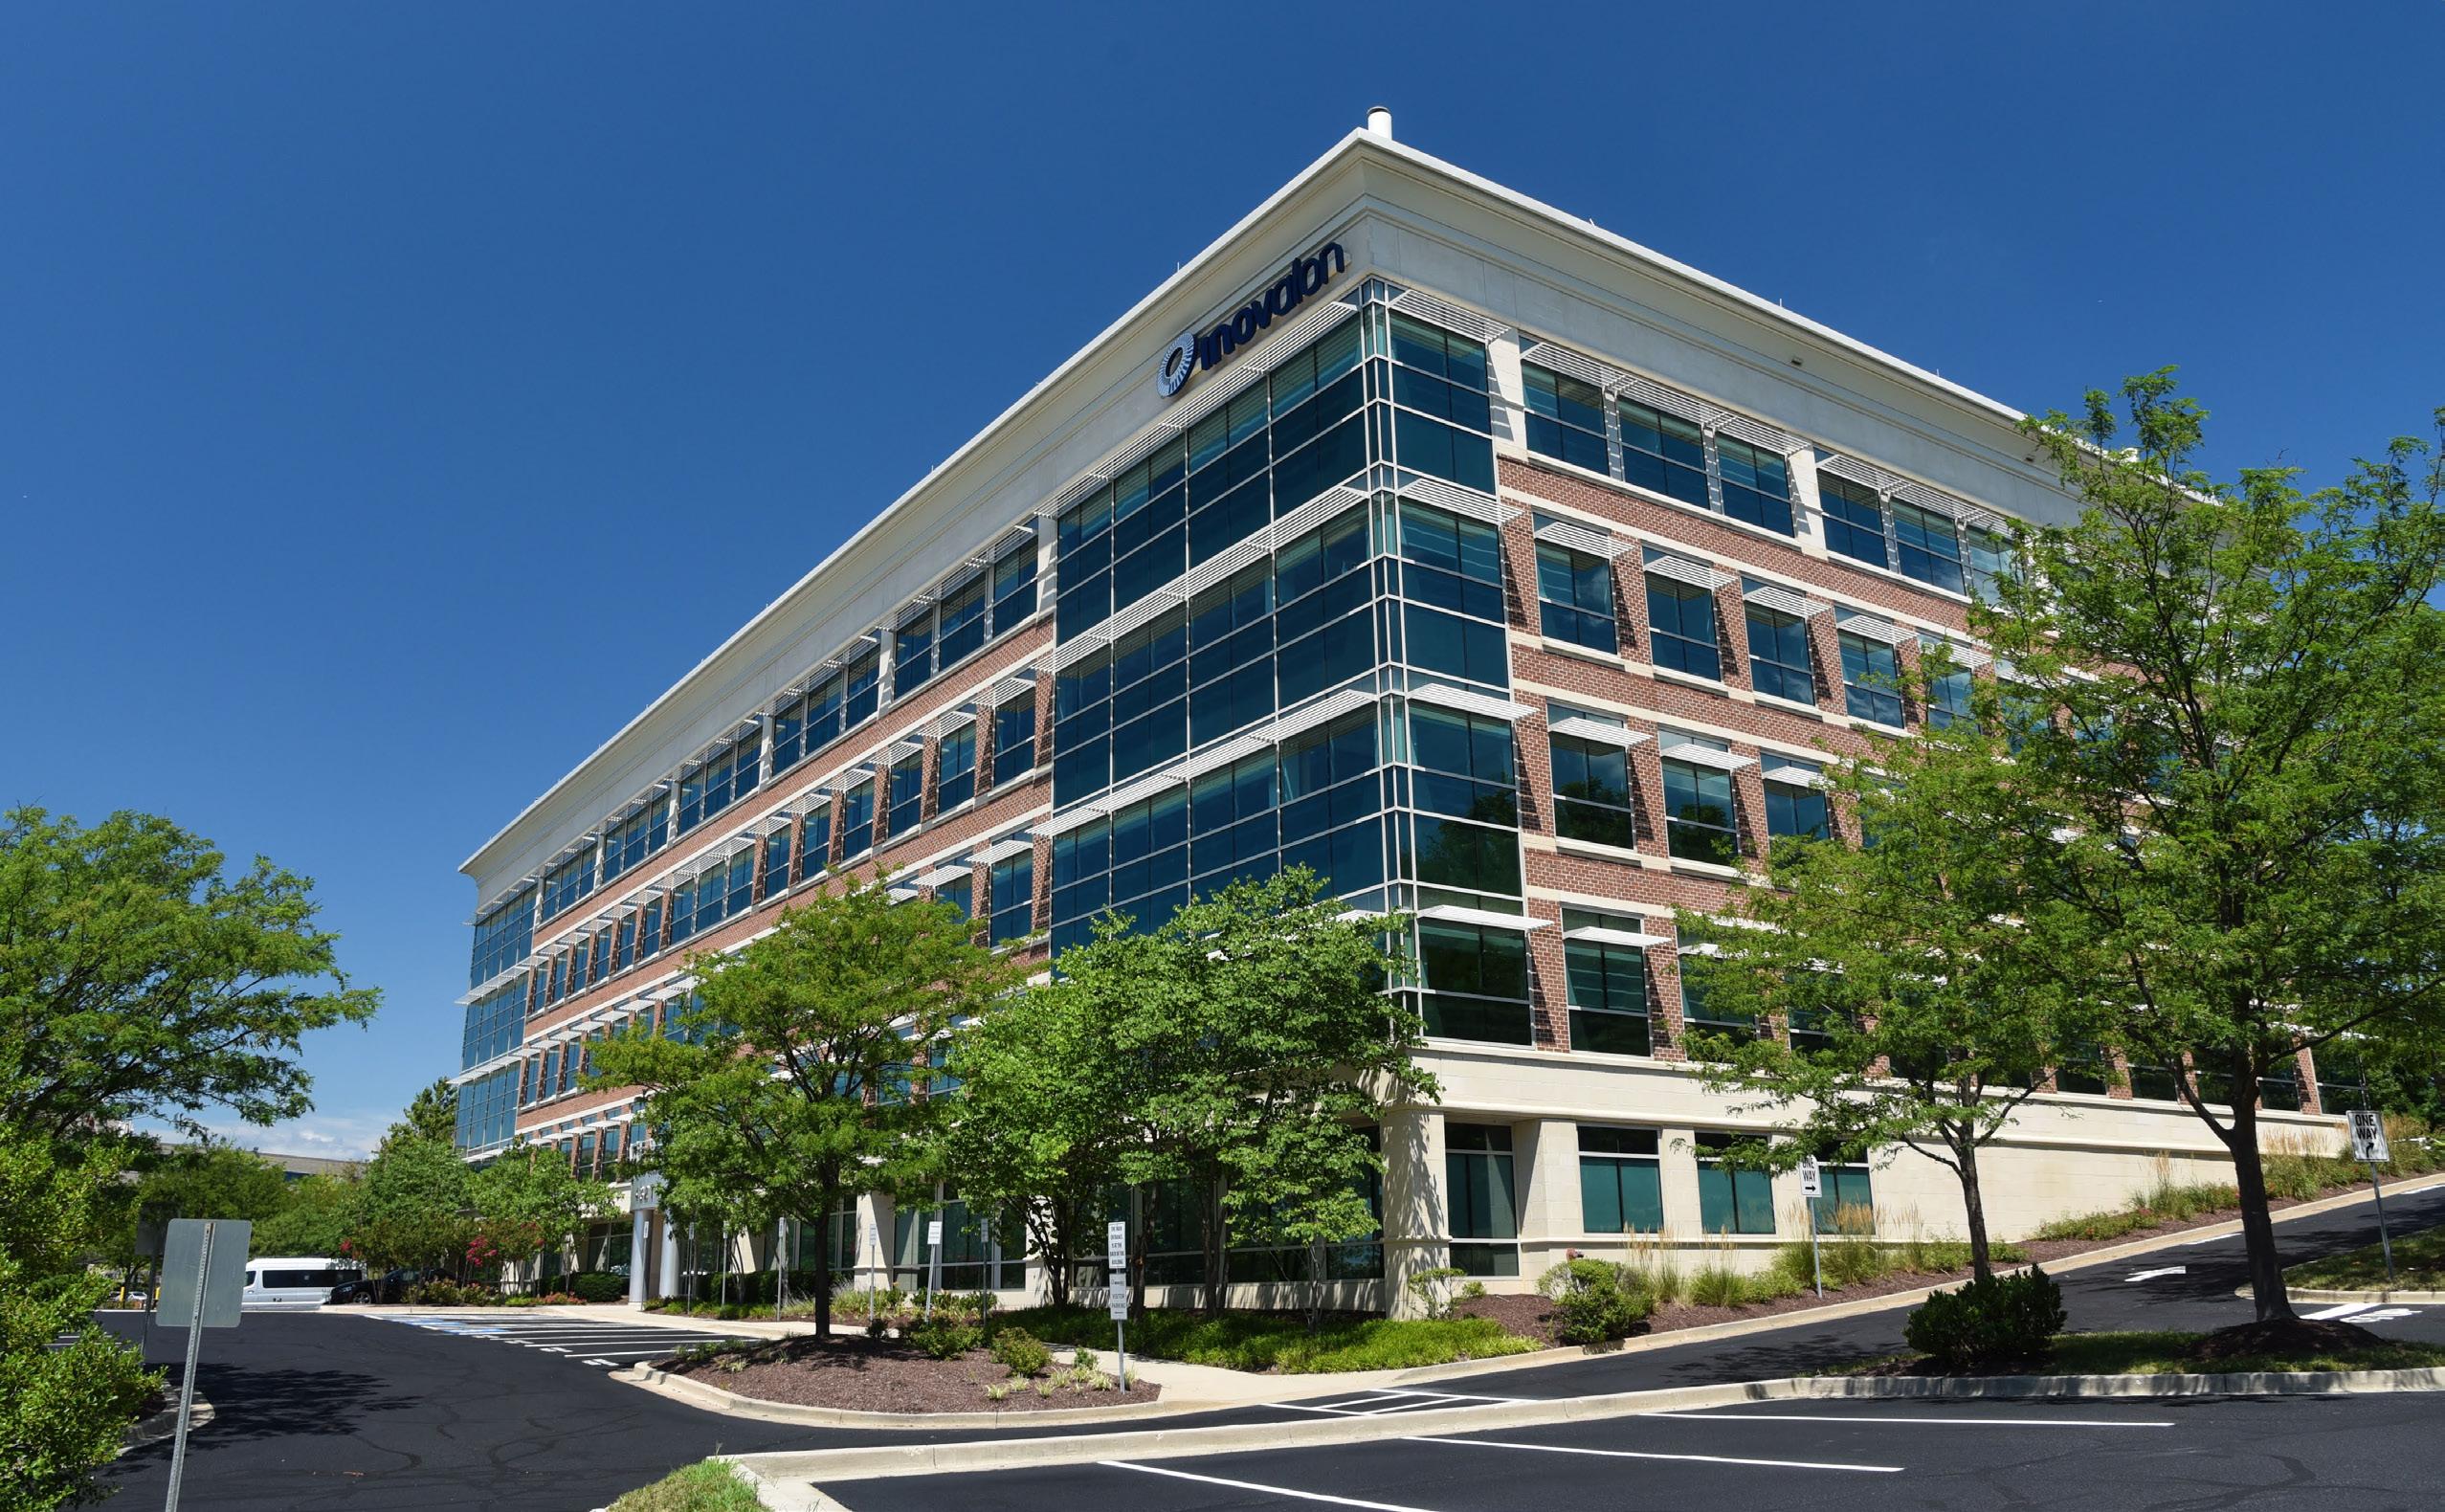
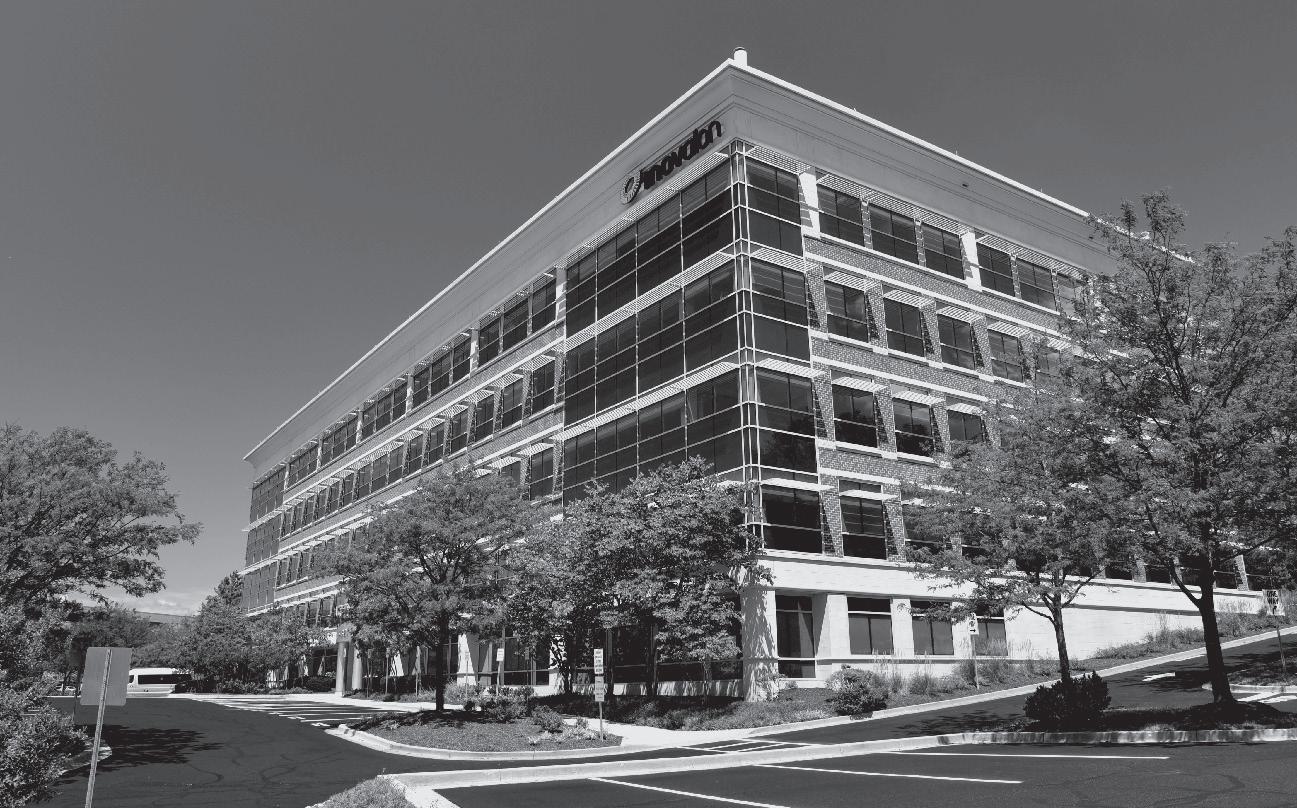
ECONOMIC PROSPERITY AND MARKET ANALYSIS
This element is concerned with meeting the needs of the local workforce and stimulating further growth in the economy. It emphasizes strengthening employment opportunities, expanding the local tax base, and investing in strategic regional sectors including technology, research, and higher education.
Some challenges the County is facing related to economic prosperity include the wage gap among residents, as well as the challenge of establishing regional competitiveness for development and businesses. The County has made efforts to strategically organize investments in the past and, under Plan 2035, sees the opportunity to strategically invest in economic hubs. Another opportunity is to meet the demands of workers’ changing housing preferences, including through the development of multifamily housing in economic submarkets such as Bowie Town Center.
This report considers these challenges and opportunities through a market analysis, including the potential of sites within the master plan area to serve as local or regional economic drivers. Through demographic analysis, the report also characterizes the socioeconomics of Bowie-Mitchellville and Vicinity, including factors related to employment, education, and income. An analysis of market clusters considers recent commercial projects and those in the pipeline, among other indicators of local economic health.
KEY QUESTIONS
• What is the current supply and demand of different kinds of markets in Bowie-Mitchellville and Vicinity?
• What are the strategic investments BowieMitchellville and Vicinity should make, and what kinds of infrastructure does that demand?
Source: SDI Productions, iStock.
Does Bowie-Mitchellville and Vicinity want to grow in the future? If
so, how?
LAND USE, ZONING, AND URBAN FORM
This relates to the Plan 2035 element of Land Use, which sets forward the intertwined objectives of preserving existing open space, mitigating further sprawl, and concentrating development in fewer, denser centers.
Plan 2035 identifies several challenges facing the County in relation to this element, including the challenges of urban sprawl, lack of concentrated centers, and gaps between permit approval and development. As the County faces the challenge of accommodating the housing needs and preferences of millennials and aging populations, the plan cites a lack of multifamily and transit-accessible development in the pipeline. One opportunity in the face of these challenges is infill and strategic redevelopment in centers. Transit-oriented development (TOD) and compact development present an opportunity to address the master plan area and the County’s challenges related to land use. Another opportunity cited by the plan is to concentrate future growth into fewer centers than imagined in previous plans, or by development trajectories at the time. The plan sets forward eight regional transit districts to concentrate development efforts at the County level, and designates other centers of activity or growth as local centers—including Bowie Local Town Center and the Bowie MARC Campus Center.
This report includes a development density catalogue and street connectivity analysis to assess the density and compactness of the underlying urban form in the master plan area. This report looks at existing zoning and land use, development patterns, and analyses of urban form, including urban design and public space. It also considers existing housing stock and affordability, and current conditions and potential related to meeting the needs of low-income residents, millennials, and aging populations. The report also looks to the Plan 2035 designations of centers, rural/ agricultural reserve, and established communities to align the master plan area’s development priorities with those of the County. Additionally, considering the County’s challenges related to the development pipeline, this report also examines the development pipeline within the master plan area to understand what development is forthcoming and how it aligns with regional and local planning objectives.
KEY QUESTIONS
• Does Bowie-Mitchellville and Vicinity hope to grow in the coming years? For what reasons and in what ways?
• Where are there opportunities in the study area to concentrate growth in key centers and to employ TOD?
• How does current zoning help or hinder the master plan area’s visions for future development and preserving existing assets?
Source: Olaser, iStock.
How can infrastructure be enhanced or improved to reach the master plan area’s mobility goals?
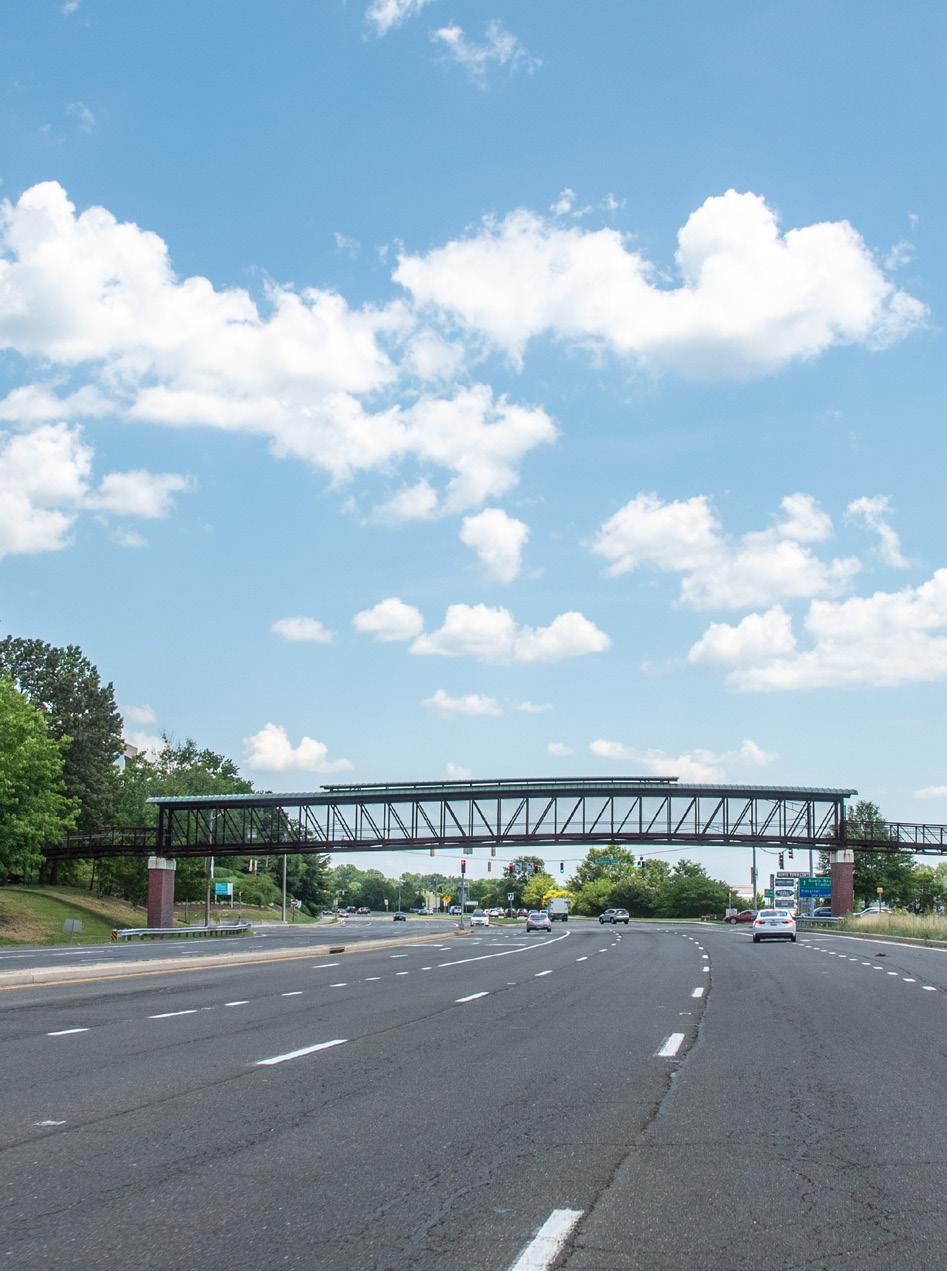
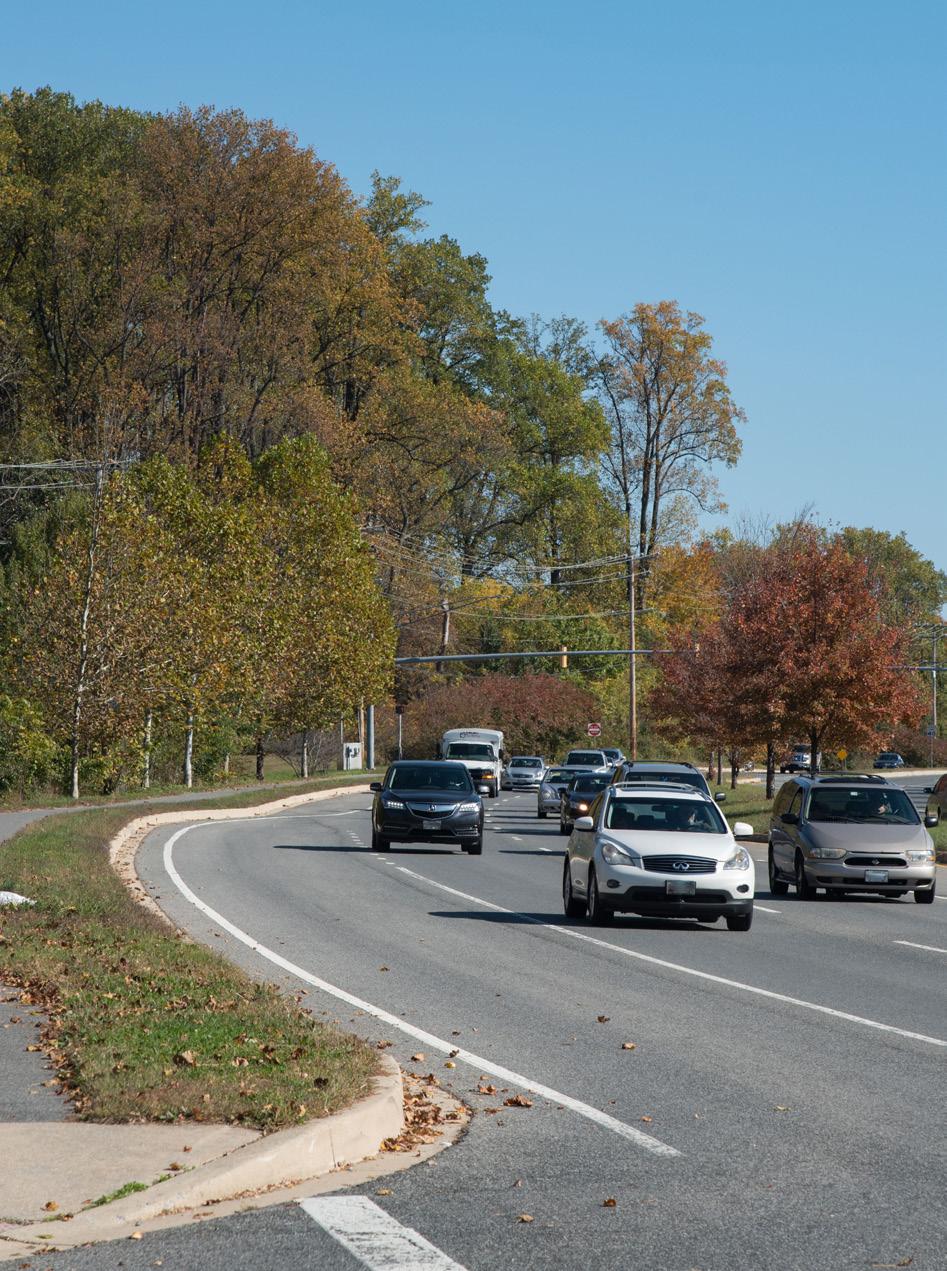
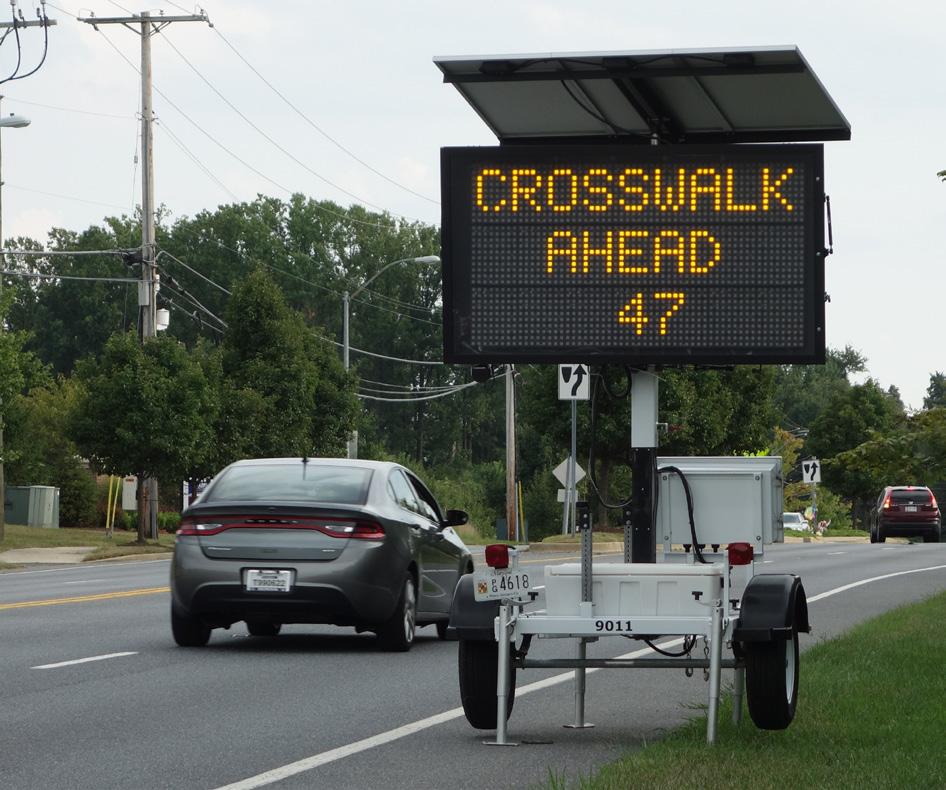
TRANSPORTATION AND MOBILITY
Plan 2035 encourages planning that focuses on the improvement of, and development around, current transportation networks and hubs, complete streets, green streets, and lessening car-dependency wherever possible.
According to Plan 2035, one of the great challenges faced by the County in relation to transportation is the high rate of automobile-based commuters who commute to and from the County or pass through it from nearby areas. Related to this is the challenge of traffic congestion and a shortage of nonautomobile-based commuters. Plan 2035 also cites aging transportation infrastructure and a lack of funding at the local, regional, and federal level as major challenges facing the County. Relevant to the master plan area, the County faces the challenge of accommodating transportation needs of suburban communities, which may be less suited for public transportation development, as well as addressing the
lack of connectivity between new developments and established communities.
One opportunity noted in Plan 2035 is that of developing green and complete streets, as mandated in the 2012 Council Bill CB-83-2012. The plan cites the opportunity of stimulating the local economy and job growth through transportation planning efforts that will also increase multimodal transportation options in the region.
Considering these challenges and opportunities, this report profiles transportation in Bowie-Mitchellville and Vicinity today, including major trends and assets in transportation and mobility, and an assessment of transportation infrastructure. This includes an analysis of economic and workforce factors that impact transportation use and behaviors, and traffic conditions on existing road networks. As in other sections of the report, the report features a discussion of challenges and opportunities related to transportation in the master plan area.
Source: BeyondImages, iStock.
How can future planning efforts uphold and enhance the unique character of Bowie-Mitchellville and Vicinity?
KEY QUESTIONS
• How do residents of Bowie-Mitchellville and Vicinity get around?
• What are the greatest barriers to safe, efficient, and sustainable transportation in the master plan area?
• Where are there opportunities to improve existing transportation networks and promote alternative forms of transportation (walking, bicycling, public transit, and more)?
• How can infrastructure be enhanced or improved to reach the master plan area’s mobility goals?
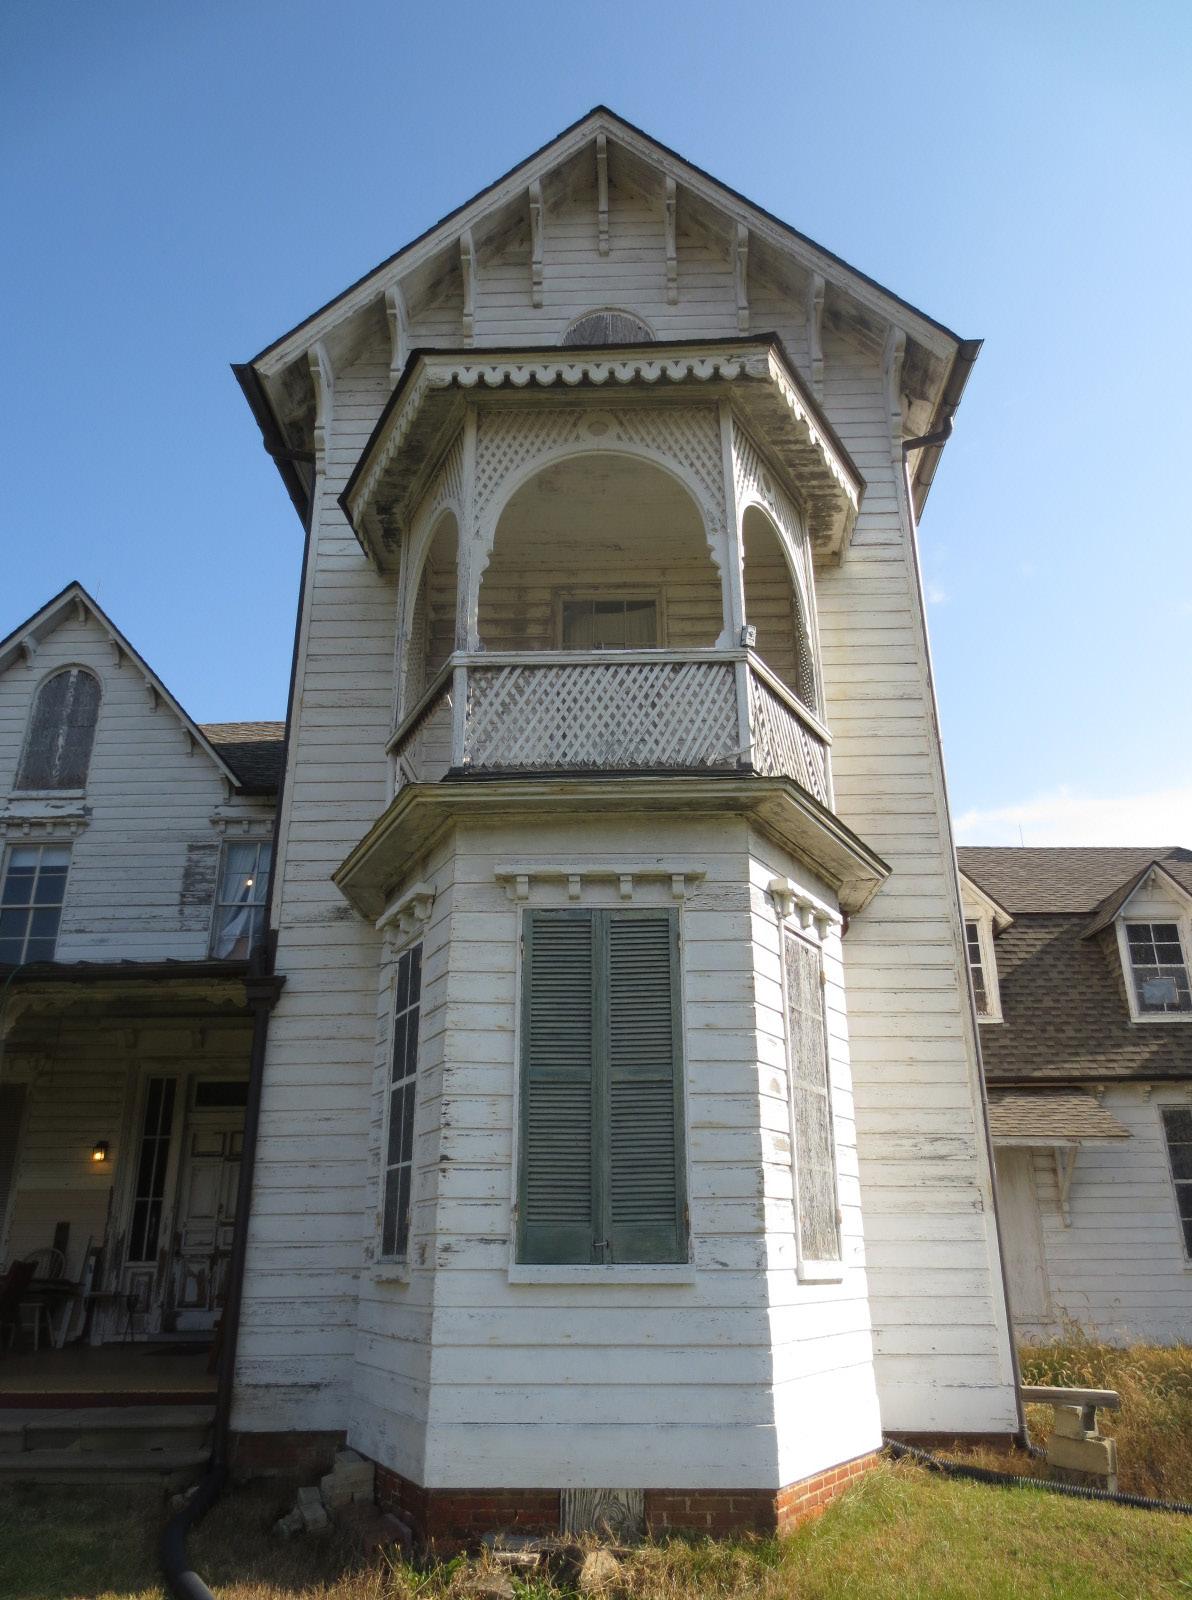
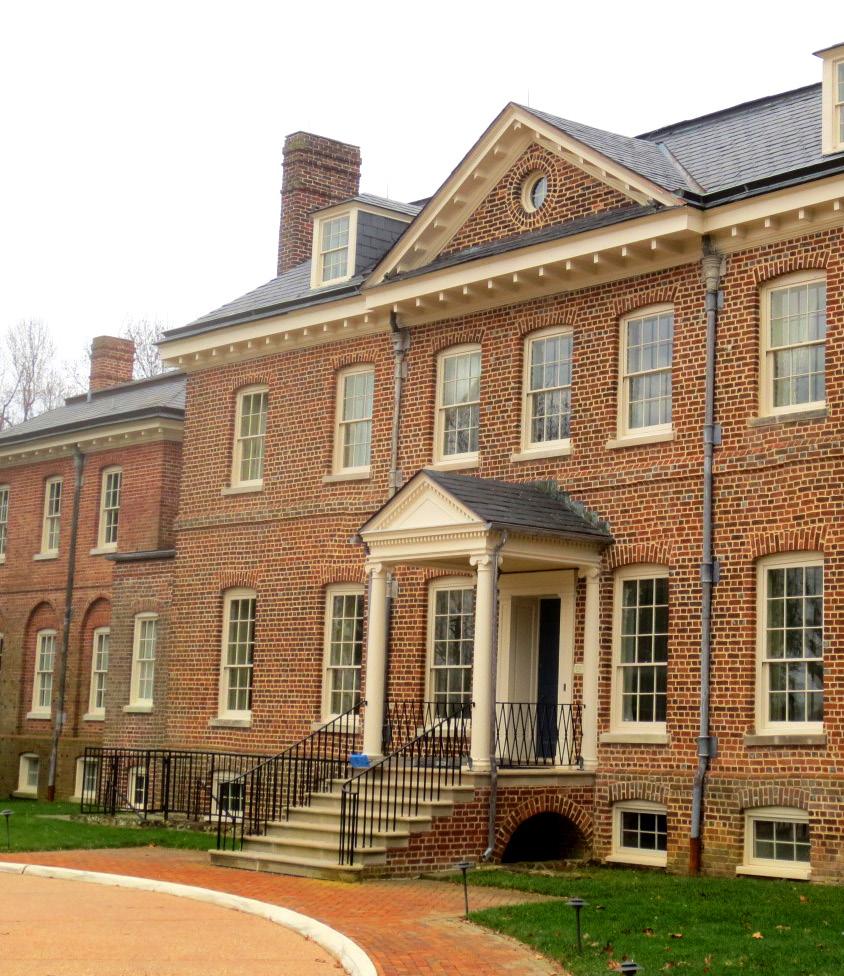
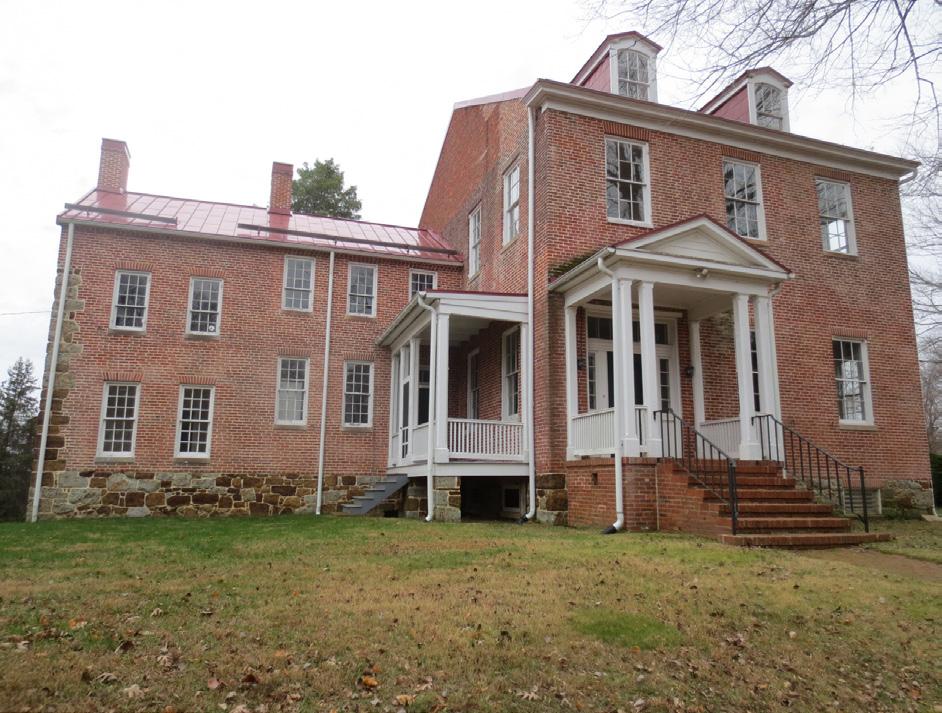
COMMUNITY HERITAGE, CULTURE, AND DESIGN
Plan 2035 prioritizes sense of place and design as key elements in planning throughout the County and outlines a broad set of urban design guidelines to maximize the vitality of neighborhoods and streets. The plan notes that pursuing and maintaining historic and cultural preservation designations can be time- and resourceintensive. Noting the importance of the County’s many historic communities and structures to place-based identity and character, the plan urges greater attention to preserving historic character and prioritizing adaptive reuse of historic buildings. Plan 2035 names the establishment of arts and cultural districts as an opportunity to promote economic development, with the Gateway Arts District as an example of such a district that has sparked revitalization in the US 1 Corridor.
This report identifies existing centers of culture and outlines the planning considerations associated with historic sites, roadways, and easements. The report explores the potential of seeking an arts and entertainment district designation at the state level within the master plan area, which currently does not include such a district.
KEY QUESTIONS
• What are the treasured cultural and historic sites and features of Bowie-Mitchellville and Vicinity?
• How can future planning efforts uphold and enhance the unique character of Bowie-Mitchellville and Vicinity?
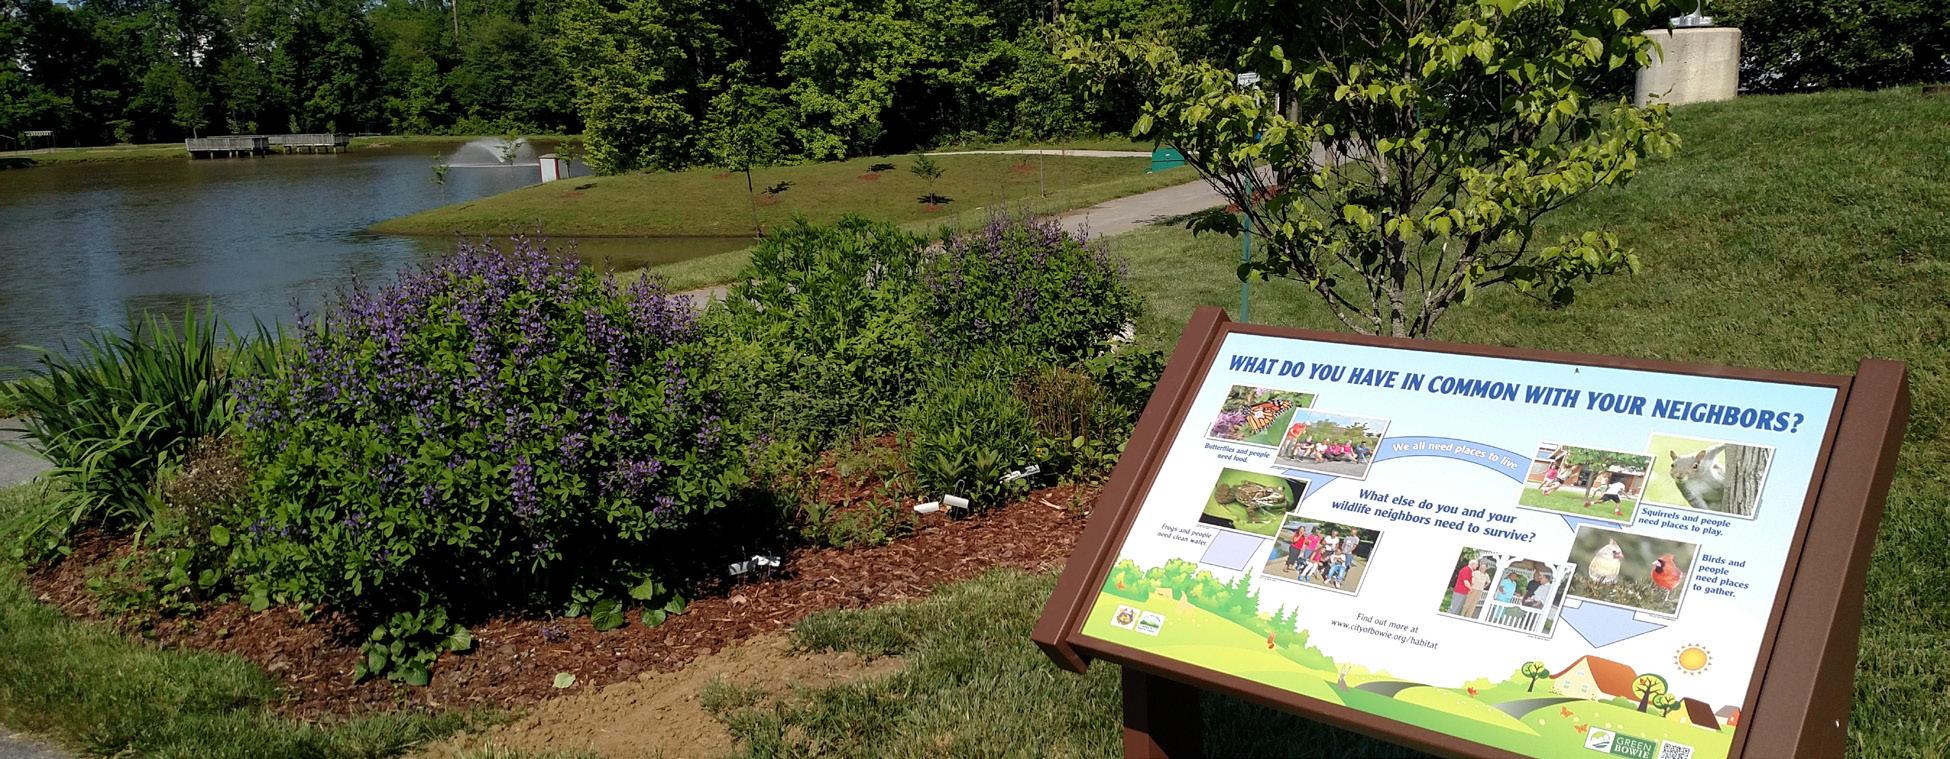
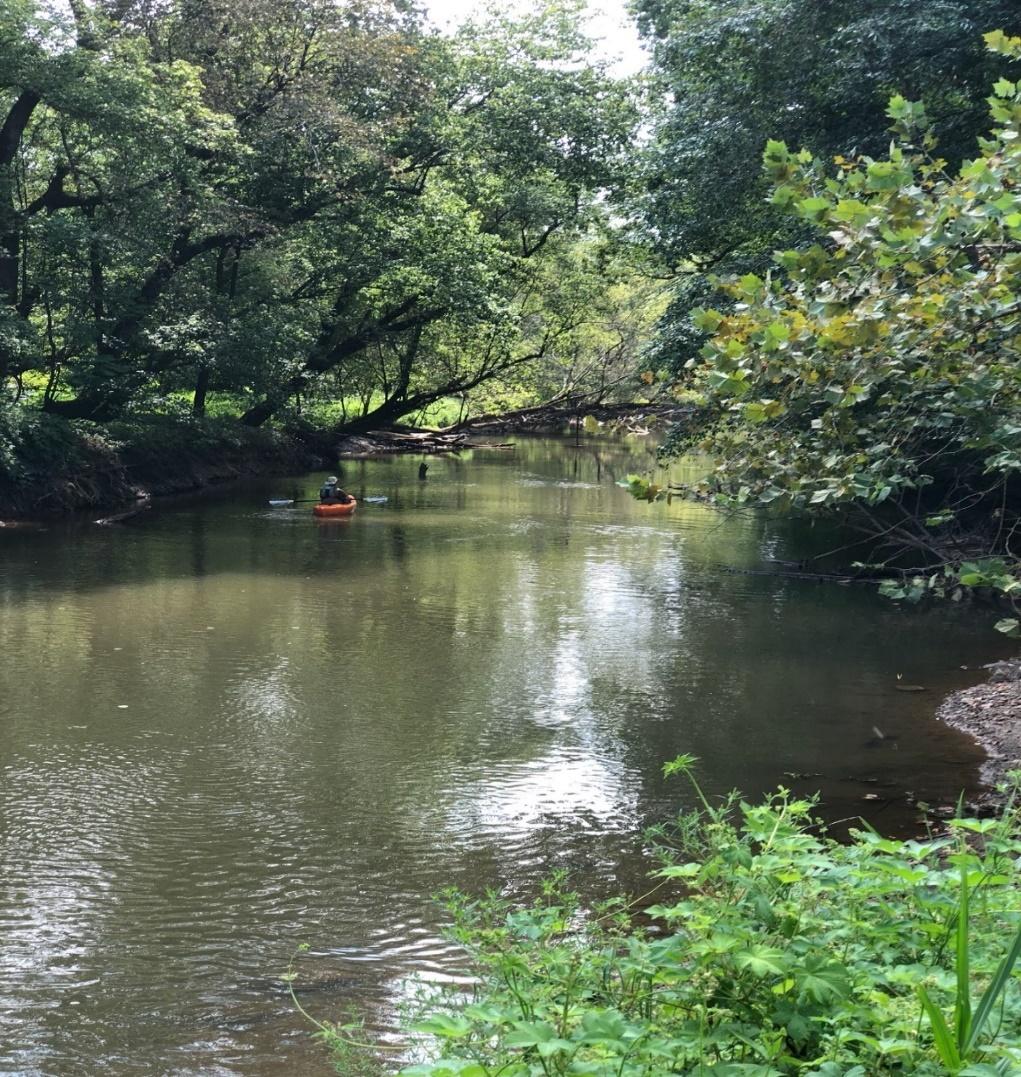
HEALTHY COMMUNITIES
Plan 2035 stresses the importance of promoting residents’ health by increasing walkability and access to recreational space and considering food-systems and medical services as vital components of community well-being. The County faces a variety of challenges related to promoting resident health, including a planning history of local centers designed around the automobile, and how to retrofit older communities for pedestrian, bicycle, or public transit access. The County also has a high number of uninsured residents and the plan cites this as one challenge that strains the County’s medical systems.
One opportunity noted in the plan, and germane to the master plan area, is the benefit of the local agricultural sector and the potential for newer agricultural approaches such as community gardens, vertical farms, and food forests, which should be leveraged both to
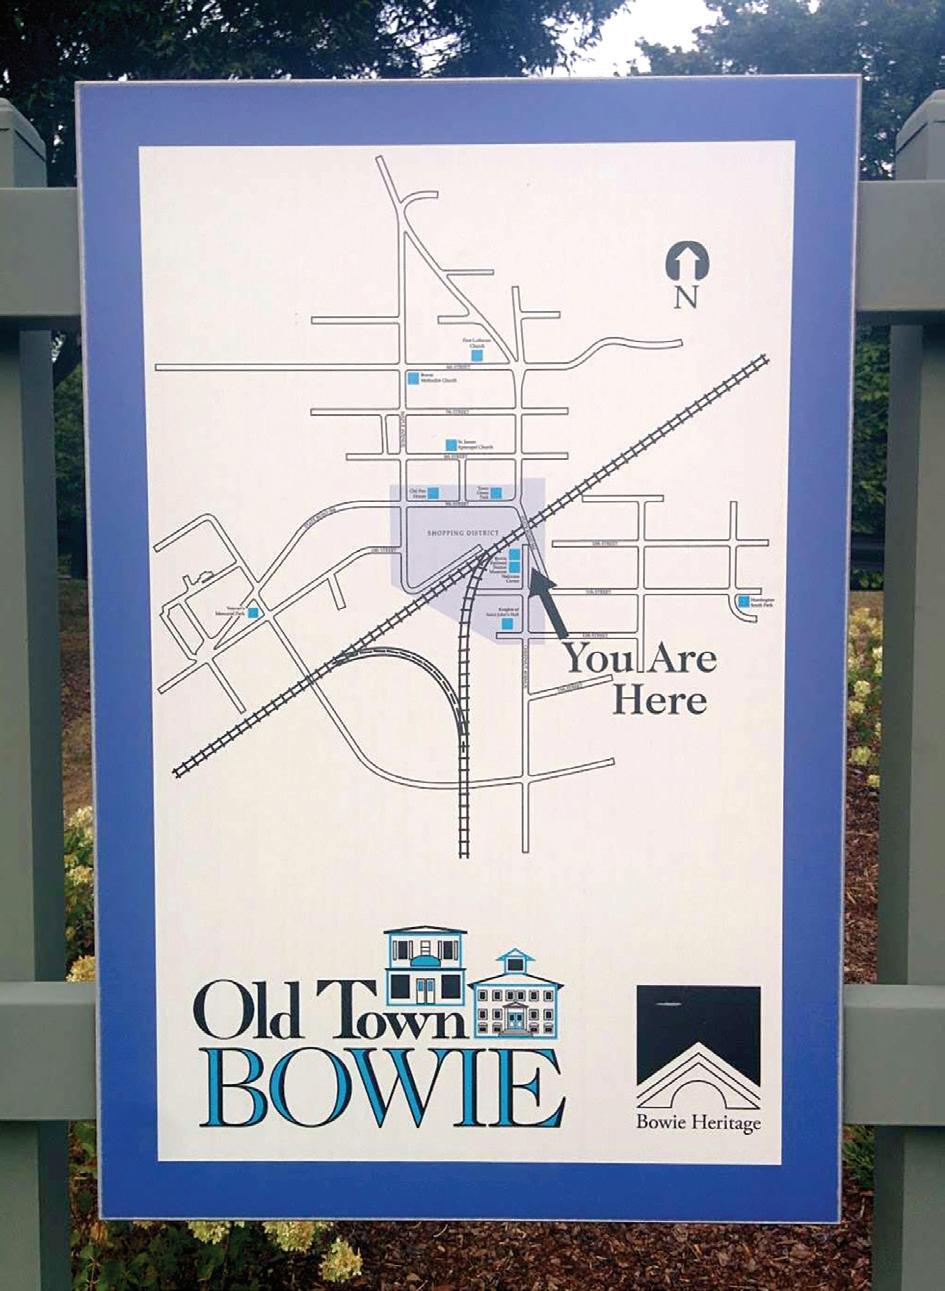
Source: M-NCPPC.
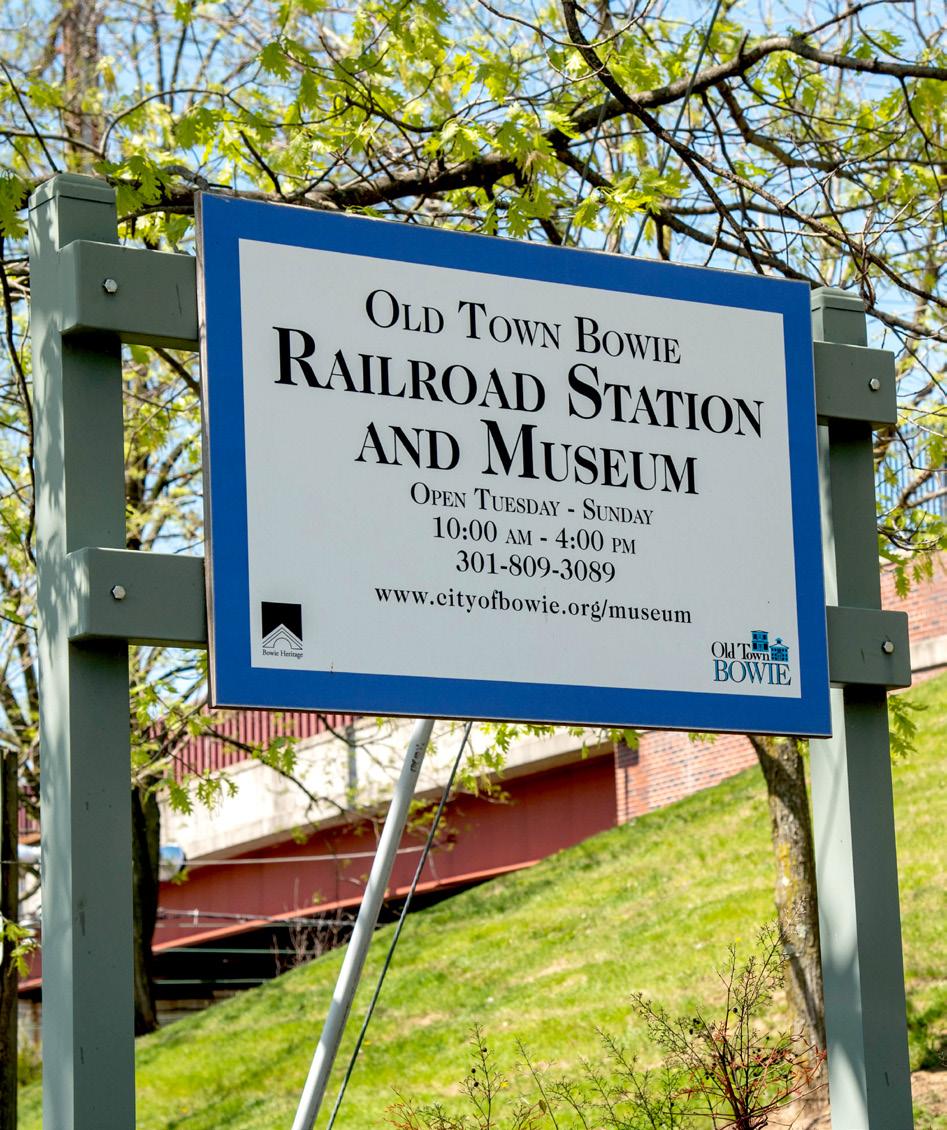
Wayfinding sign in Old Town Bowie
How can the master plan area ensure the health and sustainability of its communities, now and in the future?
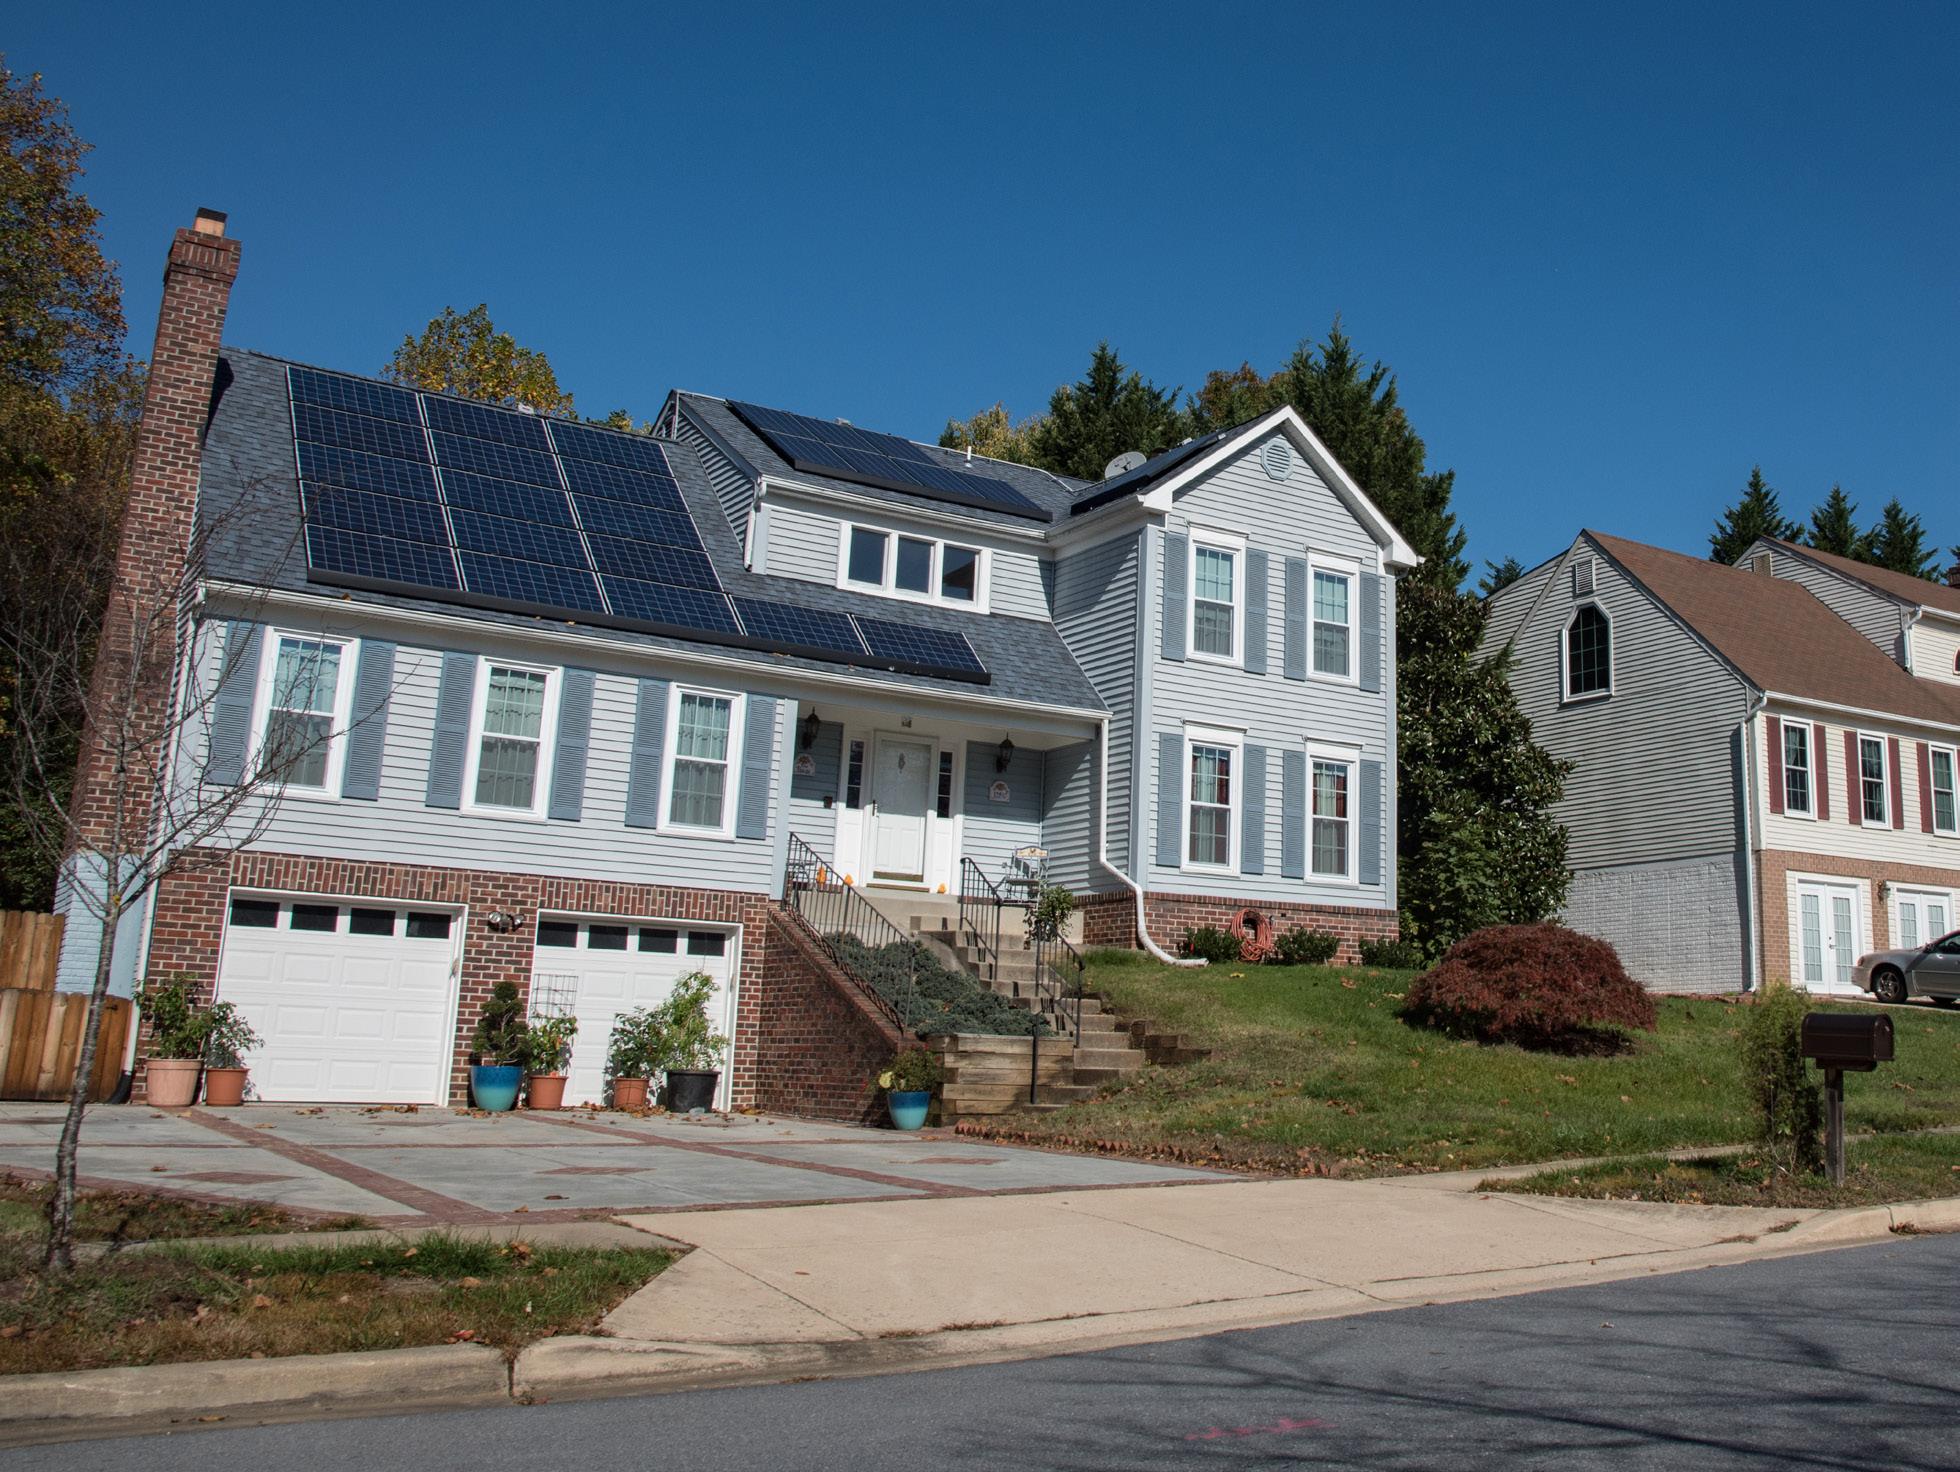
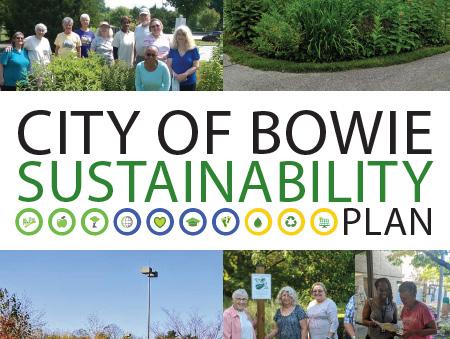
increase the supply of local fresh foods, and stimulate job and training opportunities for residents. Another opportunity is that of public-private partnerships that can incentivize alignment between sectors toward shared goals of community health, wellness, and food access. This report analyzes community health in the master plan area through an analysis of green space access, healthcare facilities access, and the local food system. Connected to this element is the importance of the environment as a source of hazard and health; in Plan 2035 and in this report, environmental sustainability and green infrastructure are part of the strategy of promoting public health. This section of the report also encompasses environmental analyses that line up with the Plan 2035 natural environment element, such as an analysis of existing sustainability programs in the master plan area, including LEED certified structures, recycling programs, and renewable energy. This report also looks to the 2016 City of Bowie Sustainability Plan for guidance about recent efforts and opportunities related to healthy and sustainable communities in the City of Bowie.
KEY QUESTIONS
• What are the greatest assets and barriers to community health in Bowie-Mitchellville and Vicinity?
• How can the master plan area ensure the health and sustainability of its communities, now and in the future—including through active transportation, food and healthcare access, and promoting access to green space?
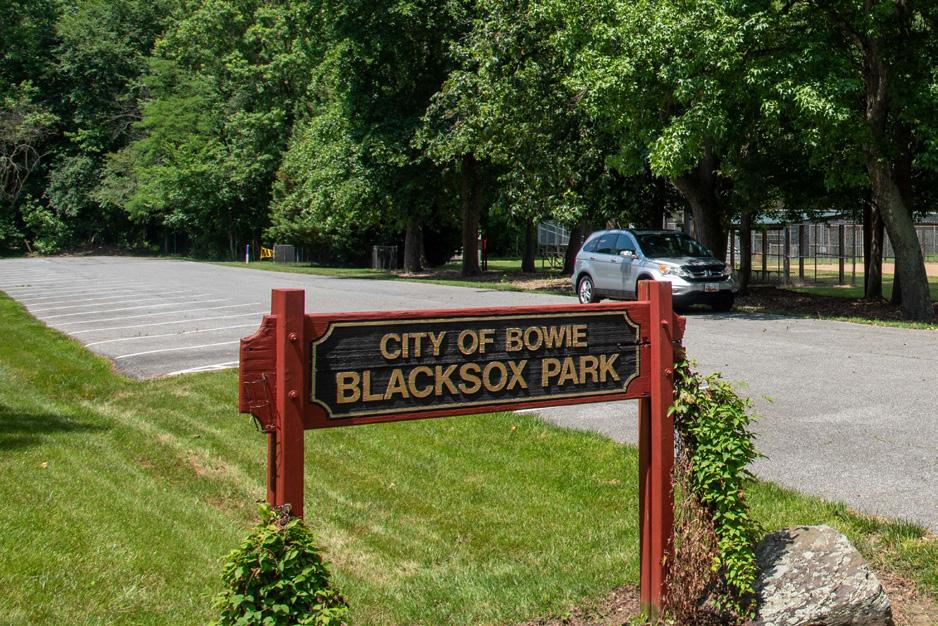
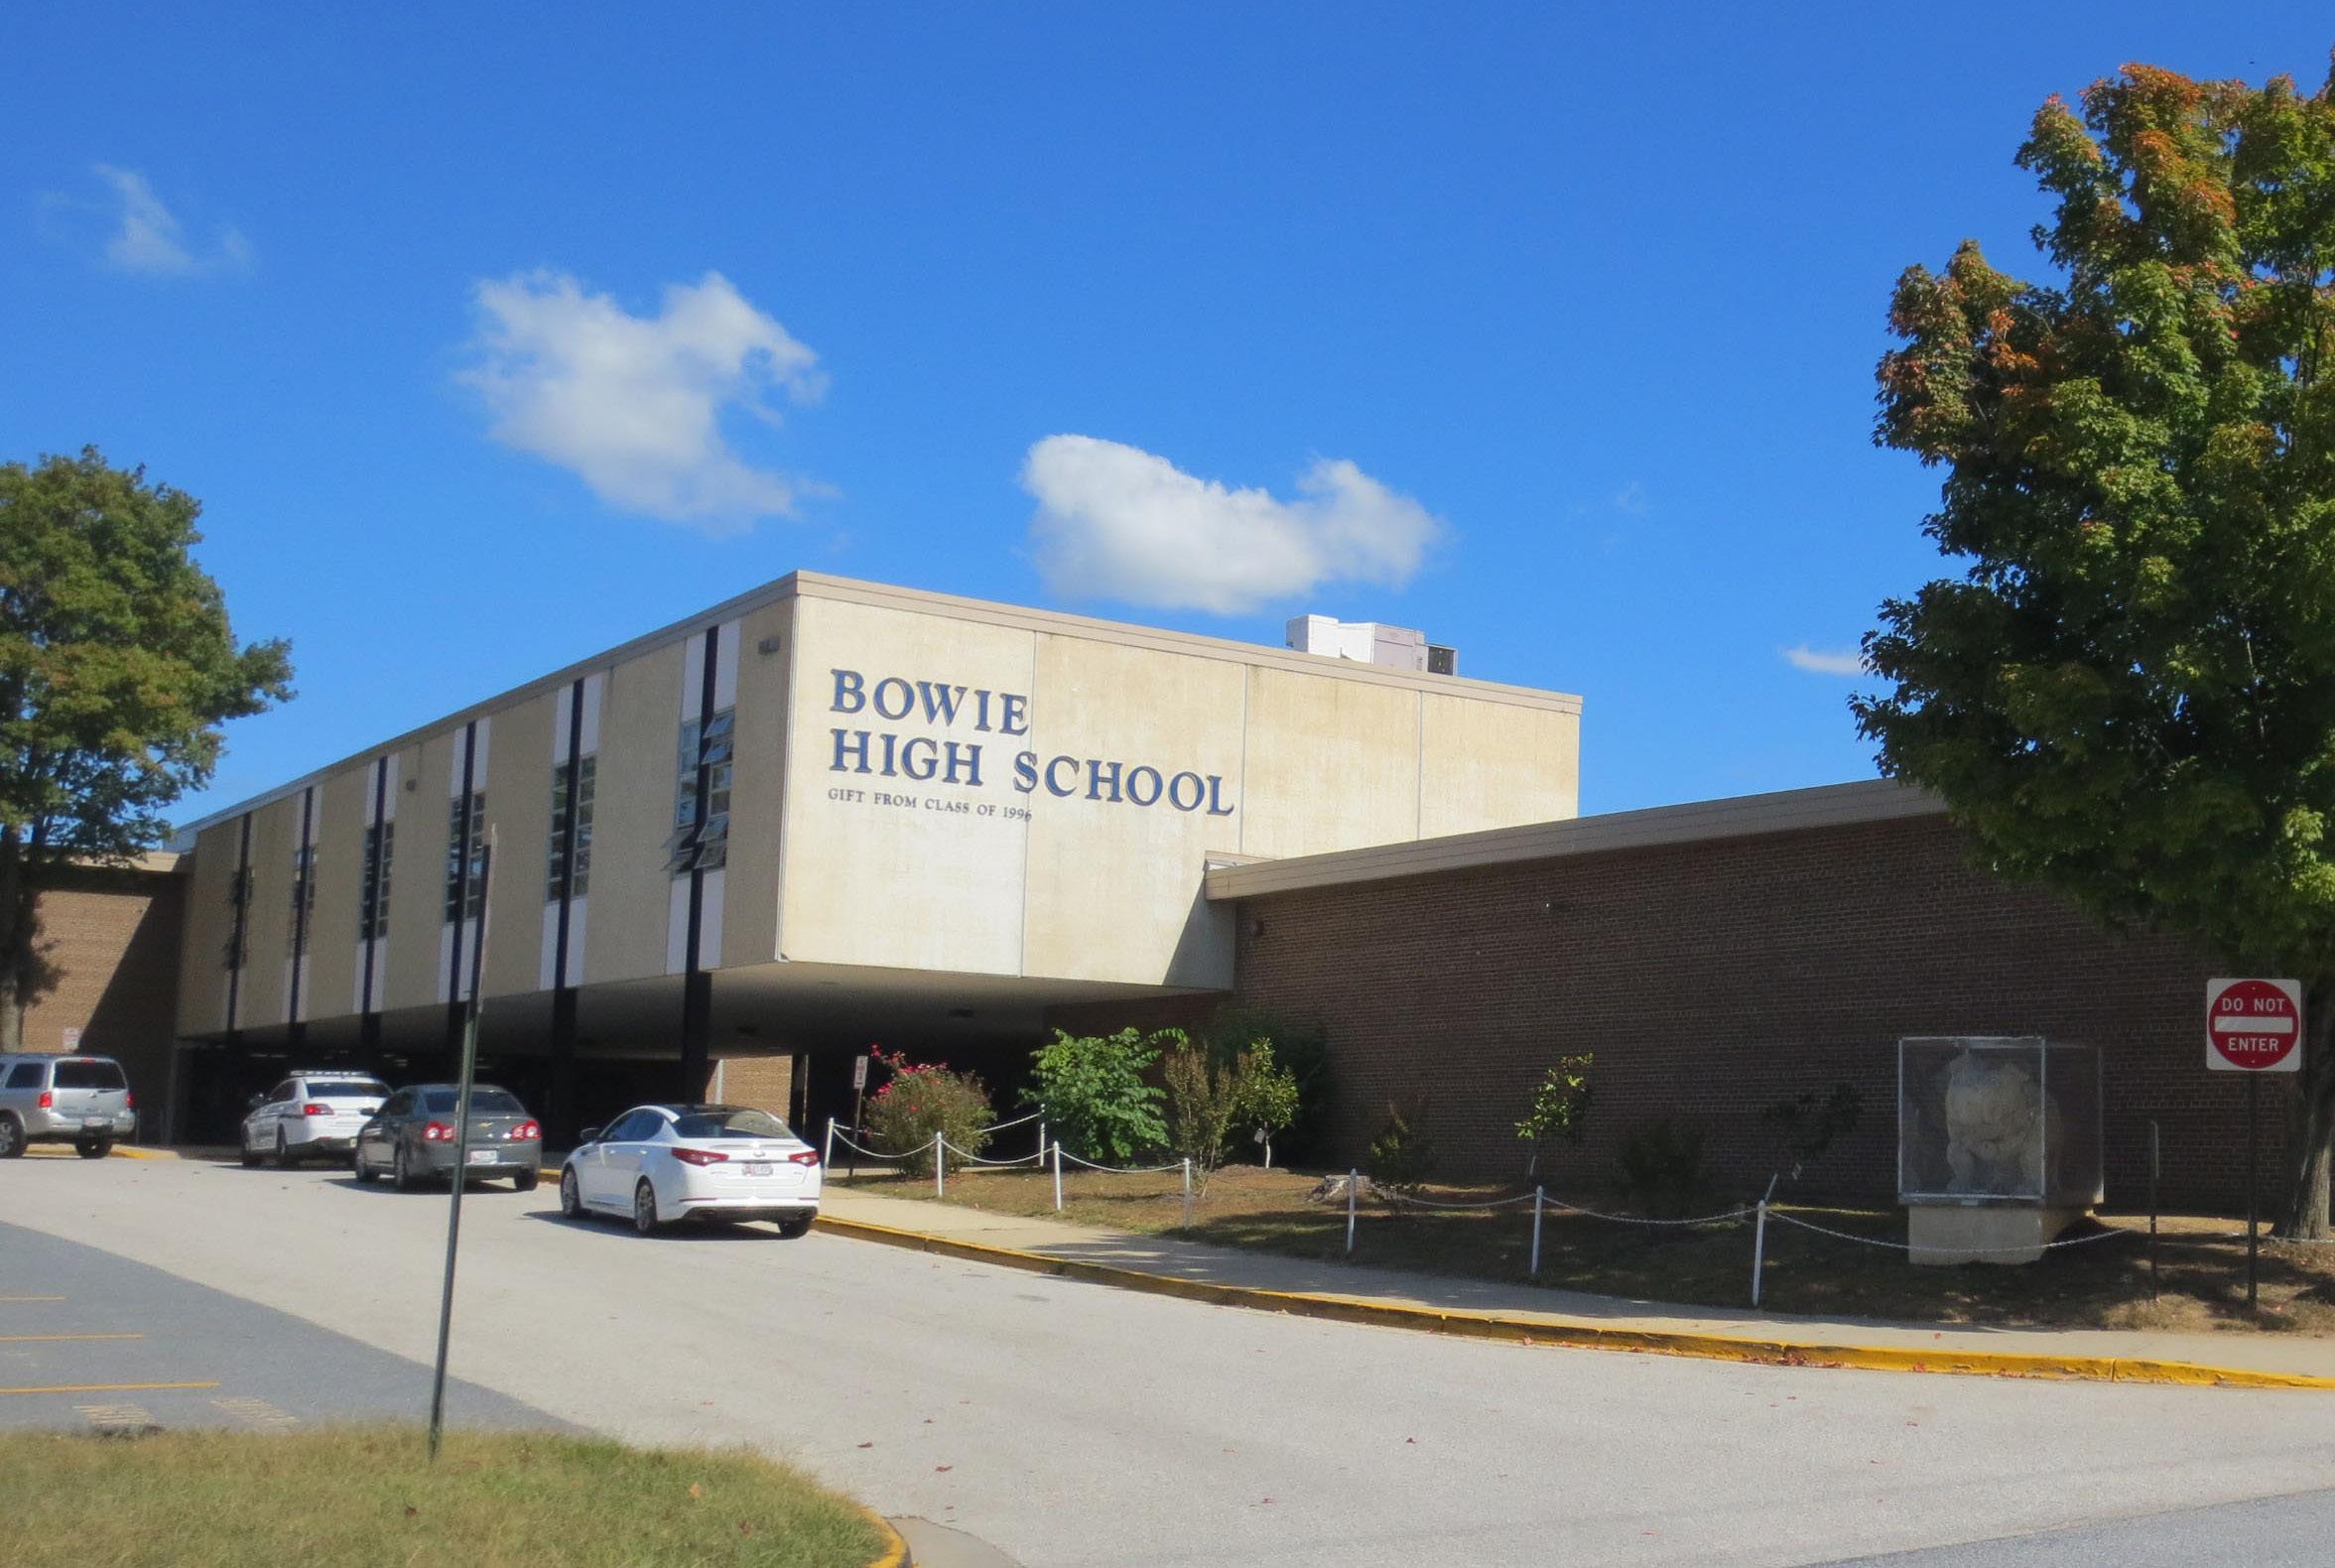
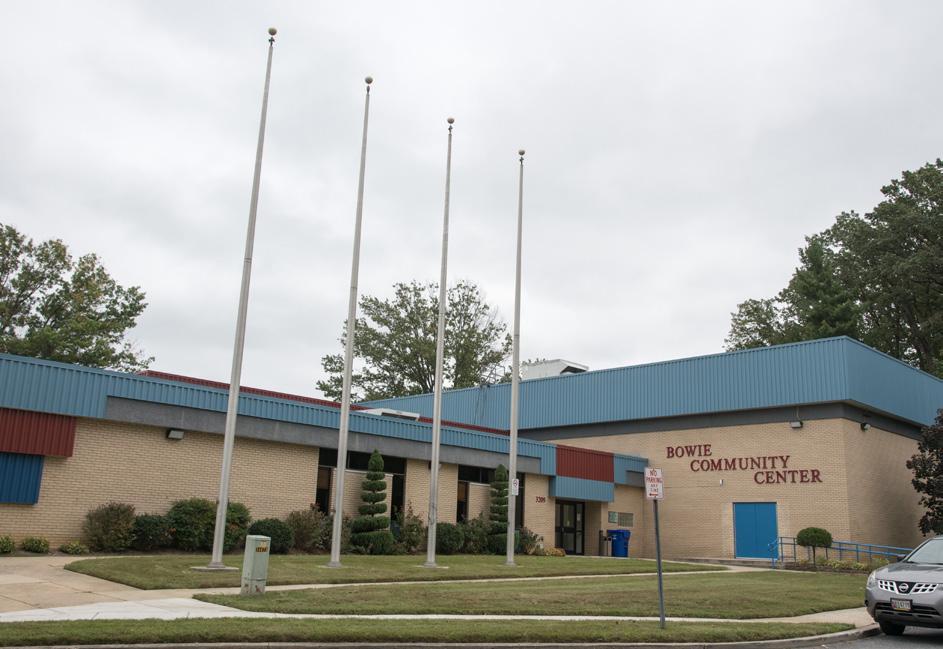
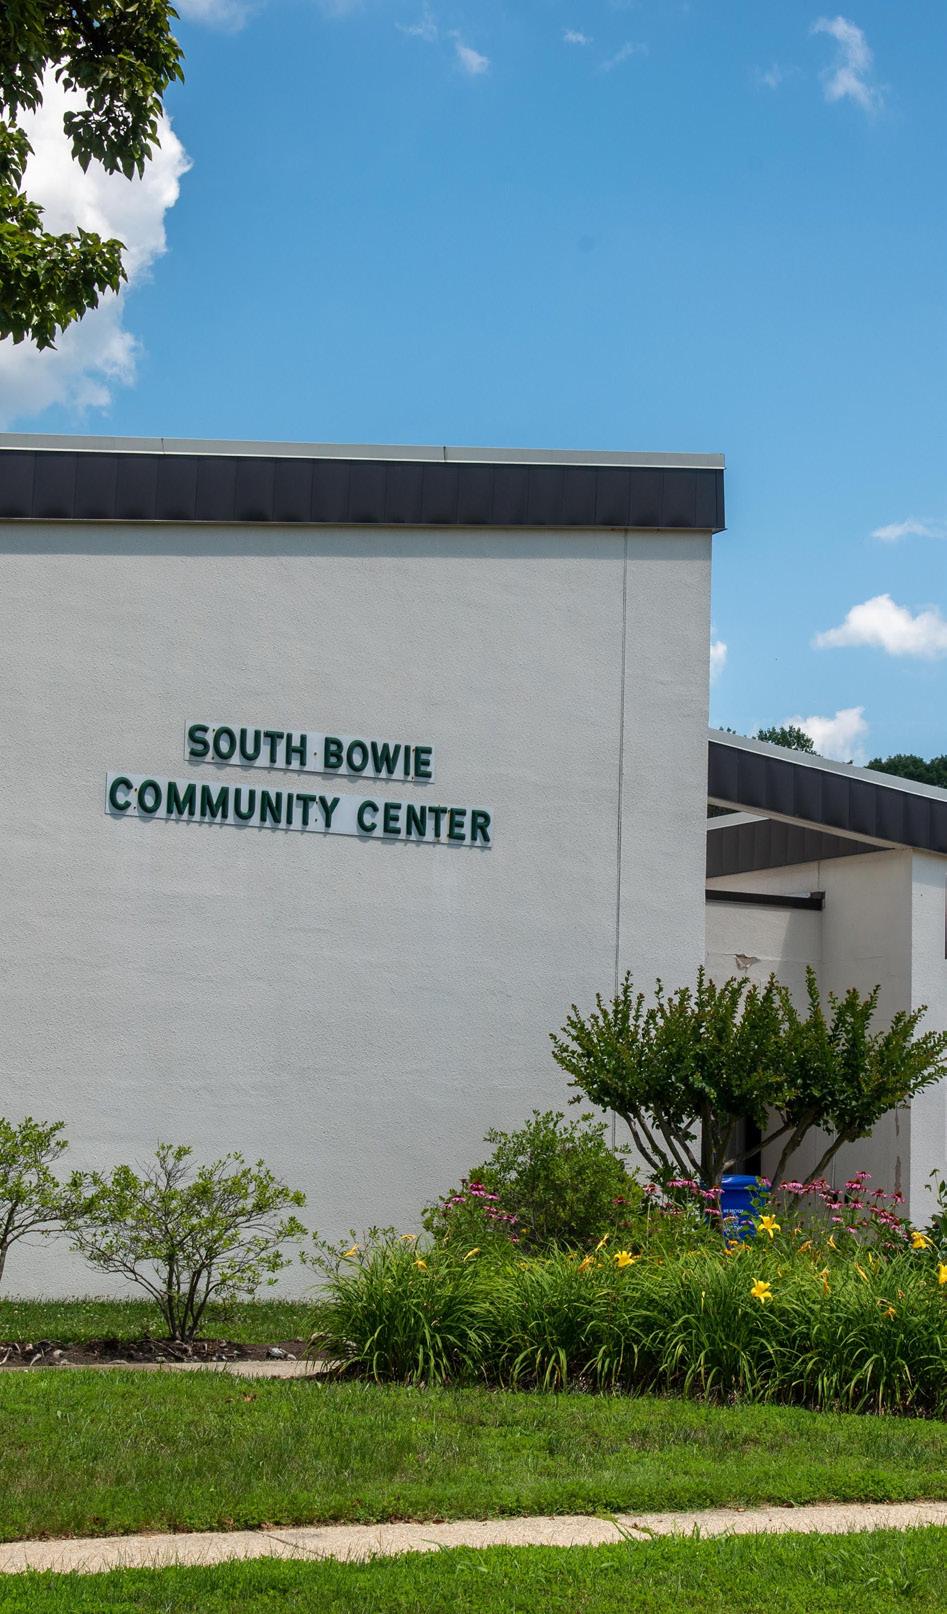
PUBLIC FACILITIES
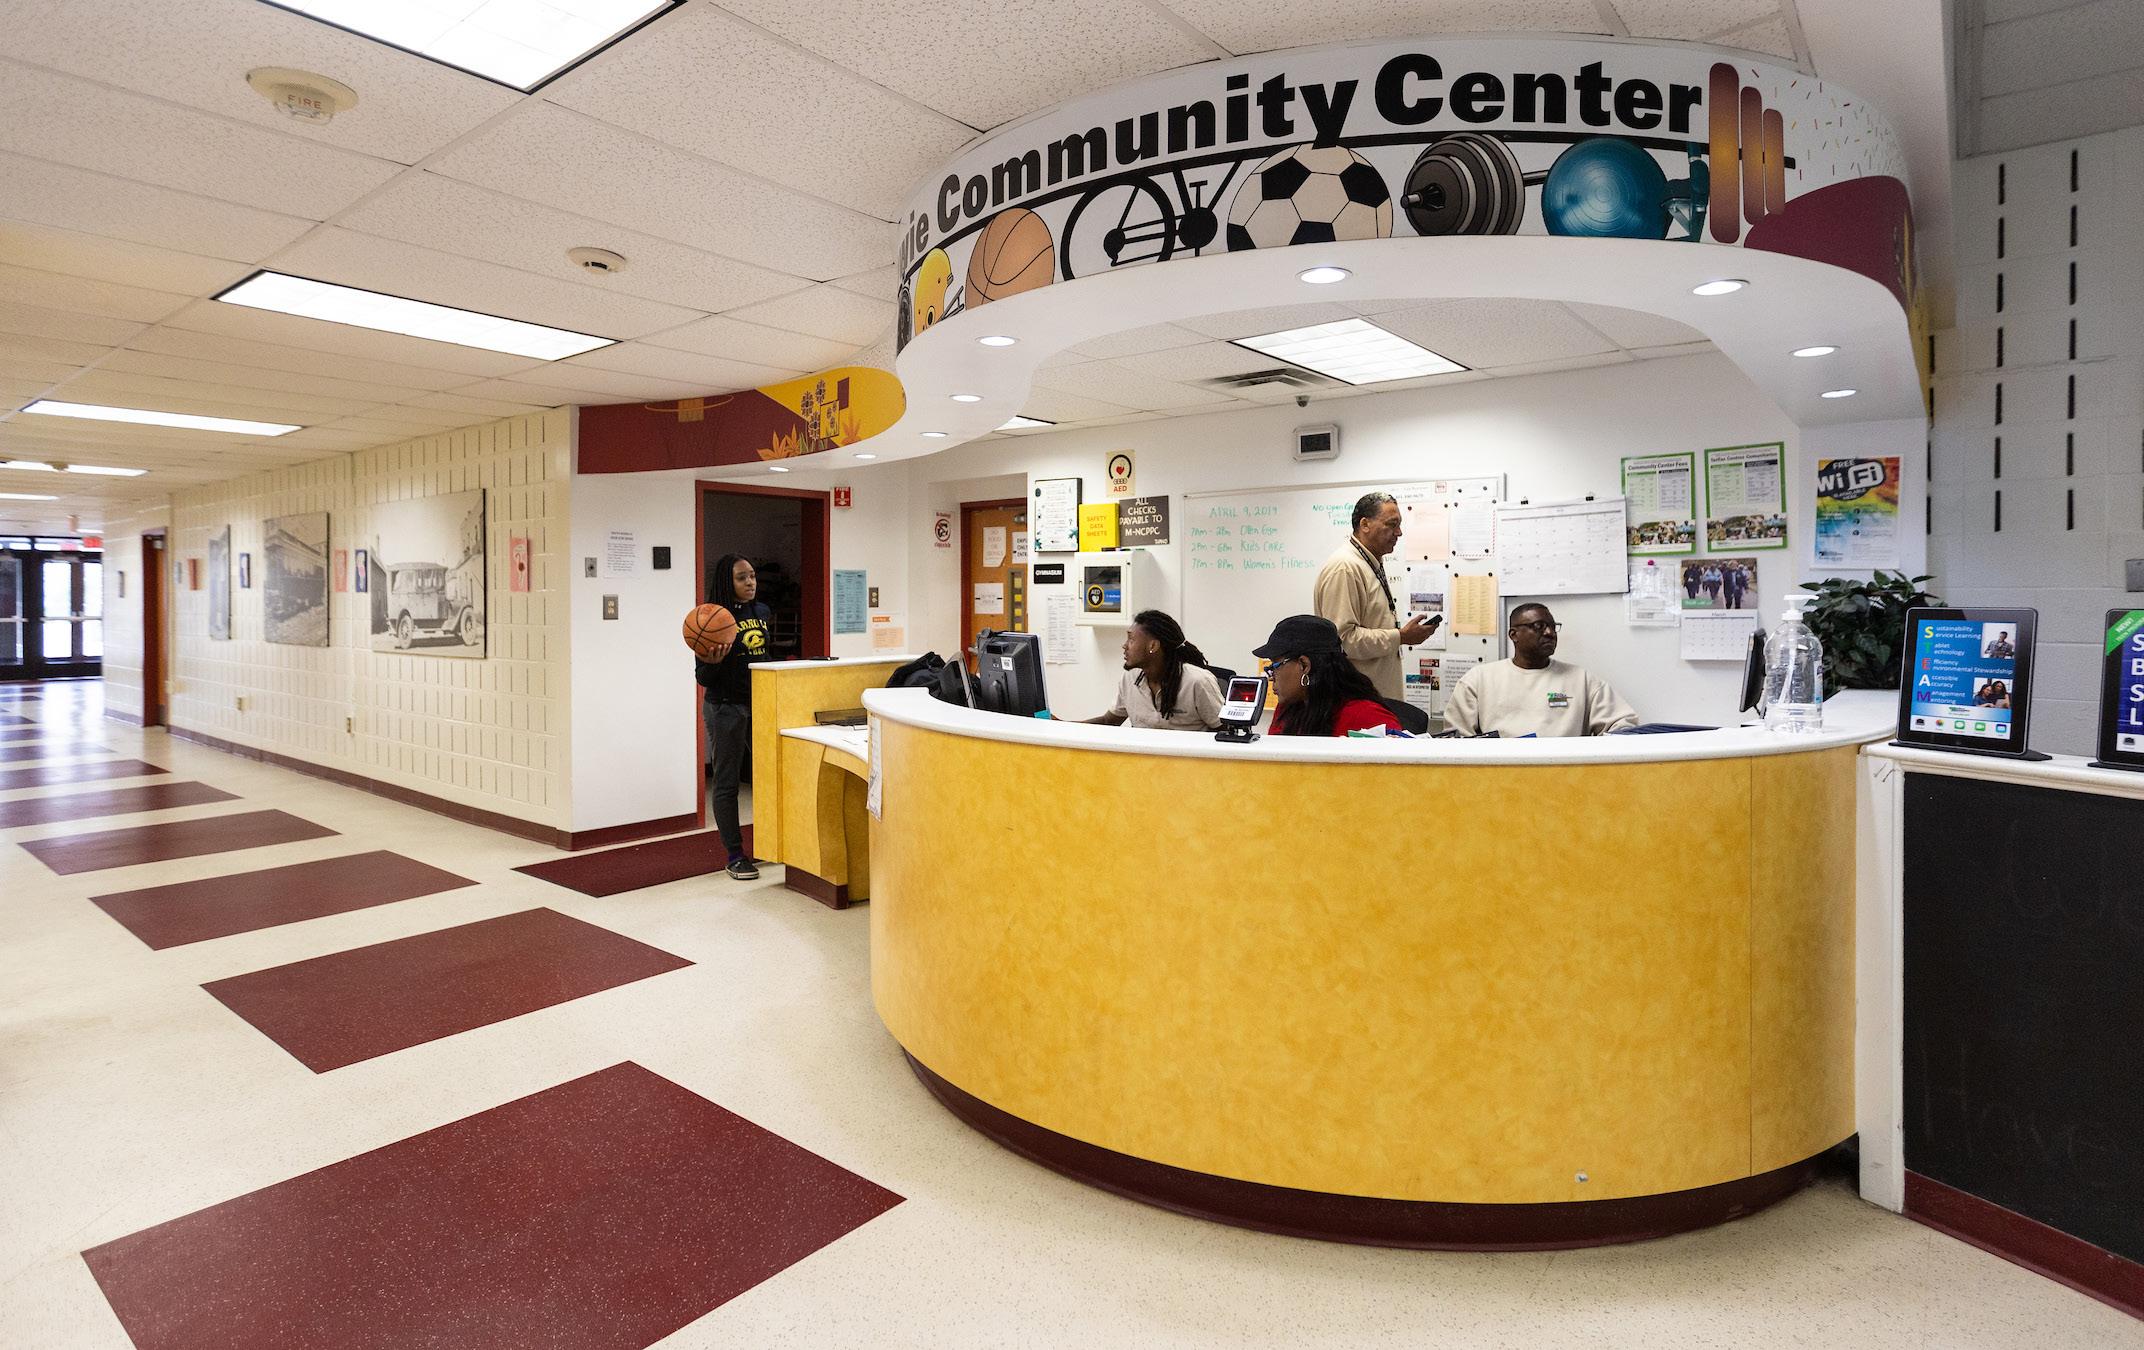
Plan 2035 emphasizes the importance of ensuring that access to public facilities is equitable, and that these facilities are equipped to meet the needs of a growing population. Prince George’s County faces aging public infrastructure and increasing fiscal constraints to the provision of public services and programs. The County’s history of sprawling development has strained the County’s resources and abilities to provide quality public facilities and services. As such, the plan notes that reducing sprawl will help to alleviate challenges related to public facilities. Another opportunity related to public facilities is that of sparking neighborhood revitalization through the construction or renovation of public facilities such as community centers and schools. The County urges thoughtfulness about design, equity, and public access regarding existing and future public facilities.
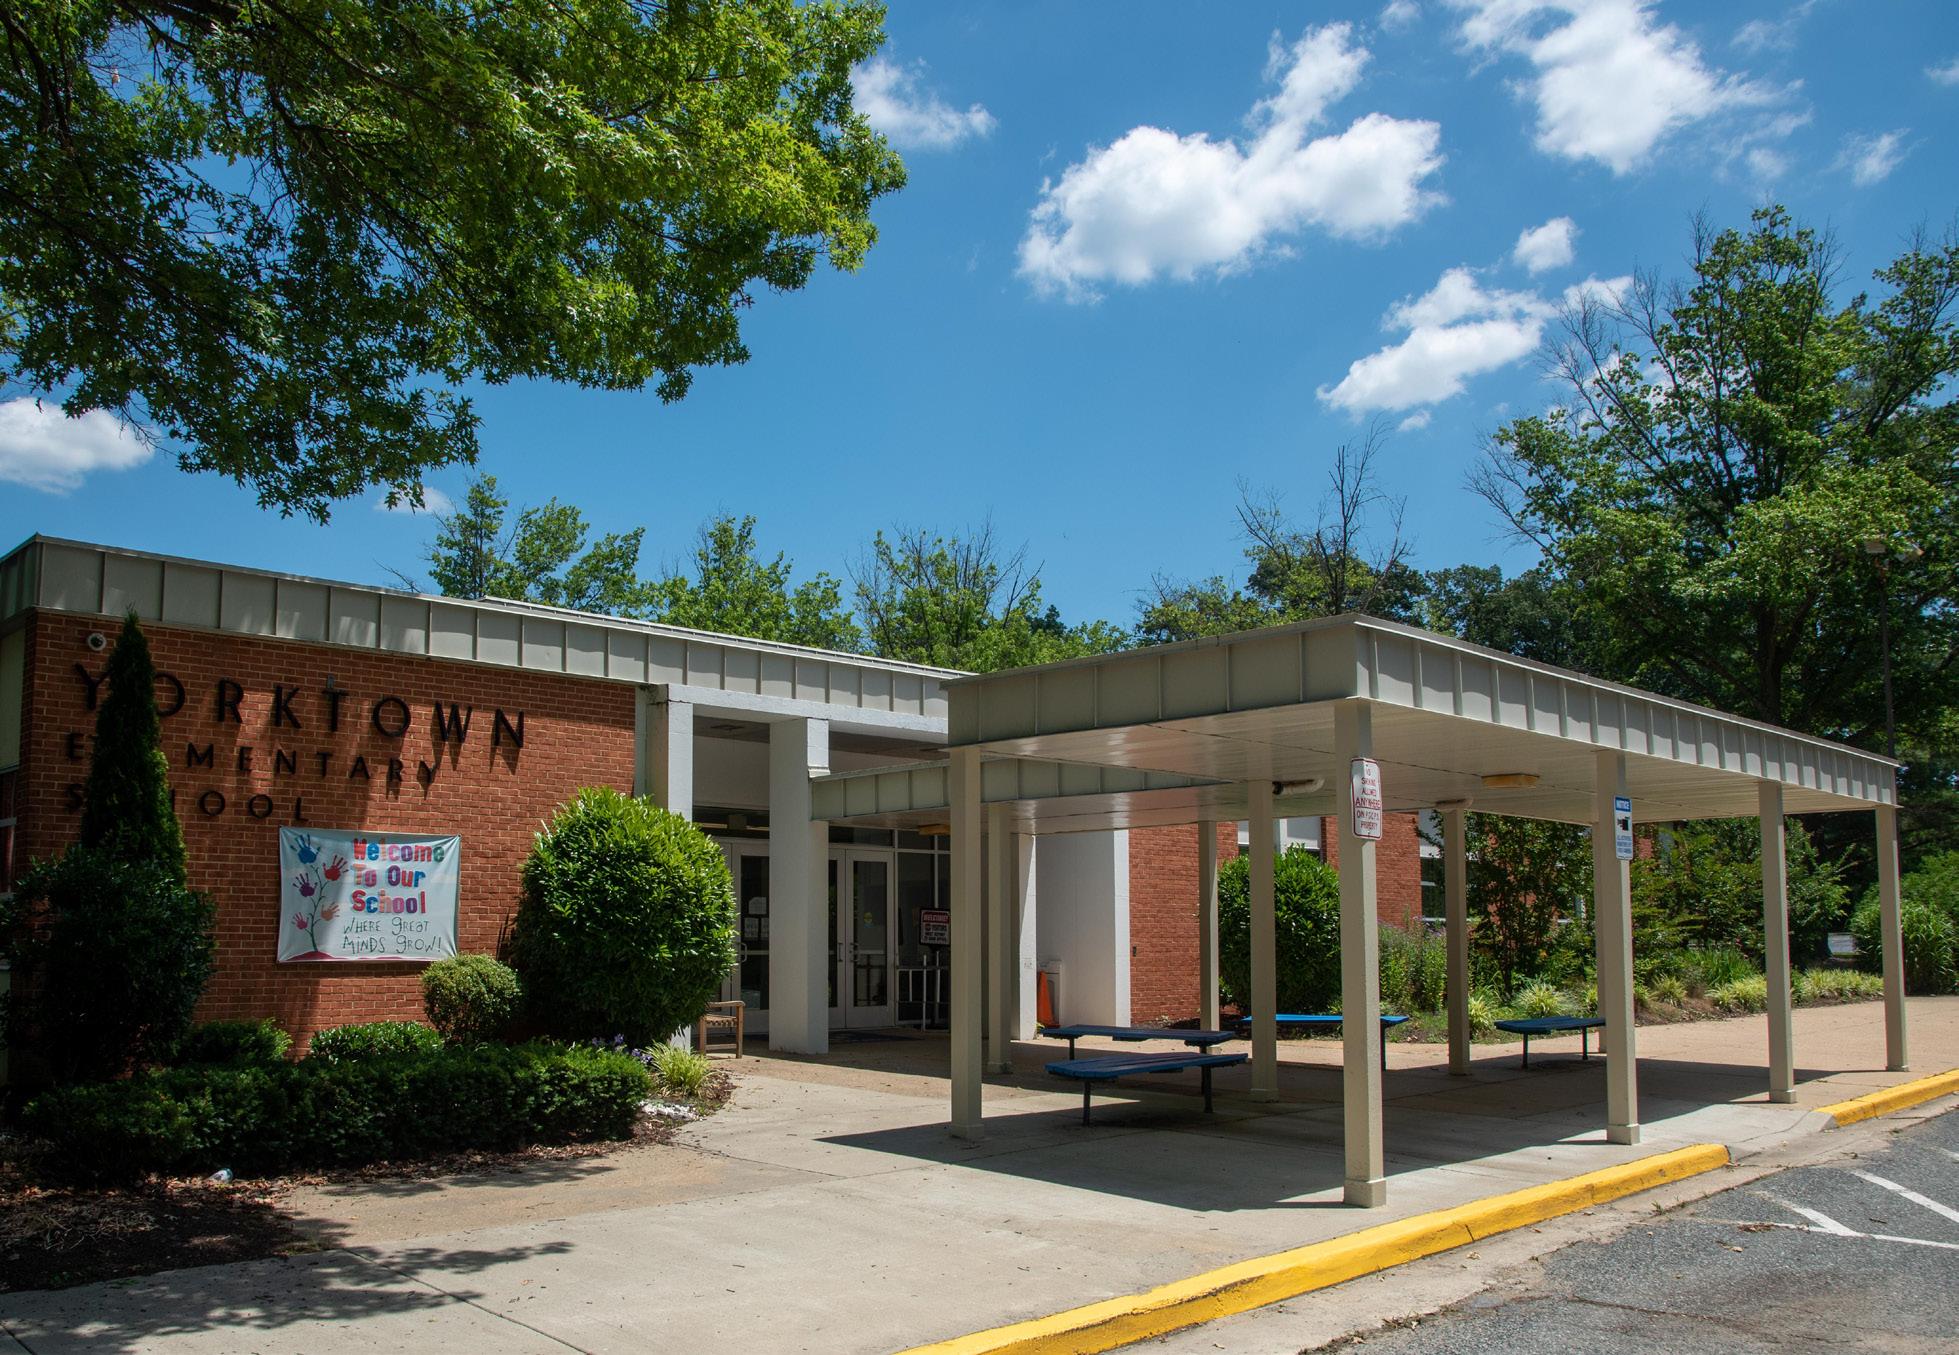
This report assesses public facilities with a focus on community infrastructure, including schools, libraries, community centers, and emergency responders. Through analysis, this report seeks to characterize the current service provided by these facilities, and the challenges and opportunities presented for public facilities as the master plan area continues to develop.
KEY QUESTIONS
• What are the public facilities that serve master plan area residents today?
• What are the challenges and opportunities to ensuring that future populations are served by these facilities?
Source: M-NCPPC.
Prince George’s
4. Focus Areas and Key Corridors
Map
Focus Areas
This report focuses on a set of key corridors and focus areas in the master plan area, in order to meaningfully profile the current conditions, and develop responsive strategies tailored to these core planning units. Corridors and focus areas have been an integral part of County planning efforts since the 2002 Prince George’s County Approved General Plan (2002 General Plan), in which a system based around growth corridors and concentrated nodes of development was selected as the general planning framework for the County.7
Plan 2035 builds upon this framework and attempts to correct the patterns of development that have run contrary to the goals of the 2002 General Plan— notably, that the majority of development in the County between 2002 and 2014 had “occurred in suburban locations outside the Capital Beltway and outside of designated growth centers and corridors.”8
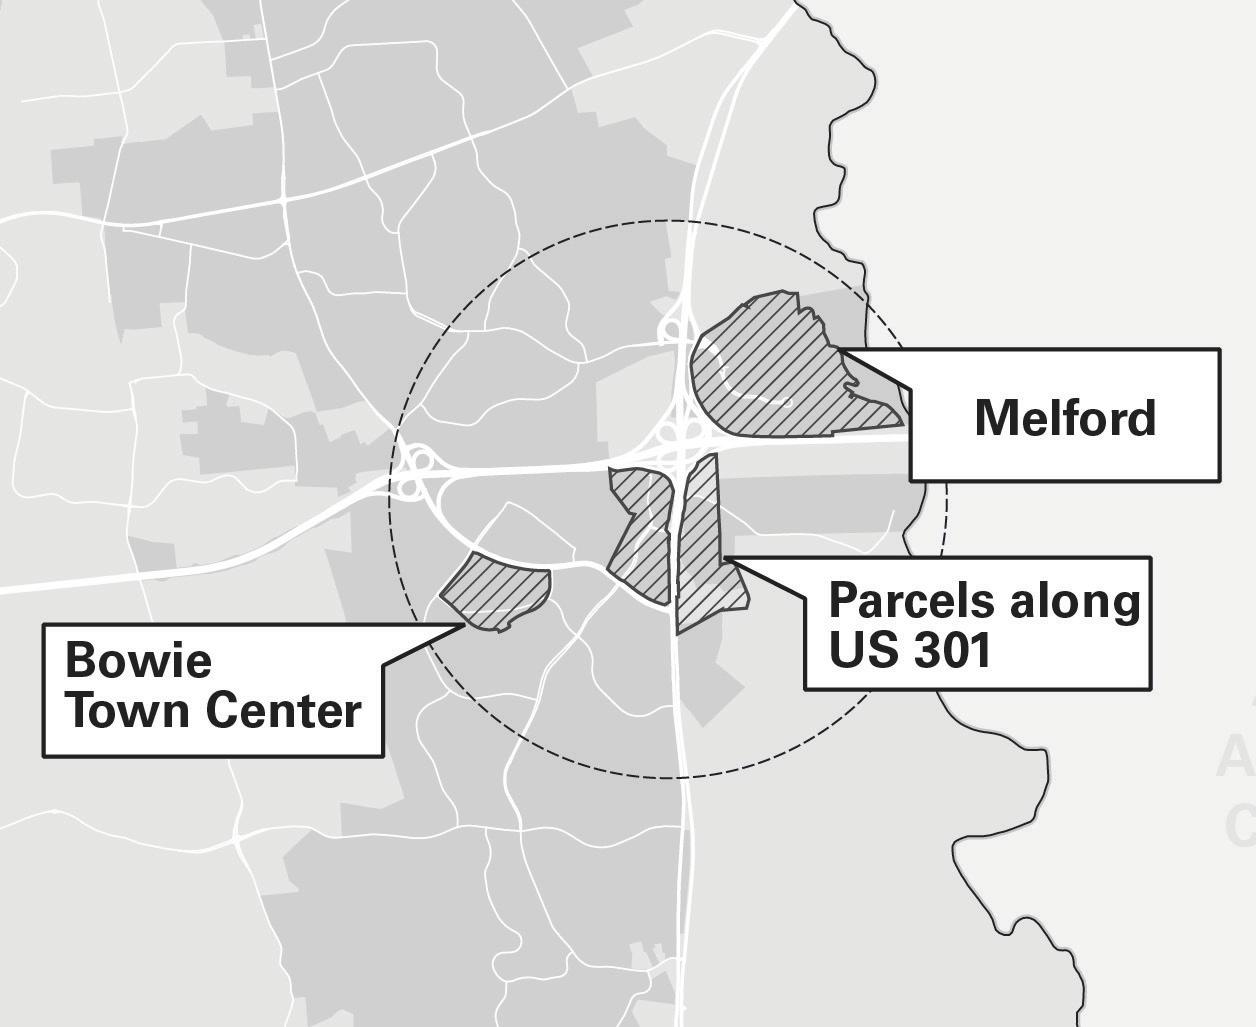
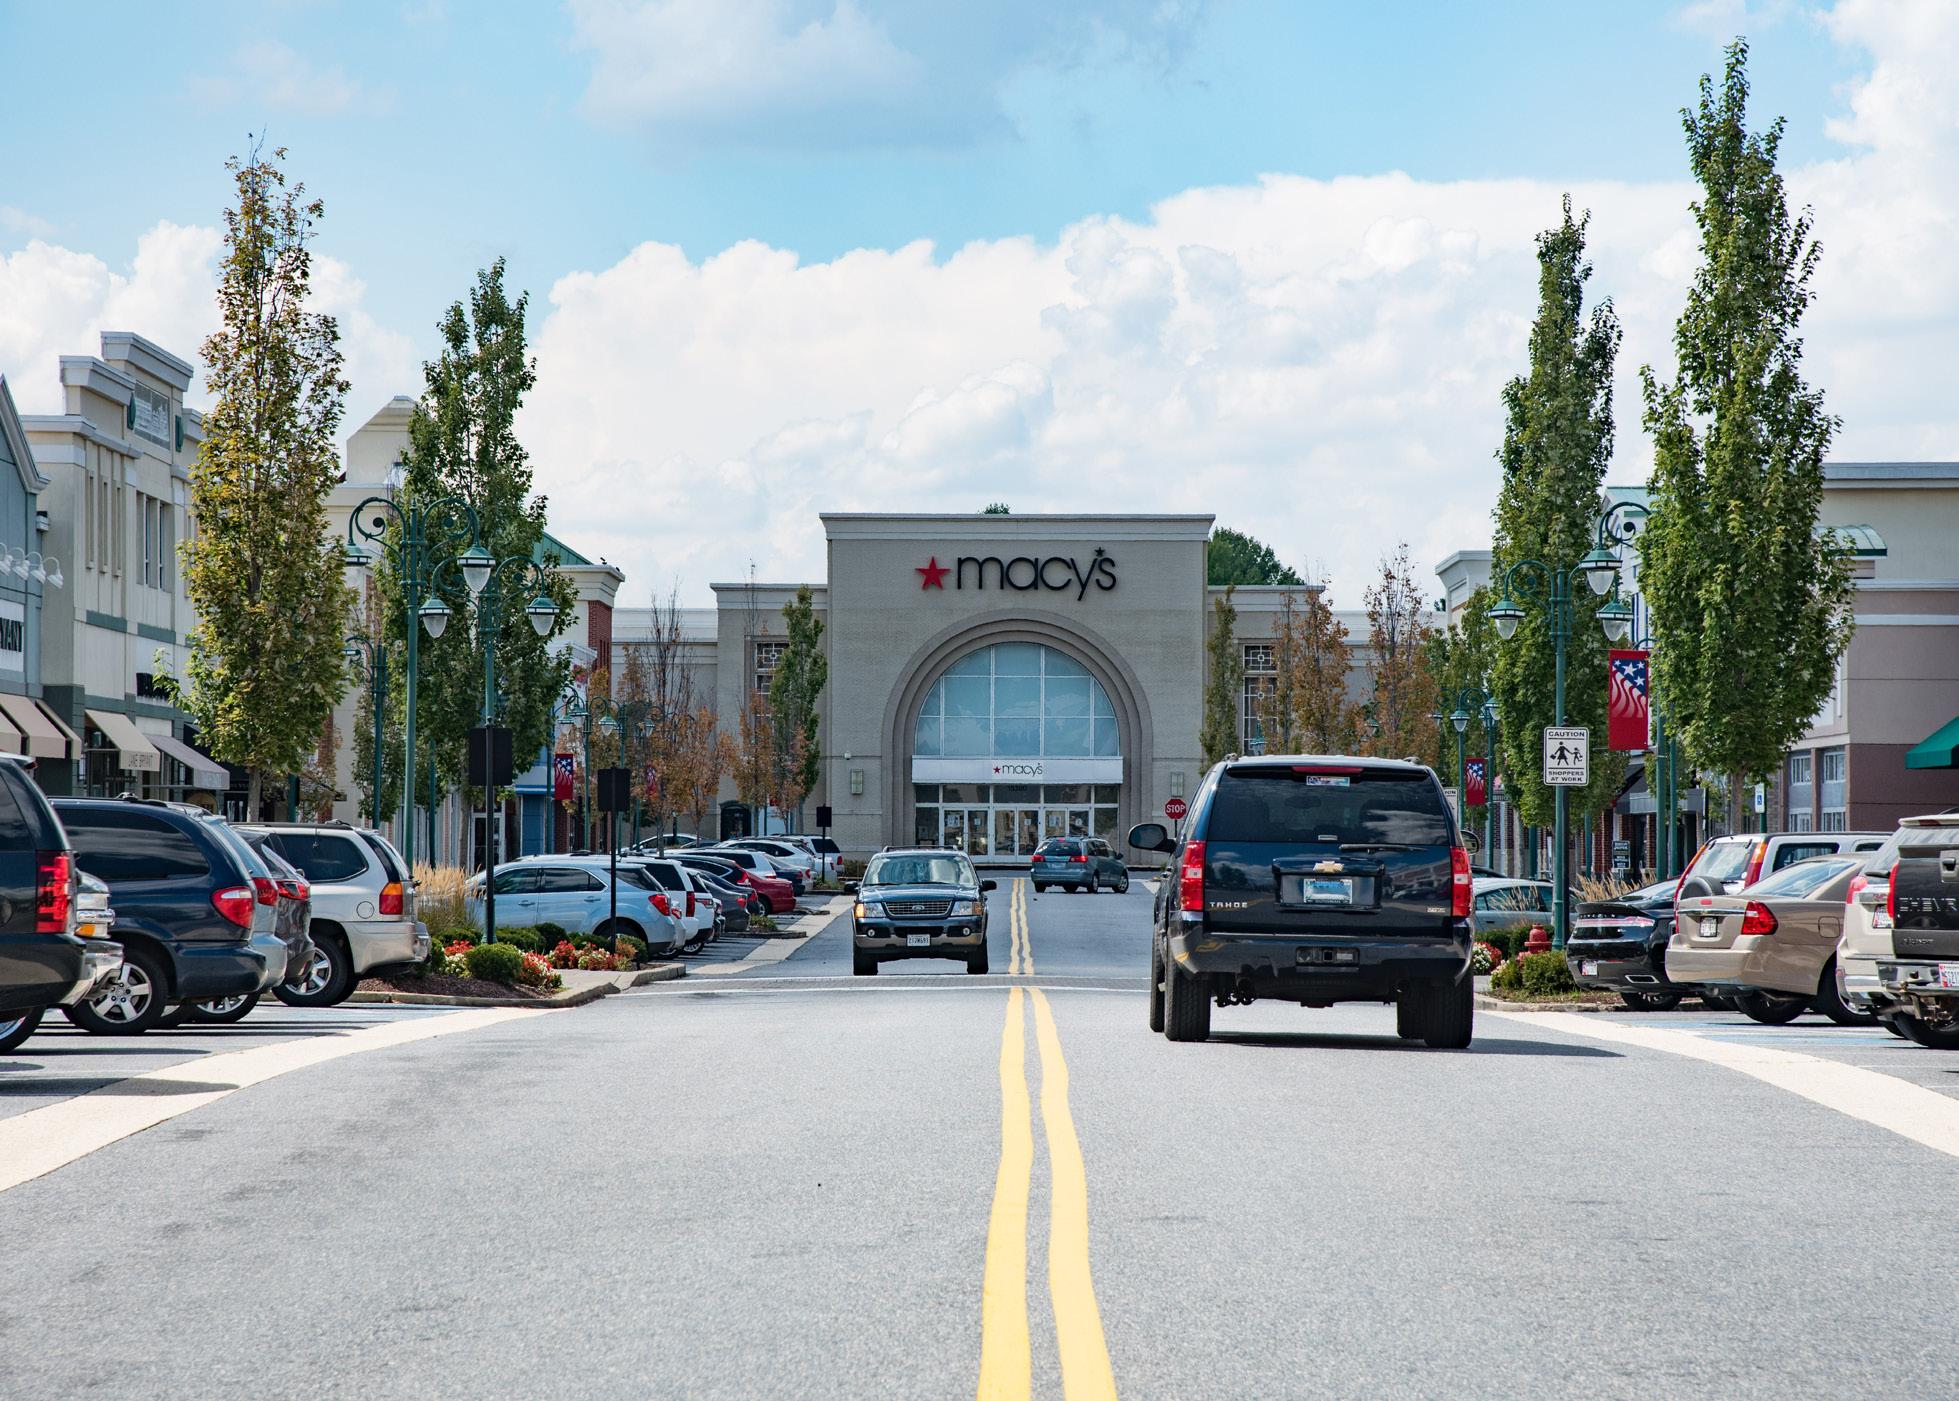
BOWIE LOCAL TOWN CENTER
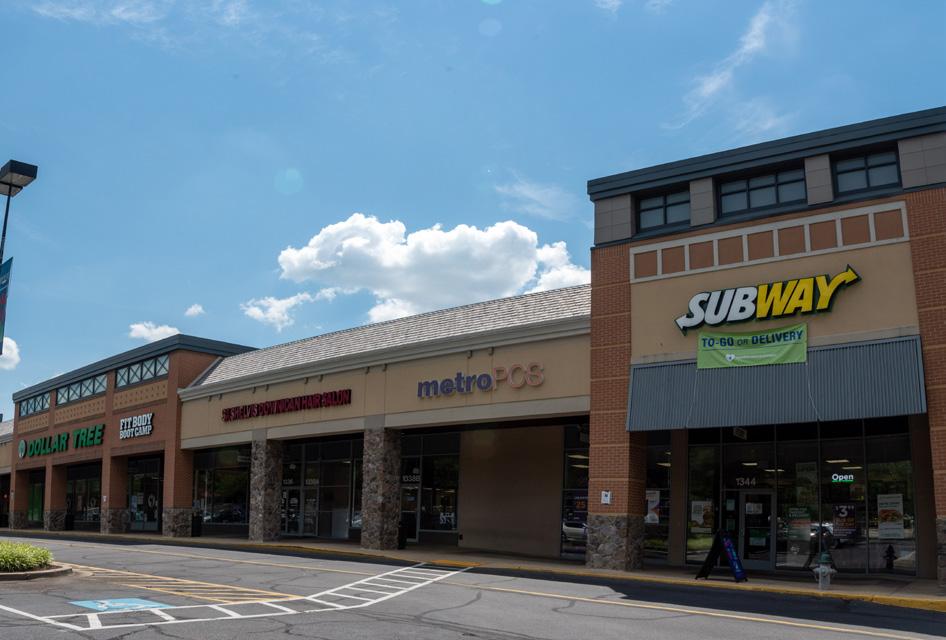
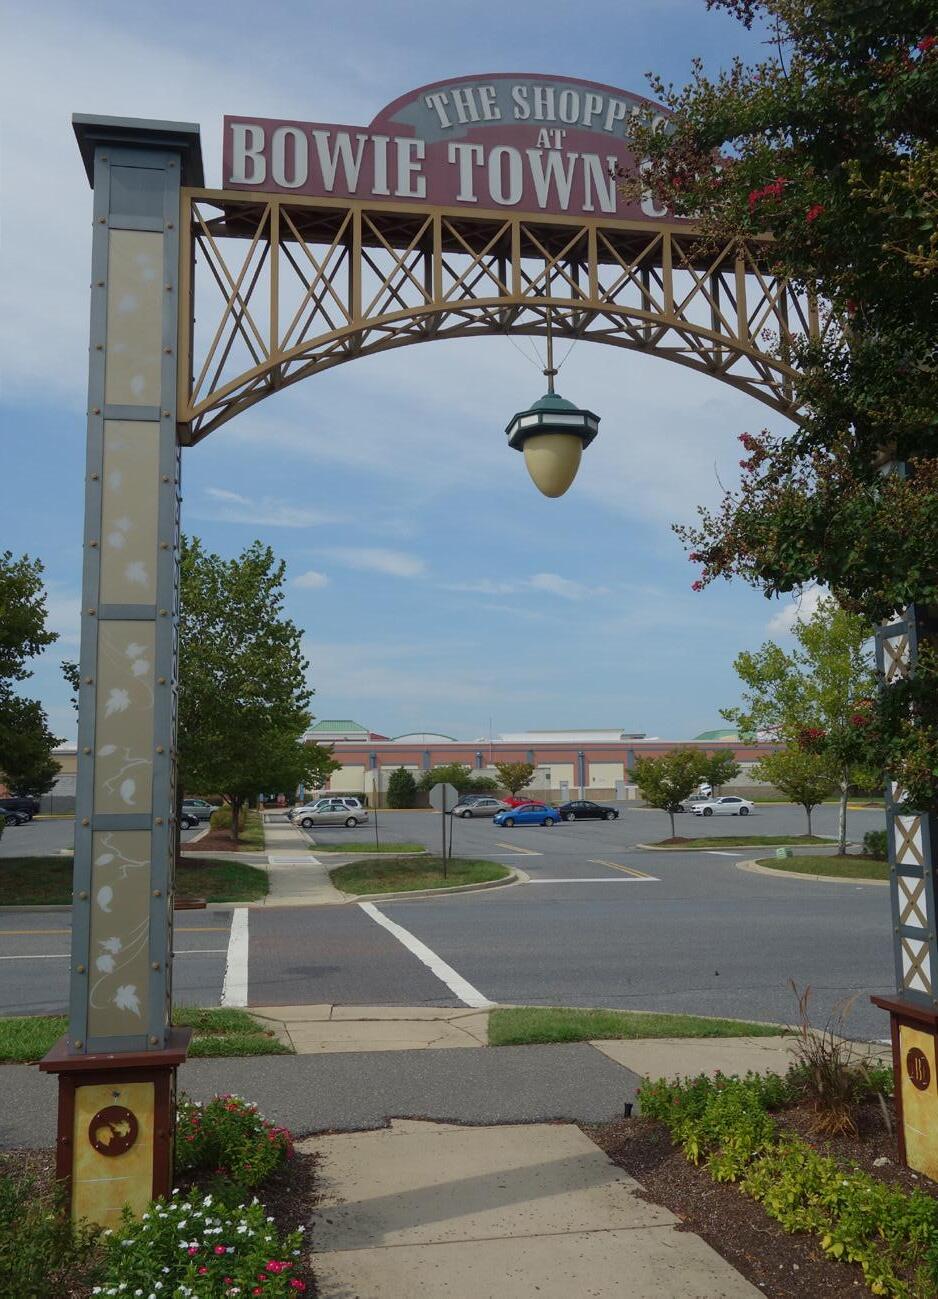
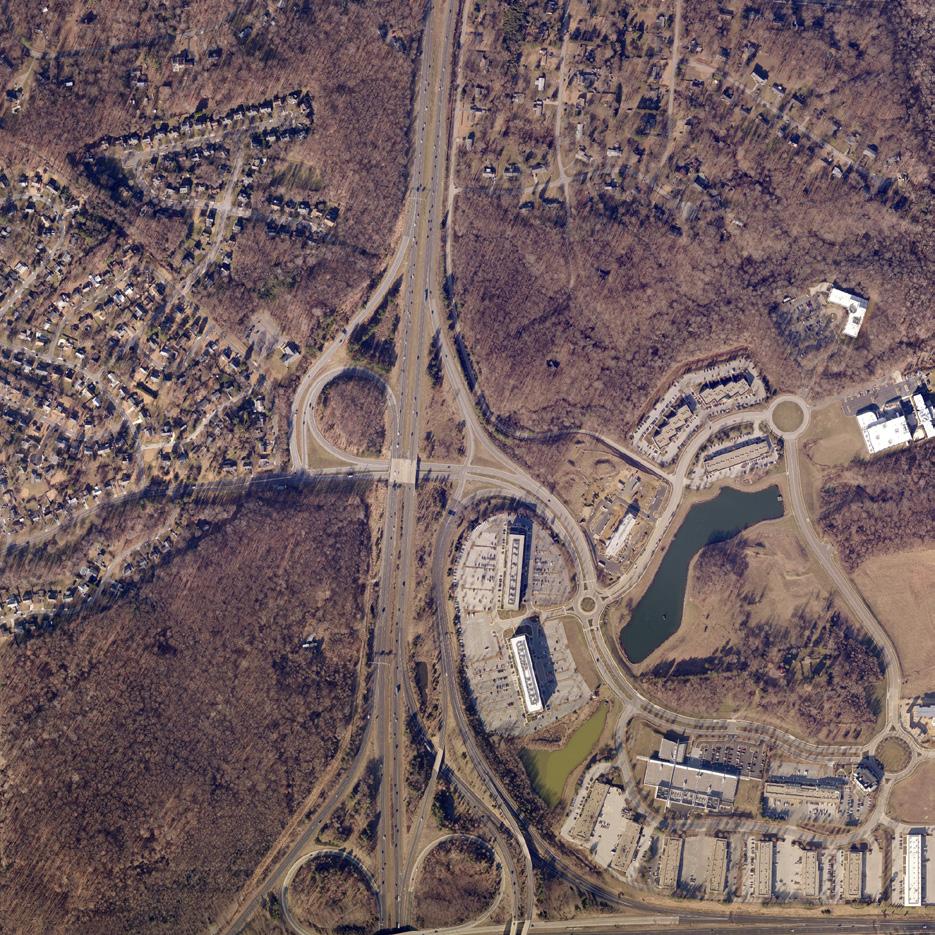
Bowie Local Town Center is a mixed-use activity center situated at the nexus of US 301 and MD 50. It is considered the core commercial focus area in the master plan area, with the majority of big-box anchor retail located within the town center. This focus area contains three sub-areas. The first sub-area is the Bowie Town Center, a large shopping activity center that includes an outdoor shopping mall that opened in Novemeber 2001 and is considered the walkable core of Bowie Local Town Center. Located to the west of US 301 and south of the US 50 and MD 197 intersection, the outdoor mall consists of approximately 80 retail stores and includes anchor tenants such as Safeway, LA Fitness, Macy’s, and Best Buy. It is zoned M-A-C, Major Activity Center, planned to serve a regional market, provide a concentration of employment, and cater to pedestrian access between uses.
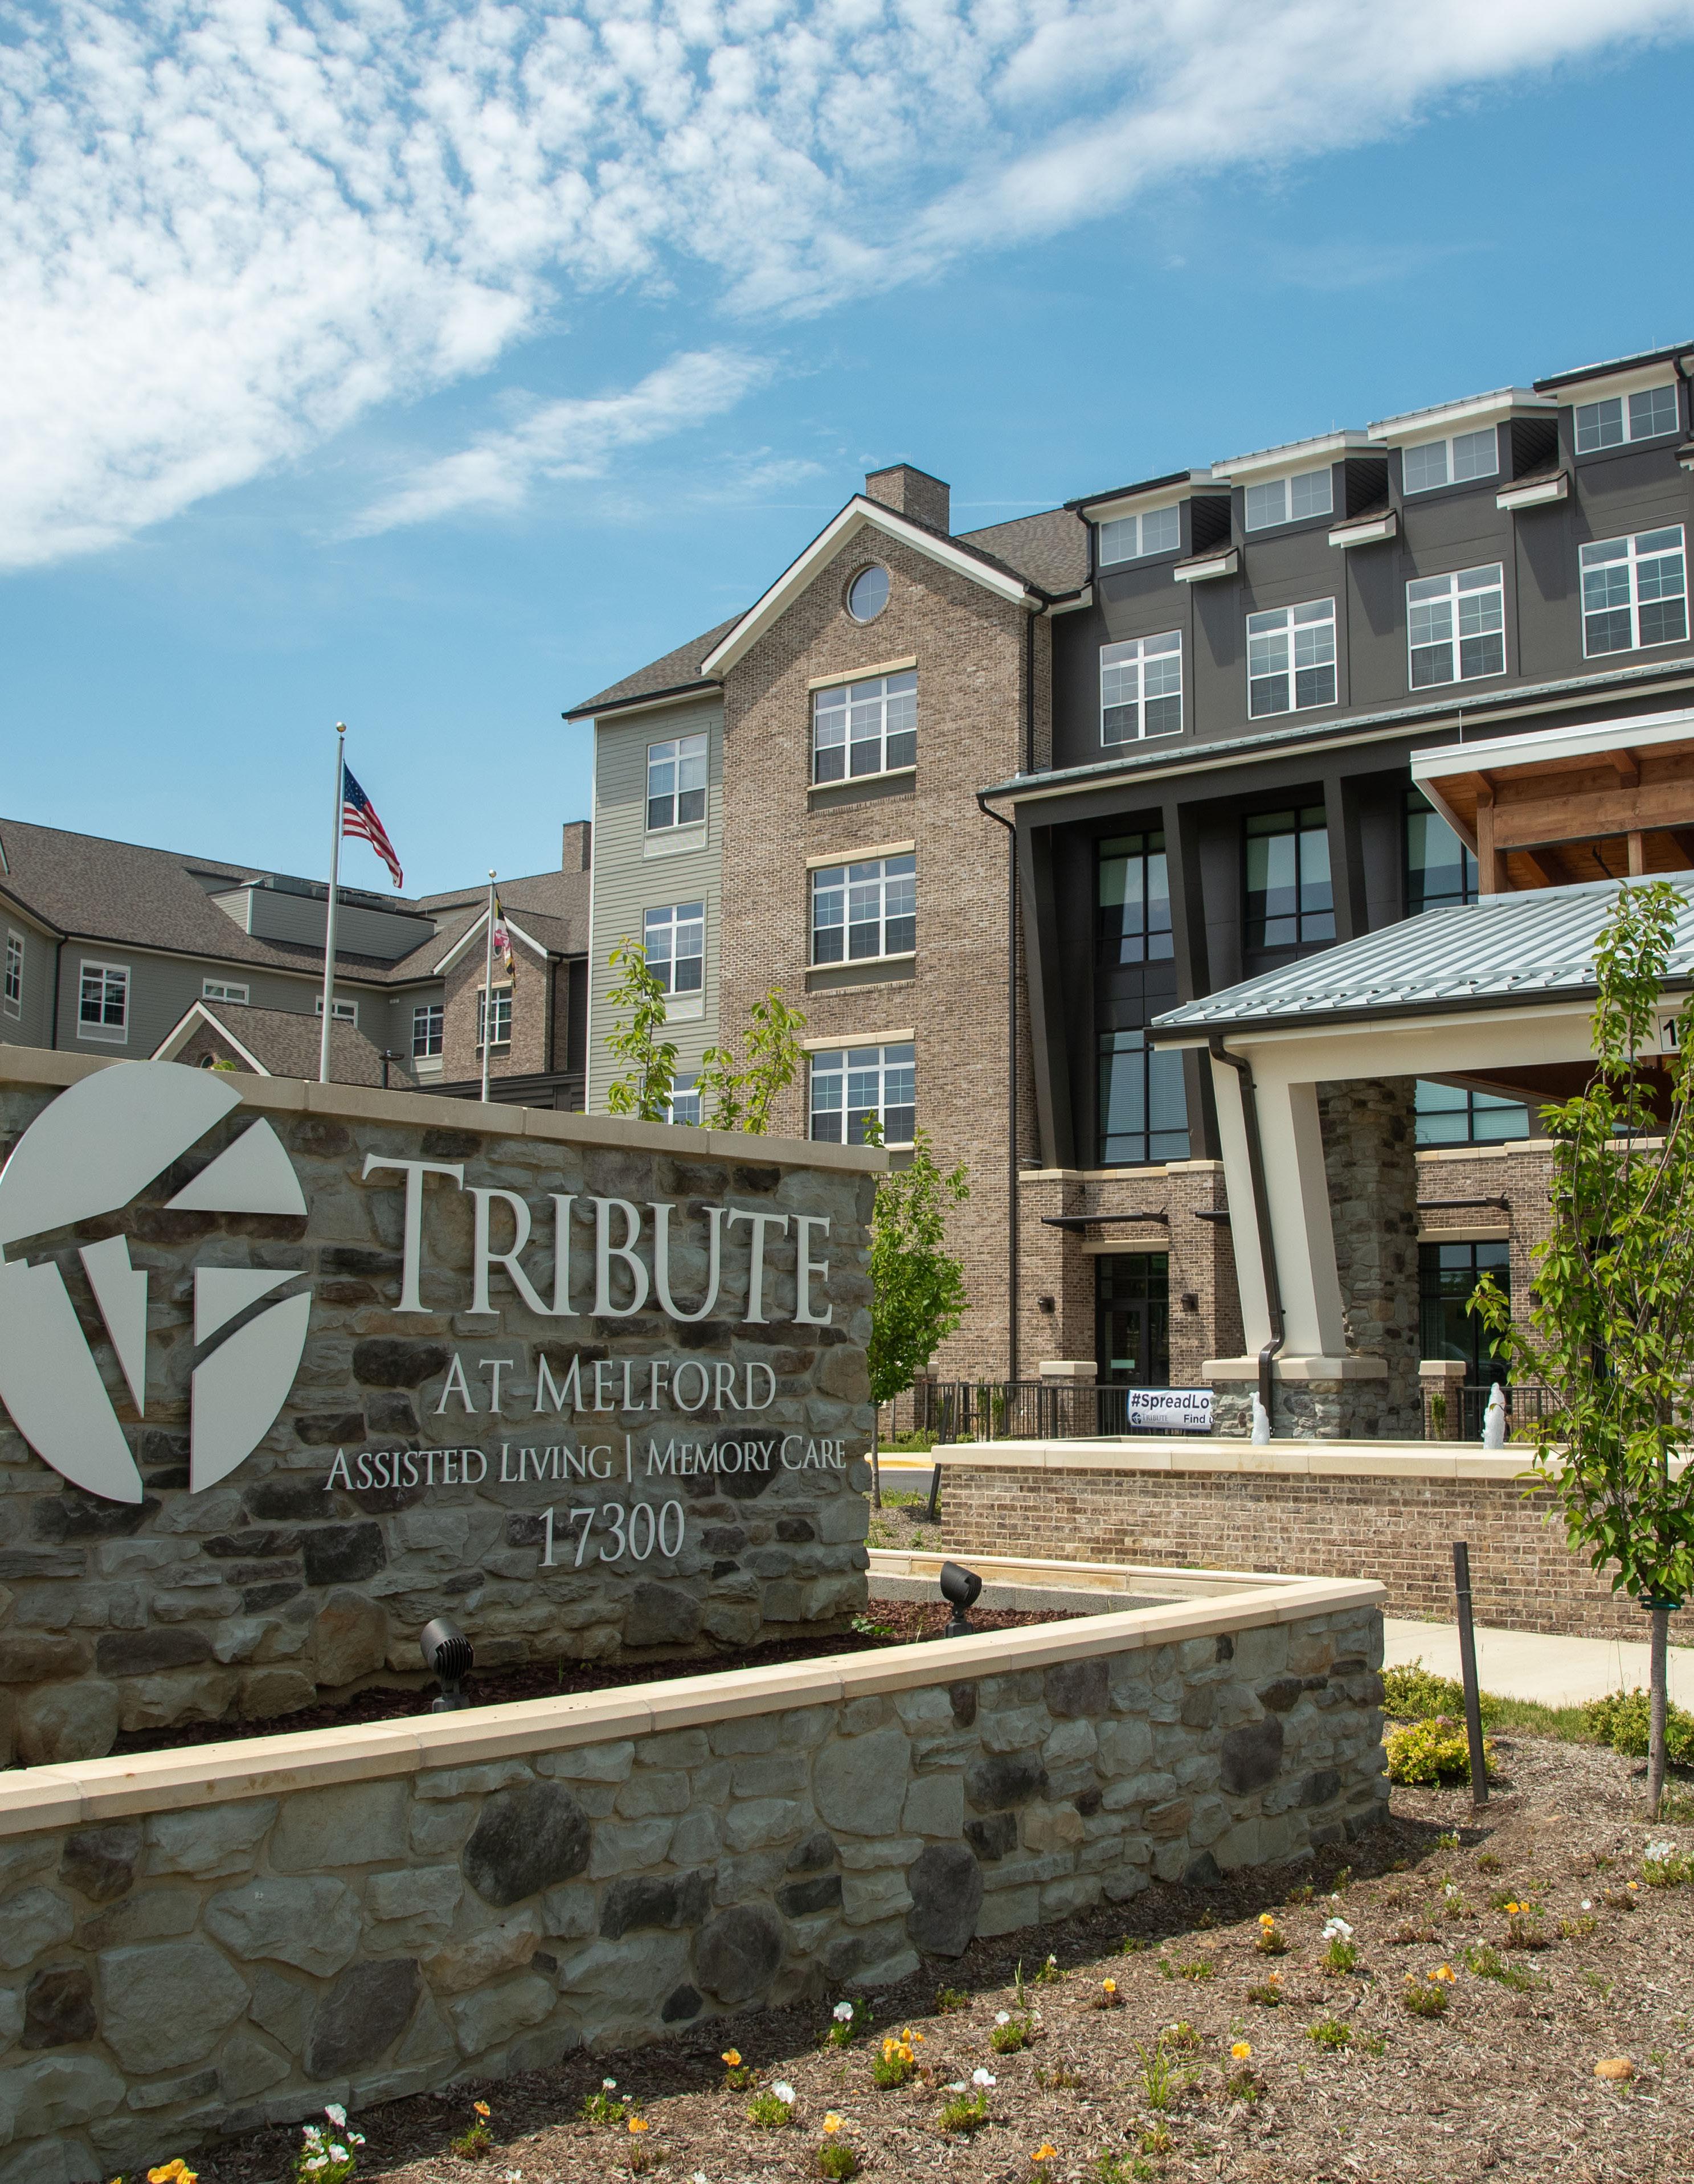
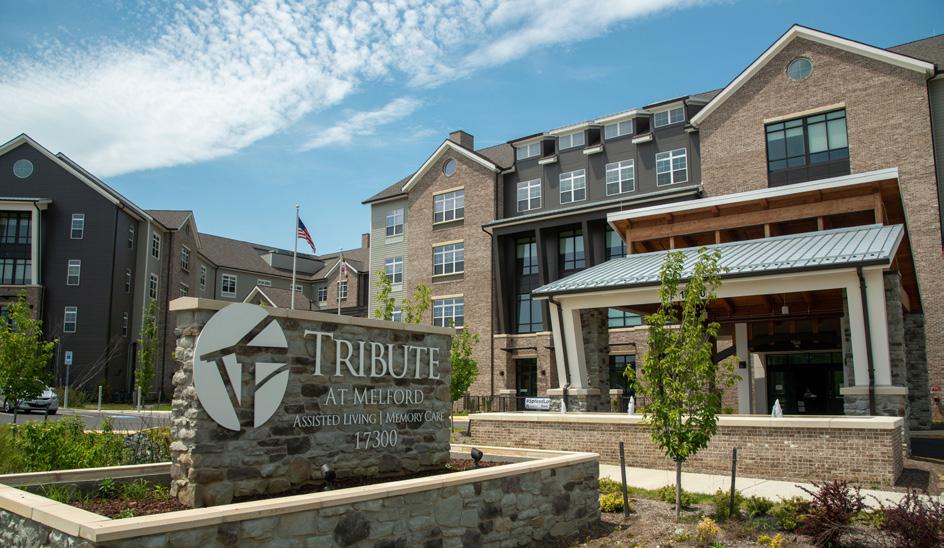
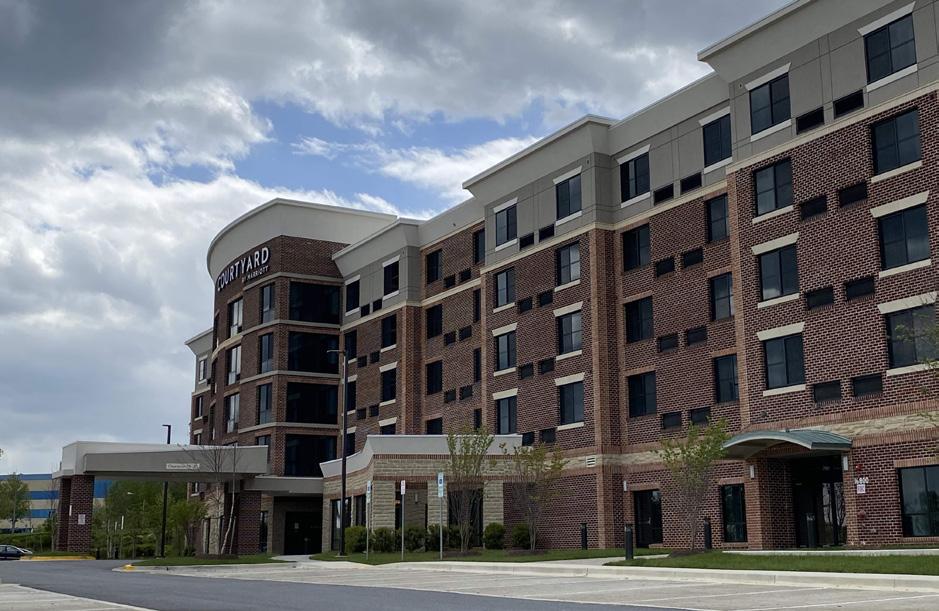
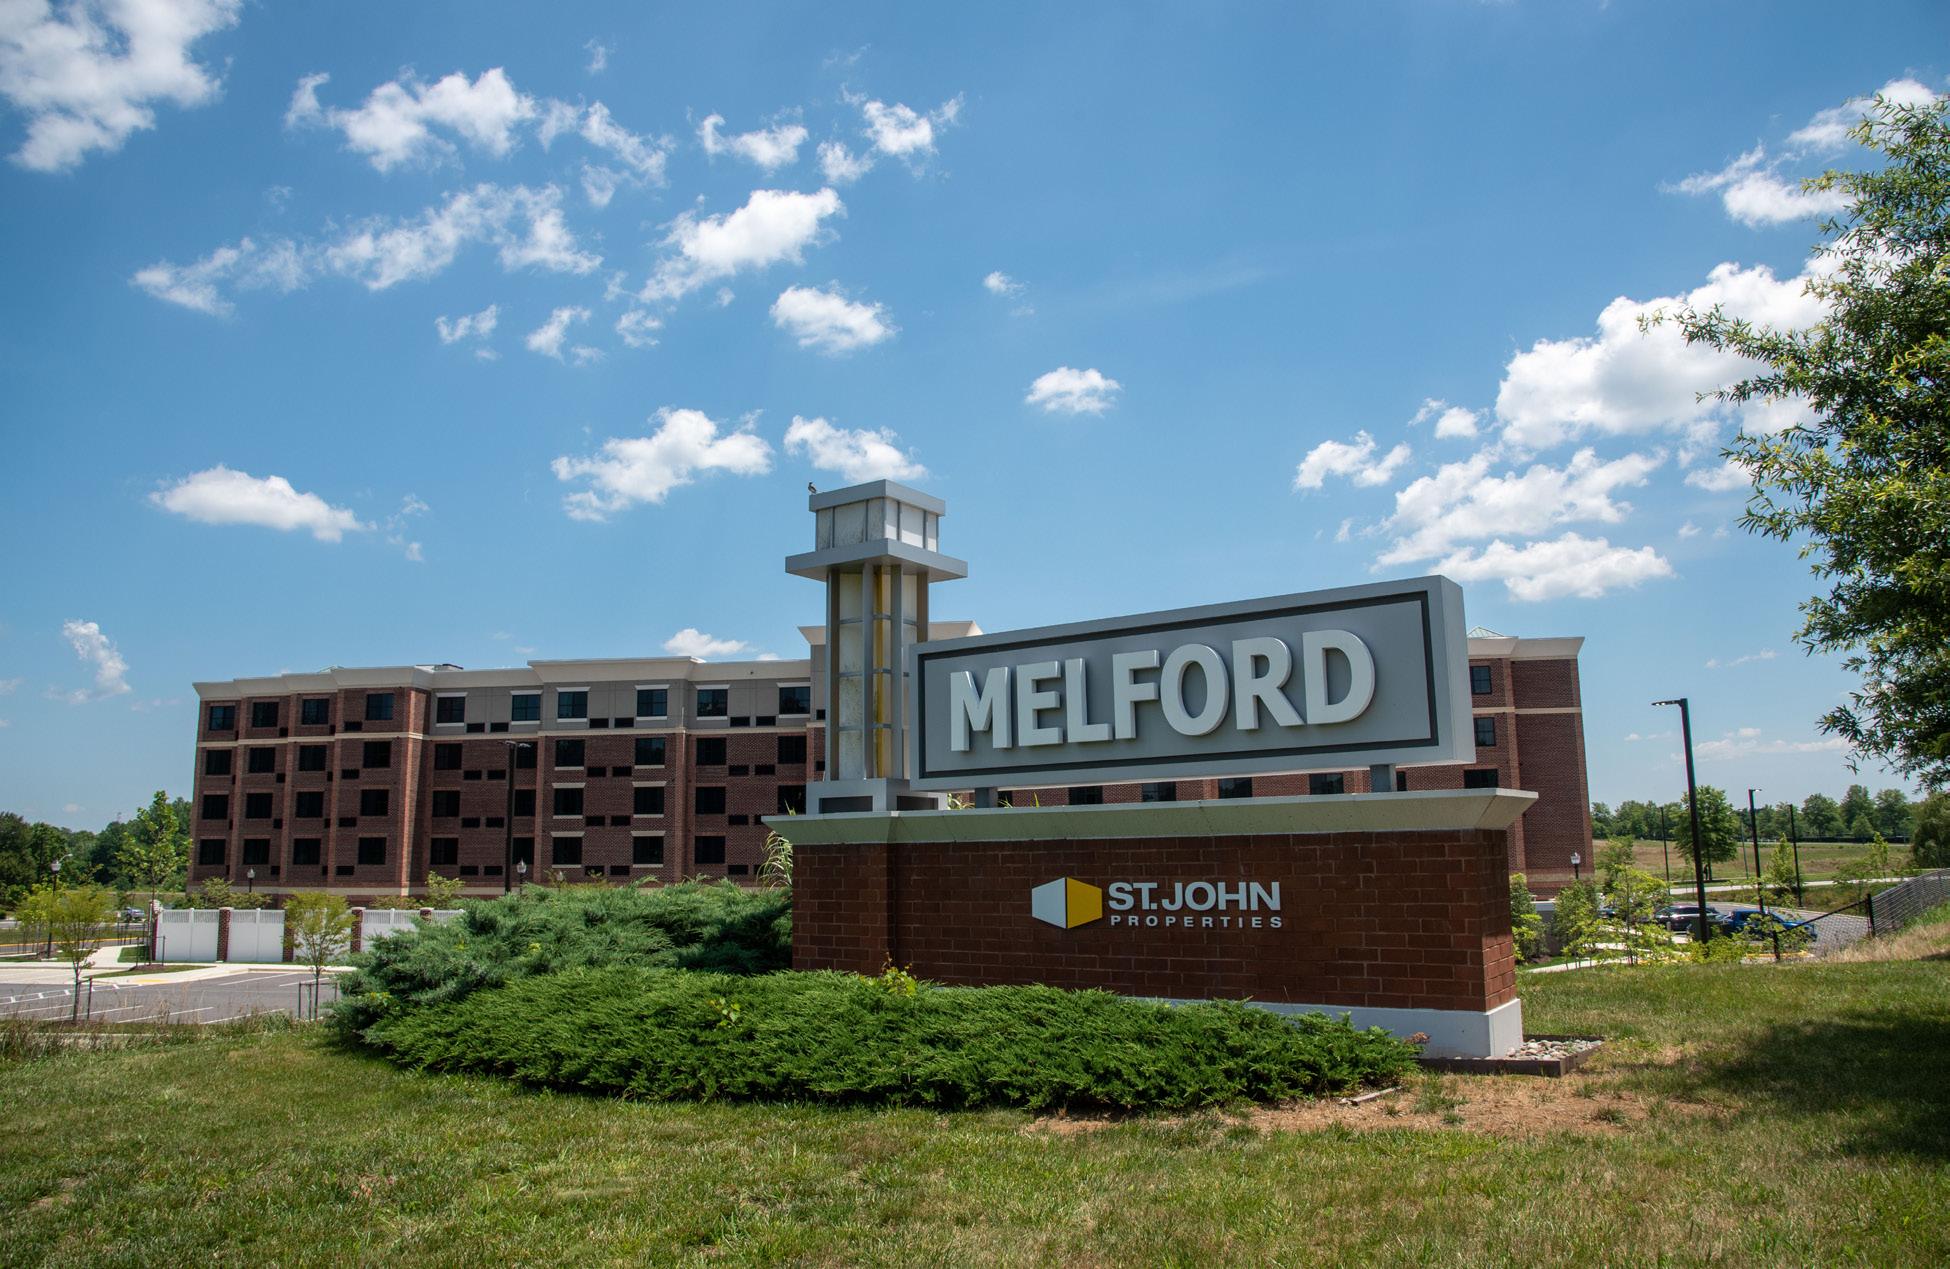
The second sub-area in Bowie Local Town Center is the Melford Town Center, located north of MD 50. Melford Town Center is a planned 466-acre mixed-use community located at the intersection of US 50 and US 301 and designated as a transportation-oriented mixed-use zone. Areas south and east of Melford Boulevard serve a mix of office and commercial uses. This focus area also contains notable natural
FOCUS AREA
A focus area is a planning area that serves as a center of activity or growth. This center may be local or regional in nature, and may serve a range of purposes, from commerce and retail, to industry and employment. Part of the master plan process is to establish planning objectives and a vision for these focus areas, in addition to Bowie-Mitchellville and Vicinity as a whole.
and historic features, including Fibonacci Lake and fountain and the Melford historic plantation grounds, a site listed in the National Register of Historic Places in 1988.9 The Melford center is adjacent to the Patuxent River, which runs along the eastern edge of the subarea.
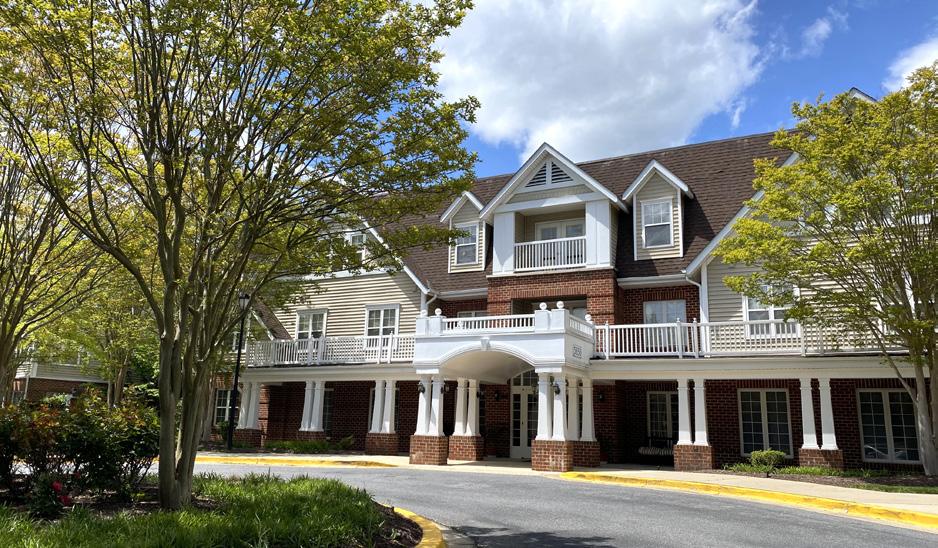
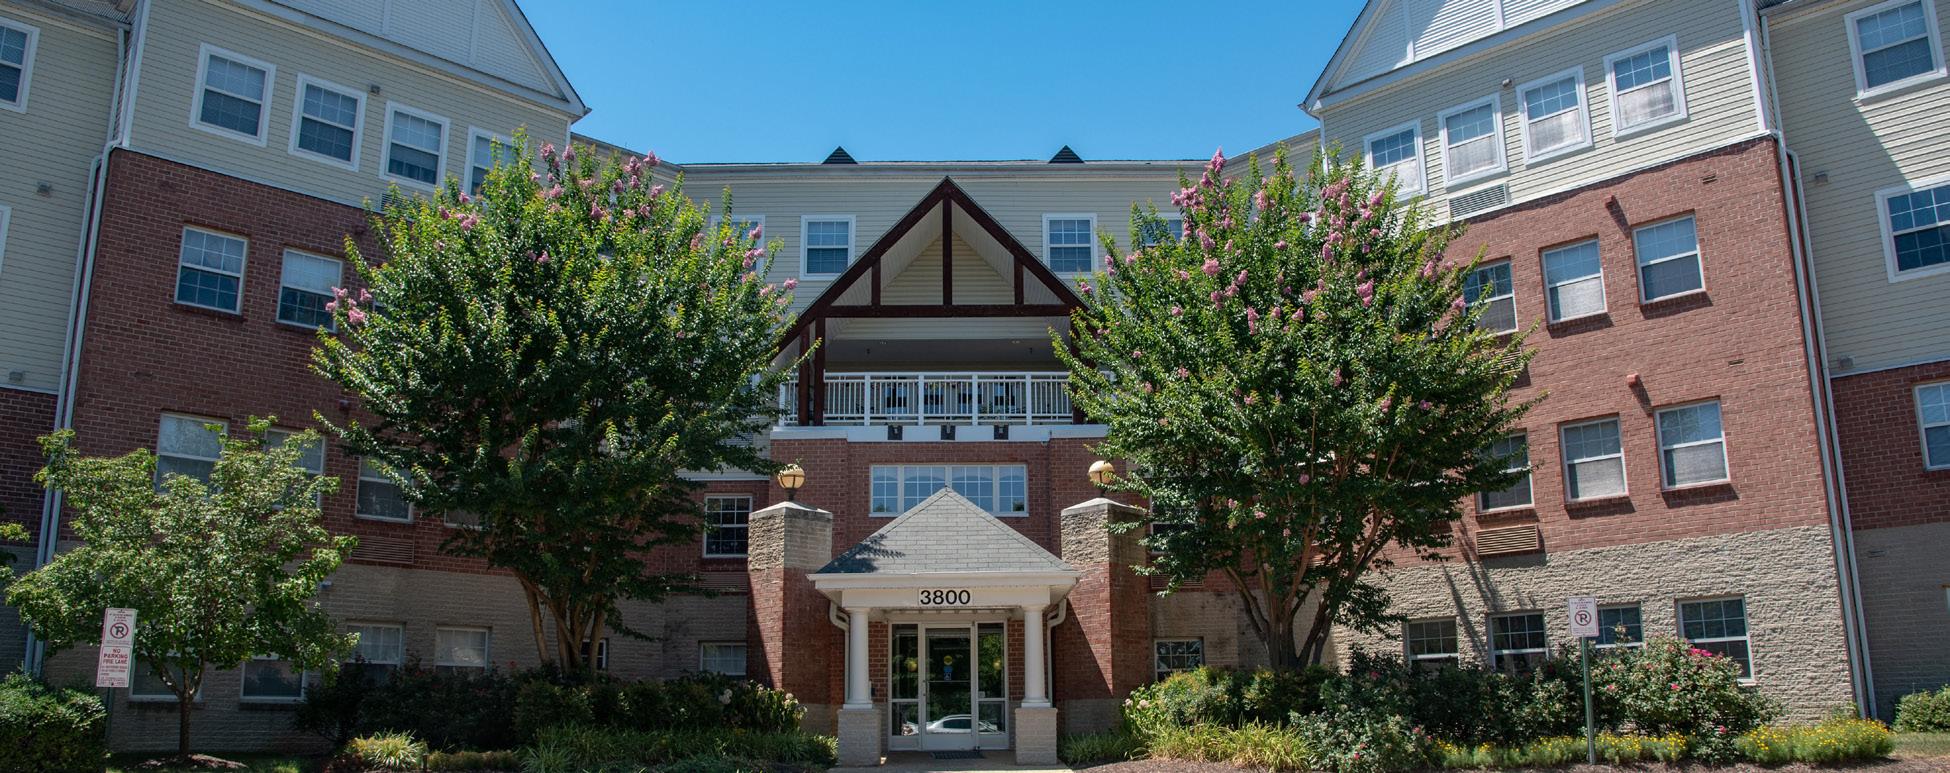
The project delivered the 144-key Melford Courtyard by Marriott as well as the 140-unit Tribute at Melford senior living apartment building in 2019. When completed, Melford Town Center will also include 1,500 multifamily units, 300 townhouses, 260,000 square feet of office, 85,000 square feet of retail, and two additional hotels.
This focus area also includes a majority mixed-use commercial area straddling US 301, south of Melford Town Center. Along US 301 lies a variety of automobile dealerships for brands such as Chevrolet, Kia, and Toyota. Situated west of the auto dealerships are many of the Town Center’s big-box anchor tenants, including retailers such as Target, Burlington,
7 Prince George’s County Approved General Plan 2002.” 2002. The Maryland-National Capital Park and Planning Commission. http://www.pgplanning.org/DocumentCenter/View/316/2002-General-Plan-Abstract-Table-of-Contents-and-ExecutiveSummary-PDF.
8 “Plan 2035: Prince George’s County Approved General Plan.” 2014. The Maryland-National Capital Park and Planning Commission. www.pgplanning.org.
9 “National Register Information System”. National Register of Historic Places. National Park Service. April 15, 2008.
Page 14
• Prince George’s County Planning Department
./MD-197
Bowie Town Center
Land Ownership Land Use
Stadium Sears Development Site
Commercial Residential
Employment/ Industrial
Institutional/Church Single-family
Multifamily
and Open Space
and Agricultural Townhouses Transportation/Utilities/Unclassified
Havertys Furniture, PetSmart, and Staples. Further south, at the intersection of MD 197 and US 301, are additional anchor retail stores such as Kohl’s and Lowe’s Home Improvement as well as a variety of full-service restaurants and fast-casual dining options. This subarea abuts the Prince George’s Stadium on its east edge and includes areas zoned for R-R (Rural Residential) zone to the east of US 301. This subarea includes an M-X-T (Mixed-Use Transportation Oriented) Zone, which mandates a mix of uses near a major intersection or transit stop and encourages a functional 24-hour environment.
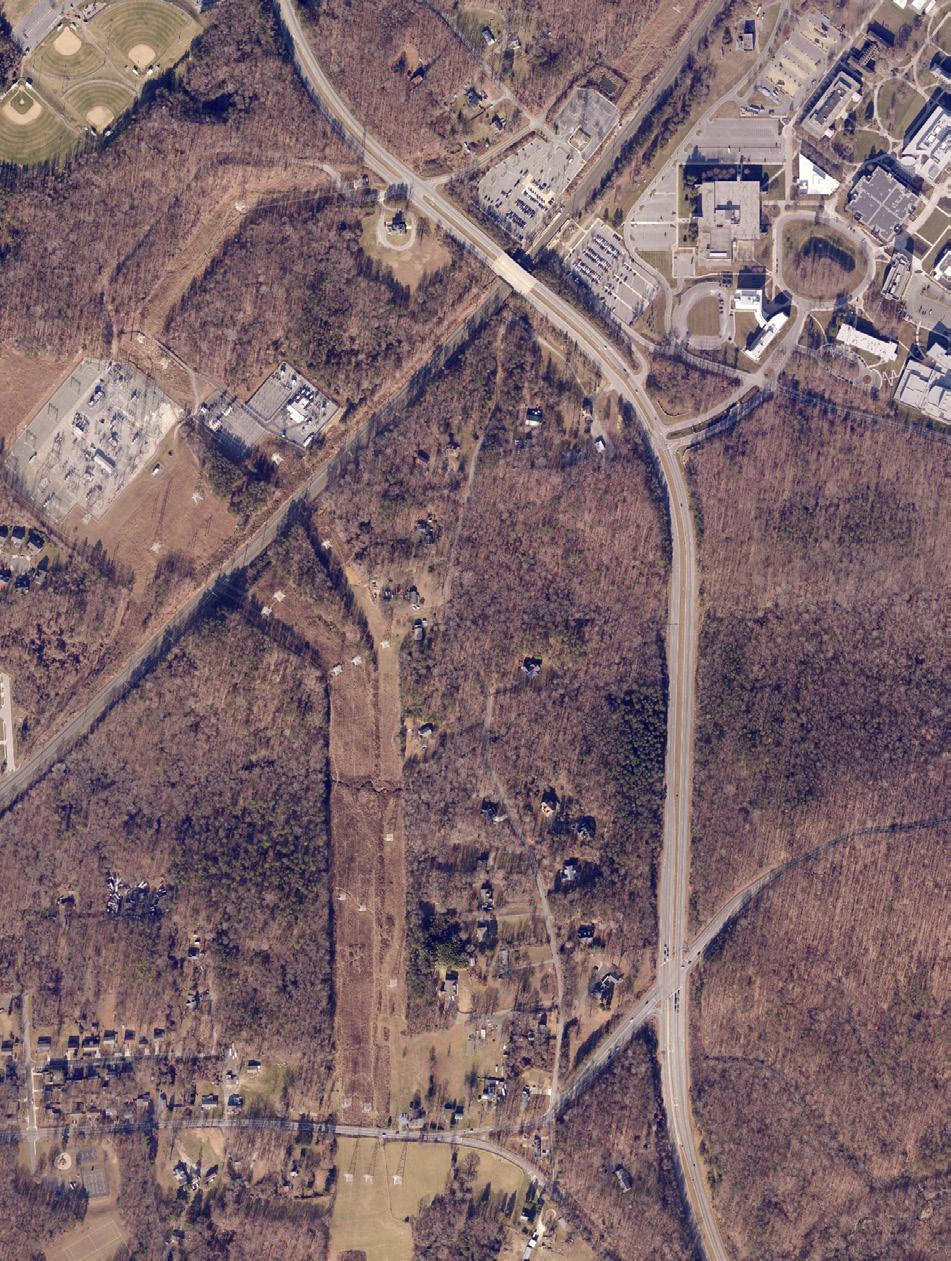
BOWIE STATE MARC STATION CAMPUS CENTER
The Bowie State MARC commuter rail station is located on a four-track section of the Northeast Corridor, with two side platforms next to the outer tracks, and is directly adjacent to the BSU campus. Owned by Amtrak, the station is served by MARC Penn Line commuter rail trains and had a total of 819 daily passengers as of 2018. Amtrak’s predecessor railroads operated intercity and commuter rail services that served this location from 1911 to 1981; Amtrak reconstructed and reopened the station in 1989 as one of its first major MARC station projects to serve commuters in the Washington, D.C./Baltimore
Prince George’s
Sources: Prince George’s County Planning Department, M-NCPPC.
Map 5. Bowie Local Town Center Focus Area
Map 6.
Land Ownership
MARC Train Rail Line
Sources: GIS Data Catalogue, Prince George’s County Planning Department, M-NCPPC.
metropolitan region. The line runs from Union Station in Washington, D.C., through Baltimore, to Perryville, Maryland. The area northwest of the MARC station is zoned M-X-T. In 2010, M-NCPPC conducted a sector plan for the Bowie State MARC Station campus center, which included design standards and strategies, as well as an emphasis on improving mobility between the MARC station center and surrounding areas through bus lines, trails, and transportation system improvements. This plan also rezoned the transit center to accommodate mixed-use development.
The Bowie State MARC Station serves established communities throughout the master plan area, as well as the campus community of BSU. BSU is a public institution founded in 1865 and was the first historically Black college or university within the State of Maryland. Situated on 339 acres at the northern end of the master plan area’s MD 197 corridor, the university has a total undergraduate enrollment of 5,227 students and a graduate enrollment of 944 students as of fall 2019. BSU has historical and regional significance as one of the oldest historically Black universities in the country.10 BSU opened as Normal School No. 3 in 1911 on the site of
10 “Bowie State University - About Bowie State University.” n.d. Accessed March 25, 2020. https://www.bowiestate.edu/ about/.
16 • Prince George’s County Planning Department
Fran Uhler Natural Area
Land Ownership Land Use
Employment/ Industrial
Sources: GIS Data Catalogue, Prince George’s County Planning Department, M-NCPPC. Municipality
the former Jericho farm, and was recognized by the state as a public system college in 1963.
Approximately 19 percent of BSU’s student body lives in college-owned, -operated, or -affiliated housing, with the remaining 81 percent living off campus. Given the lack of existing residential development around the campus, many students live outside of Bowie and commute to campus, indicating potential for new residential development near campus to cater to these students. The campus is accessible by public transit via the Metrobus and MARC commuter rail station.
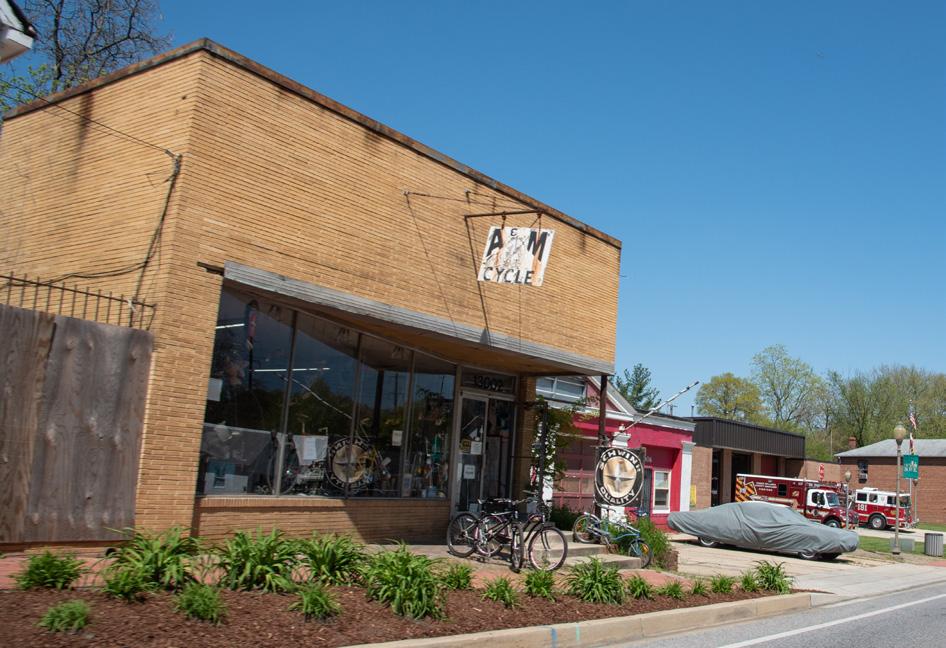
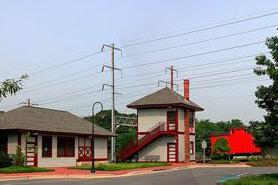
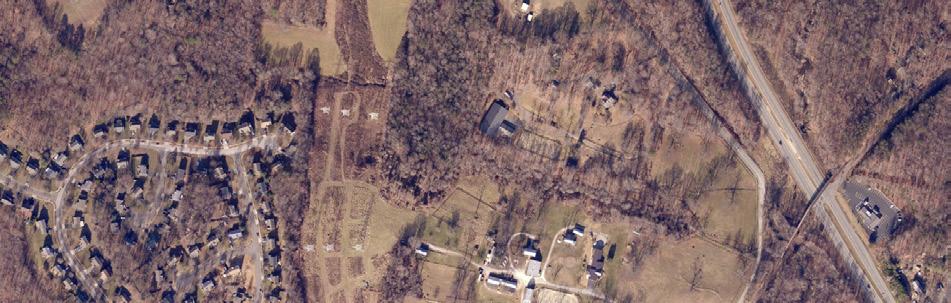
OLD TOWN BOWIE
Old Town Bowie is a small residential and retail community located at the intersection of Chestnut Avenue and 11th Street. The community is comprised of single-family dwelling units as well as older antique shops and auto repair stores. This node includes the Old Town Bowie Welcome Center and historic Bowie Railroad Museum.
The rail station in Old Town Bowie is central not just to this node but to the historic development of Bowie-Mitchellville and Vicinity. Bowie Station opened in 1872 as part of the Baltimore-Potomac Railroad connecting Baltimore to southern Maryland. The
Old Town Bowie Welcome Center
Map 7. Old Town Bowie
opening of the railroad sparked development—the town constructed around the railroad was first known as Huntington City. In 1880, the town was renamed Bowie in honor of Governor Oden Bowie, who helped open the new railroad line. Bowie Station operated until 1989, when it was replaced by the new station at BSU. Constructed in 1929 as the Bowie Building Association, the Old Town Bowie Welcome Center serves as a hub for visitor information, youth and cultural activities, and exhibitions about Bowie’s history as “a close-knit local railroad community.”
The Bowie Railroad Museum is considered the neighborhood’s only tourist attraction and showcases examples of the types of buildings commonly associated with small-scale rail junctions of the early 20th century. The station building houses a variety of exhibits and artifacts, while the tower contains the National Railroad Historical Society’s Martin O’Rourke Railroad Research Library. The buildings were added to the National Register of Historic Places as the Bowie Railroad Buildings on November 4, 1998.
Old Bowie Town Grille serves as the neighborhood’s only full-service restaurant and offers live music, openmic nights, and a bar. Other neighborhood services offered in Old Town Bowie include a fire station, post office, and a community center. Part of this node is zoned as mixed-use infill (M-U-I), which encourages smart growth in already developed zones of the County. Opposite the rail line, the node also features a light industrial (I-1) area.
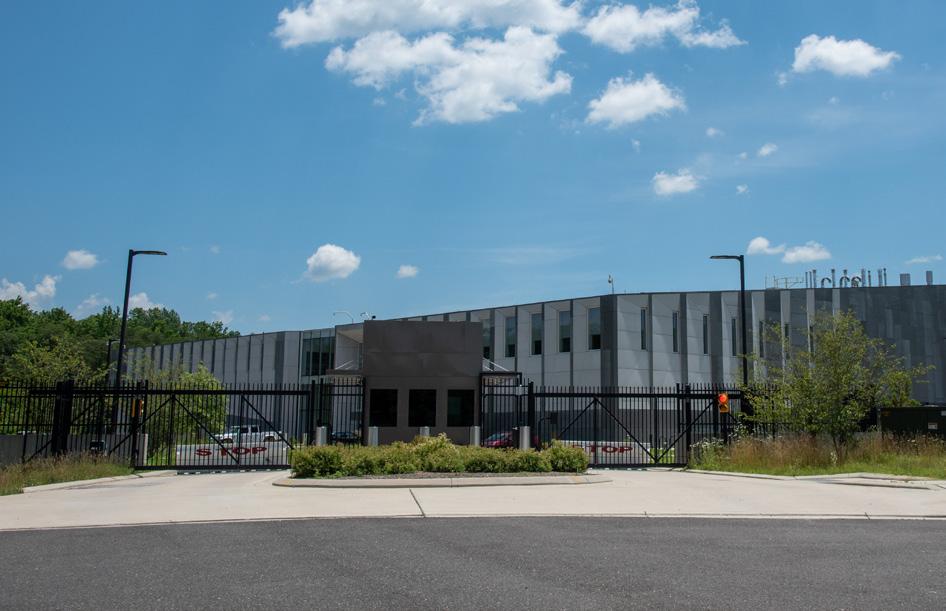
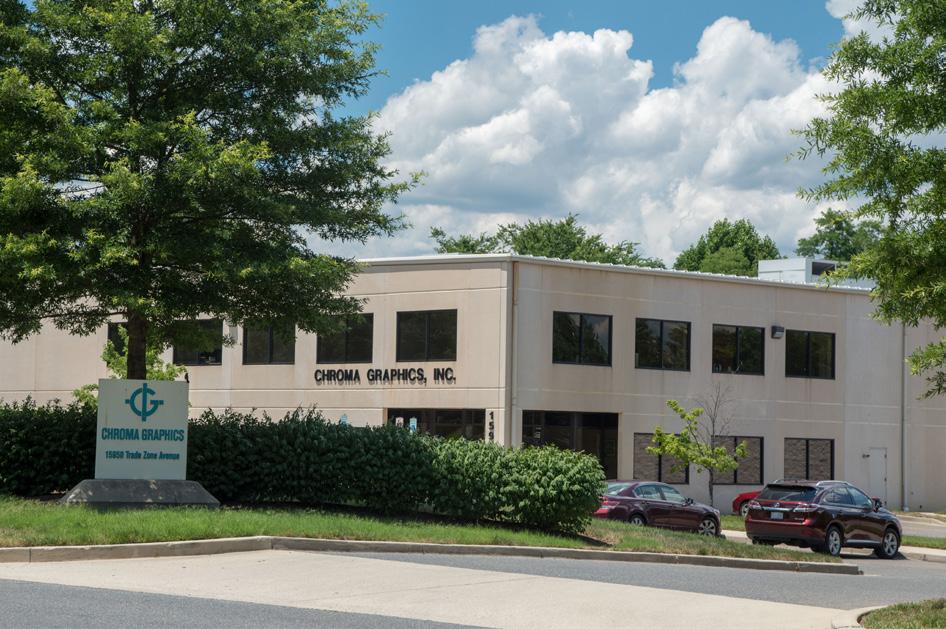
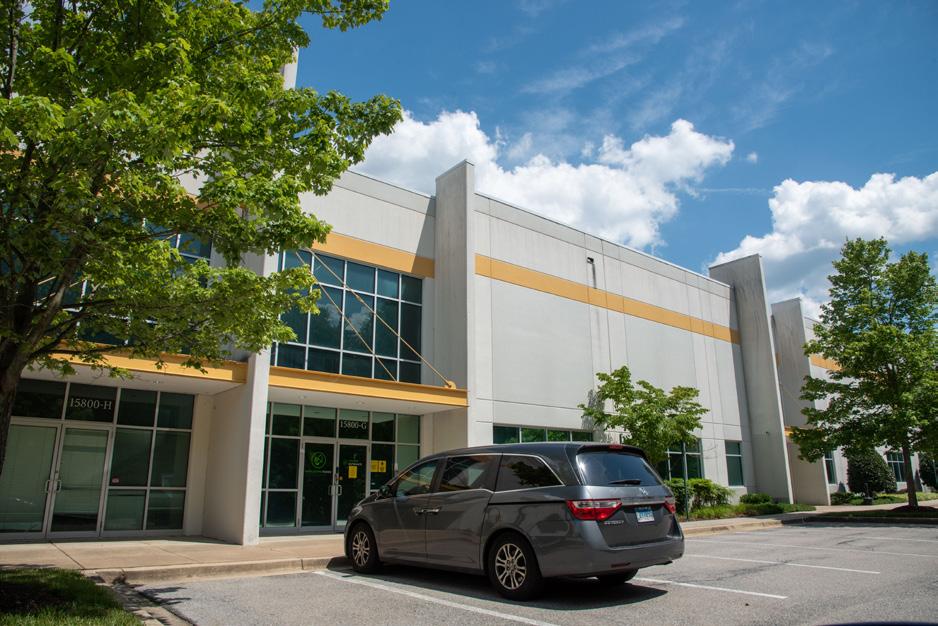
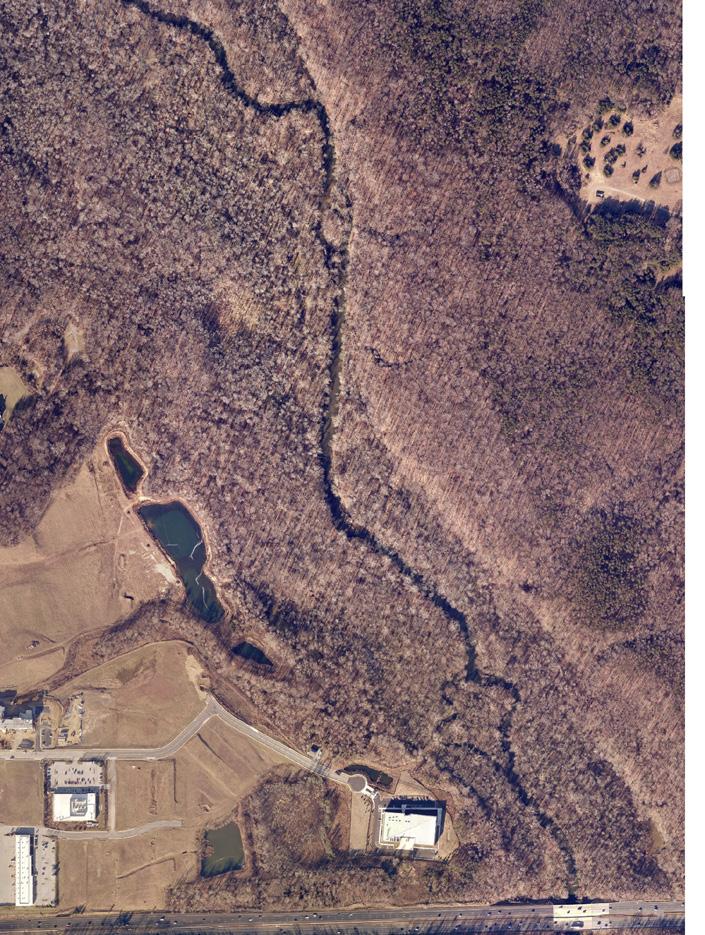
COLLINGTON TRADE ZONE
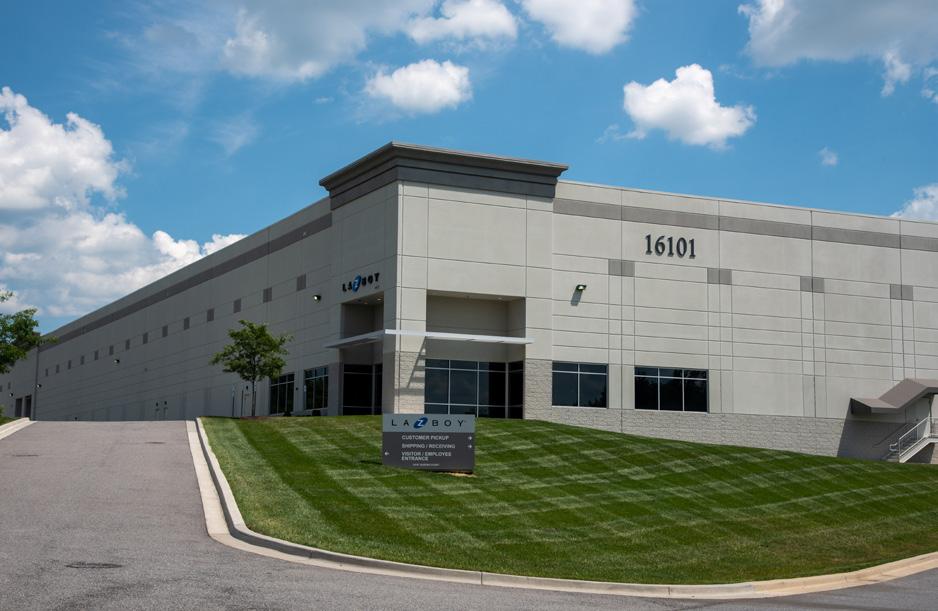
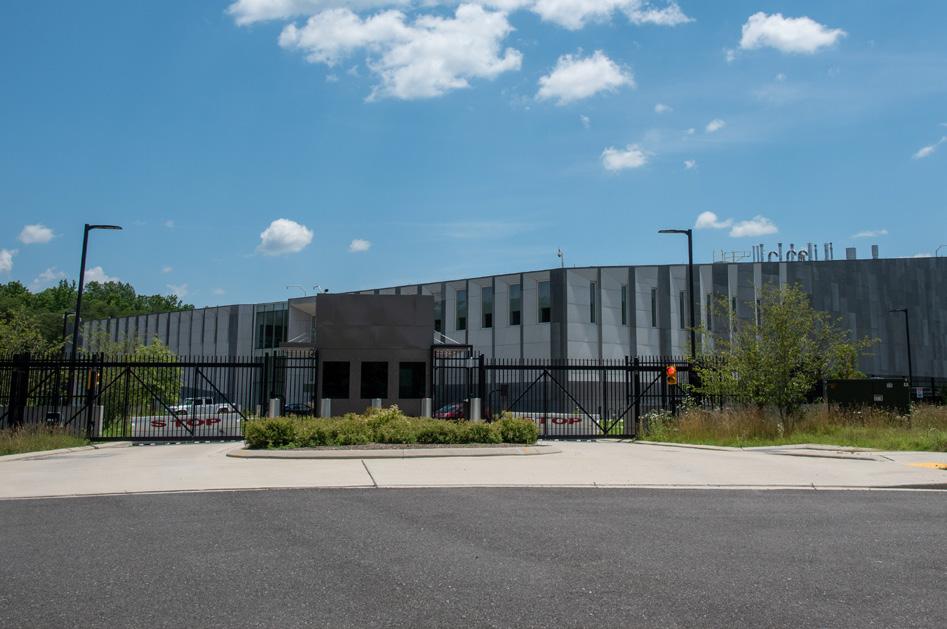
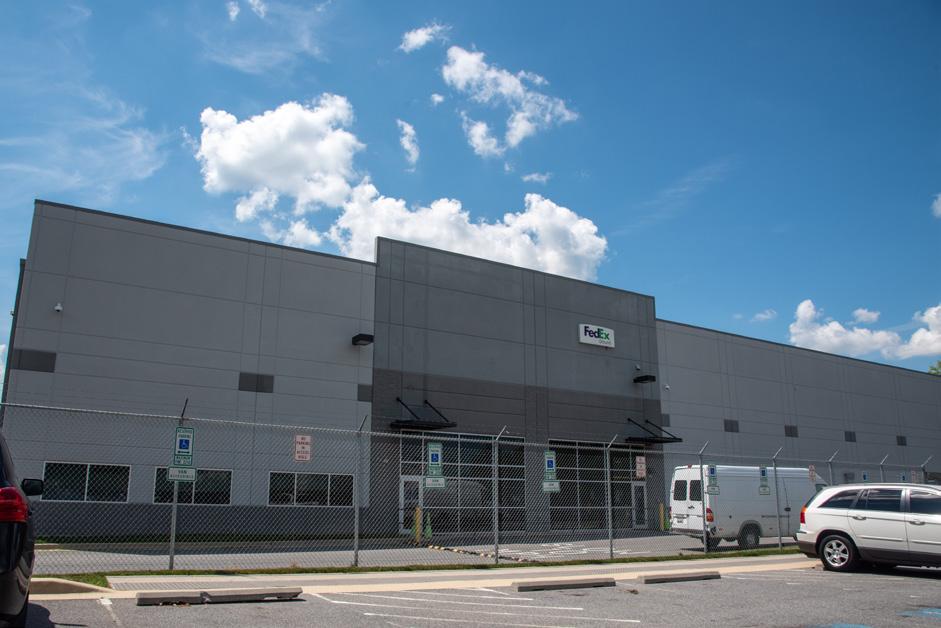
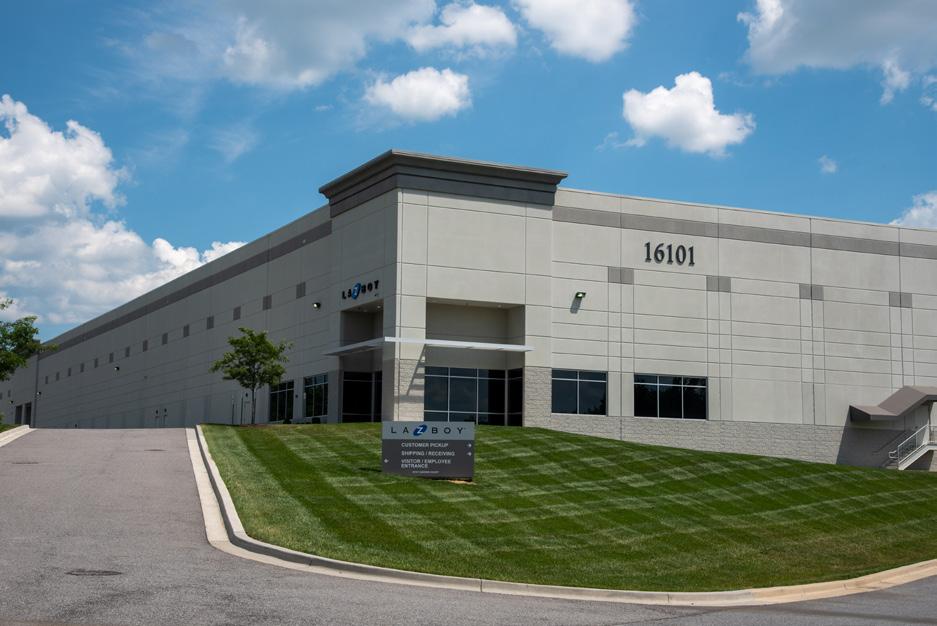
Situated at the southern end of the master plan area, the Collington Trade Zone is an industrial and flex commercial center located at the intersection of US 301 and Leeland Road in Upper Marlboro. The industrial community is home to a variety of warehouse and distribution centers. The most recent development within the Collington Trade Zone comes from the first two deliveries of Collington Park, an industrial/flex development by MRP Industrial. Collington Park is home to FedEx Ground’s 175,000 square-foot package sorting facility that opened in 2014 and La-Z-Boy’s 221,000 square-foot mid-Atlantic distribution center that opened in 2016. The Park has two remaining sites, including a 7.1-acre site that can accommodate an 87,000 square-foot warehouse. When construction of
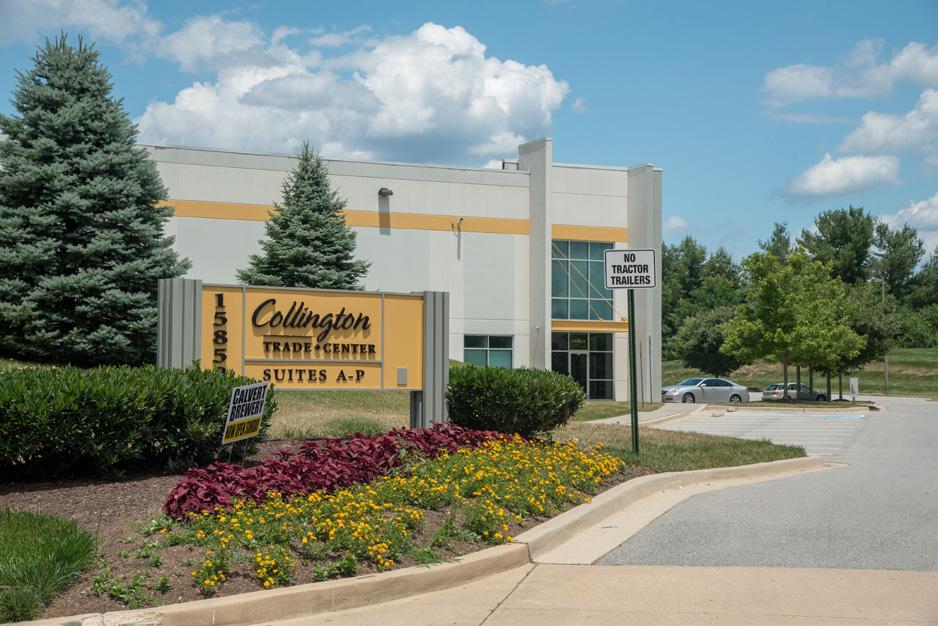
all phases is complete, Collington Park will total more than 500,000 square feet of industrial and small-bay warehouse space. Corporate neighbors include Buck Distributing, Nordstrom, Trible’s, Safeway,11 and H Mart.
The Collington Trade Zone also features a dance studio and gymnastics center on Commerce Drive, as well as Calvert Brewing Company, a state-of-the-art craft brewery housed in an over 28,000-square-foot facility off of Commerce Court. A majority of this focus area is zoned E-I-A (Employment and Institutional Area) with the exception of one parcel zoned R-R (Rural Residential) at the site of the Prince George’s County Police Department (District 2).
Key Corridors
In this report, three corridors have been selected that show interesting opportunities for future development and planning in the master plan area.12 Corridors include all parcels within a 1,000-foot buffer of the stretch of that road that falls within the master plan area.
MD 197 (LAUREL BOWIE/COLLINGTON ROAD)
MD 197 extends approximately 12 miles within the master plan area. In relation to the master plan area focus areas, the MD 197 corridor effectively connects the Bowie Local Town Center with BSU and is considered a minor arterial. MD 197 is a divided four-lane highway for much of its extent within the master plan area, however, it is a two-lane road in some portions.
MD 197 acts as the main connection between the cities of Bowie and Laurel, a jurisdiction of almost 26,000 people at the northernmost tip of the County.13 Most of this minor arterial—extending from its intersection with MD 450 up to the city of Laurel—is called Laurel Bowie Road. Further south it is called Collington Road in the stretch between MD 450 and US 301.
The master plan area’s MD 197 corridor runs from the intersection of Old Laurel Bowie Road at the northern end down to the intersection of US 301 at the southern end. The northern end of the corridor is primarily comprised of forested land, with the BSU and MARC Station campus center being relatively isolated from other residential and commercial development within the master plan area. The majority of the corridor’s
11 This site was vacated in May 2020, and is currently for sale—Building Size: 762,488 SF; Total Lot Size: 157.53 Acres.
12 These corridors are not to be confused with the seven general plan corridors designated in The 2002 Prince George’s County Approved General Plan, none of which fall within the master plan area.
13 “Laurel, MD | Data USA.” n.d. Accessed March 24, 2020. https://datausa.io/profile/geo/laurel-md.
• Prince George’s County Planning Department
Sources: GIS Data Catalogue, Prince George’s County Planning Department, M-NCPPC.
single-family housing communities are to the east, complemented by neighborhood schools that serve local students such as Rockledge Elementary, Whitehall Elementary, Tulip Grove Elementary, and Benjamin Tasker Middle schools.
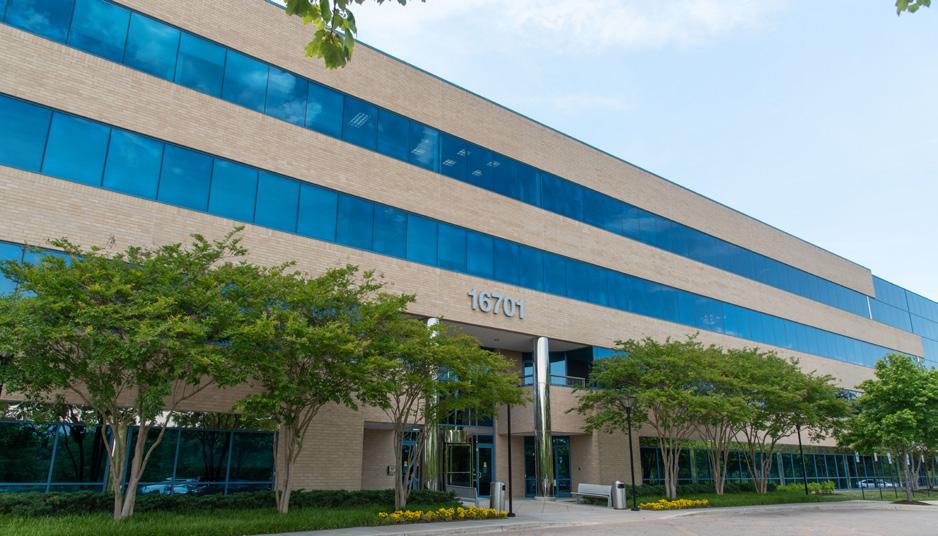
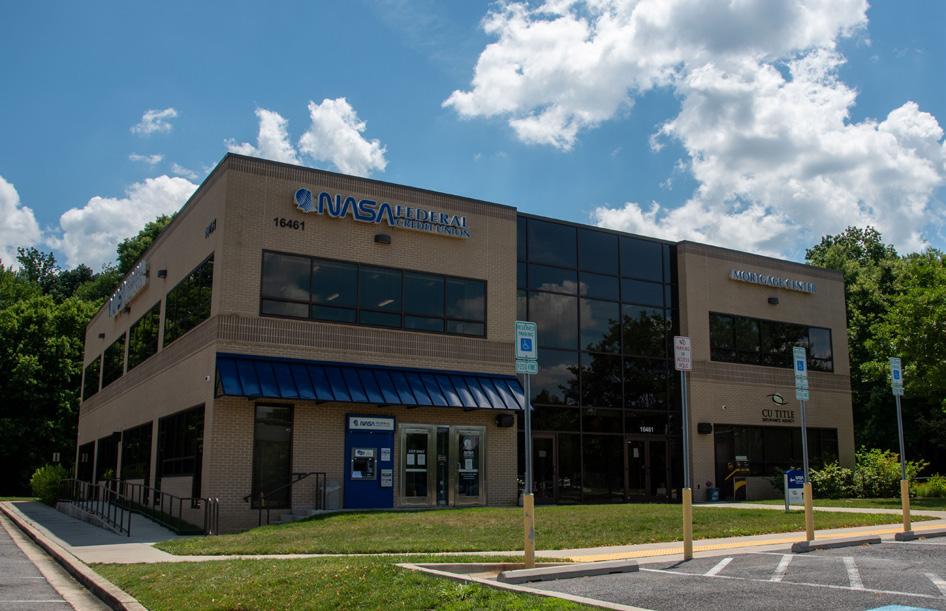
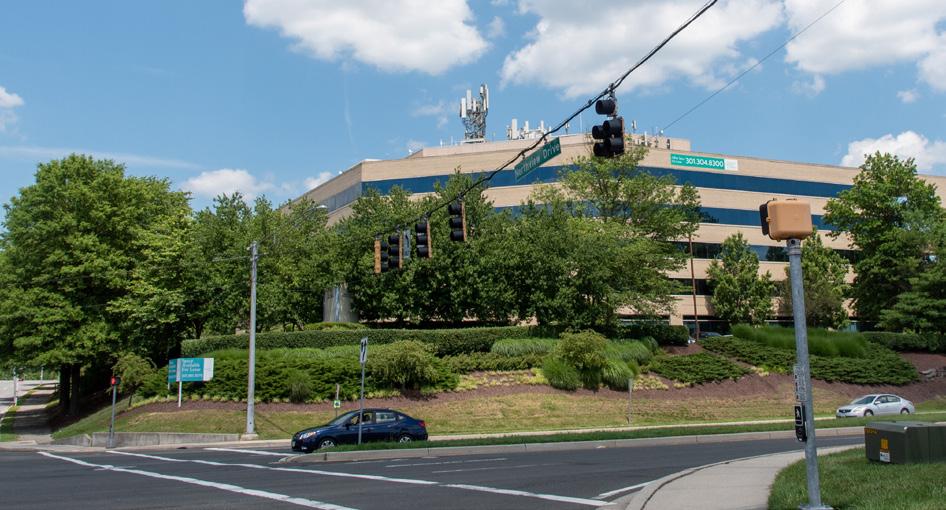
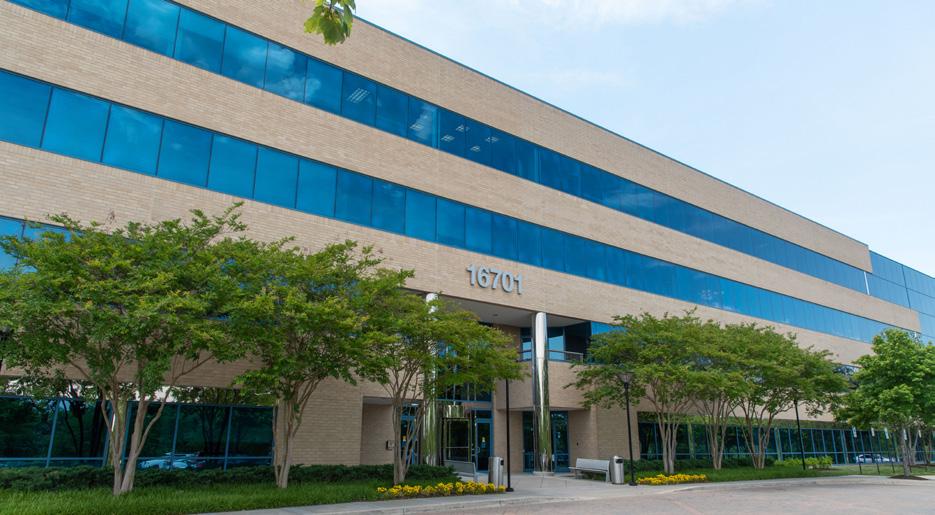
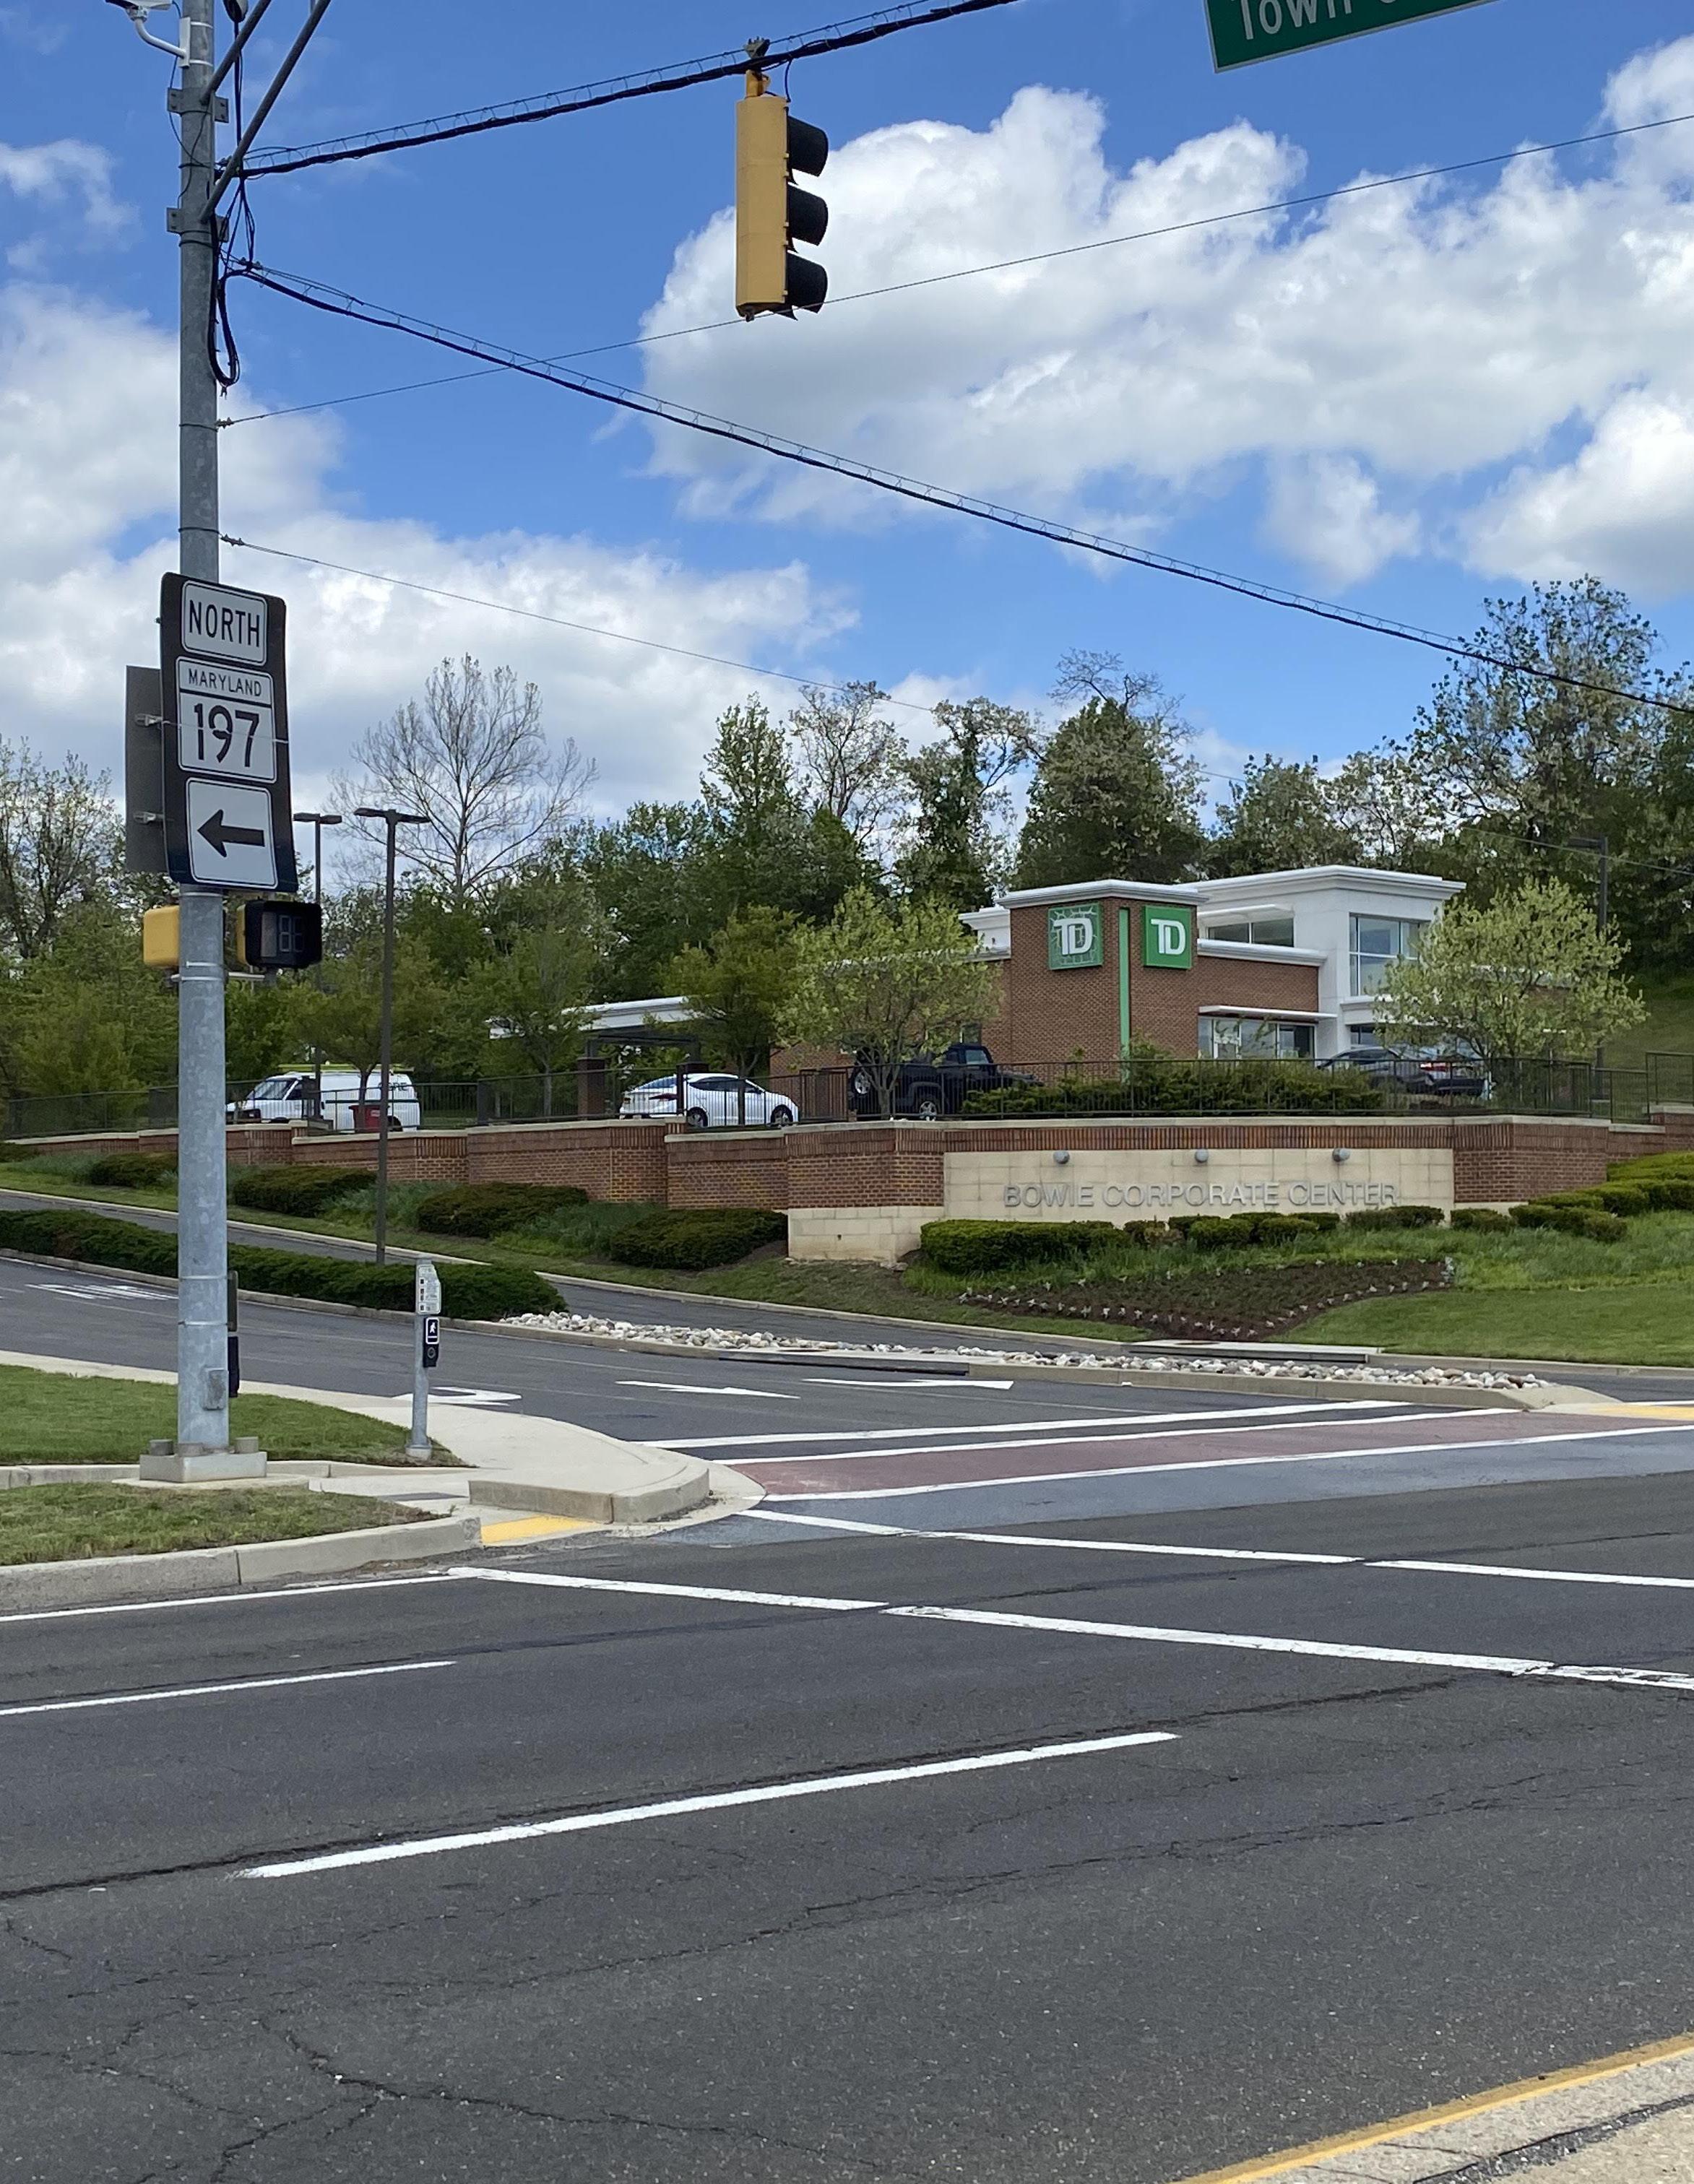
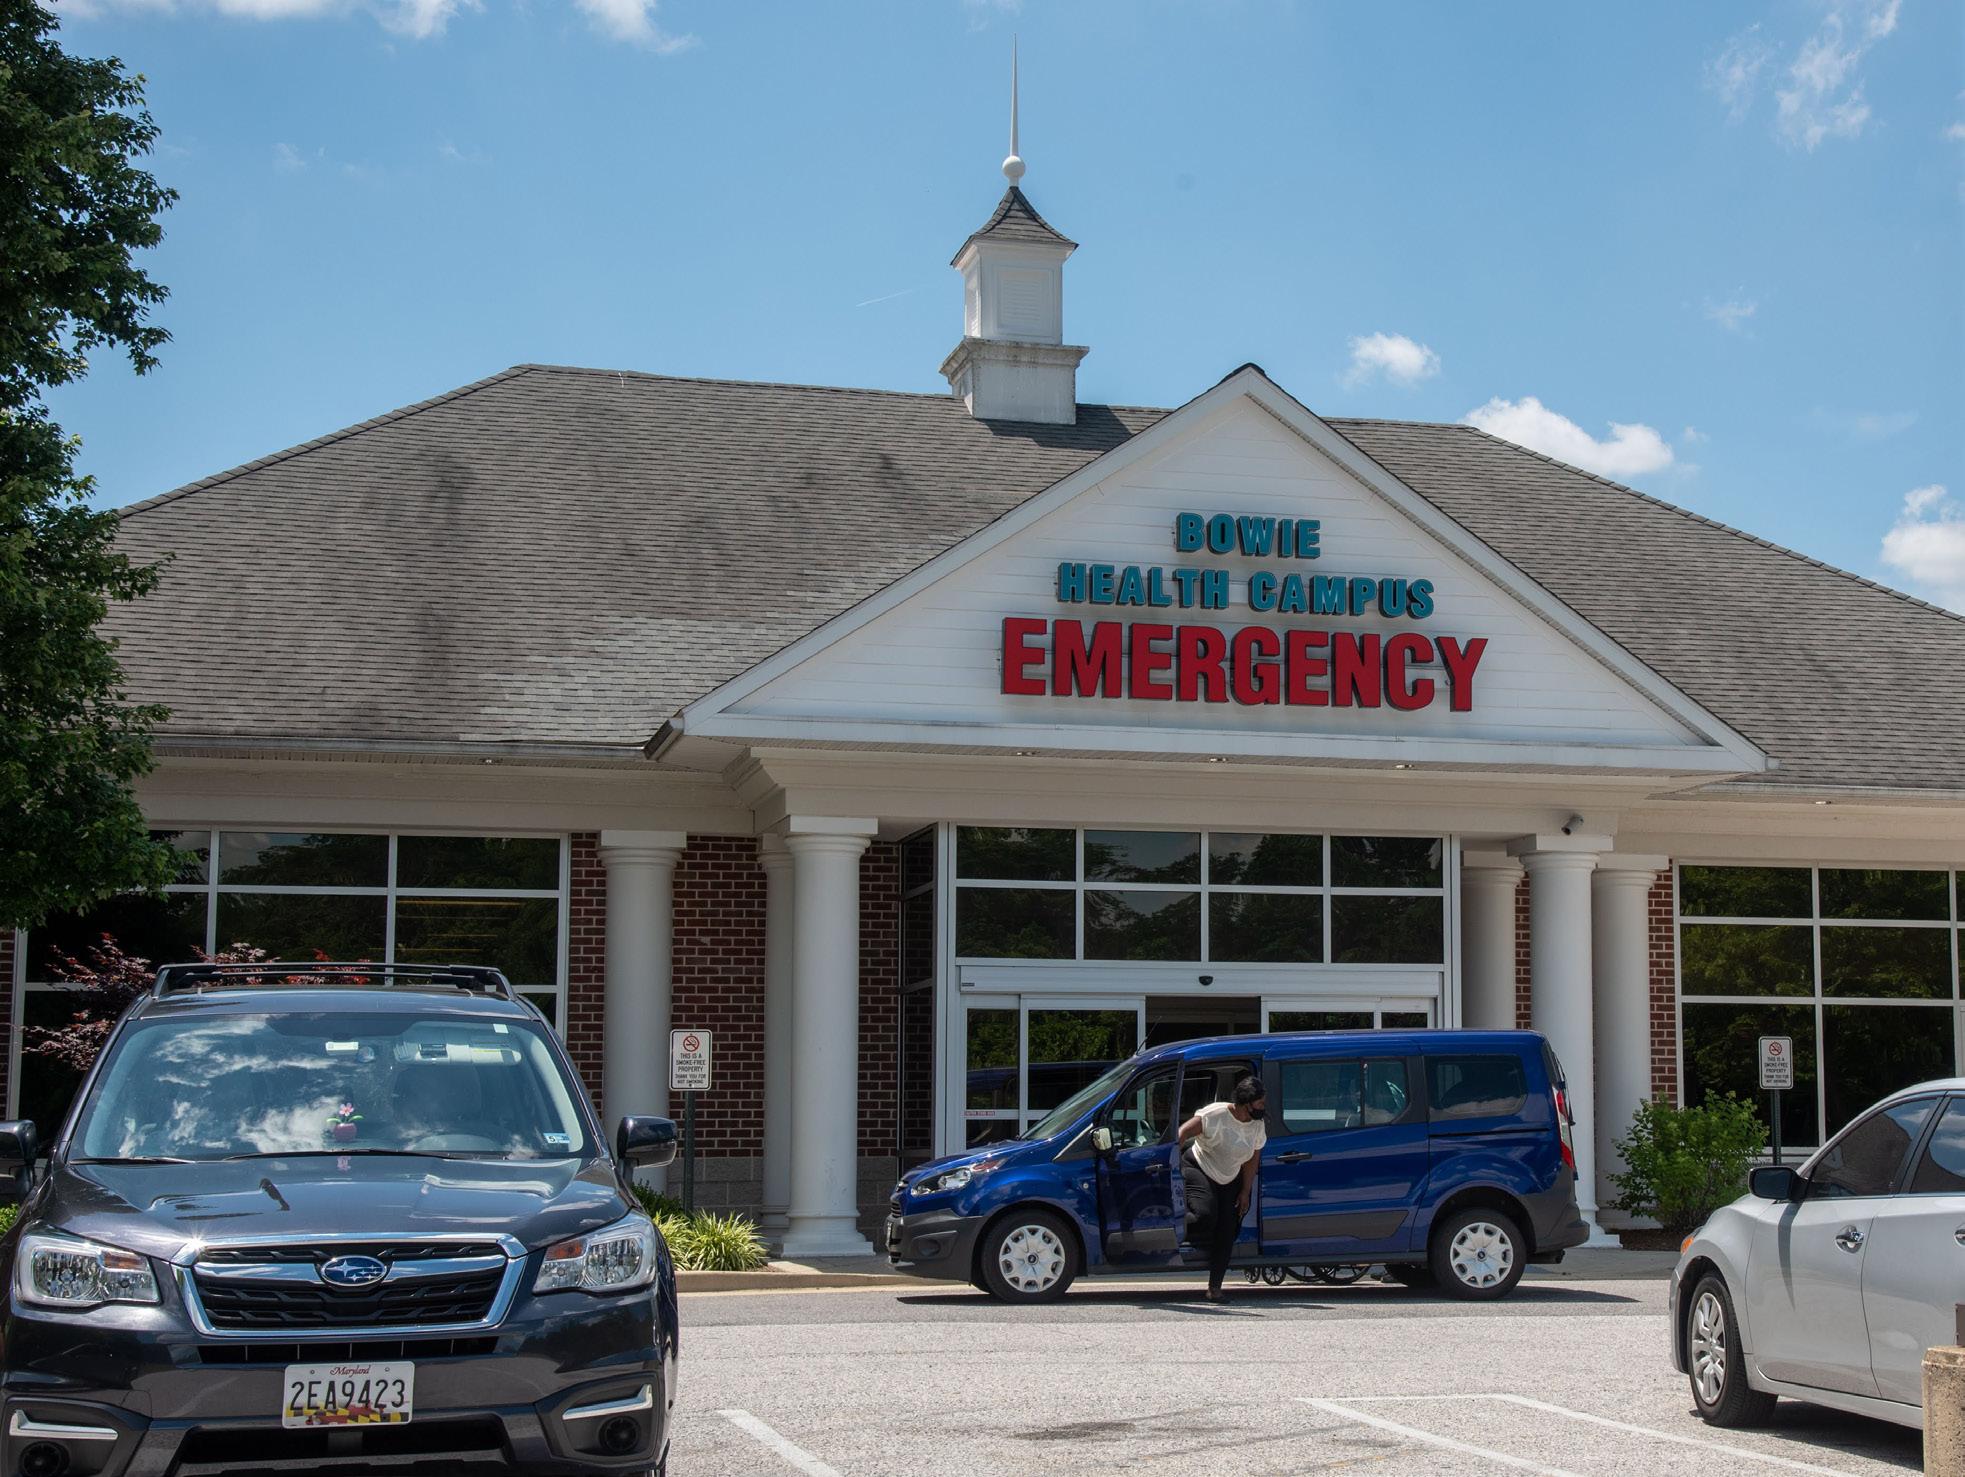
West of the corridor lies Bowie Golf Club, an 18-hole golf course open to the public year-round, as well as Bowie Plaza, a 103,000-square-foot shopping center built in 1966 that presents an opportunity for redevelopment which would allow for increased development infill on the northern end of the corridor. At the southern end of the corridor lies the UM Bowie Health Center, which serves approximately 40,000 patients annually, as well as the 126,000-square-foot Bowie Corporate Center built in 2006. To the south of Collington Road,
at the southernmost end of the corridor, is Bowie Town Center strip, an outdoor shopping mall that opened in November 2001. The outdoor mall comprises almost 80 retail stores and includes tenants such as Safeway, LA Fitness, Macy’s, and Best Buy.
Adjacent to the Bowie Town Center is the City of Bowie’s City Hall building, which was constructed in 2011 and contains 80,000 square feet of office space. At the intersection of the MD 197 and US 301 corridors lies the Covington residential community.
South of Bowie Town Center is Collington Plaza, a 122,000-square-foot retail center anchored by a Giant grocery store and adjacent to a Walmart. Just south of Walmart along the US 301 corridor are a variety of single-family residential communities, in addition to
Lake Development
PrinceGeorgeBlvd
Map 8. Collington Trade Zone
CORRIDOR
A corridor is a planning area that includes the structures that lie along a pathway that connects places. Corridors allow for the movement of people, animals, cars, goods, and more. They may be centered on transportation infrastructure (such as roads or transit lines), or they may follow the route of a natural feature such as a river or other habitat.
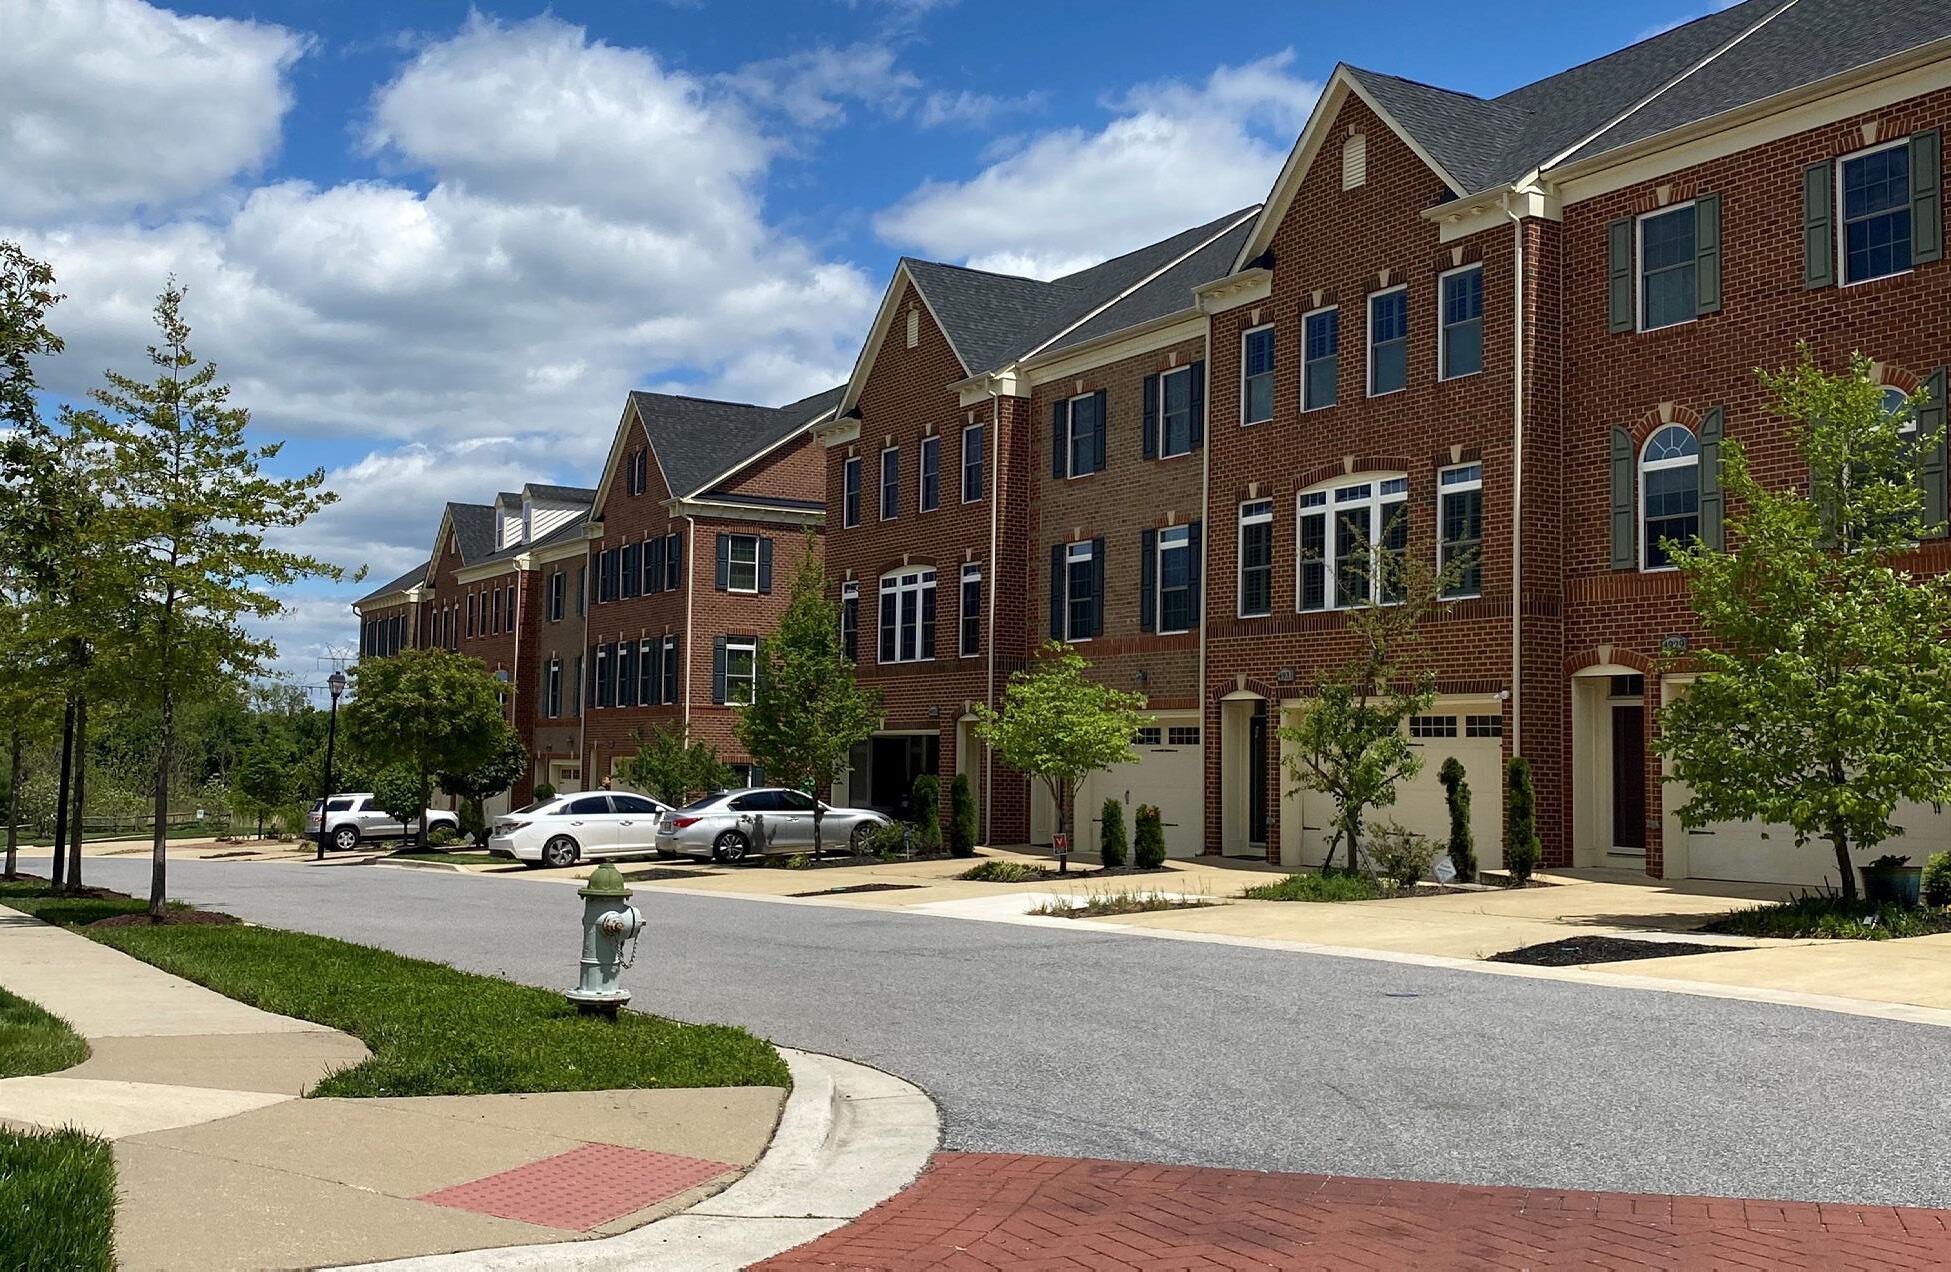
another cluster of automobile dealerships. Pointer Ridge Plaza, a 69,000-square-foot shopping center built in 1966, represents the only cluster of retail along the corridor’s southern end. Current tenants in Pointer Ridge Plaza include Dollar Tree and Sky Zone Trampoline Park. The major mixed-use South Lake development project is planned for development at the intersection of US 301 and Central Avenue. If constructed, the project is envisioned to include 344 detached single-family homes, 563 townhouses, 128 condominiums, 325 multifamily units, 600,000 square feet of office and retail, a 390-key hotel, a 5,272-squarefoot clubhouse, several athletic fields, and a 25-acre park. At the southern end of the corridor is the Collington Trade Zone, an industrial space community that includes distribution centers from companies such as Safeway, Nordstrom, and H Mart.
Prince George’s County Planning Department
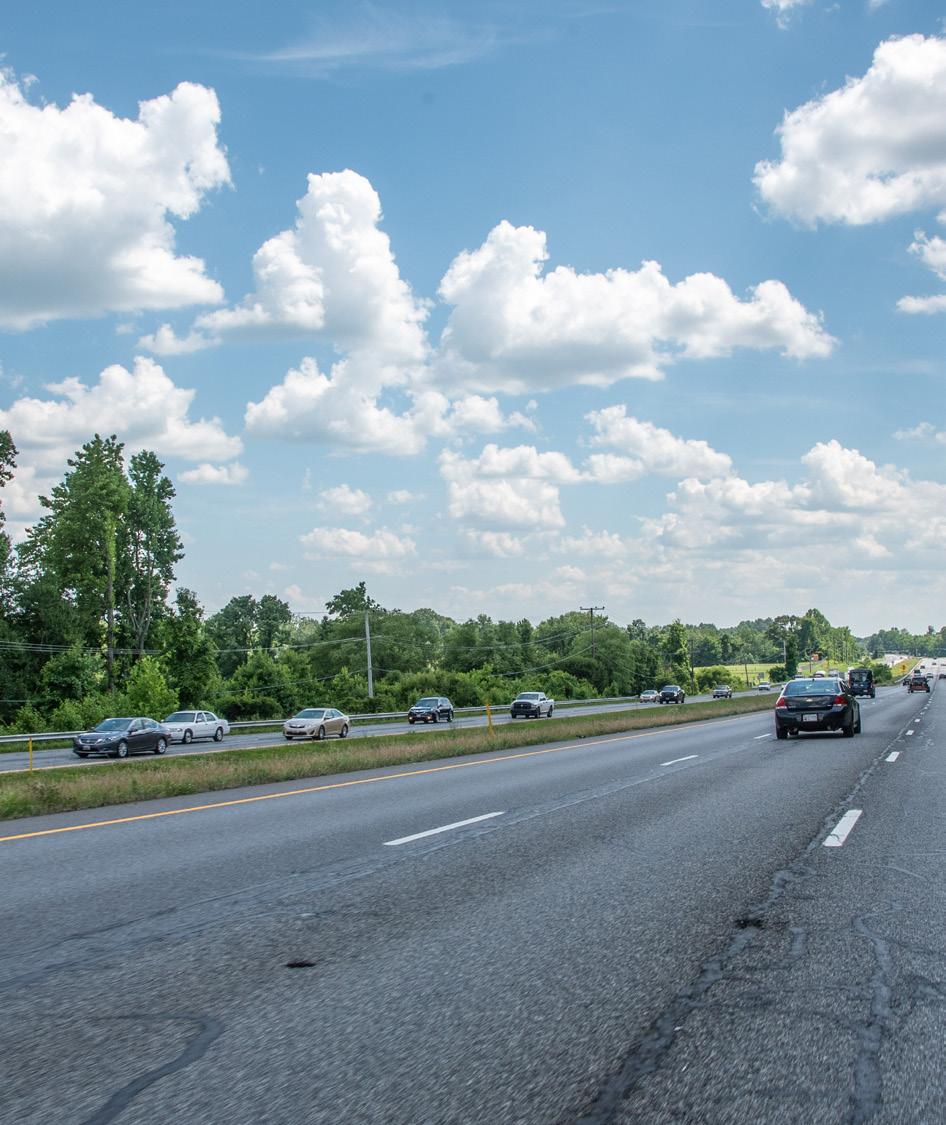
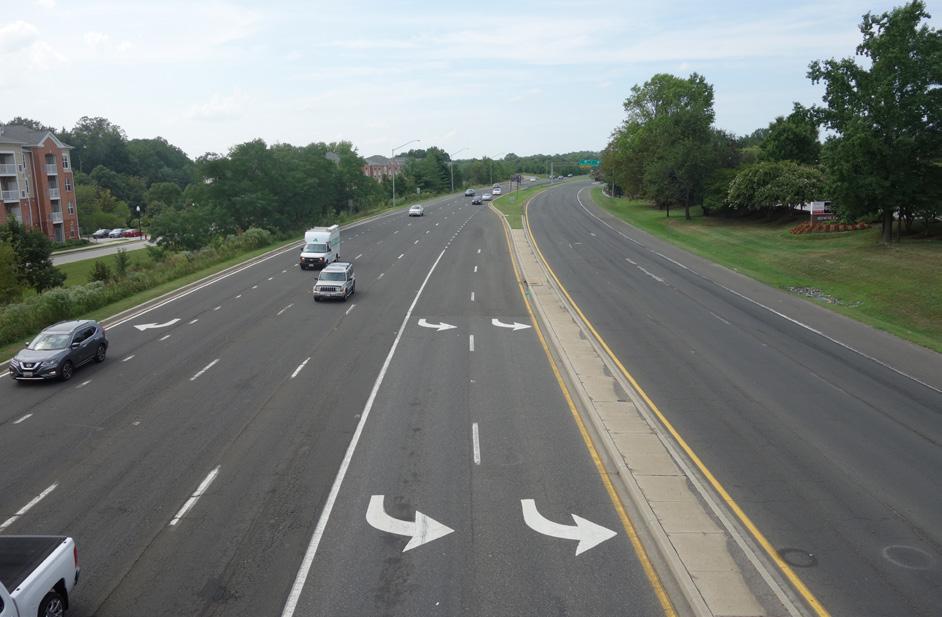
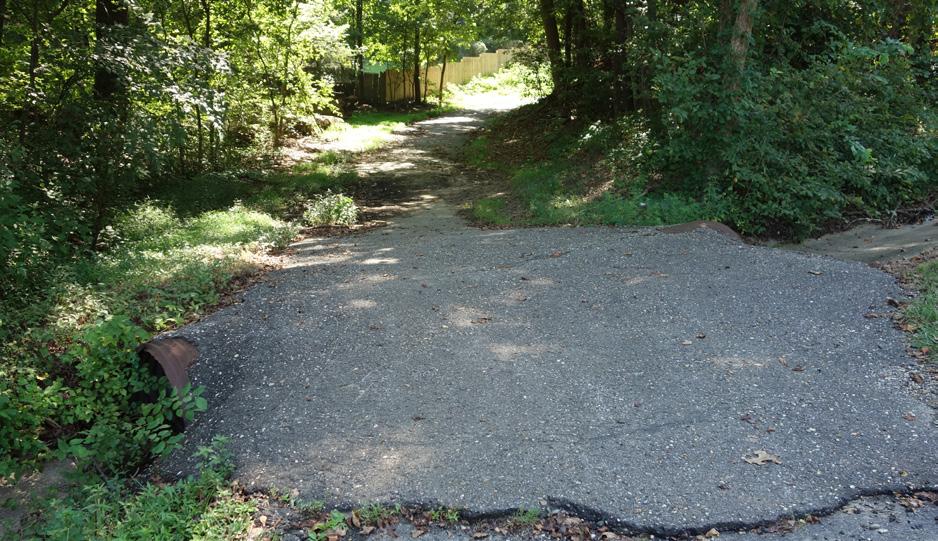
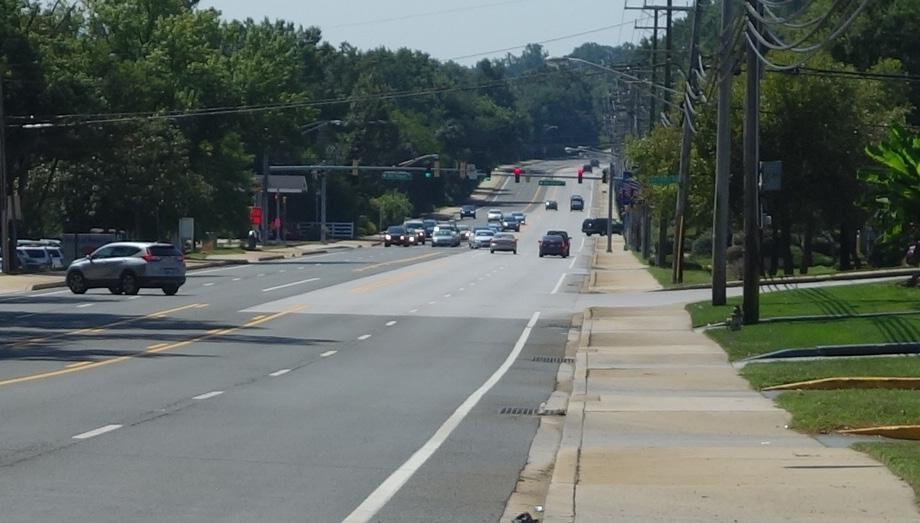
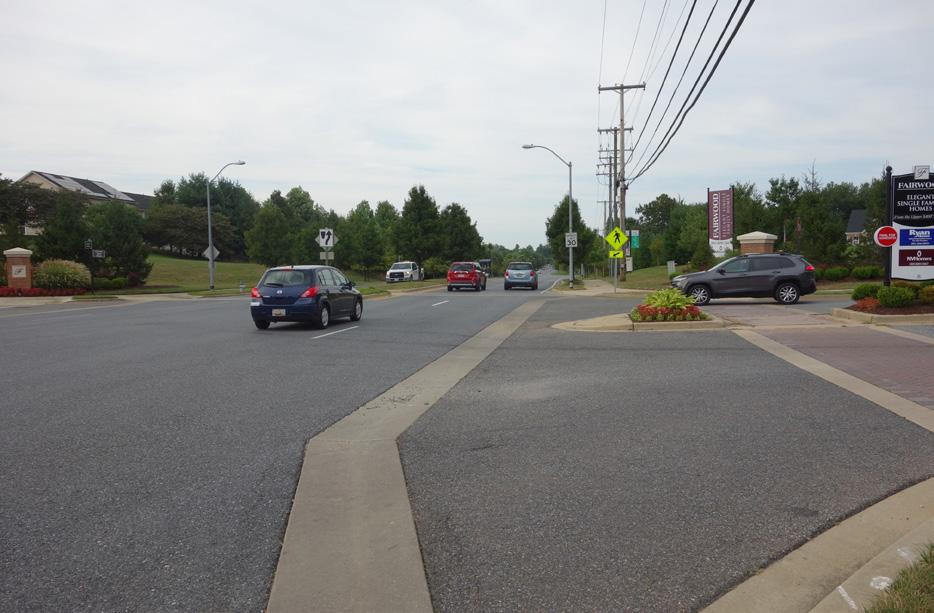
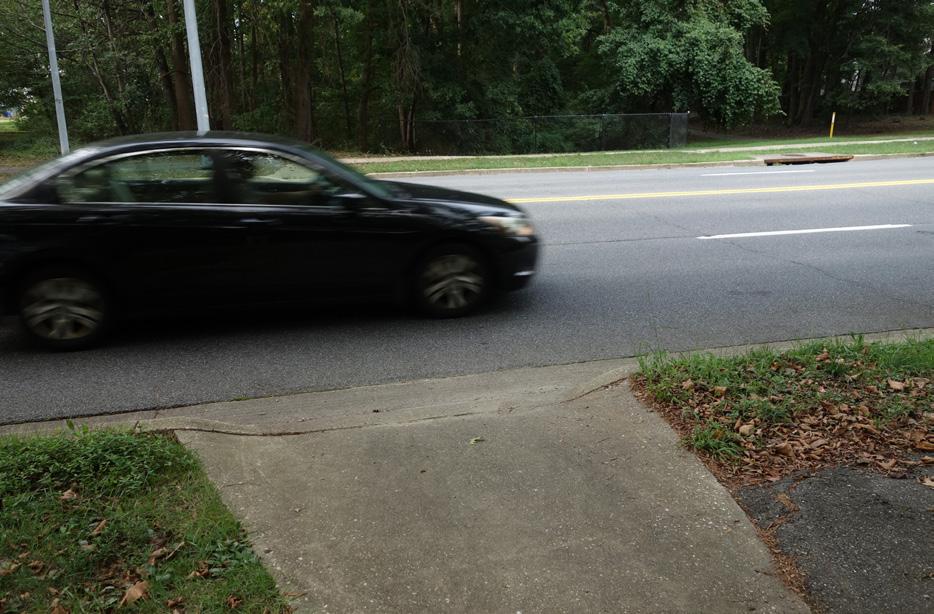
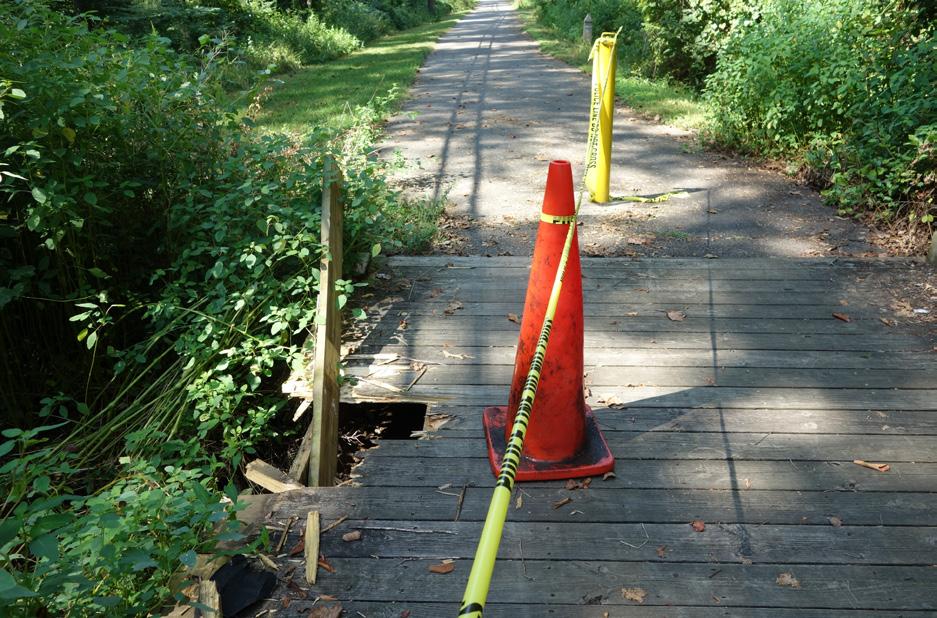
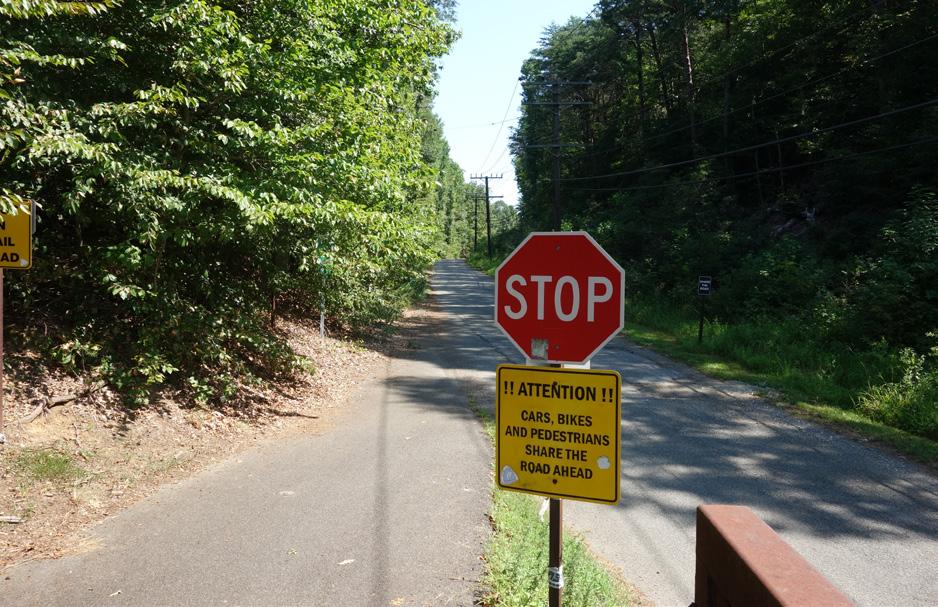
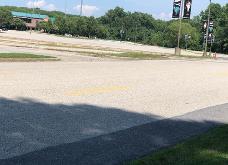
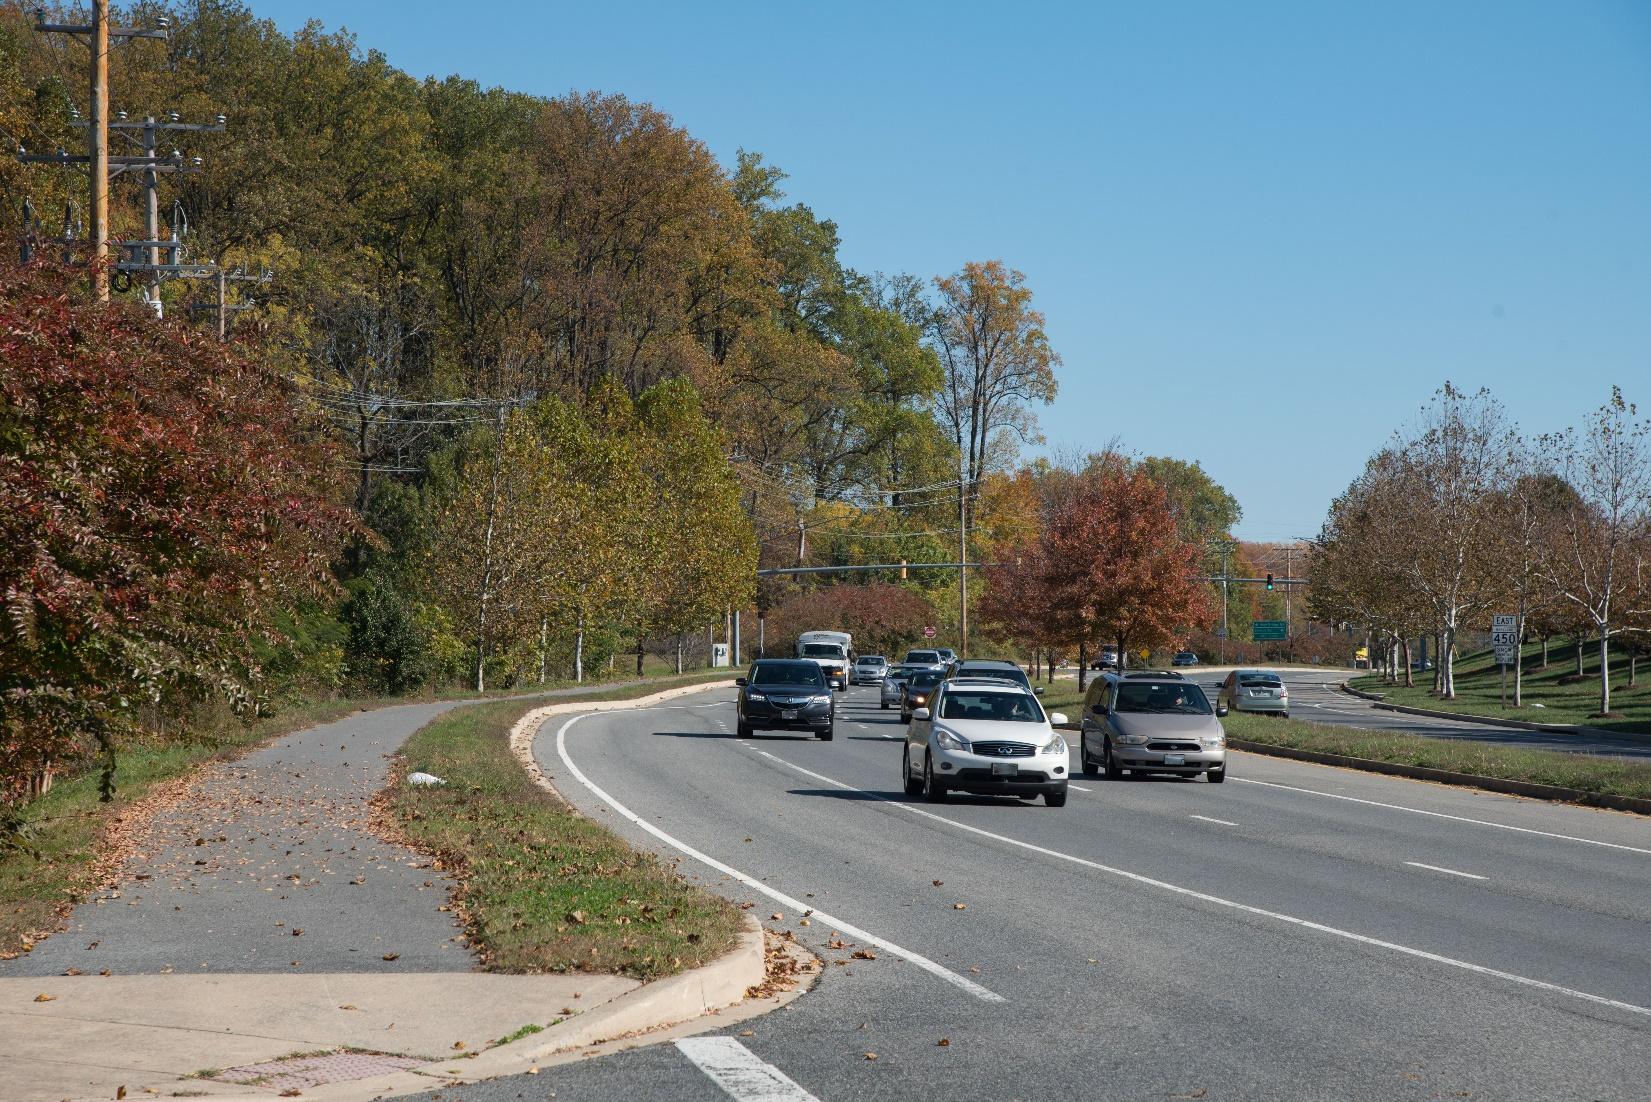
Source: M-NCPPC.
Top: MD 197, facing north near the intersection with US 301/Crain Highway; Bottom: MD 450
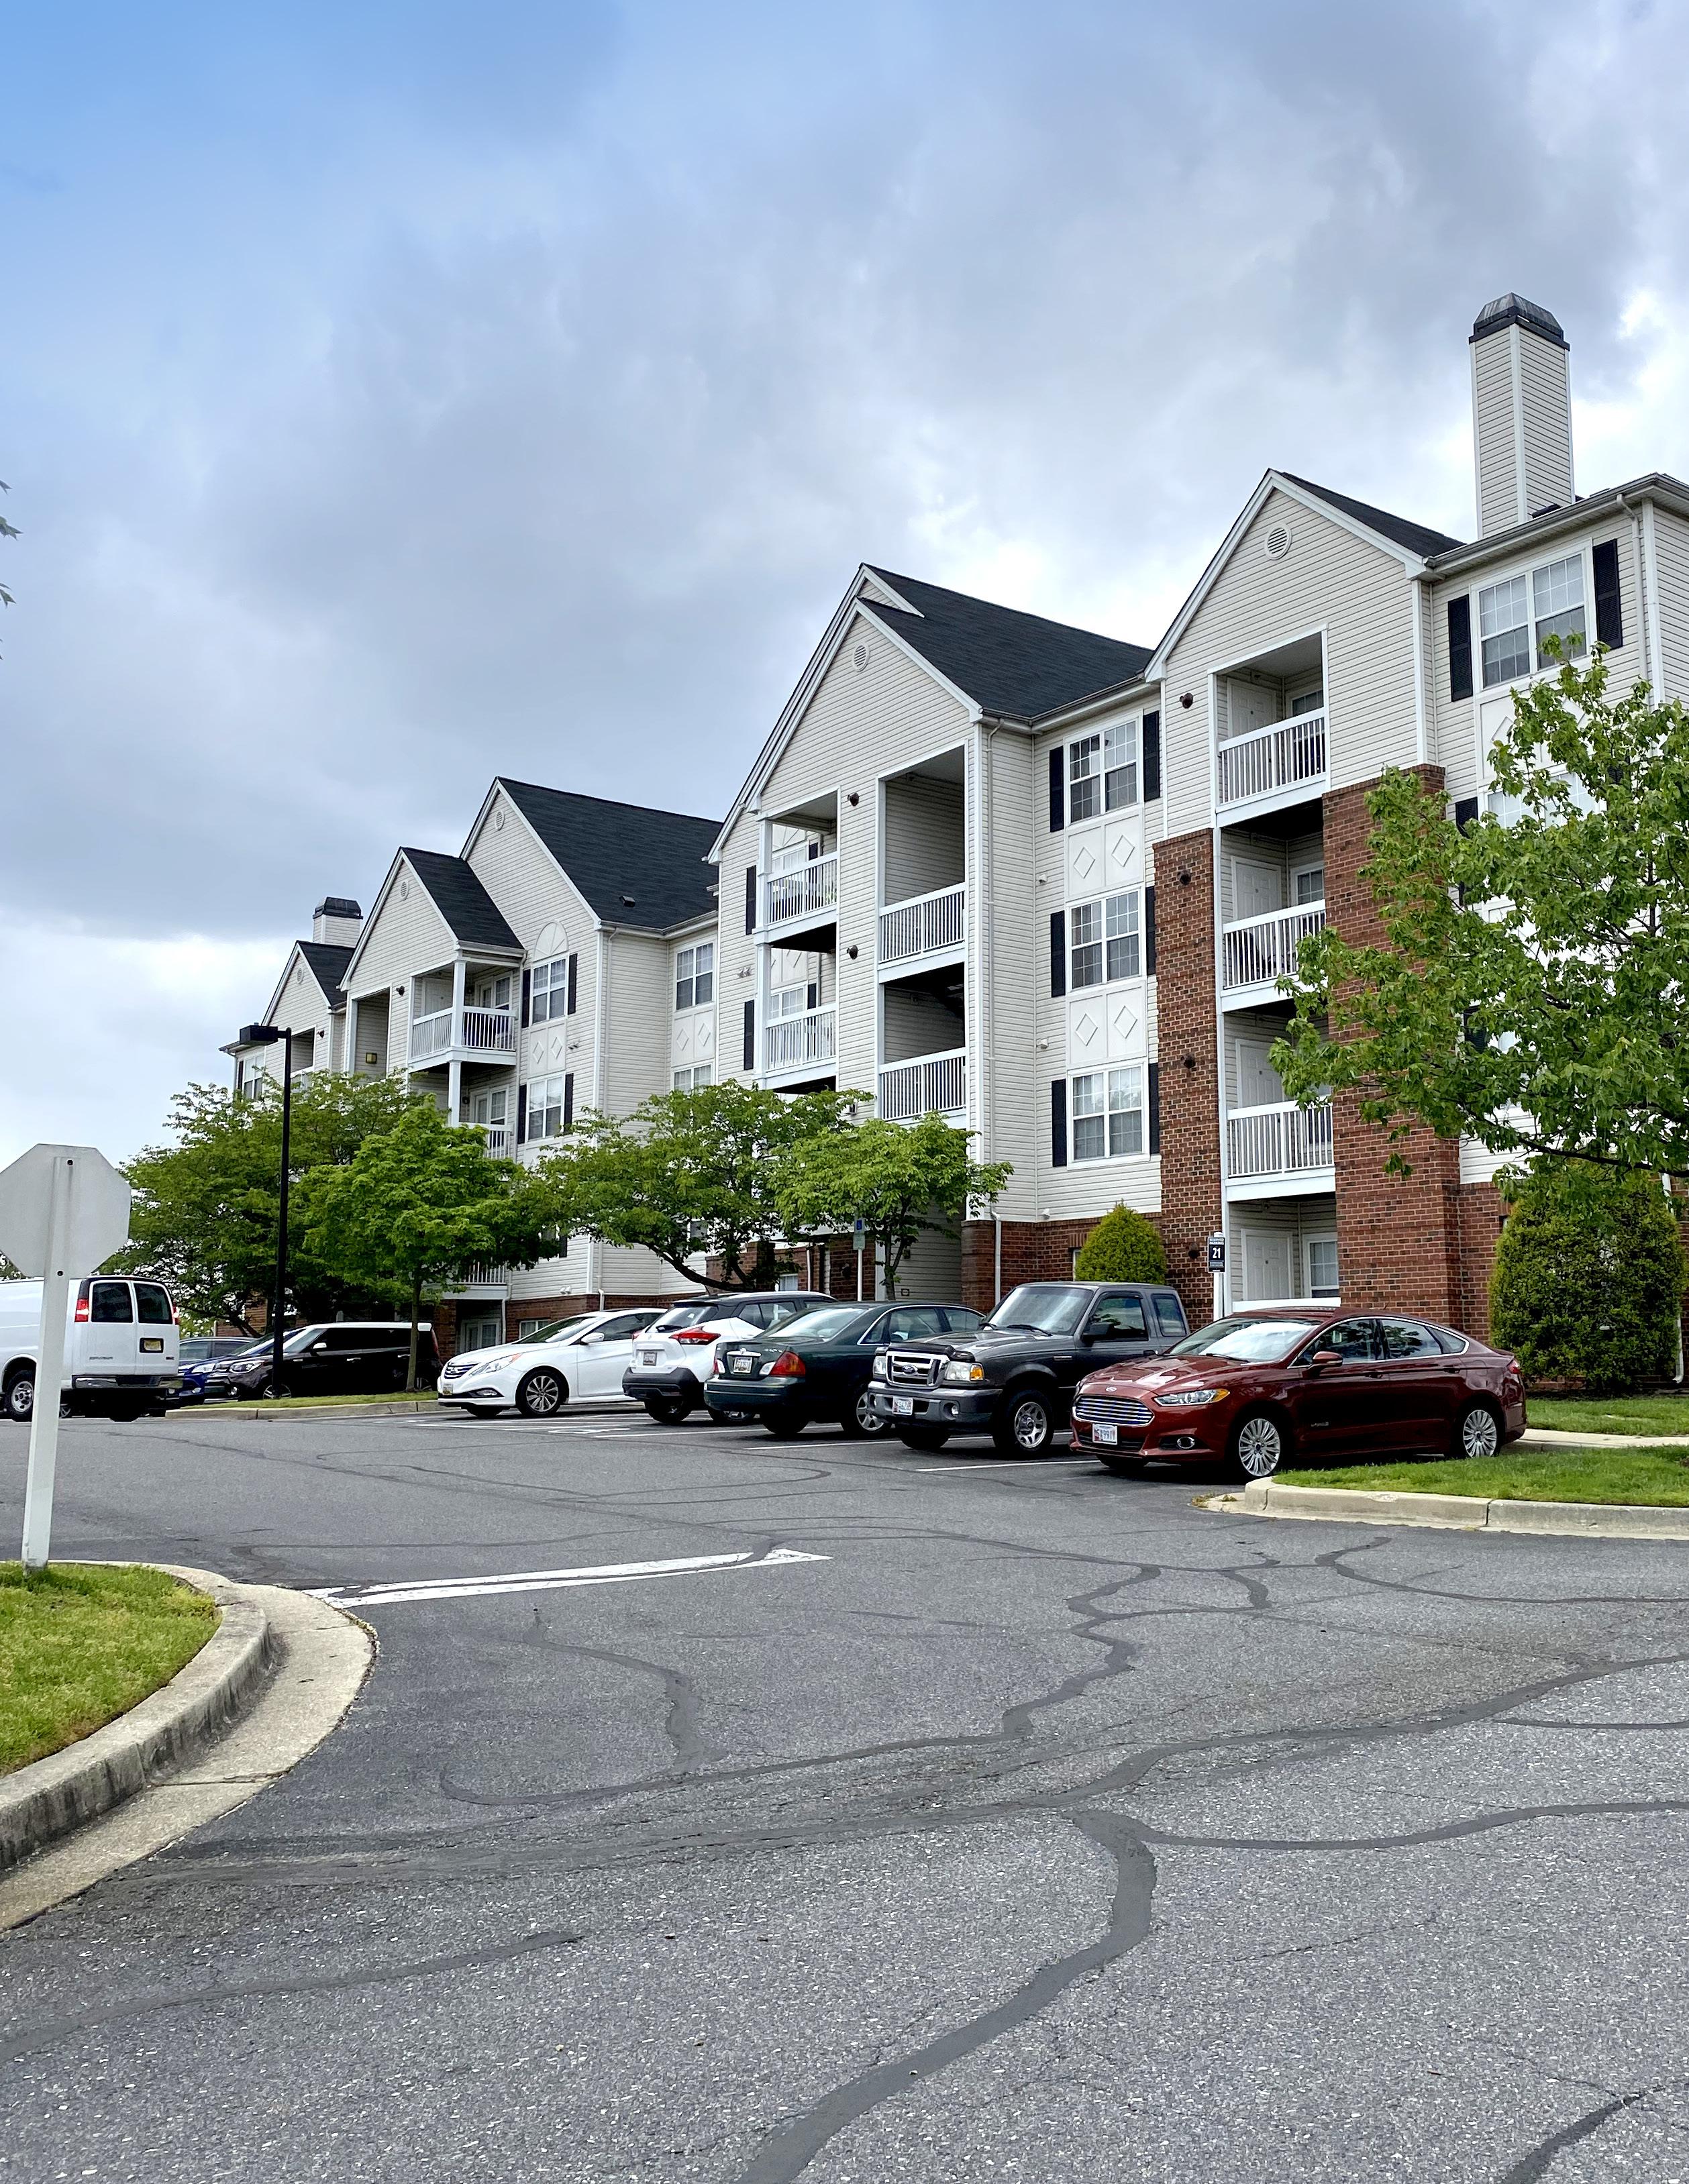
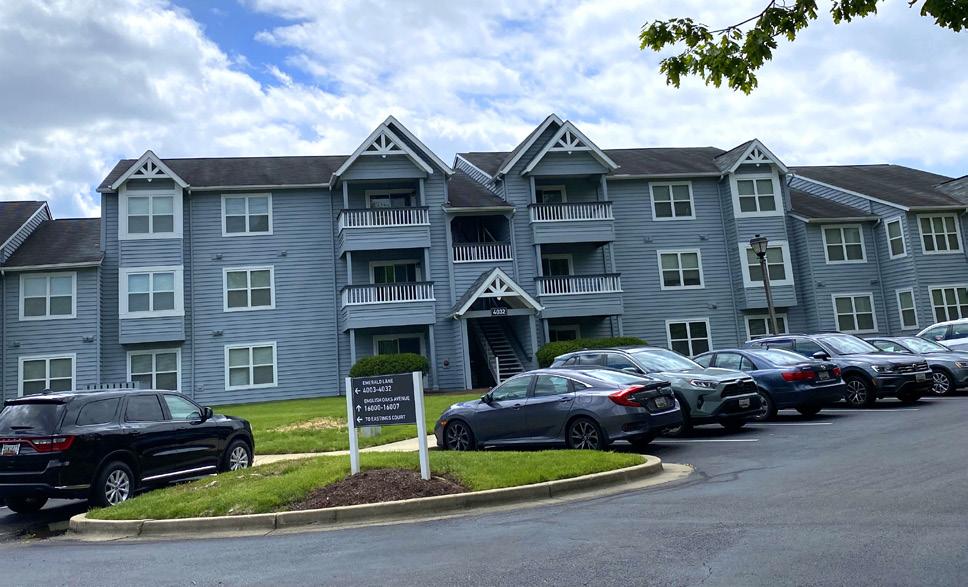
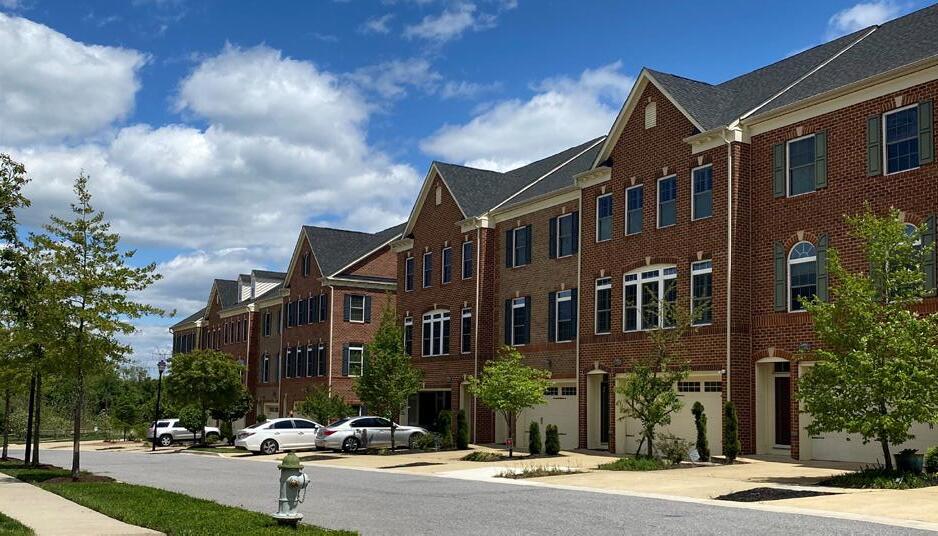
Developed in 1997, Covington is primarily comprised of detached single-family dwelling units in addition to over 400 townhouses. West of Covington lies Heather Ridge Apartments, one of four existing market-rate multifamily buildings in the master plan area, which was constructed in 1987 and includes 324 multifamily units.
MD 450 (ANNAPOLIS ROAD)
MD 450 (also known as John Hanson Highway, and called Annapolis Road within the master plan area) is a state highway that runs east-west from the Town of Bladensburg in western Prince George’s County, to near Arnold, Maryland in Anne Arundel County.
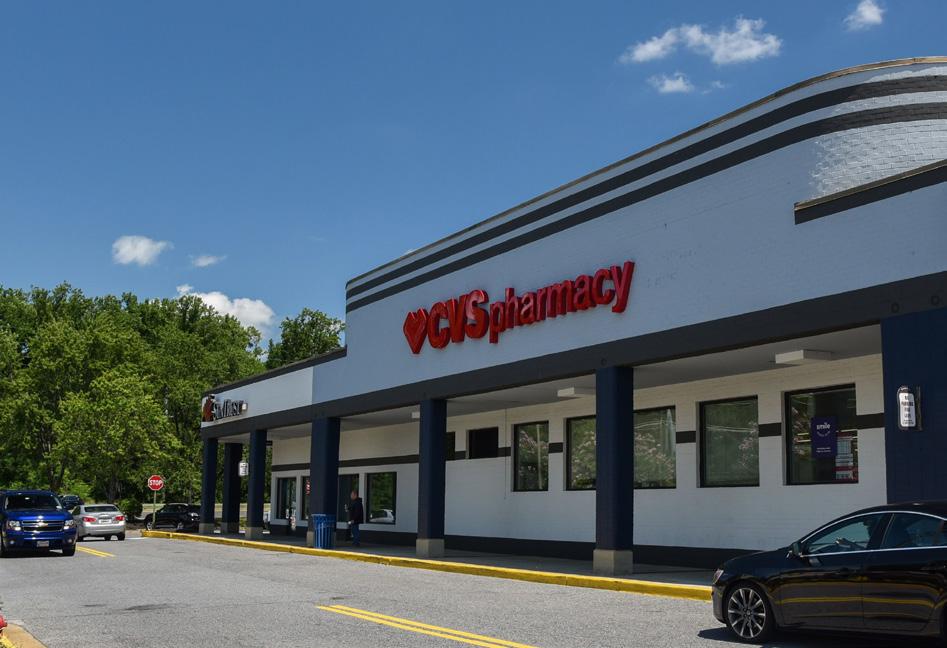
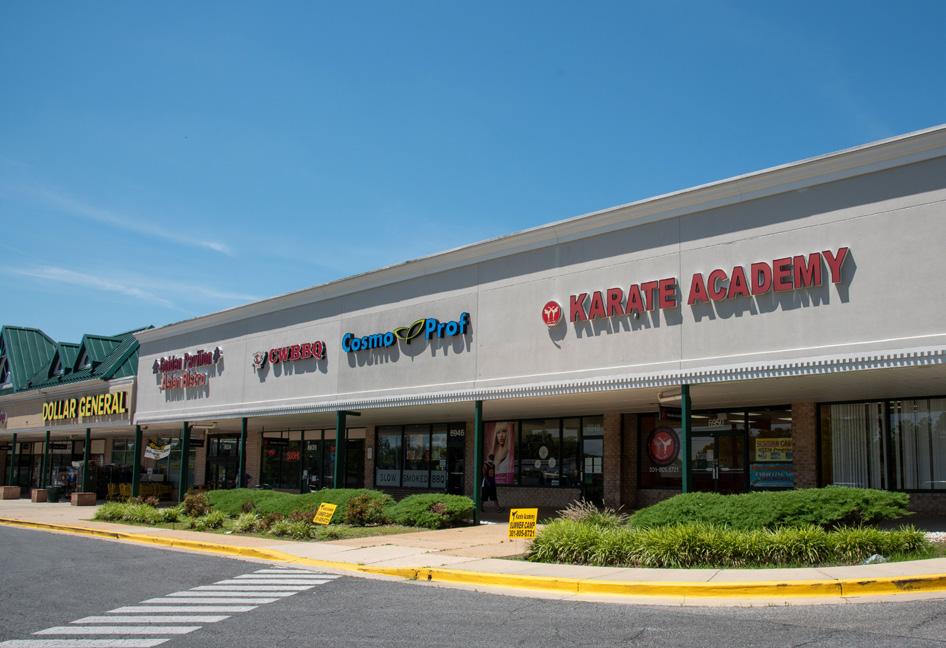
The master plan area’s MD 450 corridor runs from Hillmeade Road on the western end to MD 3 on the eastern end. On the western end of the corridor, to the west of MD 197, is an area of primarily single-family residential homes with a small portion of neighborhood retail. Lidl is one of five grocery stores located along the corridor and was built in 2018 with 31,000 square feet. To the north of Lidl lies a small selection of neighborhood retail which includes tenants such as CVS, Texas Roadhouse, and Baskin Robbins.
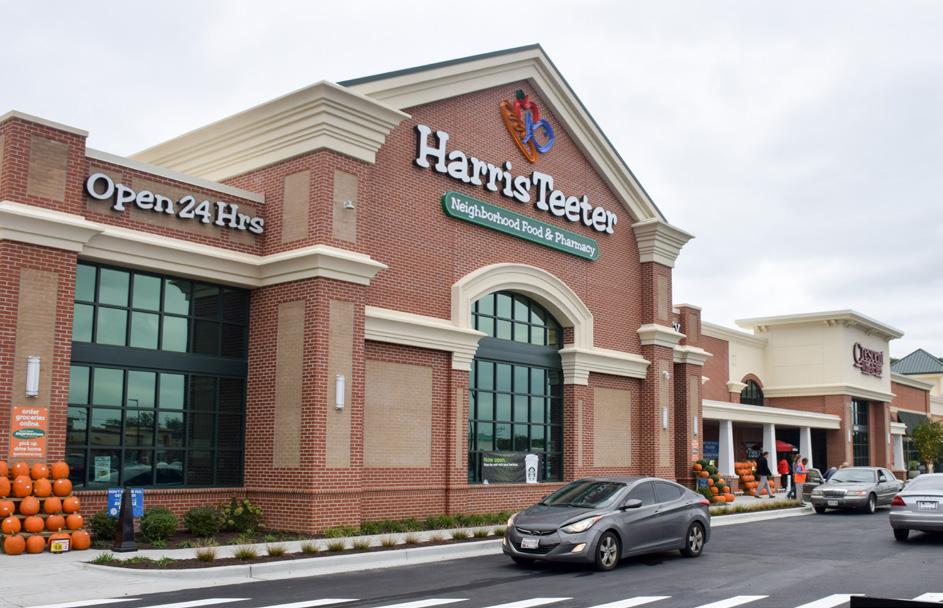
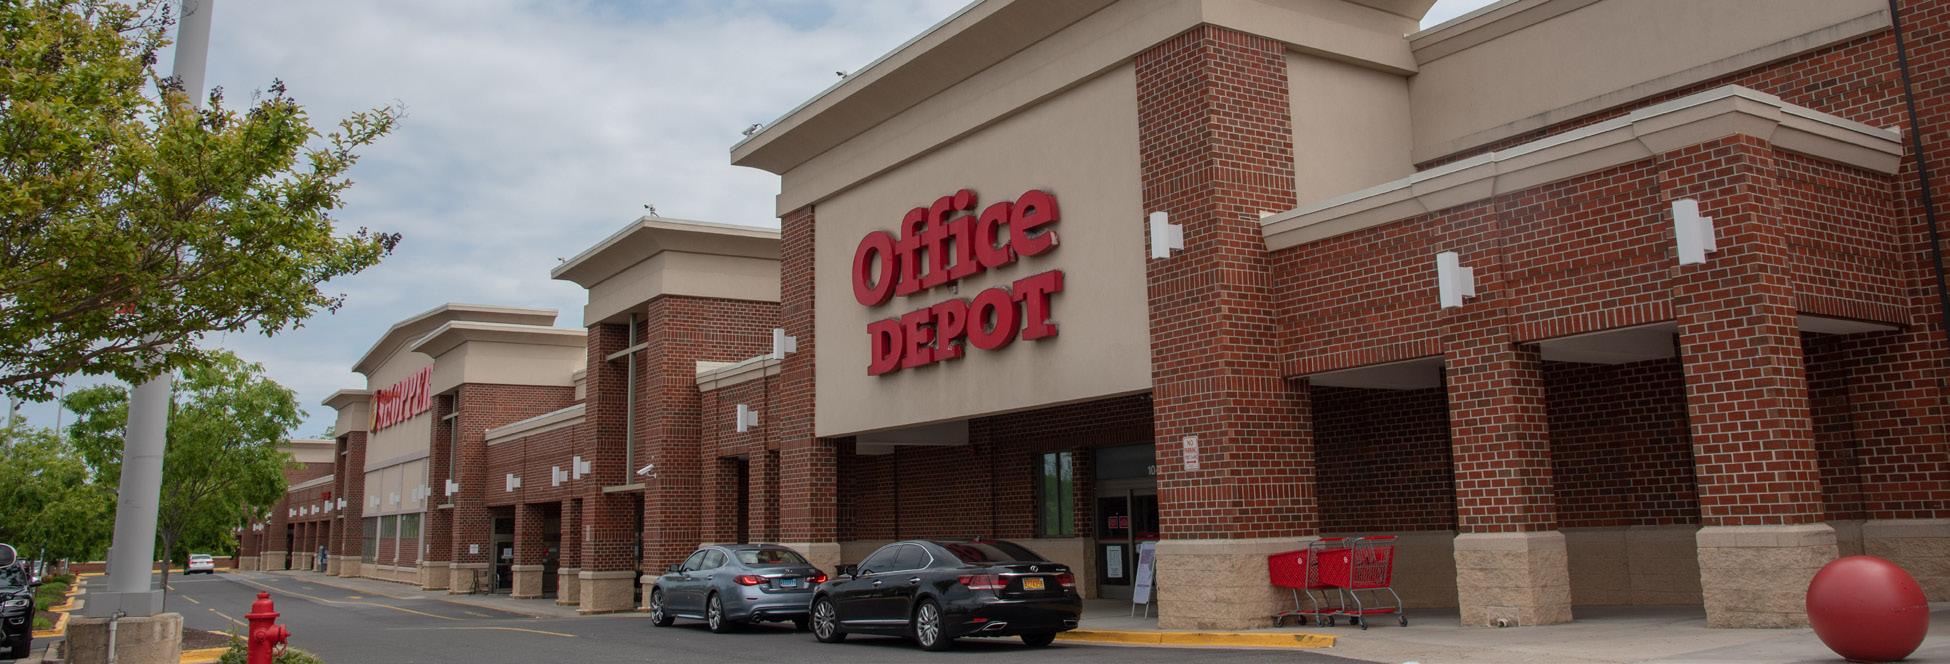
The corridor’s eastern end contains more single-family residential neighborhoods in addition to Bowie High School, a public high school with a total student body of more than 2,500 students. To the east of Bowie High School is Free State Shopping Center, a 264,000 squarefoot retail center renovated in 2006. Anchor tenants within the shopping center include Giant, Office Depot, Ross Dress for Less, and TJ Maxx. Directly south of Free State Shopping Center is Bowie Marketplace, a 135,000-square-foot retail center built in 2016. Anchored by Harris Teeter, the shopping center is a $22 million redevelopment of the old Marketplace shopping center and features several restaurants and other retail businesses. Hilltop Plaza Shopping Center is the third retail center west of MD 197 and is anchored by MOM’s Organic Market and Aldi grocery stores. The shopping center was renovated in 2011 and comprises 186,000 square feet of retail space.
Within the master plan area, MD 450 forms a link between Bowie Local Town Center and the established communities to the west, including the Mitchellville subdivision. MD 450 is considered a principal arterial.
US 301/MD 3 (CRAIN HIGHWAY)
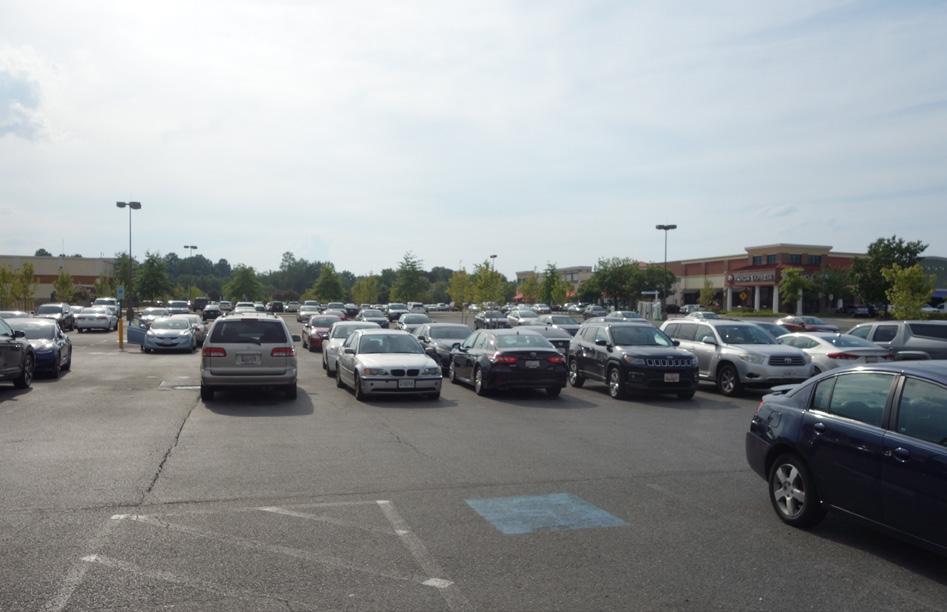
The master plan area’s US 301/MD 3 corridor runs from the intersection of MD 450 at the northern end, down to the intersection of Leeland Road at the southern end. The northern end of the corridor is largely comprised of forested land and is home to Whitemarsh Park, which includes a playground, baseball field, football field, community theater, and biking trails. The planned Melford Town Center—a 466-acre mixed-use community that will include 1,500 multifamily units, 140 senior living units, 300 townhouses, 260,000 square feet of office, 85,000 square feet of retail, and three hotels—is located northeast of intersection MD 3 and US 50. South of Melford Town Center is Bowie Town Center, which is home to the largest concentration of retail in the master plan area. Bowie Town Center largely consists of big-box anchor tenants with large surface parking lots. As well as automobile dealerships, restaurants, and fast-casual dining options.
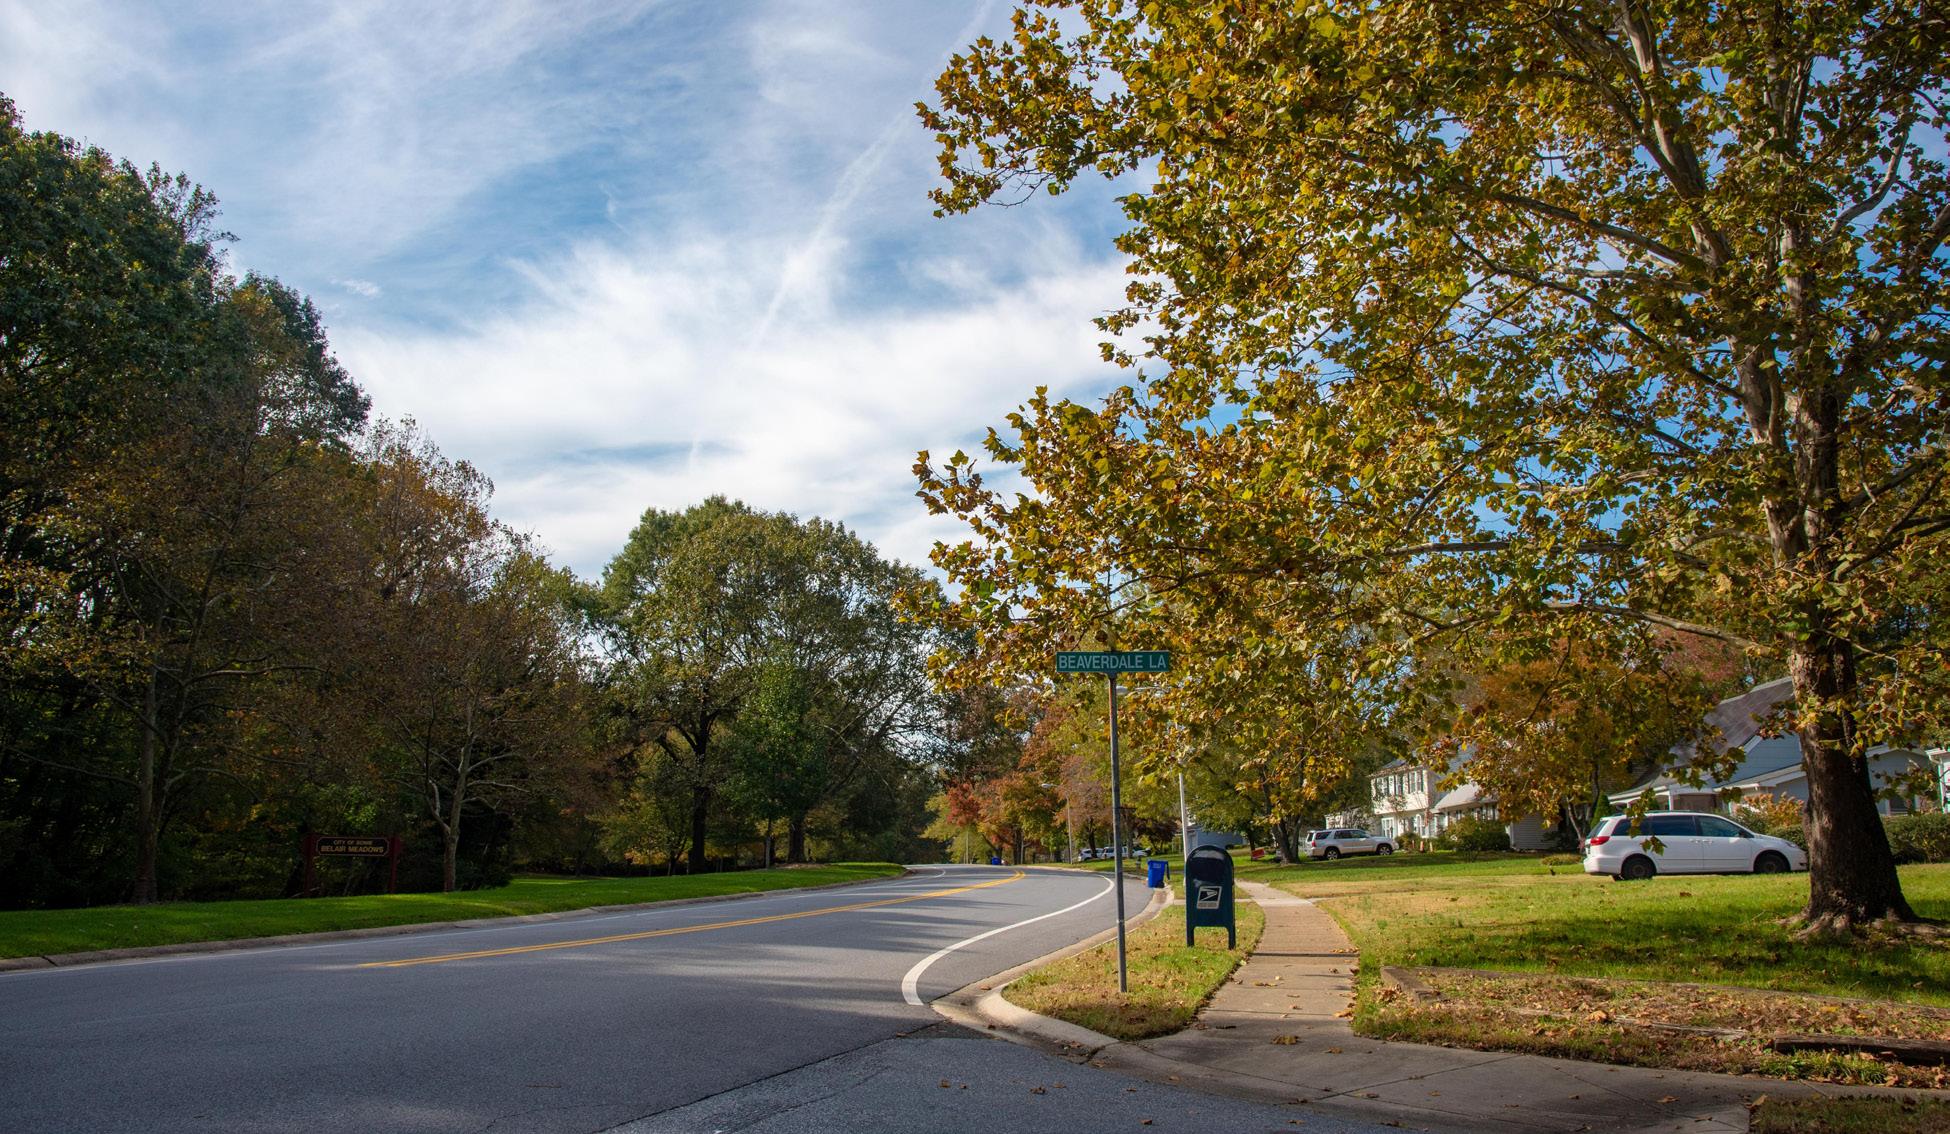
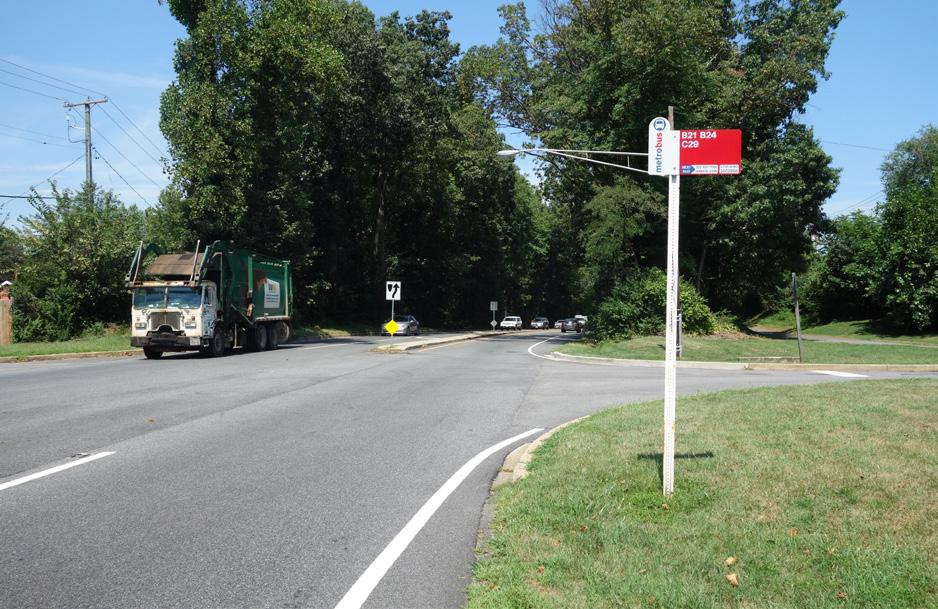
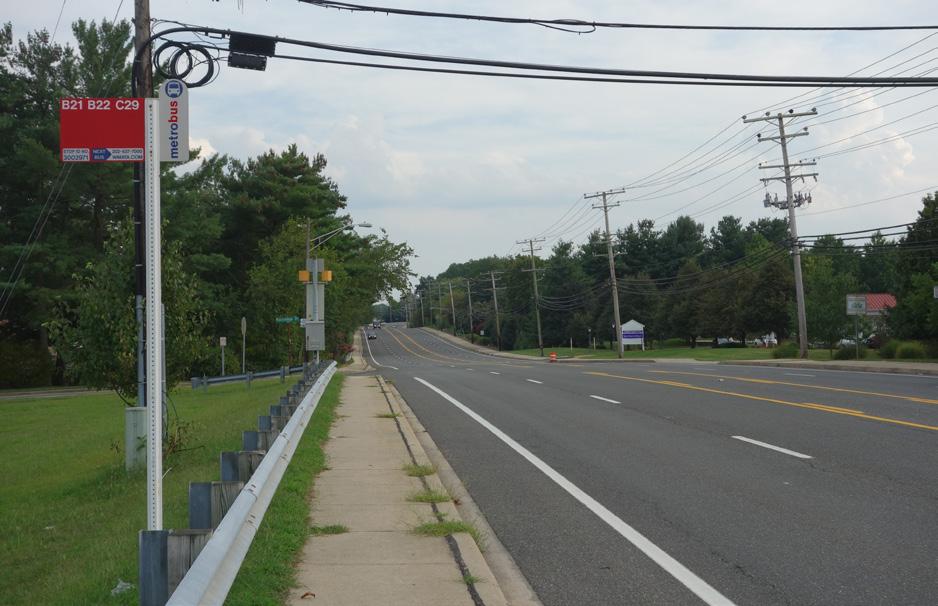
Source: M-NCPPC.
US 301 near Trade Zone Avenue
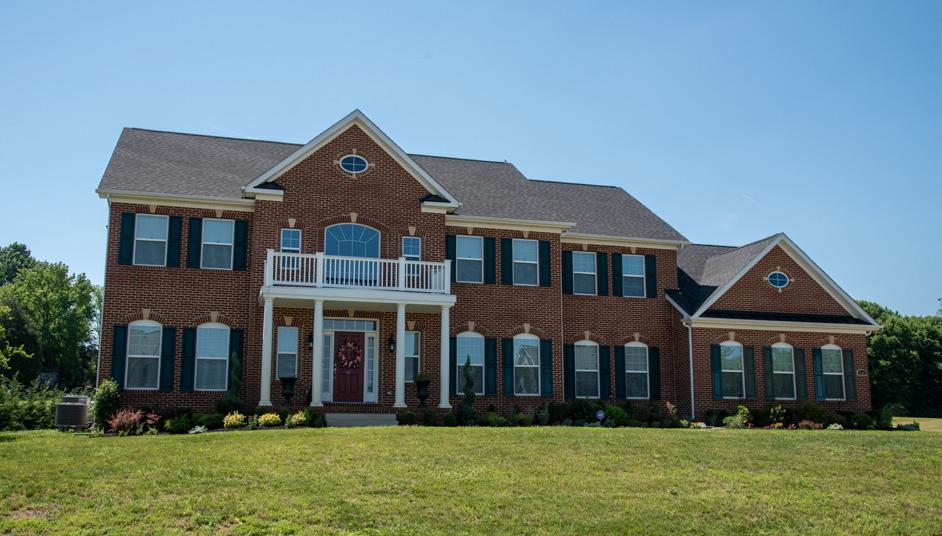
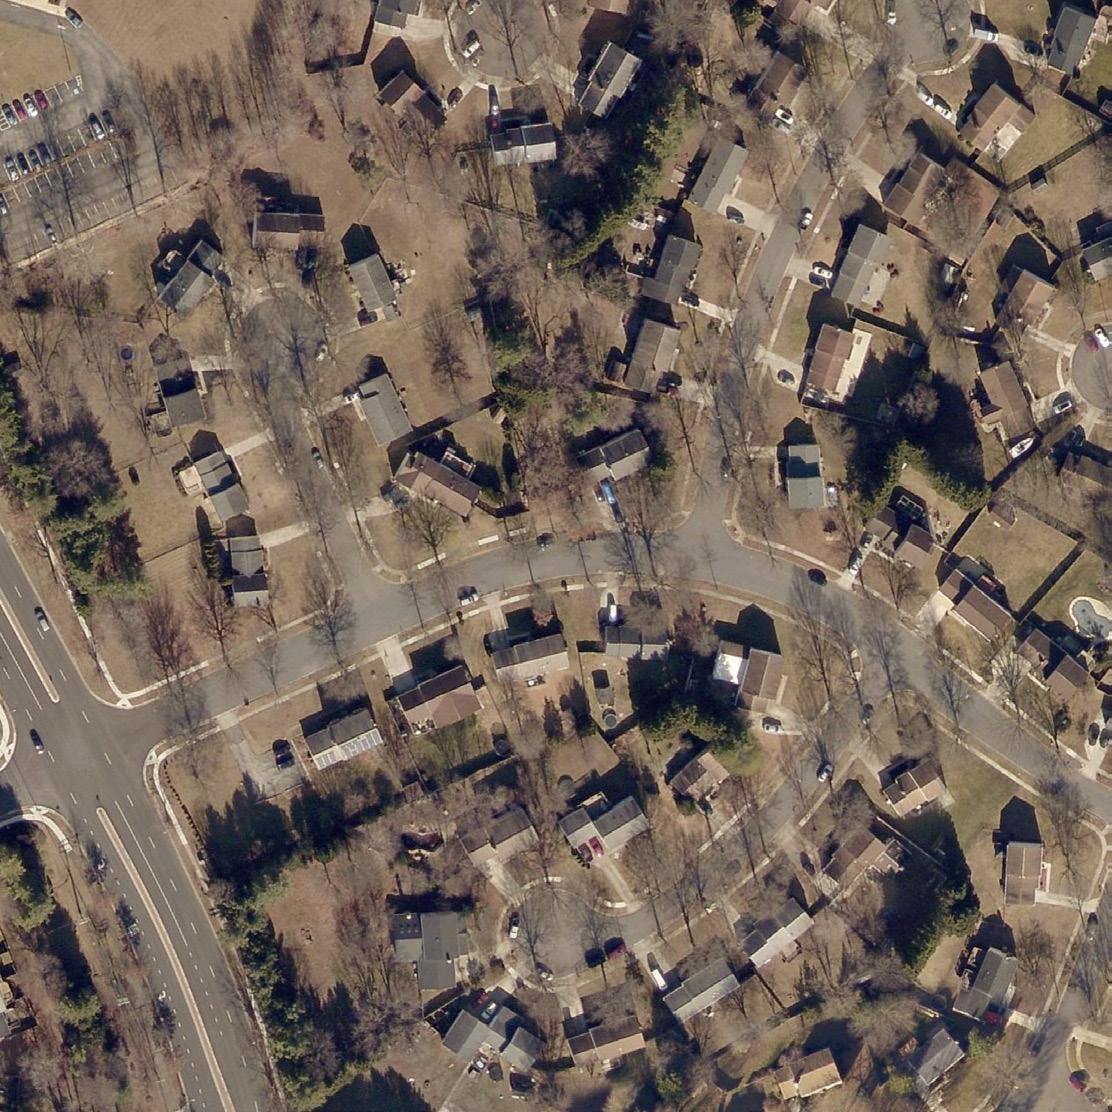
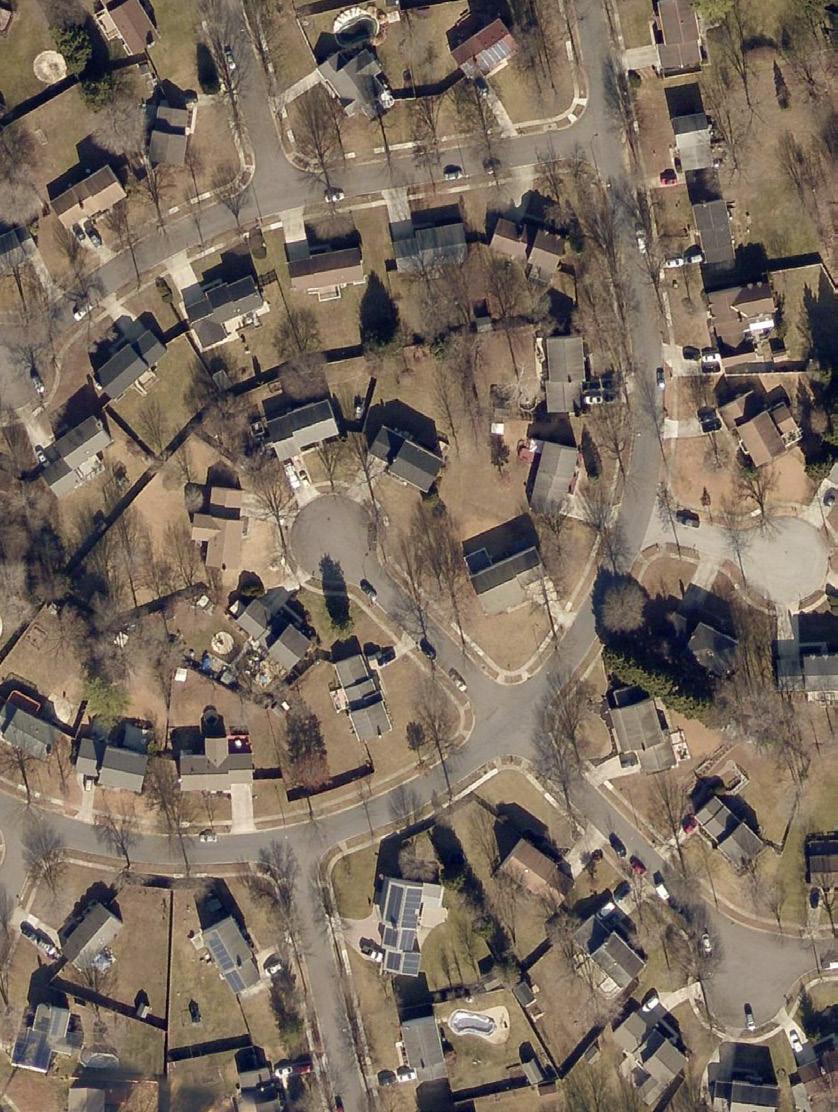
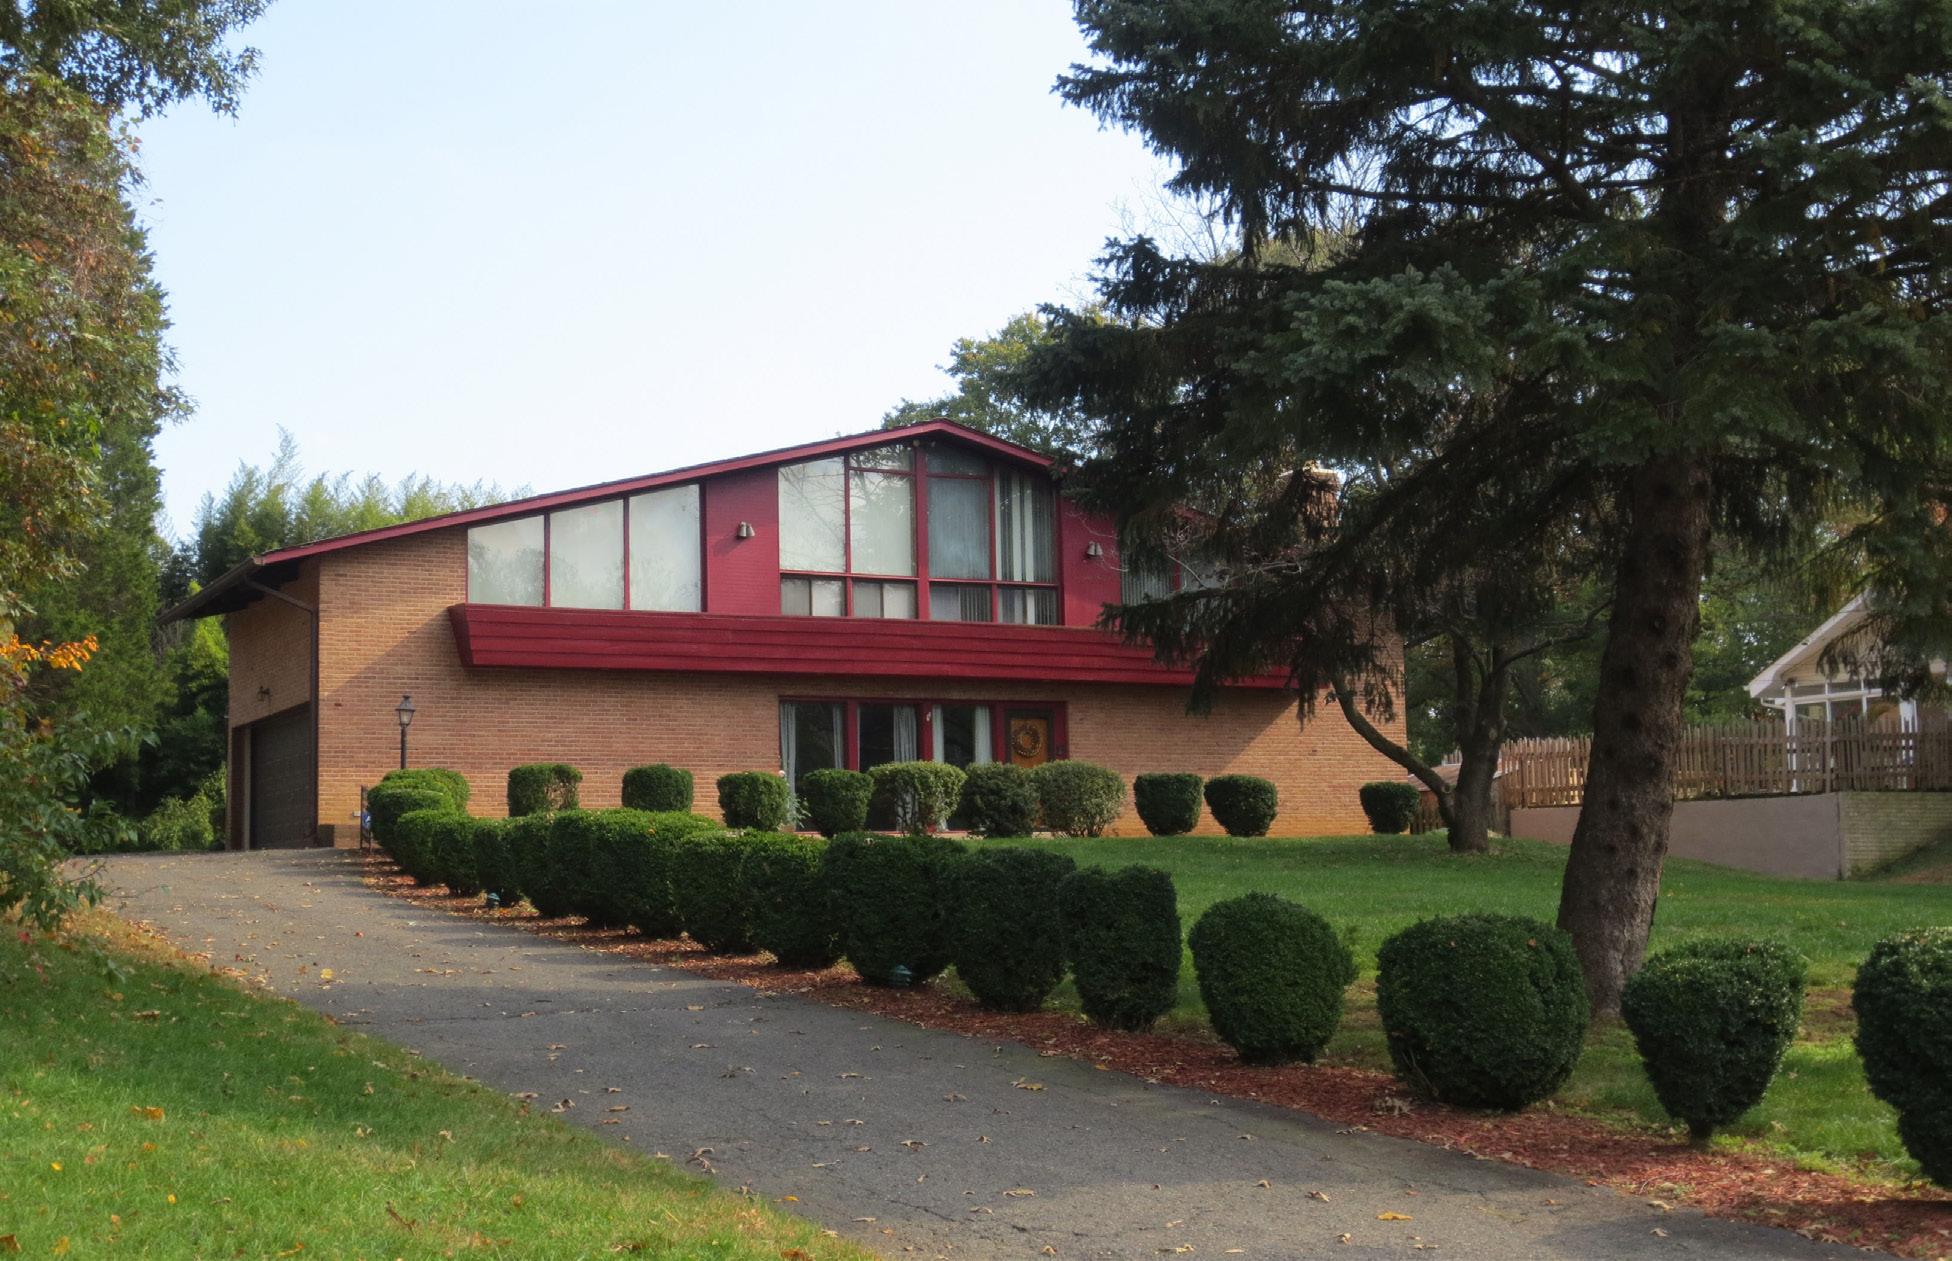
Houses along Belair Drive in Belair at Bowie, a Levittown subdivision built in the 1960’s
Established Communities
Established communities are the neighborhoods, municipalities, and unincorporated areas located outside of designated centers of development and growth. Established communities comprise over 26,030 acres in the master plan area.
The corridors and focus areas described in this report serve the residents living in established communities. This report also profiles established communities to analyze existing conditions here and consider how these conditions could be supported or enhanced through the improvement of the corridors and focus areas described above. Plan 2035 calls for reducing the development pipeline in existing communities, in favor of concentrating more growth in local and regional centers.
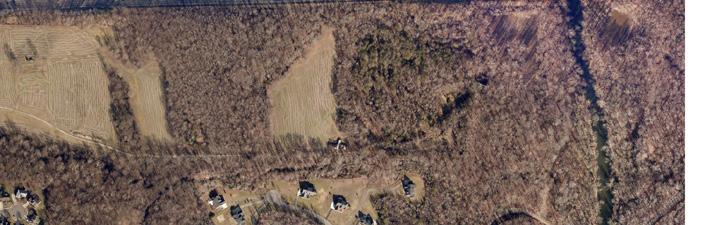
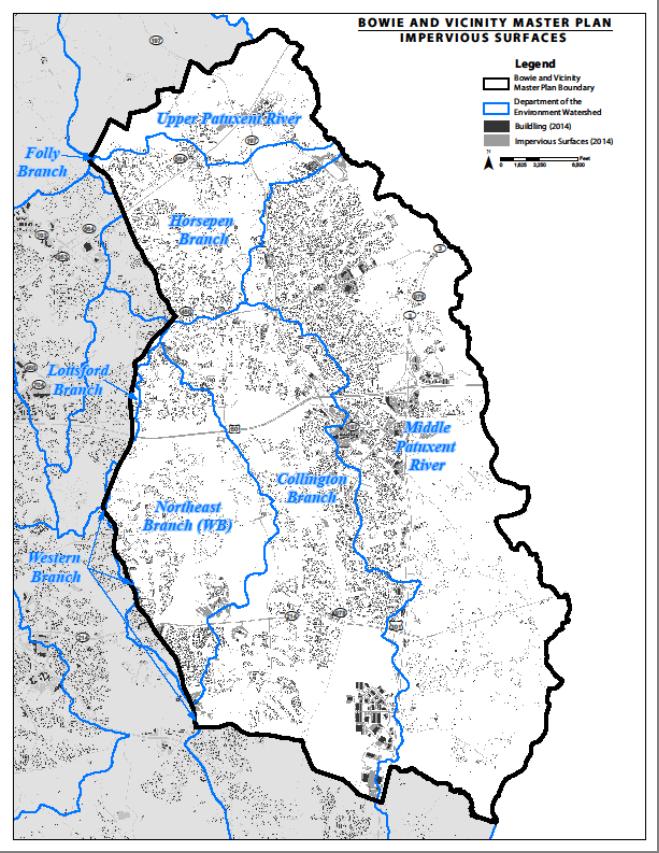
Rural and Agricultural Areas
Prince George’s County has over 85,590 acres of Priority Preservation Areas, areas containing significant rural and agricultural land designated for preservation by the County in accordance with Maryland House Bill 2 (HB2), the Agricultural Stewardship Act of 2006. In the master plan area, there are over 11,560 acres of rural/ agricultural land. This represents about 31 percent of the total area. Much of the master plan area east of US 301 (Crain Highway Corridor) is the County’s
Prince George’s County Planning Department
Source: M-NCPPC.
designated Rural and Agricultural Area. Plan 2035 calls for preserving existing rural and agricultural areas and all open space. Public water and sewer service is not recommended in these areas. This preservation is a parallel effort to the reduction of suburban sprawl in Bowie-Mitchellville and Vicinity, and the master plan area’s environmental and public health objectives.
In keeping with the planning framework from Plan 2035, this report considers all land outside of the County’s growth boundary to be rural/agricultural preserve—this equates roughly to all land to the east of US 301 in the master plan area. The growth boundary is shown in Map 9: Growth Boundary in Bowie-Mitchellville and Vicinity.
Note that in Map 9. Growth Boundary in BowieMitchellville and Vicinity, the “other area within growth boundary” indicates land that falls within the County’s rural tier but does not fall within the Priority Preservation Area.
Map 9. Growth Boundary in Bowie-Mitchellville and Vicinity
Sources:
Ternberry
Pin Oak Village
Existing Conditions Analysis Section 2
Source: Joannatkaczuk, iStock. Produce at a Farmer’s Market
Who lives and works in Bowie-Mitchellville
and
Vicinity? How is the population changing?
2.1 Demographic and Economic Profile
The Bowie-Mitchellville and Vicinity area is home to nearly 1 in 10 Prince Georgians, about 86,500 people, as of 2018. Who exactly lives in the master plan area? How do their demographics compare to the County and the region as a whole? And what are some of the key characteristics to understand about Bowie’s economy and built environment?
This section seeks to better understand the demographic and economic profile of the master plan area, including who lives in Bowie-Mitchellville and Vicinity, how various groups are distributed within the master plan area, and how the population is growing and changing. Next, this section examines development
density in Bowie-Mitchellville and Vicinity, including both people and dwelling units per acre. This section also considers employment in Bowie, including which sectors are experiencing growth and which employ the highest numbers of employees.
COVERED IN THIS SECTION:
• Demographic Profile
• Growing Market
• Household Profile
• Development Density
• Employment Profile
Seniors ages 55 and up are the fastest growing age group in Bowie-Mitchellville and Vicinity, with the greatest gains coming from those aged 65-74.
Demographic Profile
The demographic and economic characteristics of these residents and the homes they live in are different from the County overall. Residents in the master plan area are somewhat older and more likely to own a home than the average resident in Prince George’s County. The median household income in the master plan area ($120,900) is $39,100 higher than that of the County overall. Residents in Bowie-Mitchellville and Vicinity are also more likely to have a bachelors or post-graduate degree than the overall County population, and educational attainment tends to be higher where new development has occurred, including along the Church Road corridor.
Bowie-Mitchellville and Vicinity is growing at a slightly faster pace than the County as a whole (though slower than the overall Washington, D.C. metropolitan region), and the two age groups growing the fastest are seniors and young professionals. Plan 2035 identifies three fast-growing groups in Prince George’s County expected to shape the County’s needs between the plan’s publishing, in 2014, and 2035: millennials, seniors, and the Hispanic population. While millennials and seniors are both growing in the master plan area, the Hispanic population is comparatively smaller and growing less rapidly when compared to countywide demographic trends.
Seniors ages 55 and up are the fastest growing age group in Bowie-Mitchellville and Vicinity, with the greatest gains coming from those aged 65–74. Consistent with countywide trends, young adults between the ages of 25 and 34 (who fall within the millennial generation) are the only age group under 55 that grew in the last decade.
Over half (57 percent) of the master plan area identifies as Black, while this group makes up about 62 percent of the County as a whole. The master plan area has a larger proportion of White residents, and a smaller proportion of Hispanic/Latino residents, than the County overall. About 27 percent of the master plan area identifies as White, as compared to about 13 percent of the County overall. About seven percent of the master plan area identifies as Hispanic/Latino, as compared to 18 percent of the County overall.
Figure 1. Bowie-Mitchellville and Vicinity Population Growth (2000–2010, 2010–2019)
Source: ESRI Business Analyst, 2019.
GROWING MARKET
The master plan area has experienced moderate population growth in recent years, with total population increasing 6.4 percent from 2010 to 2019. This growth rate is substantially smaller than the population growth of over 17 percent between 2000 and 2010.
The Compound Annual Growth Rate (CAGR) is a way to look at the accumulated growth in a population on an annual basis, as opposed to simple growth, which describes total growth within a defined period of time.
A population’s CAGR, similar to the accrual of interest, demonstrates the growth rate on an annual basis
within a defined period of time. Bowie-Mitchellville and Vicinity’s total population grew by 6.4 percent from 2010 to 2019 (Figure 1), which represents a CAGR of 0.69 percent (Figure 2). Looking to the future, Bowie is projected to add residents on an annual basis at the same rate as the County overall, but lags far behind expected annual growth for the Washington region.
Between 2010 and 2019, the master plan experienced slightly more rapid population growth on an annual basis than Prince George’s County. However, the Washington Metropolitan Statistical Area (MSA) grew at a more rapid pace over the last decade than both the master plan area and Prince George’s County, a trend projected to continue into the future. One important question for this master plan process is how planning can increase Bowie-Mitchellville and Vicinity’s capture of future County and regional growth.
Source: ESRI Business Analyst, 2019.
POPULATION SNAPSHOT
Households within Bowie-Mitchellville and Vicinity are slightly older, more likely to own homes, and have higher household incomes than households in Prince George’s County overall.
As seen in Figure 3. Population Snapshot and Comparison: Bowie-Mitchellville and Vicinity and Prince George’s County on the following page, the most notable differences between residents of BowieMitchellville and Vicinity and their fellow Prince Georgians include household income and home ownership rates. The median annual household income in the master plan area is $120,900, 48 percent higher than the median in Prince George’s County overall, about $81,800. More than 75 percent of households in Bowie-Mitchellville and Vicinity earn more than $75,000 per year, compared to about 50 percent in the County overall. Home ownership rates are much higher in the master plan area than in Prince George’s County overall, about 83 and 57 percent respectively.
Part of this difference in income and homeownership can be explained by age, as household income and wealth tend to increase with age. The median age in the master plan area is 41.1, 4.5 years older than the County median age of 36.6. The age distribution of residents in the master plan area is examined in more detail later in this section.
Prince George's County Wash ington MSA (Metropolitan Statistical Area)
CAGR, 2010–2019
CAGR, 2019–2024 (projection)
Figure 3. Population Snapshot and Comparison: Bowie-Mitchellville and Vicinity and Prince George’s County
Average Household Size
Bowie-Mitchellville and Vicinity: 2.84
Prince George’s County: 2.82
Median Household Income
Bowie-Mitchellville and Vicinity: $120,900
Prince George’s County: $81,800
Owner-Occupied Housing Units
Bowie-Mitchellville and Vicinity: 82.9%
Prince George’s County: 57 2%
Median Age
Bowie-Mitchellville and Vicinity: 41.1
Prince George’s County: 36.6
Household Income at least $75,000
Bowie-Mitchellville and Vicinity: 76.3%
Prince George’s County: 54.8%
Renter-Occupied Housing Units
Bowie-Mitchellville and Vicinity: 13.3%
Prince George’s County: 35 4%
Source: U.S. Census Bureau, 2018 5-year American Community Survey.
Figure 4. Population 25+ by Educational Attainment in Bowie-Mitchellville and Vicinity and Prince George’s County (2018)
Source: U.S. Census Bureau, 2018 5-year American Community Survey.
Source: Monkeybusinessimages, iStock.
EDUCATIONAL ATTAINMENT
The master plan area is comprised of a much more highly educated population than Prince George’s County overall, a reality reflected in the master plan area’s median household income being more than $39,000 greater than the County median. More than half of Bowie-Mitchellville and Vicinity residents (51 percent) aged 25 and older have a bachelor’s or advanced degree such as a masters or doctorate. In comparison, one in three Prince Georgians (33 percent) have a bachelor’s degree or advanced degree.
Nearly all residents of Bowie-Mitchellville and Vicinity (95 percent) have at least a high school degree, compared to 87 percent in Prince George’s County. Figure 4. Population 25+ by Educational Attainment in Bowie-Mitchellville and Vicinity and Prince George’s County (2018) includes a detailed breakdown of educational attainment in the master plan area and Prince George’s County.
The graphs in this section examine the rates of educational attainment across the master plan area. In general, the share of residents over 25 with a bachelor’s degree or more advanced degree varies across the master plan area.
Educational attainment rates in Bowie-Mitchellville and Vicinity are highest in areas where new development has occurred (particularly along the Church Road corridor), where between 60 and 80 percent of residents over age 25 have a bachelor’s degree or higher in many census blocks west of MD 197.
Educational attainment rates are lowest in the rural agricultural part of the master plan area, near the Collington Trade Zone and east of US 301. Otherwise, rates of educational attainment are relatively even across the master plan area, in particular in the City of Bowie itself, where census blocks tend to have rates of between 40 and 60 percent of residents above the age of 25 with a bachelor’s degree or higher.
New development within the master plan area, including mixed-use nodes with diverse retail offerings, can cater to the preferences of the highly educated residents with disposable income that reside in many of Bowie-Mitchellville and Vicinity’s neighborhoods.
Map 10. Educational Attainment in Bowie-Mitchellville and Vicinity (2018)
Source: U.S. Census Bureau, 2018 5-year American Community Survey, Tiger LINE Geographies.
Fairwood
Source: U.S. Census Bureau, 2010 and 2018 5-year American Community Survey.
The majority of recent population growth in BowieMitchellville and Vicinity can be attributed to an increase in young professionals and seniors. This points to the importance of considering the evolving needs of these groups in master planning efforts.
AGE, RACE, AND ETHNICITY
The master plan area is comprised mostly of an older population, with 45 percent of the population aged 45 and above.
Prince George’s County has an overall younger population than the Bowie-Mitchellville and Vicinity area, with 29 percent of the County’s population falling between ages 15 and 34, compared to 24 percent of Bowie-Mitchellville and Vicinity area residents. The single-family suburban neighborhoods that characterize the master plan area reflect the preferences of these older residents who are more likely to be homeowners and have larger households than the County overall.
Recent population growth in both the master plan area and County has been driven by gains of people aged
55 and older, with the largest growth coming from increases in people between ages 65 and 74.
The growth and decline of different age groups in the master plan area and County can inform future planning efforts. Between 2010 and 2018 both the master plan area and Prince George’s County saw population decreases in residents under the age of 55, with the only exception being people between the ages of 25 and 34. The majority of recent population growth in Bowie-Mitchellville and Vicinity can be attributed to an increase in young professionals and seniors. This points to the importance of considering the evolving needs of these groups in master planning efforts.
Seniors and the growing population of millenial adults aged 25–34 are distributed somewhat differently
Figure 5. Population by Age in Bowie-Mitchellville and Vicinity and Prince George’s County (2018)
Master Plan Area
Prince George’s County
Figure 6. Population Growth or Decline by Age in Bowie-Mitchellville and Vicinity and Prince George’s County (2010–2018)
throughout the master plan area. Millenial residents are distributed evenly throughout the master plan area, with no clear geographic trend. In terms of absolute number of residents, there is some greater concentrations of millenial adults aged 25–34 seen in the Church Road corridor north of US 50, as well as in the northern part of the master plan area near Bowie State University.
There is also some concentration of millenial residents seen in the Bowie Local Town Center, where multifamily housing is concentrated within the master plan area. This largely follows overall population density patterns.
The highest concentration of residents over the age of 55 is in the vicinity of Cameron Grove, a 55-and-up retirement community in the southwest of the master plan area.
The distribution of these two age groups is visualized in Map 11. Distribution of Young Adults in BowieMitchellville and Vicinity (2018) and Map 12. Distribution of Senior Residents in Bowie-Mitchellville and Vicinity (2018).
Age Group
County Planning Department
Source: Monkeybusinessimages, iStock.
Prince George’s County
Source: U.S. Census Bureau, 2010 and 2018 5-year American Community Survey.
Master Plan Area
Map 11. Distribution of Young Adults in Bowie-Mitchellville and Vicinity (2018)
Collington
Fairwood
Mitchellville
Collington Overbrook
Ternberry Oaktree
Map 12. Distribution of Seniors in Bowie-Mitchellville and Vicinity (2018)
U.S. Census Bureau, 2010 and 2018 5-year American Community Survey.
Collington Trade Zone
Fairwood Woodmore
Mitchellville
Queen Anne Estates
Sherwood Manor High Bridge Estates
Collington
Patuxent Riding Heritage Hills
Ternberry
Oaktree
Pin Oak Village
7. Race and Ethnicity Demographic Change in Bowie-Mitchellville and Vicinity (2010 and 2018)
Source: U.S. Census Bureau, 2010 and 2018 5-year American Community Survey.
Source: U.S. Census Bureau, 2010 and 2018 5-year American Community Survey.
Over half of all residents of the master plan area are Black or African American. That share increased marginally from 54 percent in 2010 to 57 percent today. White residents make-up the second largest racial/ ethnic group in the master plan area, at 33 percent in 2010 and 27 percent in 2018.
Compared to Prince George’s County overall, the master plan area has a proportionately larger White population, and smaller Hispanic/Latino population. The Hispanic/Latino population is the fastest growing racial or ethnic group in the County. This was the only group aside from “Other” to see an increase in its percentage of the County’s total population between 2010 and 2018. In Bowie-Mitchellville and Vicinity, however, makes up only 7 percent of the
total population (versus 18 percent of the County’s population overall) and has grown only marginally in the last decade.
The change in demographic/ethnic groups between 2010 and 2018 for the master plan area and Prince George’s County are summarized in the figures above.
NOTE: In this analysis, Hispanic includes residents of any race who identify as Hispanic. The “Other” category includes residents who identify as multiple races (non-Hispanic), American Indian, and Pacific Islander. The White, Black, and Asian categories indicate residents who identify as those races alone.
Figure
Figure 8. Race and Ethnicity Demographic Change in Prince George’s County (2010 and 2018)
Source: U.S. Census Bureau, 2018 5-year American Community Survey, Tiger LINE Geographies.
The map above examines geographic patterns in the distribution of residents by race or ethnic group. Black residents are spread relatively uniformly throughout the master plan area, except within the City of Bowie, particularly north of US 50 where residents are predominately White.
Page 38 • Prince George’s County Planning Department
Further, residents living in the Bowie Town Center townhouses, just south and west of the juncture of US 50 and US 301, are primarily Black. Similarly, residents living at the Cameron Grove Condominiums, in the southwest of the master plan area are primarily Black.
Map 13. Bowie-Mitchellville and Vicinity Race and Ethnicity Demographic Composition (2018)
Queen Anne Estates
Sherwood Manor
High Bridge Estates
Collington
Overbrook Hall Patuxent Riding Heritage Hills
Ternberry Oaktree Pin Oak Village Yorktown Belair
Together, these findings and those examined in previous subsections suggest that residents moving into the newer developments along the Church Road corridor and in new multifamily developments are primarily middle-class, well-educated Black families.
Today, 85 percent of Bowie-Mitchellville and Vicinity residents were born in the United States, compared to 78 percent in Prince George’s County. The share of native and foreign-born residents has not changed dramatically since 2010 in either the master plan area or Prince George’s County overall: in 2010, 87 percent of Bowie-Mitchellville and Vicinity residents, and 81 percent of Prince George’s County residents, were born in the US.
POPULATION DISTRIBUTION AND DENSITY
In total, about 86,500 people reside in the BowieMitchellville and Vicinity area, 58,400 of whom live in the City of Bowie itself as illustrated in Map 14. Population Distribution in Bowie-Mitchellville and Vicinity.
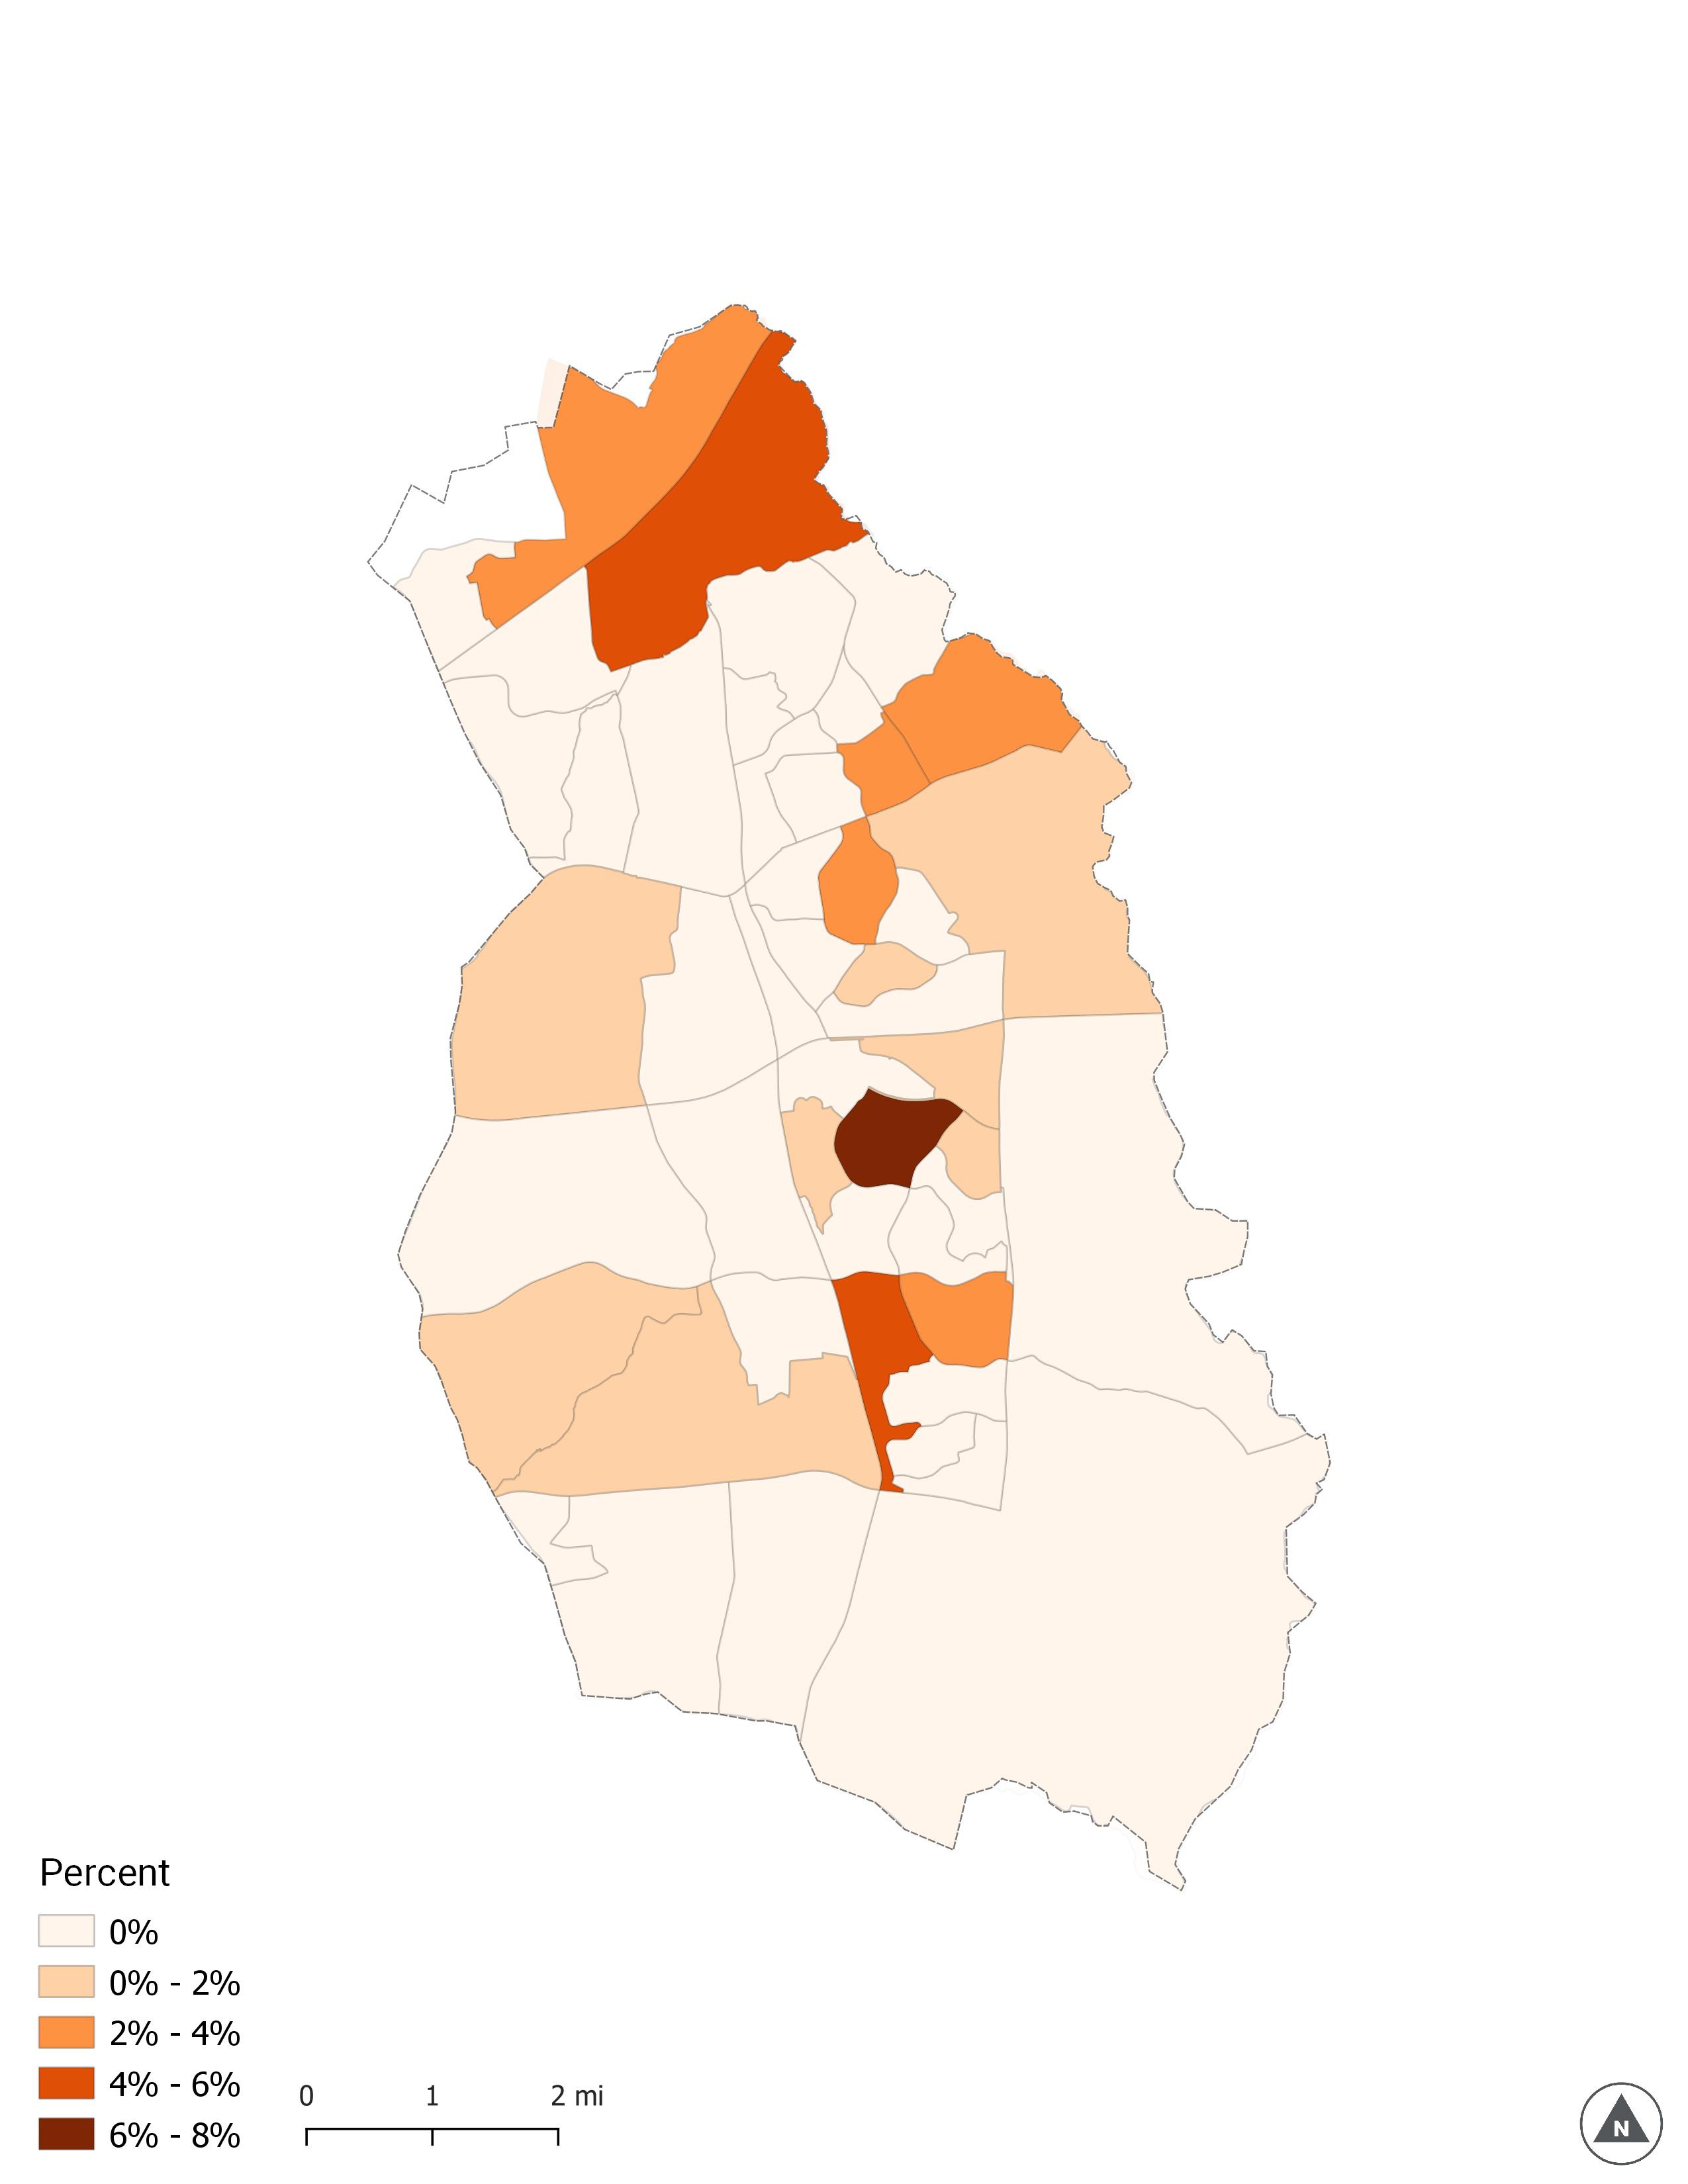
Since 2010, the Bowie-Mitchellville and Vicinity population has grown by 7.6 percent, adding about 6,000 residents. Map 15. Population Change in BowieMitchellville and Vicinity (2010–2018) shows population change throughout the master plan area, by census
block group, between 2010 and 2018. Orange circles highlight areas where there has been population growth, while pink circles indicate areas that have seen population decline during this period. The larger the circle, the greater the quantity of change.
Population growth between 2010 and 2018 was concentrated along and near Church Road, where the large majority of residential units have been added.
The greatest single area of population growth between 2010 and 2018 (and only census block group with an increase of 2,000 or more residents) is in Fairwood, near the intersection of Church Road and Fairwood Parkway, between US 50 and MD 450. There is a cluster of townhouse communities in Fairwood, including two developments completed in or after 2010: the Bounty at Fairwood (78 units) and the Sanctuary at Fairwood (87 units). Development is also planned for the 20-unit Fairwood Townhomes and there has been significant growth on the east side of Church Road in Fairwood.
The block group that includes Oak Creek Golf Club, south of MD 214, also saw an increase in population during this period.
There was also an increase of over 500 residents in the block group just south of Bowie State University. This area may see continued population growth due
U.S. Census Bureau, 2018 and 2010 5-year American Community Survey.
Figure 10. Prince George’s County Demographic Change, 2010–2018
Figure 9. Bowie-Mitchellville and Vicinity Demographic Change, 2010–2018
U.S. Census Bureau, 2018 and 2010 5-year American Community Survey.
14. Population Distribution in Bowie-Mitchellville and Vicinity (2010–2018)
Source: U.S. Census Bureau, 2018 and
American Community Survey, Tiger LINE Geographies.
Map 15. Population Change in Bowie-Mitchellville and Vicinity (2010–2018)
Source: U.S. Census Bureau, 2018 and 2010 5-year American Community Survey, Tiger LINE Geographies.
Ternberry
to increased on-campus housing proposed in the 2010 Bowie State University Facilities Master Plan, which calls for three new 300-bed residence halls.1
Population change in the City of Bowie has been relatively flat or declining. This is most likely the result of an aging population and smaller household sizes.
The population of Bowie-Mitchellville and Vicinity increased significantly between 2000 and 2010, 17 percent overall. The pace of growth slowed between 2010 and 2019 but remained strong at around 10 percent.
Following this trend, the master plan area’s population is projected to increase through 2024, though only modestly. The housing and development trends behind this growth are explored in greater detail in Section 2.2. Housing and Neighborhoods and Section 2.4. Land Use, Zoning, and Urban Form.
Development Density
As of 2018, there are an estimated 31,000 dwelling units in the Bowie-Mitchellville and Vicinity area, housing approximately 87,000 residents in an area of about 37,700 acres. This comes out to fewer than one dwelling unit per acre. This is considered quite low. A density of about one to three dwelling units per acre is considered to be low-density suburban. Less than that is considered exurban or rural.
Map 16. Dwelling Unit Density in Prince George’s County (2018) shows that dwelling unit density is low— less than three dwelling units per acre—in much of the County, particularly outside of I-495 (Capital Beltway). Dwelling unit density in Prince George’s County is greatest within the Capital Beltway.
In the Bowie-Mitchellville and Vicinity master plan area, dwelling unit density and population density are greatest within the City of Bowie. While development since 2010 has been concentrated around the Church Road Corridor, this area remains very low density.
Figure 11. Historical and Projected Population in Bowie-Mitchellville and Vicinity (2000–2024)
Source: Neustar Data 2019.
1 See the 2010 Bowie State University Facilities Master Plan at: https://bowiestate.edu/images/files/bsu-facilities-masterplan1.pdf.
George’s County Planning Department
N 5 miles
Source: U.S. Census Bureau, 2018 5-year American Community Survey, Tiger LINE Geographies. Dwelling Units per Acre (Gross)
Prince George’s County Planning Department
Map 16. Dwelling Unit Density in Prince George’s County (2018)
Source: U.S. Census Bureau, 2018 5-year American Community Survey, Tiger LINE Geographies.
Map 17. Dwelling Units Built per Acre, Housing Density in Bowie-Mitchellville and Vicinity
Source: Census Bureau, 2018 5-year American Community Survey, Tiger LINE Geographies.
Figure 12. Total Jobs by Industry Sector in Bowie-Mitchellville and Vicinity (2019)
Health Care and S ocial As sis tance
( excep t P ublic Ad minis tration)
Sector
Jobs
Source: Neustar Business NAICS Summary, 2019.
Figure 13. Employment Growth by Total Change in Jobs in Bowie-Mitchellville and Vicinity and Largo and Kettering (2015–2019)
Health Care and S ocial As sis tance
G overn men t
Trans por tation an d Wareho us ing
Accom m odation and F ood S ervices
Educ ation al Ser vices
Adm inistr ative and W aste S ervices
Co ns truction
Manu factur in g
Other S ervices ( excep t P ublic Ad minis tration)
Arts , En tertain men t, and R ecreation
W holes ale Trade
Manag emen t o f Co mp an ies and Enterp ris es
Inf or mation
R eal Estate an d Ren tal and Leasing
F in an ce and In su rance
Pro fes s io nal, S cientific, and Technical Serv ices
R et ail Tr ad e
Industry Sector - 200 0
Total Change in Jobs, 2015–2019
Source: Neustar Business NAICS Summary, 2019
Note: Analysis includes
Employment Profile
EMPLOYMENT BY INDUSTRY
The Bowie master plan area has a total of 28,000 jobs, representing 10.4 percent of total jobs within Prince George’s County. Nearly a fourth of all businesses in the master plan area belong to the Health Care sector, and over 14 percent of employees in the master plan area work in this sector. Trailing behind, between 300 and 400 jobs, are those classified as “Other Services” (which is wide ranging and includes religious services, automotive repairs, social advocacy, and dry cleaning, and excludes public administration), Retail Trade, and Professional, Scientific, and Technical services.
While Retail Trade makes up a smaller percentage of total businesses in the master plan area, this sector has the largest share of employees, at over 20 percent. However, the master plan area is losing jobs in retail; in the last five years, the local retail job market has shrunk by nearly 200 jobs.
EMPLOYMENT GROWTH
The Health Care sector also experienced the largest total job growth between 2015 and 2019, adding over 900 new jobs to both the master plan area and neighboring Largo community. Although jobs in the retail sector make up the highest percentage of jobs in the master plan area today, this sector has seen the greatest decrease in jobs in the last five years, as jobs in health care and social assistance have grown. Government jobs represent another growing sector in the master plan area—the only sector other than Health Care to have added over 600 new jobs in the last five years.
Source: M-NCPPC.
Bowie-Mitchellville and Vicinity residents enjoying Allen Pond Park
Discussion of Challenges and Opportunities
GROWING MILLENNIAL AND SENIOR POPULATIONS
With young millennial adults (ages 25–34) and seniors driving population growth in the master plan area, it is important to ensure that future development reflects the preferences of both target groups. One opportunity is to ensure that future development reflect the housing preferences and needs of seniors and young professionals in order to maintain economic competitiveness.
Bowie’s aging population is a challenge in terms of attracting employers and building an employment base in the master plan area. The bulk of recent population gains have come from residents aged 55 and above and, while there was an uptick in young adults aged 25–34, Bowie-Mitchellville and Vicinity lost residents aged 35–54 between 2010 and 2018. This trend is projected to continue into the future, with projected growth from 2019–2024 being driven by residents aged 65 and up, many of whom will likely be retired.
POCKETS OF ECONOMIC CHALLENGE AND HOUSING BURDEN
While the master plan area has a considerably higher median household income than Prince George’s County overall, there are still pockets within BowieMitchellville and Vicinity where residents experience greater economic challenges, including lower household incomes and higher housing cost-burden. Census block groups within the City of Bowie are more likely to fall below the master plan area’s median household income. Residents within the City of Bowie are also more likely to experience housing burden (both as renters and homeowners) than the rest of the master plan area.
The census block group containing Cameron Grove, in the southwest corner of the master plan area, sees housing cost-burden2 for renters, meaning most renters spend over 30 percent of monthly income on rent. This census block group is also one of only three in the master plan area whose median household income is lower than the countywide median. The large concentration of senior residents living in this block, many presumably retired or on fixed incomes, may account for some of the economic challenges here.
Housing cost-burden and median household income is discussed in greater detail in Section 2.2. Housing and Neighborhoods.
MIXED-USE DEVELOPMENT
According to Plan 2035, economic growth and development across Prince George’s County should primarily focus on strengthening established neighborhoods to ensure existing residents live in high-quality, healthy communities. Within the master plan area, existing neighborhoods can be strengthened by providing a diversity of housing options beyond the current predominance of subdivisions of detached single-family homes, particularly with options geared to Bowie’s growing cohort of young millennial adult residents between ages 25 and 34 and seniors aged 55 and older. These populations often prefer walkable communities, so mixed-use development with a range of different residential typologies like apartments and townhouses, in addition to complementary office and retail space, can create new nodes where residents have the opportunity to “live, work, and play” within their neighborhood. Sites for infill development along existing corridors in the master plan area, which are largely characterized by big-box retail stores and surface parking lots, provide opportunities to leverage existing infrastructure and accommodate increased density and new mixed-use development.
HEALTH CARE SECTOR
The growing Health Care and Social Assistance sector presents an opportunity to the master plan area, which can position itself as an employment center and add mixed-use developments with accessibility to work places in Health Care and Social Assistance, as well as Government jobs which make up a smaller but growing share of local employment.
Bowie-Mitchellville and Vicinity is not competitive as a Class A office market. The master plan area’s growing healthcare sector represents a strong opportunity for growing its employment base, with a focus on developing medical office space.
2 Cost-burden: When a household pays more than 30 percent of their gross income on housing, including utilities, they are “cost-burdened.” Cost-burdened households have less for other essentials, like food, clothing, transportation, and medical care.
2.2 Housing and Neighborhoods
The Bowie-Mitchellville and Vicinity master plan area is largely composed of low-density neighborhoods of single-family detached homes. To provide more diversity in housing product and offer options suited to growing segments of the population, particularly young professionals and senior residents, new residential options like townhouses and multifamily apartments should be encouraged to fill existing gaps in available housing and help establish walkable, mixed-use communities. Young professionals and senior residents today are increasingly opting for more walkable, mixed-use neighborhoods rather than low-density suburbs—a trend present throughout the Washington region. Developing new multifamily and townhouse product in Bowie is a way to deliver housing options tailored to the preferences of these growing cohorts, while also building the residential density needed to create walkable communities, concentrate activity within
specific nodes, and establish the residential foundation needed to attract commercial tenants. With office and retail tenants typically following the location patterns of their current and prospective employees and customers, Bowie must ensure the residential product offered within Bowie is attractive to young professionals and seniors, who will in turn influence the locational decisions of employers and retailers.
COVERED IN THIS SECTION:
• Housing Stock
• Foreclosure Rates
• Development Trends
• Housing Market Overview
• Market Performance
• Affordable Housing
and Vicinity
Source: M-NCPPC. Townhomes in the Fairwood neighborhood of Bowie-Mitchellville and Vicinity
Housing Type
Percent of Housing Units
Plan 2035 envisions Prince George’s County as a regional destination with strong, healthy communities; a competitive and innovative economy; and walkable, mixed-use centers. The master plan area can help realize Plan 2035’s vision by focusing on opportunities for residential infill within existing nodes, such as Bowie Local Town Center and the Bowie MARC Campus Center. Adding multifamily and townhouse units to these existing commercial centers is a way to create mixed-use communities, while expanding the residential base in these nodes of activity is critical to attracting private development activity and investment to build additional office and retail. Infill development brings further benefit by negating the need to build new infrastructure and reducing degradation of the County’s natural resources. Bowie-Mitchellville and Vicinity’s undeveloped areas can be relieved from future single-family greenfield development pressures by targeting infill development. New multifamily and townhouse units should be positioned in proximity to existing employment centers and in locations that offer walkable access to amenities like open space, trails, retail, and restaurants, which will help strengthen neighborhood connectivity and promote walkability in line with Plan 2035’s vision.
Housing Stock
The majority of Bowie-Mitchellville and Vicinity’s neighborhoods are made up of single-family homes, with single-family detached homes accounting for 71 percent of all housing stock in the master plan area.
As a largely suburban area, it is unsurprising that most of the housing stock in Bowie-Mitchellville and Vicinity is single-family detached homes. This also tracks with
Source: ESRI Business Analyst, 2019.
Built Year
Source: Neustar, 2019.
the area’s demographic characteristics, as the master plan area has an older population who are more likely to own homes and have larger families than the County’s population overall. However, with over 1,600 detached single-family homes, 800 townhouses, and 1,800 multifamily units currently in its development pipeline, the master plan area is on track to see large increases in its housing stock across all unit types over the next 10 years. This is especially true for multifamily units—the known pipeline of new multifamily units expected is more than four times greater than the total supply of multifamily units delivered in the last 10 years.
Multi famil y, 20 or Mor e Units
Multi famil y, 2 to 1 9 Units
Si ngl e- Famil y, Attache d
Si ngl e- Famil y, De tached
Figure 14. Housing Stock by Unit Type (2019)
Figure 15. Master Plan Area Housing by Year Built
Figure 16. Master Plan Area Foreclosures by Housing Type (2015–2019)
Source: MetroStudy, 2020.
Age of Housing Stock
Approximately 75 percent of residential units within the master plan area were built over 20 years ago. Nine percent of the master plan area’s housing stock was built within the past 10 years, consisting primarily of detached single-family residential units. Projects planned by private developers working in the Bowie area are projected to deliver more than 3,000 residential units in the coming years. This planned private development pipeline includes a mix of detached single-family units, as well as a significant complement of townhouses and multifamily units, which will significantly increase the area’s multifamily supply. The vast majority of pipeline units—92 percent—are planned as part of the proposed Melford Town Center and South Lake master-planned development projects. The remaining pipeline units are attributable to a variety of smaller scale planned single-family communities.
Foreclosure Rates
The master plan area had a total of 71 foreclosures in 2019 (MetroStudy), representing a 54 percent decline in total annual foreclosures from 2018. The majority of 2019’s foreclosed units were detached single-family homes, comprising 50 of the total 71 foreclosures that year. Total annual foreclosures have generally been trending downward over the past five years, which is one indicator that the housing market is recovering from the 2008 financial crisis that sparked a significant increase in foreclosure activity in the area. This trend is also reflected in Prince George’s County overall, which had a foreclosure rate of 1 in every 785 homes in 2019, down from 1 in every 357 homes back in 2016 (ATTOM Data Solutions). Prince George’s County was particularly affected by the housing crisis—in 2011, the County’s foreclosure rate was 5.3 percent, twice the foreclosure rate of the Washington, D.C. region overall, and around 15 percent of homeowners in the County received notices of intent to foreclose. As a majority minority county, Prince George’s County was hit especially hard due to the frequency with which minorities, particularly Black homeowners, were given subprime mortgages. The racial disparities in home lending have been well-documented, and
Figure 17. Prince George’s County New Building Permits by Zoning Category (2012–2019)
Figure 18. Bowie-Mitchellville and Vicinity Master Plan Area New Building Permits by Zoning Category (2012–2019)
Source: Prince George’s County Open Data Building Permits.
Source: Prince George’s County Open Data Building Permits.
Map 19. New Construction Permits (2012–2019)
Source: Prince George’s County Open Data Building Permits.
these discriminatory lending practices led to the disproportionate impacts experienced by Black homeowners in the County—in the Washington, D.C. region Black homeowners were 20 percent more likely to lose their homes compared to White homeowners with similar incomes—and across the nation.
The County’s gradual decrease in its foreclosure rate is reflective of its slow rebound from the impacts the financial crisis had on residents’ wealth and their ability to own homes. The housing market in Prince George’s County continues to show signs of recovery following the Great Recession, with median home sale prices increasing by 9.3 percent in the fourth quarter of 2016 compared to the same period in 2015. Additionally, the average amount of time homes spent on the market was down 17.3 percent during the fourth quarter of 2016, an indicator of an increase in demand for houses and qualified buyers making purchases. An increase in median sales prices combined with decreases in both total foreclosures and the average time houses remain on the market are just a few of the indicators of the housing market’s rebound and highlights residents’ ability to purchase homes they are able to afford long-term.
Development Trends
The following charts examine commercial and residential development trends in Prince George’s County and the master plan area since 2012, using building permit data published by Prince George’s County.
Development in the County and master plan area increased considerably after 2013 and the economic recovery from the 2008 recession began to strengthen. We see the total number of building permits increase from about 250 overall in 2013 to about 1,300 in 2014.
Growth in single-family development was particularly strong in the master plan area.
No townhouse construction has occurred in the Bowie-Mitchellville and Vicinity master plan area since 2012. This is in contrast to the County as a whole, which saw townhouse construction growing with single-family construction through 2017 and overtaking it in 2018 and 2019 by a significant margin.
The large majority of single-family permits in the master plan area were for building in the Church Road corridor, indicated in a dashed gray line in Map 19. New Construction Permits (2012–2019).
Commercial development was much more uniformly spread throughout the master plan area. The largest concentration of commercial permits granted in Bowie-Mitchellville and Vicinity are along MD 450 and in the Bowie Town Center.
Overview of Housing Market
Overall, the housing market within the master plan area is relatively healthy and stable. The Bowie-Mitchellville and Vicinity master plan area has undergone limited to no multifamily development in the past 10 years. The two master-planned developments of Melford Town Center and South Lake will add significant new product to the area, including over 1,800 new multifamily units. The performance of these large deliveries will help gauge appetite and depth of demand for future multifamily projects in Bowie.
Recent construction of detached single-family homes has been concentrated along Church Road, particularly near the intersection with John Hanson Highway, and new planned developments like Collingbrook Estate will add further subdivisions to the area. Church Road is not one of the area’s main commercial corridors, so it is one of the best locations
Source: MetroStudy, Redfin, CoStar.
Figure 19. Housing Market Overview
Source: MetroStudy, Redfin, CoStar.
Source: Neustar, 2019.
Figure 20. Total Projected Household Growth by Age in Bowie (2019–2024)
Figure 21. Residential Pipeline in Bowie-Mitchellville and Vicinity Master Plan Area by Unit Type (2019)
22. Average Sales Price by For-Sale Type (2015–2019)
Source: MetroStudy, Redfin, CoStar.
for low-density, detached housing in the master plan area. As seen in Map 19. New Construction Permits (2012–2019) there has been a small cluster of recently constructed single-family homes east of US 301, including Mill Branch Estates, a luxury community of 38 single-family detached homes that began construction in 2014. The Mill Branch subdivision is in a Residential Agriculture Zone, which permits suburban residential development on two-acre lots. Continued greenfield development in this area east of US 301, particularly in the Rural and Agricultural area (R&A area), where development must occur on well and septic, will increase pressure on Bowie’s land for preservation. While the town cannot prevent development from occurring that aligns with permitted zoning, efforts should be made to encourage developers of low-density housing to pursue available land south of the R&A area, such as around Westphalia and Rosaryville, to reduce pressure on R&A area land and to fill in existing development capacity in established communities.
The two major master-planned developments for the master plan area will both bring added development pressures, so the City of Bowie should be prepared to encourage infill development in established communities along the master plan area’s primary corridors and nodes in order to avoid development pressure from Melford or South Lake from seeping east of US 301 into R&A areas.
HOUSING DEMAND
The Bowie-Mitchellville and Vicinity master plan area is projected to grow by a net gain of 362 households by 2024, with almost all of this growth stemming from increases in households aged 65 and older. While residents aged 55 to 64 grew at a CAGR of 3.4 percent from 2010 to 2019, this trend is projected to reverse, with residents aged 55–64 declining by a CAGR of -0.5 percent, resulting in a loss of 269 households from 2019 to 2024. During this same time period, the master plan area is also projected to experience a large decrease in households ages 45 and 54, with over 1,000 households projected to leave the master plan area over the next five years. The County and City can look into developing and deploying surveys to understand why residents are choosing to leave the area—potential push factors could include lack of affordability and lack of diverse housing options, while residents could be pulled into other areas by factors such as transit, school quality, and availability of amenities. Developing an understanding of why households are leaving Bowie can help planning staff encourage future development to help retain residents.
The majority of the master plan area’s known residential pipeline is composed of market-rate multifamily units, as shown in Figure 21. There is a total of 1,825 market-rate units planned to be delivered as part of the Melford Town Center and South Lake master-planned development projects. The overall
Figure
Source: MetroStudy, 2020.
increase in total housing units based on the known pipeline is much larger than projected household gain over the next five years. Melford and South Lake will need to attract residents from outside of the master plan area for success, as their size and scale outstrip projected demand.
The Tribute at Melford, a 140-unit senior apartment building located at Melford Town Center, recently opened in November 2019 and currently has a vacancy rate of 28.6 percent. Given that the project is still in the process of leasing up, this vacancy rate is not a reason for alarm. It is typical within the first year of a building’s opening for vacancy to initially be high as leasing activity ramps up.
Currently, there are no other known senior multifamily projects planned within the master plan area. With the master plan area projected to add 1,745 households aged 65 and older over the next five years (the driving force behind the area’s total projected net gain of 362 households), there is a potential gap in meeting the specific housing needs of these aging residents. The known residential pipeline is heavily weighted toward market-rate apartment units, which may not meet the demand from aging residents looking for units specifically geared to their needs, such as single-story floor plans and handicap-accessible bathrooms. In terms of detached single-family homes, much of the pipeline product is located in subdivisions of large homes that are 2,000 square feet and up in size, which suggests another potential gap in housing supply and demand. The master plan area is projected to lose a significant amount of households that likely have children and may need larger homes, while there will be increases in young professionals and seniors, cohorts who are likely to prefer smaller-footprint housing options, which could lead to an oversupply of these newly constructed large single-family homes. New residential development should be focused on options catered towards young professional
and seniors, who frequently seek and prefer highly amenitized offerings in walkable communities. This preference for walkable product in a connected neighborhood is very much in alignment with Plan 2035’s vision.
HOUSING MARKET BY PRODUCT TYPE
The master plan area’s for-sale housing market has experienced steady growth over the last five years, with the average sales price for detached single-family homes, townhouses, and condominiums increasing on an annual basis.
Townhouse Market
(See Map 20. Notable Townhouse Projects)
The Bowie-Mitchellville and Vicinity master plan area is home to a variety of townhouse communities, largely located west of the US 301 corridor, and there are currently over 800 planned townhouse units slated to be delivered by private developers. The median sales price for a townhouse has been increasing for the past five years.
1 Situated east of the intersection at MD 193 and MD 450 are five townhouse communities. These communities include the 75-unit The Choice at Fairwood completed in 2005, 157-unit The Retreat at Fairwood completed in 2006, 87-unit The Sanctuary at Fairwood completed in 2010, and 78-unit The Bounty at Fairwood completed in 2012. Mid-Atlantic Builders is currently developing 20 townhouse units off Fairwood Parkway. In 2020, townhouses within this cluster sold for an average price of $390,000.
2 To the west of the intersection of MD 197 and US 301 lies another cluster of townhouse communities. Essington, located north of Collington Road, was developed in 1990 and consists of over 100 townhouses. Developed in 1997, Covington is a residential community located east of Mitchellville Road that consists of over 200 single-family dwelling units in addition to over 400 townhouses. Evergreen Estates is located directly south of the Bowie Town Center shopping center and delivered approximately 200 townhouse units in 1990. In 2020, townhouses within this cluster sold for an average price of $302,000.
3 Oak Creek Club is a private residential community that includes single-family homes in addition to approximately 200 townhouses. Located east of Church Road just south of MD 214, townhouses in this community sold for an average price of $411,000 in 2020.
4 There are two master-planned development projects in the master plan area’s pipeline that are anticipated to deliver over 800 townhouse units. Melford Town Center, a proposed 466-acre mixed-use, master-planned town center located at the intersection of US 50 and US 301, is anticipated to deliver 300 townhouses if developed. At the intersection of Central Avenue and Crain Highway, South Lake is a proposed 381-acre mixed-use, masterplanned project that is expected to deliver over 500 townhouse units if developed.
City of Bowie
Source: Redfin.
Fairwood
Woodmore Huntington
Mitchellville
Jericho Park Duckettsville
Idlewild
Queen Anne Estates
Sherwood Manor
High Bridge Estates
Collington
Overbrook
Hall
Patuxent Riding
Heritage Hills
Map 21. Notable Multifamily Projects
Notable Multifamily Projects
Apartments
Note: Numbers in map refer to photos in Figure 24 Multifamily Market Notable Projects
Multifamily Market
There are only eight apartment buildings within the Bowie-Mitchellville and Vicinity master plan area, and half are age-restricted senior apartment projects. All eight communities comprise a total of approximately 2,000 multifamily units.
Residential Market Pipeline
The Bowie-Mitchellville and Vicinity master plan area’s development pipeline includes over 600 detached single-family homes, 800 townhouses, 100 condominiums, and 1,800 multifamily units. The majority of the master plan area’s pipeline units are from the proposed Melford Town Center and South Lake master-planned development projects.
City of Bowie
Source: CoStar.
Cameron Grove
Fairwood
Woodmore
Huntington
Mitchellville
Jericho Park
Duckettsville
Idlewild
Queen Anne Estates
Sherwood Manor
High Bridge Estates
Collington
Overbrook Hall
Patuxent Riding
Heritage Hills
The Willows Governors Green
Alvista Bowie
Melford
The Bowen Heather Ridge
Source: CoStar.
Note: Numbers in map refer to photos in Figure 25 Development Pipeline
Map 22. Bowie-Mitchellville and Vicinity Master Plan Area Pipeline
Grove
Fairwood Woodmore Huntington
Mitchellville
Jericho Park Duckettsville
Idlewild
Queen Anne Estates
Sherwood Manor
High Bridge Estates
Collington
Overbrook
Hall
Patuxent Riding
Heritage Hills
Source: CoStar.
Fairwood Melford Town Center
King’s Isle Estates
Collingbrook Estates
Oak Creek
South Lake Developer: Mid-Atlantic
Developer: St. John Prop. Type:
Developer:
Developer: NAT Michael Type:
Market Performance
Both market-rate and senior-living multifamily products are relatively stable, though there has been very little recent development activity—the overall market in the master plan area has seen only two projects completed in the past decade, with a single market-rate project and a single senior project. The stock of market-rate product is expected to grow substantially over the next 10 years, with over 1,800 apartment units slated to deliver at the Melford Town Center and South Lake master-planned development projects. With the majority of household growth slated to stem from increases in senior households aged 65 and older, there is an opportunity for future multifamily development to market itself to this growing demographic.
MARKET-RATE PERFORMANCE
The master plan area has seen just one recent market-rate multifamily delivery, and vacancy has remained largely unchanged despite this lack of new supply, reflective of zoning constraints and potentially limited demand.
While the 286-unit Bowen apartment complex was absorbed well after delivery in 2014, the master
plan area’s lack of any more recent multifamily projects reflects both zoning constraints and historic preferences for single-family homes. Under the County’s previous zoning code, the development of new market-rate multifamily near existing shopping centers required zoning map or text amendments for shopping centers located in C-S-C (Commercial Shopping Center) or C-M (Commercial Miscellaneous) zones. The County’s 2018 Zoning Ordinance provides more flexibility in zoning to help support new multifamily development near large commercial centers, in order to better align Plan 2035’s vision for creating walkable, mixed-use communities. In addition to this zoning change that may help facilitate more multifamily projects, the Melford Town Center and South Lake master-planned development projects are poised to add significant new multifamily product, which will greatly increase the area’s supply and test demand for new apartments, condos, and townhouses. Since the Melford Town Center and South Lake master-planned projects are located 6 miles and 10 miles south of the Bowie State/MARC Station campus node, respectively, there is an opportunity for new multifamily units closer to Bowie State University to meet potential unmet demand from students, faculty, and staff, as well as MARC commuters.
Source: CoStar.
Figure 26. Market-Rate Multifamily Absorption, Deliveries, and Vacancy (2010–2019)
SENIOR-LIVING PERFORMANCE
Senior-living multifamily units are apartment units restricted to renters who are aged 55 and older. These apartment units can be designed as either independent living or assisted care communities and offer a variety of amenities such as recreational programs, transportation, and meal services. Demand for senior-living multifamily has experienced minimal fluctuations over the last 10 years, with vacancy for both 2010 and 2019 at a low of 2.1 percent. Considering that the majority of the master plan area’s population growth from 2010–2019 stemmed from increases in residents aged 55 and older, and that projected future growth is anticipated to be concentrated amongst residents aged 65 and older, combined with the overall strength and stability of the senior-living multifamily market, there is likely a strong opportunity for future senior-living multifamily development in Bowie. In particular, given the relative wealth of Bowie’s residents, many of whom currently live in large single-family homes, there is an opportunity to deliver higher-end senior-living communities with a suite of amenities marketed to senior residents who are looking to downsize and would be willing to pay a premium for a high-end multifamily product.
HOUSING COST BURDEN
Housing cost burden is defined as households that pay more than 30 percent of their income on housing. In the Bowie-Mitchellville and Vicinity master plan area, residents earning less than $20,000 annually are the most cost-burdened.
Extreme housing cost burden amongst the master plan area’s lowest income rental households indicates an opportunity for new mixed-income multifamily development to meet this demand. A future study would be needed to see if mixed-income development would be financially feasible in Bowie, including an analysis of market-rate rents to see if they are high enough to cross-subsidize affordable units.
Map 23. Housing Cost Burden and Income in BowieMitchellville and Vicinity illustrates the census block groups within the master plan area where residents experience relatively greater challenges with income and housing costs as a percentage of total monthly income. Most census block groups where median income is lower than the master plan’s overall median income fall within the City of Bowie (shaded in a darker gray on the map).
Source: CoStar.
Vacancy
Total Units
Figure 27. Senior-Living Multifamily Absorption, Deliveries, and Vacancy (2010–2019)
Source: American Community Survey Tables: 2014–2018 (5-Year Estimates).
Source: American Community Survey Tables: 2014–2018 (5-Year Estimates).
Map 23. Housing Cost Burden and Income in Bowie-Mitchellville and Vicinity (2014–2018)
Block group below the master plan area median household income AND majority pays over 30% of of household income on rent
Block group below County median household income ($83,034)
Source: American Community Survey Tables: 2014–2018 (5-Year Estimates).
While household incomes tend to be higher in the master plan area than in Prince George’s County overall, there are three census block groups in the master plan area whose median household income falls below the County median. This includes the areas of Ternberry, Pin Oak Village, Yorktown, and Oaktree, as well as the census block group containing Cameron Grove, the master plan area’s largest retirement community. Housing burden, as measured as a percentage of monthly income tends to be greater City of Bowie, east of the MD 197 corridor and west of US 301.
This analysis uses ACS data about monthly housing costs and household income, by census block group. First, census block groups where median household income is lower than the master plan area median (by block group) were identified. Then, block groups were identified where housing cost burden is relatively high for owners and renters, respectively.
Owner housing cost burden is calculated using American Community Survey data—specifically, percentage of median monthly owner costs as a percentage of household income—which computes the ratio of selected monthly owner costs to monthly household income for a block group overall. While individual homeowners throughout BowieMitchellville and Vicinity may experience housing cost burden, there are no block groups in the master plan area in which over 50 percent of all homeowners experience housing burden.1
There are, on the other hand, parts of BowieMitchellville and Vicinity where the majority of renters experience housing burden, based on the ACS variable of gross rent as a percentage of household income. Census block groups where gross rent exceeds 30 percent of household income serves as a marker for renter housing cost burden.2 There are eight census block groups in the master plan area where the majority of renters experience housing cost burden. Most of these block groups fall within the City of Bowie.
Housing Affordability Programs
There are various programs in Prince George’s County targeted to both developers and residents in order to increase opportunities for affordable homeownership in Bowie.
• Housing Choice Voucher Program (HCVP): The Housing Choice Voucher Program is a tenantbased voucher program that provides tenants the opportunity to live where they choose. The Rental Assistance Division (RAD) pays the owner the difference between 30 percent of adjusted family income and a PHA-determined payment standard or the gross rent for the unit, whichever is lower. The family may choose a unit with a higher rent than the payment standard and pay the owner the difference not to exceed 40 percent of adjusted family income. All rents are subject to a comparability study of similar unassisted properties in the immediate area. Visit www.HUD.gov to learn more about the HCVP.
• Housing Choice Voucher Homeownership Program (HCVHP): The Housing Choice Voucher Homeownership Program uses a voucher subsidy that once helped families pay rent to a landlord to now be used to help first-time homeowners purchase their own home. Eligibility requires families be a participant of the HCVP in good standing, be a first-time home buyer not having owned a home during the last three years, have a good rental payment history, have a consistent employment history during the last two years, have a minimum annual income of $30,000, and have a minimum credit score of 620. There is no employment or income requirements for the disabled or elderly population. Visit www.HUD.gov to learn more about the HCVHP.
• Moderate Rehabilitation Program (Mod Rehab): The Moderate Rehabilitation Program provides project-based rental assistance for low-income families as a component of a housing agency’s (HA) HCVP. The HA can attach up to 20 percent of its voucher assistance to specific housing units if the owner of the multifamily housing agrees to either rehabilitate or construct the units, or if the owner agrees to set aside a portion of the units in an existing development in exchange for low interest loans. The subsidy stays with the property and will not transfer with the family should they decide to move to other
1 More information about ACS housing cost burden data for owners can be found at: https://www.socialexplorer.com/data/ ACS2015/metadata/?ds=ACS15&table=B25095.
2 More information about ACS housing cost data for renters can be found at: https://www.socialexplorer.com/data/ ACS2016_5yr/metadata/?ds=ACS16_5yr&table=B25070.
Source: American Community Survey Tables: 2014–2018 (5-Year Estimates).
Sherwood Manor
Collington
Overbrook
City of Bowie
Map 24. Median Household Income by Census Block Group (2018) Focus Area
housing. Visit HUD.gov to learn more about the Moderate Rehabilitation Program.
• Pathway to Purchase Program: The Pathway to Purchase Program allows first-time home buyers to be eligible for up to $10,000 in down payment and closing costs toward the purchase of their first home. The program consists of a 0 percent interest, deferred payment loan that is forgiven after 10 years. The purchaser must pay back the loan in full when the home is sold, transferred, or ceases to be the primary residence of the buyer within the 10-year affordability period. Visit www. princegeorgescountymd.gov to learn more about the Pathway to Purchase Program.
• Prince George’s County Purchase Assistance Program (PGCPAP): The PGCPAP provides home purchase assistance to eligible first-time home buyers to purchase housing in Prince George’s County. Home purchase assistance includes down payment, mortgage principal reduction, and closing costs. The program is funded by the Housing Investment Trust Fund. The Redevelopment Authority of Prince George’s County administered PGCPAP in partnership with participating lenders, realtors, and housing counseling agencies that are approved by HUD. Visit www.princegeorgescountymd.gov to learn more about the Purchase Assistance Program
Affordable Housing in Bowie
Bowie is overwhelmingly comprised of households with high median incomes, with most households within Bowie making over $100,000 annually. Bowie Local Town Center, where the median household income is around $53,000, is the only node within the master plan area to fall below the County’s median household income of $83,034. The master plan area is home to six federally subsidized properties, as seen in Figure 15. One of these properties includes an affordable senior care facility, and two offer projectbased rental assistance for people with disabilities.
The remaining three subsidized housing developments are located in Bowie Local Town Center. The first, Pin Oak Village Apartments, is a 220-unit senior housing community that was partially funded through the HOME Investment Partnerships Program. In projects with 5 or more HOME-assisted units, at least 20 percent of these units must be occupied by families earning 50 percent or less of area median income (AMI) with all other HOME-assisted units occupied by families earning 80 percent or less of AMI. The second, Bowie Commons, is a 36-unit Section 8 Project-Based Rental Assistance
property for qualified elderly or disabled residents. Section 8 Project-Based Rental Assistance tenants make a monthly contribution toward rent equal to 30 percent of their adjusted income. The third, Bowie VOA Living Center, is a low-income apartment building for residents with disabilities. The government gives funds directly to apartment owners, such as the Bowie VOA Living Center, who in turn lower apartment rents for low-income tenants.
Considering the overall wealth of Bowie’s existing population, it is unlikely that the development of a 100 percent affordable housing community is necessary to relieve the housing cost burden felt by the master plan area’s most financially vulnerable residents. Instead, Bowie should work with Prince George’s County as well as with private developers and mortgage lenders to ensure that existing affordable housing programs are promoted and marketed to low-income families, so that residents are linked to resources to afford existing housing stock and are offered opportunities to access affordable home ownership. The preservation and maintenance of naturally occurring affordable housing units will be critical to ensure that all Bowie residents have access to units affordable at their income level.
Finally, the County and city can push for new marketrate multifamily developments to set aside a portion of units as affordable units, as well as explore other incentives and avenues for creating mixed-income, multifamily development within the master plan area.
Discussion of Challenges and Opportunities
CONCENTRATING MIXED-USE DEVELOPMENT IN KEY CORRIDORS AND NODES
Concentrating new housing development within existing nodes and corridors will help create walkable, mixed-use communities within the master plan area, while also addressing a variety of challenges and opportunities outlined in Plan 2035. Creating mixeduse communities will bring a range of benefits to Bowie’s residents, including: less air pollution and a reduction in traffic on roadways due to decreased car usage, preservation of the County’s existing agricultural resources by concentrating development near existing commercial centers, and improved connectivity and mobility between neighborhoods by focusing on pedestrian-friendly design. These
are all features of the types of walkable, mixed-use communities that young professionals and seniors alike are seeking across the country.
Developing both market-rate and senior multifamily units within existing nodes and corridors will help create walkable mixed-use neighborhoods while providing residential product that aligns with the housing preferences of Bowie’s growing senior and young professional cohorts. Plan 2035 highlights how too many centers can undermine economic growth, instead favoring new residential development that is concentrated in a limited number of centers to achieve density that supports walkable mixed-use neighborhoods. An excess of local or regional centers can create stress on the County’s existing infrastructure, leading to further traffic congestion and roadway expansions in order to accommodate new housing developments, as is the case along Church Road. Focusing residential development within the BSU/ MARC Station Campus Center, Old Town Bowie, and Bowie Local Town Center focus areas helps combat this challenge by concentrating new multifamily product near existing transit, retail, and employment centers.
INCREASING RESIDENTIAL DENSITY TO ATTRACT ADDITIONAL COMMERCIAL TENANTS
Increasing residential density will help Bowie build a foundation to support additional commercial tenants, helping generate economic growth and increasing Bowie’s regional competitiveness as a location for residents and employers. Residential density is critical to attracting a variety of office and retail tenants, with many commercial tenants using population density thresholds to determine suitable locations for new stores. For grocery specifically, the County’s 2016 Retail Marketability and Competitiveness Study found that national grocery chains typically look for population densities of 50,000–100,000 people within a three-mile radius, or population density of 150,000–200,000 within a five-mile radius, when selecting prospective store locations.3 Bowie’s existing low-density residential neighborhoods can therefore act as a deterrent in terms of attracting new employers and retailers. Further, many commercial tenants today are driven to make locational decisions based on the preferences of young professionals and seniors, two demographics who are driving demand in cities across the country, and who are increasingly flocking to walkable urban communities.
To stabilize its key corridors and nodes as well as attract additional commercial tenants to the area, Bowie will
therefore need to expand its residential base. This growth should be accommodated by adding residential density through the development of townhouses as well as market-rate and senior multifamily housing, as opposed to greenfield development of detached singlefamily homes. Offering a diversity of housing stock options with an emphasis on increased density will help address existing gaps in Bowie’s neighborhoods and will begin to enhance walkability. With major mixeduse developments already planned along the US 301 corridor, there is potential to leverage this momentum for additional residential development within the following nodes:
• Bowie State University/MARC Station Campus Center: Due to a lack of housing options near the Bowie Campus Center, there is potentially an opportunity to build low- to mid-rise marketrate and student apartment units to provide students with off-campus housing options adjacent to campus. Considering BSU’s plans to develop additional on-campus dorm rooms, further engagement with students and faculty will be required to understand the depth of demand for off-campus housing, as well as the market segmentation and potential capture of likely tenants, e.g., graduate students, faculty, and students with families. New multifamily development would add density to the campus center and decrease the need for students to commute from further neighborhoods where multifamily options are more readily available. New multifamily positioned near the MARC station could also be marketed to young professionals who work in Baltimore or Washington, D.C., providing them a one-seat ride to these major employment centers. New housing development within the Bowie State University Campus Center aligns with the vision outlined in Plan 2035.
• Old Town Bowie: Old Town Bowie is mostly comprised of aging housing stock, with many housing units within the node built before 1959. There is potential for Old Town Bowie’s aging housing stock to be repurposed into new residential options designed for seniors, given the lack of pipeline projects targeted specifically to the needs of this demographic. In addition to repurposing existing stock, there could be an opportunity to increase density by adding new townhouses. Townhouses, compared to single-family homes, are relatively affordable, offer a smaller footprint, and could be targeted toward seniors who are looking to downsize from a detached single-family home in
3 “Prince George’s County Retail Marketability and Competitiveness Study.” 2016. Prepared for MNCPPC by RCLCO.
• Prince George’s County Planning Department
a low-density neighborhood. This redevelopment of Old Town Bowie’s aging housing units, as well as the potential development of new senior townhouses, could help attract new retail tenants. However, in order to increase density within Old Town Bowie, the approval of the node’s existing residents will be critical for new development to take place.
• Bowie Local Town Center: With Melford Town Center expecting to deliver 1,500 multifamily units and 300 townhouses, it is best to hold off on increasing market-rate residential development within the Bowie Local Town Center in the foreseeable future to allow the market to absorb this large increase in residential product. However, there may be an opportunity to build townhouses and low-rise multifamily in proximity to Melford in the future that is focused on affordability and creating a mixed-income community to bolster the diversity of residents living within the larger Melford node.
Vicinity
Source: M-NCPPC.
A house in the Red Willow neighborhood (top); the Belair neighborhood (bottom)
Alvista in Bowie
2.3 Commercial Market Profile
The Bowie-Mitchellville and Vicinity master plan area is predominantly a residential community of low-density neighborhoods made up of single-family detached houses. The existing commercial market, primarily Class B/C office and strip center retail, is largely concentrated within Bowie Town Center, while industrial uses are concentrated within the Collington Trade Zone. An overview of the Master plan area’s commercial market is provided in Figure 30. Commercial Market Overview.
This section considers the office, industrial, and retail markets in Bowie-Mitchellville and Vicinity, including existing supply and demand of each commercial use, an overview of current market conditions, and potential future opportunities. The clearest opportunities for supporting commercial market
growth and strengthening existing communities in Bowie-Mitchellville and Vicinity include redeveloping aging shopping centers, increasing infill development along key corridors, and planning for mixed-use development that concentrates residential, retail, and office in existing centers. Strengthening BowieMitchellville and Vicinity’s commercial market is a critical component of creating walkable, vibrant communities as envisioned by Plan Prince George’s 2035 Approved General Plan (Plan 2035).
COVERED IN THIS SECTION:
• Commercial Market Overview
• Office Market
• Industrial Market
• Retail Market
Source: M-NCPPC.
Shops at Bowie Town Center
Commercial Market Summary
OFFICE
With a high vacancy rate of 20.3 percent, and no recent private development activity, Bowie is not an active market for new Class A office space. The master plan area lacks the density, amenities, and transit access that many top employers demand when seeking tenancy in new Class A office space compared to other submarkets in the Washington metropolitan region, such as Bethesda, Silver Spring, Greenbelt, and other Metro station areas in Prince George’s County. Additionally, Bowie’s average Class A office rent of $26.15 per square foot is not high enough to justify the construction costs of new Class A, which typically requires a rent threshold of $30 per square foot based on the construction costs typical of the Washington metropolitan region. In terms of employment, the healthcare industry is responsible for a large portion of Bowie’s employment growth over the past five years, particularly within sectors such as outpatient care centers, home health care services, mental health facilities, and family service centers. Since much of the office market in Bowie-Mitchellville and Vicinity serves local residents, the capacity for office market growth is tied to overall population growth.
INDUSTRIAL
In terms of its industrial market, Collington Trade Zone possesses several competitive advantages for attracting industry tenants in the region:
• Geographic location, which provides accessibility to Baltimore’s ports in addition to ease of access to Washington, D.C.
• Large size, which encompasses over 1,000 acres.
• The designated foreign trade zone within its borders, which provides attractive tariff exemptions to tenants.
With over 4 million square feet of industrial space, the master plan area’s industrial market has performed well over the past two years, with industrial vacancy coming in at just 3.1 percent in 2019. Recent industrial deliveries within the Collington Trade Zone have been the result of large corporate tenants supporting the development of new industrial warehouse space tailored to meet their specific needs. The recommended upgrade (F-10) of US 301 (Robert Crain Highway) into a limited-access freeway, in addition to the replacement of the Harry W. Nice Bridge that crosses the Potomac River to connect southern Maryland to Virginia, will help further enhance Bowie’s regional connectivity and could assist in attracting additional industrial employment to the
master plan area, particularly within sectors such as transportation, logistics, and warehousing.
RETAIL
Bowie’s retail market has performed with relative stability over the past 10 years, though the market experienced a recent uptick in vacancy due to the closure of several large national chains that had outlets in the Bowie area, including Sears, Dressbarn, and A.C. Moore. This loss in Bowie reflects national trends—A.C. Moore and Dressbarn shuttered all of their stores in 2019, while Sears filed for bankruptcy at the end of 2018 and dramatically reduced its number of stores. Most retail within the master plan area is concentrated along the MD 450 (Annapolis Road) corridor and in Bowie Local Town Center. MD 450 (Annapolis Road) provides easy access to a variety of residential communities along the corridor, and retail centers along MD 450 (Annapolis Road) anchored by grocery store tenants serve as hubs for surrounding neighborhoods. Bowie Local Town Center is home to a great concentration of retail and office space, and the node is the master plan area’s core destination for retail shopping along the US 301 (Robert Crain Highway) regional corridor.
There is existing, unmet retail spending potential within the master plan area, meaning residents have to travel outside of the area to meet their shopping needs (see Figure 39. Existing Retail Gap by Industry Sector [2017]). However, Bowie-Mitchellville and Vicinity’s lack of connectivity and transit access, and low-density communities, impede the attraction of new retailers to the area. Additionally, Bowie is in close proximity to other major regional retail centers, like the Annapolis Mall and the Waugh Chapel Towne Centre, both of which are within a 15-minute drive of Bowie Town Center.
Figure 30. Commercial Market Overview
Source: CoStar.
Commercial Type Total
Given that the existing residential base is served by these retail centers located outside of the master plan area, new retail development will not occur without an expansion of Bowie’s residential base.
Recent Commercial Project Deliveries (2015–2019)
Recent commercial deliveries in the master plan area are suburban in character and have primarily been delivered along the MD 450 and US 301 corridors. Bowie Marketplace is the most prominent recent delivery along the MD 450 corridor, with the 135,000-square-foot marketplace replacing the old marketplace shopping center that, according to the 2016 Prince George’s County Retail Marketability and Competitiveness Study, was considered an eyesore for many years. Bowie Marketplace follows the redevelopment of other aging shopping centers along the corridor, including the 264,000-square-foot Free State Shopping Center (renovated in 2006) and the 186,000-square-foot Hilltop Plaza (renovated in 2011). The delivery of Lidl in 2018 marks the fifth grocery store along MD 450, joining the Giant located at Free State Shopping Center, the Harris Teeter located at Bowie Marketplace, and the MOM’s Organic Market and Aldi located at Hilltop Plaza.
Recent commercial deliveries along the US 301 corridor have largely stemmed from phased pipeline projects within Bowie-Mitchellville and Vicinity’s key focus areas. The 2019 delivery of the 144-key Courtyard by Marriott Bowie is the first of Melford Town Center’s three planned hotels. Additionally, the 2016 delivery of La-Z-Boy’s distribution center marked the second phased delivery within the Collington Park Project. The project’s first phase in 2014 delivered the 175,000-square-foot FedEx Ground package sorting facility and two additional industrial buildings, totaling 115,000 square feet, are expected as part of the Collington Park Project’s next phase. Other recent deliveries along US 301 consist of much smaller-scale office and retail infill projects.
Most of the planned commercial development in the master plan area is expected to deliver as part of the Melford Town Center, Mill Branch Crossing, and South Lake master-planned development projects, all of which are located along the US 301 corridor. The total known commercial pipeline is comprised of approximately 911,000 square feet of office, 887,000 square feet of retail, 1,000 hotel rooms, and 115,000 square feet of industrial space.
St. John Properties is currently developing Melford Town Center, a 466-acre mixed-use community located at the intersection of US 50 (John Hanson Highway) and US 301. The 144-key Melford Courtyard by Marriott, the first of three planned hotels, and the 140-unit Tribute at Melford senior living apartment building, which opened in 2019. When completed, Melford Town Center will also include 1,500 multifamily units, 300 townhouses, 260,000 square feet of office space, 85,000 square feet of
Source: CoStar.
Map 26. Notable Pipeline Projects
retail, and two additional hotels. The Prince George’s County Planning Board approved the 435-unit Mansions at Melford Town Center multifamily project, and The Aspen, a 388-unit multifamily building, is currently in its final phase of entitlements. The 300-unit townhouse component of the project is currently in its preliminary entitlement stage.
After unsuccessfully marketing the former 130,000-square-foot Sears building within Bowie Town Center to potential tenants, Seritage Growth Properties is now proposing to redevelop the 10.8-acre site for future mixed-use. The Sears redevelopment is planned to include 800 apartment units, 80,000 square feet of office, 75,000 square feet of retail, and a 155-key hotel. The owners have requested a change to their zoning basic plan to allow for construction of the proposed development program.
Mill Branch Crossing is a proposed 74-acre mixed-use development located east of the US 301 corridor and directly north of Mill Branch Road. The site, which is currently zoned C-S-C (Commercial Shopping Center), is slated to be delivered over two phases. Phase 1 will include 91,000 square feet of office, 405,000
square feet of retail, and a 150-key hotel. Phase 2 will include 182,000 square feet of retail. The Bowie City Council conducted a public hearing on the concept of a proposed zoning text amendment that would permit mixed-use development, including multifamily and townhouse dwelling units in the C-S-C Zone, under certain circumstances. In addition to the June public hearing, the Bowie City Council reviewed proposed draft legislation at a public meeting held on September 3, 2019, and voted to recommend approval of the legislative proposal. The Prince George’s County Council, which has ultimate authority, has yet to approve of the legislative proposal.
South Lake is a 381-acre proposed mixed-use community located at the intersection of MD 214 and the US 301 corridor. With an estimated project cost of $344 million, the development is slated to deliver 344 single-family detached houses, 563 townhouses, 128 condominiums, 325 multifamily units, 600,000 square feet of office and retail, a 390-key hotel, a 5,272-squarefoot clubhouse, several athletic fields, and a 25acre park. In January 2019, the Prince George’s County Planning Board unanimously approved the preliminary plan for South Lake.
Note:
Source: CoStar.
Figure 33. Office Absorption, Deliveries, and Vacancy
Office Market
OFFICE MARKET PERFORMANCE
The master plan area has experienced a moderate increase in total office space square footage over the last decade, with the delivery of Bowie’s new City Hall in 2011 representing the largest recent increase in inventory.
The master plan area’s slight decline in office vacancy in the past 10 years has been driven by decreases in Class B and Class C vacancy. Class A had an exceedingly high vacancy rate of 20.3 percent in 2019, compared to just 5.4 percent and 0 percent vacancy in Class B and Class C office space, respectively.
SUPPLY OVERVIEW
The Bowie-Mitchellville and Vicinity master plan area encompasses 1.8 million square feet of office space, with approximately 670,000 square feet classified as Class A office space. Office buildings within the Bowie-Mitchellville and Vicinity master plan area are typically small scale, with the average rentable building size being just 31,000 square feet with an average floor size of 13,000 square feet. The master plan area’s office market is outperforming the office market of the County overall: the master plan area had a 2019 average rent per square feet of $23.29 and a vacancy rate of 10.4 percent, while Prince George’s County had an average rent per square feet of $21.51 and a 13.6 percent vacancy rate.
In comparing Bowie’s office market to other suburban communities in the region, Columbia, Maryland has seen the most private office development activity over the last five years: 840,000 square feet of new office space across 5 new buildings, compared to only 1
15,000-square-foot office building in the master plan area and no new construction in Odenton, Maryland during the same period.
While Columbia is a similarly positioned residential suburban community in proximity to Washington, D.C. and Baltimore, its office market is performing well as a result of concerted investment in its downtown, with an emphasis on adding new multifamily and retail to help attract tenants and create walkable, mixed-use communities. This is in keeping with typical employer preferences in today’s 21st-century-knowledge economy that favors locations in walkable areas with a density of amenities, as opposed to isolated suburban office parks.
DEMAND OVERVIEW
Demand for private office space in the master plan area is primarily driven by tenants in the healthcare sector, including both clinicians and medical technology support. Inovalon, a technology company that provides cloud-based analytics and data-driven solutions to the healthcare industry, is headquartered in Bowie and employs over 600 people in the company’s corporate headquarters along the MD 197 corridor.
Employment growth over the last five years has largely stemmed from growth in the healthcare and social assistance industry sector, particularly within areas related to outpatient care centers, home health care services, mental health and substance abuse facilities, and individual and family services. Continued employment growth in the healthcare industry over the next five years could lead to increased demand for medical office space in Bowie.
Source: CoStar.
Figure 34. Office Absorption, Deliveries, and Vacancy
Map 27. Notable Class A Office Projects
Note: Numbers in map refer to photos in Figure 35 Notable Class A Office Projects
Source: CoStar.
Class
Figure 35. Notable Class A Office Projects
ONE TOWN CENTER
Size (SF): 105,000
Vacancy: 32.1%
Year Delivered: 2004 (Renoy.)
Key Tenants: Chespeake Medical Imaging, Anne Arundel Urology, Allergy and Asthma Center
BOWIE CORPORATE CENTER
Size (SF): 126,000
Vacancy: 0%
Year Delivered: 2006
Key Tenants: Inovalon, Aesthetic Dermatology and Dermatologic Surgery Center
BOWIE CITY HALL
Size (SF): 80,000
Vacancy: 0%
Year Delivered: 2011
Key Tenants: City of Bowie
84 • Prince George’s County Planning Department
Size (SF): 150,000
Vacancy: 7%
Year Delivered: 2006
Key Tenants: Bohler Engineering, Skill Logic
TOWN
Size (SF): 30,000
Vacancy: 36.8%
Year Delivered: 2002
Key Tenants: Johns Hopkins Community Physicians, The Glaucoma Center
MELFORD PLAZA II
Size (SF): 152,000
Vacancy: 37.1%
Year Delivered: 2009
Key Tenants: The Retina Group of Washington InstallNET, Alpert Schreyer Poe
MELFORD PLAZA I
MELFORD
The healthcare and social assistance sector is Bowie-Mitchellville and Vicinity’s largest and fastest growing industry, so the development of medical office space will likely be a principal driver of new office demand in the future.
DEVELOPMENT POTENTIAL
In terms of demand for office space in the master plan area, the healthcare and social assistance sector is Bowie-Mitchellville and Vicinity’s largest and fastest growing industry, so the development of medical office space will likely be a principal driver of new office demand in the future. Other traditional office occupying industries in the master plan area experienced negative employment growth, including the professional services, retail trade, and finance sectors, while information and real estate sectors barely experienced any employment growth at all. The downward trajectory of employment in these sectors within the master plan area indicate limited future demand for private office space. The master plan area would likely need the support of an institutional anchor such as the County or Bowie State University (BSU) in order to make private nonmedical office space feasible for development. BSU has the opportunity to drive demand for flex office and coworking space located near campus by capitalizing on the university’s ability to partner with prospective research and corporate tenants who would like to work alongside BSU’s faculty and students.
With a known office pipeline of 911,000 square feet, there is potential for office vacancy to increase beyond current levels, especially since employment growth lags behind the amount of total office supply expected to enter the master plan area. Employment growth in the master plan area has been minimal over the last decade, with a compound annual growth rate (CAGR) of 1.1 percent from 2010 to 2019. This growth rate is projected to slow over the next five years, with employment projected to grow at a CAGR of 0.4 percent between 2019 and 2024. This could result in an oversupply of office product and possible increases in office vacancy if there are not both population and employee increases in the master plan area. Much of Bowie-Mitchellville and Vicinity’s existing office market consists of small professional offices and small businesses that serve the local population, so an increase in office supply will need to correlate with population growth to avoid further increases in office vacancy in the area. Given low rents, lack of development activity, and overall Class A market performance, the Bowie office market is not strong enough to support speculative office development, so new office development should only proceed if a tenant or institutional anchor is on board to support project feasibility.
Source: PeopleImages, iStock.
Industrial Market
INDUSTRIAL MARKET PERFORMANCE
The master plan area’s industrial market is concentrated within the Collington Trade Zone, which has several competitive advantages for attracting industry tenants, including its geographic location, which provides accessibility to Baltimore’s ports and ease of access to Washington, D.C. The zone’s large size (over 1,000 acres) and the presence of a foreign trade zone within its borders, which provides attractive tariff exemptions, also add to its competitiveness. The recommended upgrade (F-10) along with the future replacement of the Harry W. Nice Bridge will also further enhance the trade zone’s industrial competitive advantage, as both updates will further increase the master plan area’s regional connectivity, improving vehicular and trucking access and bringing opportunities for additional industrial employment.
Industrial space has largely absorbed well within the master plan area, driven by sizable companies leasing large-scale warehouse buildings to expand capacity in the region. It is these same sizable tenants who
contribute to the fluctuating vacancy rate of industrial space, as tenants have moved in and out of the region over the past 10 years.
INDUSTRIAL MARKET SUPPLY
The Bowie-Mitchellville and Vicinity master plan area contains 4.2 million square feet of industrial space, of which 3.2 million square feet is concentrated within the Collington Trade Zone. The Collington Trade Zone is the sole concentrated node of industrial space in the master plan area, as other industrial space in the area is more scattered and not found in clusters. The Collington Trade Zone is comprised of a variety of industrial uses, including commercial printing, distribution, packaging, warehousing, construction, and light manufacturing. Many large multinational corporations have sizable distribution centers of over 150,000 square feet in the Collington Trade Zone to distribute product throughout the region, including Nordstrom, FedEx, and La-Z-Boy.
Figure 36. Industrial Absorption, Deliveries, and Vacancy
Source: CoStar.
INDUSTRIAL MARKET DEVELOPMENT POTENTIAL
The industrial market within the master plan area is anticipated to grow by 115,000 square feet as a result of MRP Industrial’s Collington Park Project located within the Collington Trade Zone. After the delivery of FedEx Ground’s 175,000-square-foot package sorting facility in 2014 and La-Z-Boy’s 221,000-square-foot distribution center in 2016, MRP Industrial, the owner and developer of Collington Park, is slated to develop a 90,000-square-foot warehouse facility in addition to a 25,000-square-foot industrial building.
In terms of industrial growth, commercial printing manufacturing (except screen and books) is the only industrial sector that has experienced employment growth over the last 5 years, with total jobs increasing by 44 percent from 2015 to 2019. This sector encompasses businesses that engage in commercial printing activities, such as stationery and labels, as well as photocopying services and printing materials using digital printing equipment. Most other industrial sectors within the master plan area have experienced no change in employment at all over the last five years, while textile product mills, cleaning manufacturing, and machine manufacturing have all experienced decreases in employment over the same period. Based on these recent trends, new industrial development should only proceed when interested corporate tenants are secured.
Retail Market
RETAIL MARKET PERFORMANCE
The master plan area’s retail market experienced a spike in vacancy in 2019 due to a variety of large-scale retail chains going out of business, including Sears and A.C. Moore.
Prior to the closing of these retail chains in 2019, retail vacancy in the master plan area had been at a 10-year low for the past three years, with vacancy reaching an all-time low of just 2.3 percent in 2018. This indicates sustained demand for neighborhood retailers from high-earning residents who have disposable income, as well as from older residents who may prefer shopping at traditional brick and mortar retail stores.
RETAIL MARKET SUPPLY
The Bowie-Mitchellville and Vicinity master plan area includes approximately 3,753,000 square feet of retail space and currently has another 887,000 square feet of retail within its known development pipeline. The average floor size and average leasable space for retail in the master plan area is 19,000 square feet in a singlestory format. The majority of retail within the Bowie master plan area is located within shopping centers serviced by large surface parking lots situated along its three main corridors.
Figure 38. Retail Absorption, Deliveries, Vacancy
Source: CoStar.
Rentable Square Footage (SF)
• The MD 197 (Collington Road) Corridor primarily consists of retail concentrated at the southern end of the corridor around the 572,000-square-foot Bowie Town Center strip, which is largely comprised of national retail chains and fast casual restaurants. The 103,000-square-foot Bowie Plaza is the only concentration of retail located further north along the corridor at the intersection of MD 197 (Collington Road) and Old Chapel Road and consists primarily of neighborhood convenience retail. Old Town Bowie is also home to much smaller-scale retail tenants, which are mostly comprised of older antique shops and auto repair stores, with Old Bowie Town Grille being the only restaurant located within the small community.
• The MD 450 (Annapolis Road) Corridor is home to three shopping centers with big-box anchor stores complemented by in-line retail. These shopping centers include the 186,000-squarefoot Hilltop Plaza, the 264,000-square-foot Free State Shopping Center, and the 135,000-squarefoot Bowie Marketplace, all of which are redevelopment projects that replaced previously aging shopping centers.
• The US 301 (Robert Crain Highway) Corridor has the largest concentration of retail, which largely consists of standalone big-box anchor tenants with large surface parking lots at the intersections of US 50 (John Hanson Highway) and US 301 (Robert Crain Highway) within Bowie Town Center.
RETAIL MARKET DEMAND
Population trends project that senior residents will comprise the majority of household growth within the master plan area. This growing senior population will drive demand for retail, and seniors are increasingly favoring walkable, mixed-use communities that encompass a variety of retail uses that suit their daily needs. As Plan 2035 states, both young, highly-skilled workers and seniors increasingly prefer to use public transportation, walk, and bike rather than drive to work or to complete errands. Plan 2035 emphasizes the need for mixed-use communities to incorporate improved mobility options for targeted population groups, particularly the County’s elderly, mentally and physically disabled, and low-income households in suburban and rural areas not served by transit on a regular basis, so that all Bowie residents have access to connected communities, including potential future retail development.
UNMET RETAIL SPENDING
A retail gap exists when residents are forced to spend their income outside of their vicinity due to lack of retail options in their area. Supply of retail within the area does not meet demand, and residents’ unmet spending potential is the dollar amount being spent outside of the master plan area. In the master plan area, all major retail sectors have a large retail gap, as seen in Figure 39. Existing Retail Gap by Industry Sector (2017).
Source: ESRI Business Analyst,
Figure 39. Existing Retail Gap by Industry Sector (2017)
Columbia, MD
County
Bowie-Mitchellville and Vicinity
minutes away
Annapolis, MD
Arundel County
spaces
The existence of this retail gap across all major sectors in the master plan area indicates that Bowie residents are currently traveling outside of the area to fulfill their shopping needs. While the master plan area is home to a wealthier residential base than much of the County, the area’s low-density suburban character lacks the population density required to entice retail tenants to the market. These Bowie residents are already being served by existing retail outlets in other nearby communities, so without increasing residential density within the master plan area, it will be difficult to attract additional retail outlets.
Prince George’s County Planning Department
Source: CoStar.
Map 30. Master Plan Area’s Existing Retail in Comparison to Columbia and Annapolis highlights the Bowie master plan area’s existing retail supply in comparison to the existing retail supply in Columbia, MD and Annapolis, MD. Both areas have higher concentrations of retail along key corridors such as Snowden River Parkway in Columbia and West Street in Annapolis, when compared to retail in Bowie. Many retailers such as Wegmans, Trader Joe’s, Costco, and The Cheesecake Factory will be hesitant to develop additional stores within the master plan area, as their existing nearby stores draw customers from a wide trade area which already includes the existing base of Bowie residents.
Map 30. Master Plan Area’s Existing Retail in Comparison to Columbia and Annapolis
Anne
Howard
Baltimore
Prince George’s County
15-mile radius
10-mile radius
Waugh Chapel Town Center: 15 minutes away from Bowie Town Center
The Mall of Columbia: 40 minutes away from Bowie Town Center
15
from Bowie Town Center
Master Plan Area
Retail
Source: CoStar.
Figure
BOWIE PLAZA
WATKINS PARK PLAZA
OLD TOWN BOWIE
POINTER RIDGE PLAZA
Type:
OPPORTUNITIES TO MEET UNMET RETAIL SPENDING POTENTIAL
There is potential to target these existing retail spending gaps by developing new infill retail within the area’s main nodes and corridors. An expansion of Bowie’s residential base will be key to supporting new retail.
• MD 197 (Collington Road) Corridor: The MD 197 (Collington Road) corridor can provide new retail tenants across a variety of sectors through the redevelopment of Bowie Plaza. Due to the lack of grocery tenants north of MD 450, there is an opportunity to redevelop Bowie Plaza into a neighborhood shopping center with a grocery-anchor tenant as well as in-line retail that includes an assortment of fast-casual dining options, general merchandise stores, and other miscellaneous retailers.
• MD 450 (Annapolis Road) Corridor: With MD 450’s grocery-anchored shopping centers performing well along the eastern corridor, there is potential to leverage these successful retail redevelopment projects by further increasing retail infill along the corridor’s western end. This includes the potential development of bookstores, clothing stores, or full-service restaurants.
• US 301 (Robert Crain Highway) Corridor: With most of US 301’s retail concentrated around Bowie Town Center, an opportunity exists to increase retail infill along the southern end of the corridor through the redevelopment of Pointer Ridge Plaza. If redeveloped, the retail center has potential to be a grocery-anchored neighborhood shopping center that also offers different food and beverage, health and personal care, and general merchandise options near MD 214.
• Bowie State MARC Station Campus Center: Due to the lack of retail available near BSU’s campus, there is an opportunity to provide fastcasual dining options, a small grocery tenant, and general merchandising stores adjacent to campus to cater to BSU students, faculty, and staff, as well as to MARC commuters.
DEVELOPMENT POTENTIAL
There are a variety of aging shopping centers that lack quality retail in the master plan area that can be redeveloped to increase infill along Bowie’s prime corridors and offer new shops to meet unmet retail spending.
Case Studies of Successful Retail Center Redevelopments
Free State Shopping Center and Bowie Marketplace are examples of how successful redevelopment of aging retail centers can help strengthen rents and attract key retail tenants along a prime corridor.
1. Free State Shopping Center is a 264,000-square-foot anchored retail center located along MD 450 (Annapolis Road), just north of Bowie Marketplace. Renovated in 2006 by Therrien Waddell, this previously aging shopping center was converted into a contemporary retail center via physical improvements such as new storefront facades, roofs, HVAC systems, electric and water service, loading docks, and storeroom extensions for each retailer. Anchor retail tenants such as Giant, Office Depot, Ross Dress for Less, and TJ Maxx are among the various retailers located within the shopping center. Free State Shopping Center has currently been able to achieve an average rent per square foot per year of $30.00 due to this successful large-scale revitalization. It was purchased by New Market Properties LLC for $72 million in 2019.
2. Bowie Marketplace is a 135,000-square-foot retail center located directly south of Free State Shopping Center along the MD 450 (Annapolis Road) corridor. The $22 million redevelopment is anchored by Harris Teeter and features several restaurants and other businesses. Bowie Marketplace is a rehabilitation of the old Marketplace shopping center, which continuously lost retail tenants including its previous anchor, Safeway. The old Marketplace was considered an eyesore to many within the community as its condition decayed before being purchased by Berman Enterprises in 2012 for future development. After its delivery in 2016, Bowie Marketplace currently achieves an average rent per square foot per year of $31.00 as a result of this successful redevelopment effort.
Source: CoStar.
Discussion of Challenges and Opportunities
It will be difficult for the master plan area to attract new commercial development without increasing its residential base. Pursuing infill residential development along Bowie’s main corridors is an opportunity to increase the master plan area’s residential density to build a base large enough to sustain additional retail outlets.
This can be accommodated by redeveloping aging shopping centers as well as increasing infill development along primary corridors. Planning for mixed-use development that includes residential, retail, and office clustered in existing centers is the primary way for Bowie to begin creating walkable, vibrant communities as envisioned by Plan 2035:
• MD 197 Corridor: Due to the lack of retail options at the northern end of the corridor, there is potential for retail development near BSU in order to provide students with retail options near campus. There is also potential for new office development near BSU’s campus, if the university is interested in supporting new development for university research purposes. Additionally, there is an opportunity to increase the amount of medical office space located at the southern end of the corridor in an effort to carve out a medical office cluster within the master plan area to capture future anticipated employment growth within the healthcare sector. The redevelopment of Bowie Plaza can help attract new retail tenants north of Bowie Town Center while also helping to close existing retail gaps within the market. There is also potential to increase retail density in Old Town Bowie; however, approval from existing residents is critical in order to increase residential or commercial density within the node.
• MD 450 Corridor: Given the strong performance of MD 450’s grocery-anchored retail centers, there is potential to leverage these successful retail redevelopment projects by further increasing retail infill along the corridor. With the majority of retail located along the eastern end of the corridor, there is an opportunity to strengthen the corridor with retail infill along the corridor’s western end. Since the MD 450 corridor is already home to five grocery anchor tenants, other sectors of retail should be developed to complement these grocery tenants, such as restaurants, clothing apparel, and general merchandise stores. The perceived opportunity for increased retail infill along the western end of MD 450 takes into account the presence of the Vista Gardens Marketplace, located further west along MD 450 outside of the master plan area.
• US 301 Corridor: The South Lake project at the intersection of US 301 and MD 214 presents an opportunity to increase retail density on the southern end of the corridor by redeveloping Pointer Ridge Plaza. This would help attract new retail tenants south of Bowie Town Center near MD 214, which currently lacks substantial retail tenants across all sectors. The development of new industrial space within the Collington Trade Zone would be most feasible if a largescale corporate tenant were to support new development by setting up tenancy within a new industrial development built-to-suit for their individual manufacturing needs.
Source: M-NCPPC.
Vista Gardens Marketplace
Branch Pond
Source: M-NCPPC.
2.4 Land Use, Zoning, and Urban Form
There exists an opportunity in the BowieMitchellville and Vicinity master plan area to accommodate new growth while allowing existing residents to comfortably age in place. Bowie’s fastest growing population are older adults, aged 55 and up, of which those aged 65 and above are the fastest growing group. However, new development within the master plan area appears to be attracting young millennial adults aged 25–34, a population group that also increased between 2010 and 2018. Understanding how best to capitalize on this opportunity requires an examination of land use, zoning, and urban form in the master plan area.
This section examines a range of questions related to land use and growth in the master pan area: how best can the master plan area accommodate new residential and commercial growth while preserving natural resources and quality of life? Can commercial development in key nodes create jobs and improve quality of life for new and existing residents? How can new commercial development reinvigorate aging and
underperforming commercial centers? Which zoning classes in Prince George’s County have been most successful in encouraging this kind of growth?
This section first examines land use in the master plan area, contextualizing findings to Prince George’s County overall. Next, it analyzes built form, drawing attention to built housing and commercial typologies of note. Finally, the section analyzes zoning in the master plan area to understand its historical and present role in shaping the land uses and the built form.
COVERED IN THIS SECTION:
• Land Use and Urban Form
• Zoning
Melford Town Center
Land Use and Urban Form
LAND USE PATTERNS
Land in the master plan area is primarily occupied by low-density residential uses (including rural and agricultural) and parks and open space. Together, these uses represent 63 percent of the master plan area’s acreage.
Land use patterns in the master plan area are similar to those of Prince George’s County overall (See Figure 41. Existing Land Use, County and Master Plan Area), aside from subtle differences. Residential land use in the master plan area is almost exclusively single-family detached housing; as a share of total land use, the County has more mixed-use and multifamily developments.
Map 33. Master Plan Area Existing Land Uses, examines the spatial distribution of land uses in the master plan area. A few spatial patterns emerge:
1. Single-family detached residential land use is spread throughout the master plan area.
2. Rural and agricultural land use is concentrated in the growth management area, east of US 301/ MD 3 (Crain Highway).
3. Higher density residential land uses—attached homes, townhouses, and multifamily housing— are concentrated around existing commercial nodes and along key corridors. Most higher density housing is located in and around the Bowie Local Town Center, with additional developments along MD 450 (Annapolis Road) and MD 214 (Central Avenue) corridors.
4. Commercial land uses tend to be located on large parcels.
5. Institutional uses, such as places of worship and public schools, are spread throughout the master plan area and tend to occupy large parcels.
6. Other than transportation corridors, a number of other linear features divide the master plan area, including transmission lines and natural corridors. These features can be seen in Map 33. Master Plan Area Existing Land Uses.
Figure 41. Existing Land Use, County and Master Plan Area
Prince George’s County Master Plan Area
Source: GiS Data Catalogue, Planning Department Of Prince George’s County
PLAN 2035 LAND USE ALIGNMENT
The 2014 Plan Prince George’s 2035 Approved General Plan (Plan 2035) lays out a vision for land uses for the County to achieve by 2035, called generalized future land use 2035 (GFLU). Plan 2035 seeks to preserve the County’s natural assets while densifying areas with public transit access near Washington, D.C. (in particular, within the I-95/I-495 [Capital Beltway]). Map 34. Generalized Future Land Use in Prince George’s County highlights this vision. When comparing existing land uses to the GFLU, one noticeable change is the dramatic increase in the
share of high- and medium-density housing typologies and mixed-use areas in the County’s future land use. Additionally, there is a reduction in exclusively commercial areas, with most of these centers reenvisioned as mixed use. This is also the case in the master plan area as seen in Map 35. Generalized Future Land Use in Bowie and Vicinity (2014).
Plan 2035 re-envisions the master plan area’s commercial nodes as mixed use, rather than simply commercial areas ringed by high- and mediumdensity residential development. Notably, the GFLU proposes the large parcel north of the Collington Trade Zone be redeveloped as mixed-use.
Figure 42. Existing and Generalized Future Land Use (as Percentage of Total Land Use)
Existing Land Use
Prince George’s County Master Plan Area
Generalized Future Land Use
Prince George’s County
Master Plan Area
Source: GIS Data Catalogue, Planning Department Of Prince George’s County.
Bowie-Mitchellville and Vicinity Master Plan Area
N5miles
Source: GIS Data Catalogue, Prince George’s County Planning Department.
City of Bowie
Map 35. Generalized Future Land Use in Bowie-Mitchellville and Vicinity (2014)
Source: GIS Data Catalogue, Prince George’s County Planning Department.
DENSITY
One-third of the master plan area is developed with single-family detached residential development. Much of the City of Bowie north of US 50 is historic Levittown. The history of the Levittown subdivision is discussed in detail in Section 2.6. Community Heritage, Culture, and Design. Map 36. Dwelling Units by Parcel
in the Master Plan Area (2001–Present) illustrates the prevalence of single-family detached residential development in the master plan area. But for several parcels, most located in and around the Bowie Local Town Center, all residential parcels in the master plan area host one dwelling unit per parcel.
Map 36. Dwelling Units by Parcel in the Master Plan Area (2001–Present)
Source: GIS Data Catalogue, Prince George’s County Planning Department.
Map 37. Density Units in the Master Plan Area (2001–Present)
Source: GIS Data Catalogue, Prince George’s County Planning Department. Nevertheless, considerable variation exists in the dwelling unit density of the master plan area, within the category of single-family detached development. In other words, within the category of single-family detached zoning, some development types may be far denser than others due to the different minimum and maximum lot sizes. Map 37. Density Units in the Master Plan Area (2001–Present) shows the distribution of density units—defined as dwelling units
per acre—across the master plan area. Certain zoning designations result in denser development patterns. Most of Bowie’s residential areas have a dwelling unit density between 1.1 and 7.9 units per acre. This density corresponds relatively closely to the Residential Low (RL), Rural Residential (R-R), Residential Suburban (R-S), Residential 55 (R-55), and Residential 80 (R-80) zoning classes common throughout the master plan area. These classes are examined in more detail later.
Persons per Acre
N5miles
Bowie-Mitchellville and Vicinity Master Plan Area
Source: U.S. Census Bureau, 2018 Five-year American Community Survey, Tiger LINE Geographies.
As seen in the Demographic and Economic Profile section, this density is relatively low but similar to the rest of Prince George’s County, particularly outside of the I-95/I-495 (Capital Beltway).
Densities within the I-95 and I-495 corridors (within a half-mile) are similar to those found in the City of Bowie. However, the City of Bowie stands out from its vicinity as having a relatively higher dwelling unit density.
Densities within I-495 (Capital Beltway) are relatively uniformly high compared to the master plan area.
Much of the residential development since 2012 in the master plan area has been of very low- and lowdensity residential housing—under 3.5 dwelling units per acre. This is considerably lower density than seen in Figure 43. Single-Family Detached Residences in the City of Bowie, Zoned Residential 80 (R-80) and
and Vicinity Master Plan: Existing Conditions Report
City of Bowie
Bowie-Mitchellville and Vicinity Master Plan Area
Map 38. Built Density in Prince George’s County (2018)
City of Bowie
Figure 43. Single-Family Detached Residences in the City of Bowie, Zoned Residential 80 (R-80) and Residential 55 (R-55)
44. Recent Development in the Residential-Agricultural (R-A) Zone South of US 50 and West of Church Road
George’s
Figure
Source: GIS Data Catalogue, Prince George’s County Planning Department.
Source: GIS Data Catalogue, Prince George’s County Planning Department.
Residential 55 (R-55). The majority of this development has occurred in Residential Estate (R-E), Residential Agricultural (R-A), and Residential Low (R-L) zones as well as in one parcel zoned Mixed-Use TransportationOriented (M-X-T) (just north of US 50). R-E and R-A zones are both traditional Euclidean single-family detached zones while the R-L and M-X-T zoning classes are Comprehensive Design Zones. This suggests that developers may be relatively agnostic between singlefamily detached zoning classes in the master plan area. More analysis, including targeted stakeholder interviews, would be required to better understand developer preferences.
The overall development pattern in the master plan area is likely shaped by the desire to develop a limited number of remaining greenfield parcels available for development. Greenfields are sites that may have been used for agriculture, forest, open space, or otherwise left undeveloped in the past, and are now earmarked for development.
Land use trends point to the continued attractiveness of low-density housing in Prince George’s County, in particular for middle-class households. This trend poses a challenge to the development of up-market commercial amenities, which require high population densities to maintain financial viability.
BUILDING AGE
Bowie-Mitchellville and Vicinity has seen two periods of sustained development in its history. The first came in the early 1960s during the post-war suburban building boom, lasting in Bowie through the early 1970s. Development of all uses occurred during this time, with the biggest boom in single-family detached housing, principally in the City of Bowie. Figure 45. Residential Construction History (2001–Present) charts residential development history in the master plan area since 1900. This boom is clearly visible as a large jump in existing dwelling units built (approximately 10,000 units between 1956 and 1974).
A second and more sustained building boom began in the mid-1980s lasting until the Great Recession in 2008. This building boom included both the development of residential housing—including denser attached, townhouse, and multifamily typologies—as well as commercial, office, and industrial uses.
A notable pattern in Bowie-Mitchellville and Vicinity’s construction history is that commercial, office, and industrial development in the master plan area has favored large lots since the early 1980s. In terms of total acreage developed, development preceding 1980 appears limited but for outliers in 1970. This trend is
45. Residential Construction History (2001–Present)
Figure
46. Nonresidential Construction History: Existing Parcel Development Date (1900–2020)
Nonresidential Construction History: Existing Parcel Development Date and Acreage (1900–2020)
Figure
Figure 47.
Source: GIS Data Catalogue, Prince George’s County Planning Department.
Source: GIS Data Catalogue, Prince George’s County Planning Department.
illustrated in Figure 46. Nonresidential Construction History: Existing Parcel Development Date and Acreage (1900–2020). An average of about five industrial and commercial parcels per year were developed preceding 1970. Since 1970, there is a noticeable trend toward developing or redeveloping very large parcels zoned for commercial, office, or industrial uses.
Since 1970, about 15 industrial or commercial parcels per year have been developed or redeveloped. This represents a three-fold increase. However, in terms of acreage there was an increase larger by two orders of magnitude. This suggests that not all small parcels of these uses have been attractive for redevelopment. This presents an opportunity for efforts to add commercial amenities or office space to the master plan area to focus on existing large parcels, whether undeveloped or not, and to consolidate parcels into single zoning lots.
OWNERSHIP PATTERN
The majority of the master plan area is privately owned, about 71 percent of the area’s total acreage. The remaining 29 percent of the master plan area’s acreage is shared between local, state, and federal governments as well as nonprofits, religious institutions, and other nonprivate stakeholders.
Map 39. Nonprivate Land Ownership in the Master Plan Area (2001–Present) illustrates that there is no apparent pattern to the distribution of publicly owned lands throughout the master plan area. All areas in light gray are privately owned.
A number of large publicly owned parcels fall along MD 214, MD 197, and MD 450, as well as in the City of Bowie. These parcels, along with most publicly owned
parcels in the master plan area, are used as parks, open space, or institutional uses.
About 10 percent of the acreage of nonprivately owned land in the master plan area is vacant, compared to about 15 percent in the master plan area overall. (See Figure 48. Ownership of Vacant Land in the Master Plan Area [2001–Present]).
The City of Bowie owns about 11 percent of vacant land in the master plan area, making this the largest nonprivate owner type. Most vacant parcels owned by the City of Bowie are small and scattered throughout the master plan area. One large vacant parcel is near the Old Town Bowie focus area.
After local municipalities, the State of Maryland is the second largest nonprivate owner of vacant land in the master plan area, representing about eight percent of vacant land overall. Most of this land is adjacent to Bowie State University (BSU), and likely reserved for campus expansion. The state owns one large parcel north of MD 214 near the Six Flags America, bordered by the Belt Woods Natural Environment Area on two sides, itself owned by the Maryland Department of Natural Resources (DNR). The parcel is zoned for Reserved Open Space (R-O-S) though is not developed to accommodate visitors.
Figure 48. Ownership of Vacant Land in the Master Plan Area (2001–Present)
Nonprofit, less than 1%
9%
Municipality, 11% County, less than 1%
80%
Source: GIS Data Catalogue, Prince George’s County Planning Department.
Acres
41. Growth Management Areas in the Master Plan Area (2001–Present)
Growth and Preservation Areas
State Priority Preservation Areas Growth Boundary Established Communities
Source: GIS Data Catalogue, Prince George’s County Planning Department.
GROWTH MANAGEMENT AREAS
The approval of Plan 2035 established Growth Management Areas a Growth Boundary that delineates delineating areas approved for new development and defines the Rural and Agricultural areas meant for preservation. Plan 2035 also defines the Future Water and Sewer Service Areas where future water and sewer service is allowed, and hence additional development, and rural and agricultural areas for preservation. (See Map 41. Growth Management Areas in the Master Plan Area [2001–Present]).
The large majority of the master plan area, 69 percent by acreage, is within the Growth Boundary and developable. The Growth Boundary stretches along the eastern side of the master plan area.
Source: GIS Data Catalogue, Prince George’s County Planning Department.
SEWER GROWTH
Through the 2012 Sustainable Growth Act, the State of Maryland established four growth tiers based on specified land use characteristics, which may be adopted by counties and other jurisdictions. As defined in the bill, lots in Tier I areas are to be served by public sewage systems. Tier II areas are currently served or planned to be served by public sewer (except for in the
case of minor subdivisions, which may be served by onsite sewage systems). Tier III and Tier IV are both areas not planned for sewerage service. Tier III may include municipal corporations, rural villages, or areas planned for large lot and rural development. Tier IV areas are planned for protection, preservation, or conservation (e.g., rural legacy, priority preservation areas, etc.).1
1 The Sustainable Growth Act of 202 (Senate Bill 236) can be accessed in full at: http://mgaleg.maryland.gov/mgawebsite/ search/legislation?target=/2012rs/billfile/sb0236.htm.
Ternberry
Figure 49. Street Network in the City of Bowie
Figure 50. Street Network with Low Connectivity
Source: GIS Data Catalogue, Prince George’s County Planning Department.
Source: GIS Data Catalogue, Prince George’s County Planning Department.
Map 42. Sustainable Growth Act Tiers Determining Sewer Growth (2014) maps areas planned for sewer service in 2014 after the approval of Plan 2035. Tier II areas are those with sewer service planned or under development, indicated in light yellow on the map. Presently, little residential development has occurred in Tier II areas in Bowie-Mitchellville and Vicinity. Tier III and Tier IV areas, shown in dark and light green on the map, are areas without sewer service or planned sewer service. These areas all fall outside the County Growth Boundary.
NETWORK CONNECTIVITY ANALYSIS
The distance between destinations has implications for how urban a neighborhood may feel and how attractive an area may be for cycling and walking. These are subjective and hard-to-capture aspects of the built form. Nevertheless, it is instructive to examine these measures to gain an understanding of urban form and character in Bowie-Mitchellville and Vicinity.
Network connectivity analysis examines the master plan area using two measures, link-node ratio and betweenness centrality. These measure to what extent a network, a road network in this case, may increase distances between locations.2
Map 43. Link-Node Ratio in Bowie-Mitchellville and Vicinity maps link-node ratio in the master plan area, defined as the number of links (road segments between intersections) and nodes (intersections). A perfect grid has a link-node ratio of 2.5. Suburban areas with culs-de-sac and other dead-ends will have lower link-node ratios, typically between 1.0 and 1.5.
The link-node ratio is uniformly high in the City of Bowie, particularly in the historic Levittown, relative to other parts of the master plan area. Link-node ratios in the City of Bowie range between 1.5 and 2.3 in most areas.
While the street network in the City of Bowie has many attributes of traditionally suburban street design—gentle curves, for example—most streets are connected to the network at their beginning and end. Abstracted, the street network is relatively grid-like.
By contrast, street networks in suburban subdivisions recently constructed in the master plan area have less well-connected layouts, as seen in Figure 50. Street Network with Low Connectivity.
Another measure of network connectivity is called betweenness centrality, which measures the share of shortest paths that are routed through every road. The total number of shortest paths is calculated for every pair of intersections in the master plan area plus a small buffer around it. As such, betweenness centrality measures how important a road network is to the local network, rather than the regional network.3
This analysis highlights the role of US 301/MD 3 (Crain Highway), Church Road, and MD 214 as major corridors in the master plan area.
Mount Oak Road and Mitchellville Road are also important to the local road network, connecting homes in the Church Road corridor and City of Bowie south of I-50 to the Bowie Local Town Center.
One notable observation is that the Old Town Bowie and BSU focus areas are poorly connected to the local road network. Though they are relatively close to populous parts of the master plan area, they may be considered out of the way for some, in comparison to Bowie Local Town Center. This suggests that while these focus areas may represent opportunities for commercial and residential development, they may be less attractive to the market than commercial and retail offerings in the Bowie Local Town Center focus area.
2 Dill, Jennifer. “Measuring Network Connectivity for Bicycling and Walking.” Transportation Research Board 2004 Annual Meeting.
3 This assumption leads to some challenges such as favoring road segments that traverse more of the master plan area, thereby understating the importance of some roads. An example is US 50, a major corridor that very directly bisects the master plan area. However, US 50 has very few direct connections to the local network in the master plan area.
of Road Segments Over Number of Intersections
Betweenness Centrality—Share of Shortest Paths Passing Through Each Road
Note: Betweenness centrality measures the share of shortest paths that are routed through every road The total number of shortest paths is calculated for every pair of intersections in the master plan area plus a small buffer around it thus measuring how important a road network is to the local network, rather than the regional network
Source: Open Street Map; GIS Data Catalogue, Prince George’s County Planning Department.
Map 45. Master Plan Area Existing Zoning (New Zoning Ordinance Pending)
Bowie MARC Campus Center
Zoning Class
Commercial Zones (CA, C-M, C-O, C-S-C)
Industrial Zones (I-1, I-4) and Employment Areas (E-I-A)
Zoning
Mixed-Use / Community Planning Zones (M-U-I, M-X-C, M-X-T) and Activity Centers (L-A-C, M-A-C)
Residential High (R-U)
Residential Medium (R-18, R-30C, R-M, R-T)
Suburban (R-55, R-80, R-S)
Residential Low (R-L, R-R)
Source: GIS Data Catalogue, Prince
The Land Use and Urban Form section examined the current built form in the master plan area. This section examines the zoning policy underlying these forms and what policies have been successful in encouraging the kinds of medium- to high-density mixed-use development recommended by Plan 2035.
ZONING MAP
Residential Very Low (R-A, R-E)
Parks and Open Space (O-S, R-O-S)
Focus Area
City of Bowie
County Planning Department.
Map 45. Master Plan Area Existing Zoning (New Zoning Ordinance Pending) maps parcel zoning classes in the master plan area. The large majority of the master plan area is zoned for low-density suburban development or open space.
Pin
Figure 51. Zoning Classes in the Bowie-Mitchellville and Vicinity Master Plan Area*
*Many of the zoning classes in the master plan area have subclasses allowing for varying density levels. These are indicated by the “Subclass” column. “DU” is an acronym for “Density Units” (dwelling units per square acre). “Est” is an abbreviation of “estimated.” Estimated density units and underbuilt density units are calculated for the zoning class overall and not the zoning subclass, which is why figures repeat in these columns and in the “Units” and “Acres” columns. “Underbuilt” is defined as the difference between the total land allowable or zoned for a given type of development, minus the total land area already built of that type. In this case, the figure represents the total density of units over- or underbuilt. Given the existing zoning dataset provided by M-NCPPC, it is not possible to differentiate between zoning subclasses. Retirement zoning subclasses are not indicated in this table to reduce clutter. A guide to zoning classes in Prince George’s County can be found at http://www.mncppc.org/DocumentCenter/View/1366/Guide-to-Zoning-Categories-PDF.
Source: GIS Data Catalogue, Prince George’s County Planning Department.
CURRENT ZONING VERSUS LAND USE
Figure 52 examines the current land uses of parcels in the master plan area by their primary zoning class. Some parcels overlap between multiple zoning classes. Here, parcels are grouped by the zoning class representing the largest percent of their acreage. Generally, this value is 100 percent or slightly less but for a few exceptions. This analysis ignores these exceptions, as it is only meant to give an indication of how current zoning impacts land use. This graphic should be read for the main patterns it displays, rather than smaller patterns that may simply be the result of noise in the data.
Finally, some zoning classes are only used for a small number of parcels. The total acreage by land use for each zoning class is displayed in Figure 53 examines the share of acreage by land use and zoning class.
A first pattern that emerges when considering land use and zoning in Bowie-Mitchellville and Vicinity is that lower density residential zoning classes tend to overlap significantly with other uses, especially open space and transportation/utilities/other uses. Further, lower density residential zoning classes have a higher chance of being partly vacant. These zoning classes are R-L, R-R, R-A, and R-E.
By contrast, denser residential zoning classes—R-U, R-M, R-T, R-30C, R-18, R-S, R-80, and R-55—have
Prince George’s County Planning Department
comparatively uniform land uses. This is in part because these parcels tend to be smaller and contain zoning lots neatly targeting specific parcels rather than larger areas.
Of the mixed-use and community planning zones present in the master plan area—Major Activity Center (M-A-C), Local Activity Center (L-A-C), Mixed-Use Infill (M-U-I), Mixed-Use Transportation-Oriented (M-X-T), and Mixed-Use Community (M-X-C)—M-A-C and L-A-C are most likely to produce what appear to be genuinely mixed uses.
One significant M-X-C parcel is currently under development—Fairwood. The M-X-C Zone was created specifically for this development. It is the only M-X-C zone in the County. The zone was intended to create a master-planned, low-density suburban housing development with community-serving retail and public facilities. As of the time this data was last updated, no commercial or retail facilities have been constructed as shown in the figures above. Once built, the zone will reflect the mix of uses planned for the parcel.
Commercial Miscellaneous (C-M), the primary zoning class of commercial parcels in the Bowie Local Town Center focus area, as well as C-S-C, a common commercial zoning class in the master plan area, appear successful in attracting commercial uses.
ZONING MAP AMENDMENTS
Map 46. Zoning Map Amendments in the Master Plan Area maps zoning map amendments made by the Prince George’s County District Council in the master plan area since 2002. To make an amendment to the zoning map, the District Council must determine that there has either been a substantial change in the character of the neighborhood proposed for rezoning or that a mistake was made either in the original zoning or the most recent sectional map amendment. There have been eleven zoning map amendments in the master plan area. The most recent was in 2020, and the oldest shown was in 2007.
Of the eleven zoning map amendments in the master plan area during this period, only four have detailed information available through the Prince George’s County District Council legislation search portal.4 These are A-10029 (3/2014), A-10031(9/2014), A-9968 (5/2019), and A-9975 (5/2019).
The zoning map amendment A-10029 was made to rezone a Rural Residential (R-R) zone to a Commercial Miscellaneous (C-M) zone, which allows for various commercial uses including office and highwayoriented uses. This parcel, about 7.8 acres large, now hosts various commercial businesses including a laser tag facility, Stanley Steemer, outlet store, and a samosas business.
Zoning Class
Note: This graphic should be read for the main patterns it displays, rather than smaller patterns that may simply be the result of noise in the data
4 See “Legislative/Zoning Items” on the Legislative Branch of Prince George’s County website: https://princegeorgescountymd. legistar.com/Legislation.aspx
Source: GIS Data Catalogue, Prince George’s County Planning Department.
Figure 52. Parcel Land Use by Zoning Class
Land Use
The zoning map amendment A-10031 was made to rezone 19 acres of land from the C-S-C to the M-X-T Zone. As of the latest satellite imagery available, the site has not yet been developed.
The zoning map amendment A-9968 was made to amend the basic plan for Willowbrook to increase the number of dwelling units, to increase the percentage of single-family attached dwelling units, to change the size and location of dwelling units, and to revise conditions and considerations of basic plan approval.
The zoning map amendment A-9975, made in 2019, was made to amend the Basic Plan for Locust Hill to increase the proportion of attached dwelling units to add conventional townhouses, to revise the layout, and to revise conditions of approval.
Discussion of Challenges and Opportunities
As stated in the overview of this section, there exists an opportunity in the master plan area to accommodate new growth while allowing existing residents to comfortably age in place. This section examined what growth has occurred in the master plan area and where opportunity sites for development remain.
GREENFIELD DEVELOPMENT AND INFILL
The land use, zoning, and built form in BowieMitchellville and Vicinity is reflective of the priority placed on preserving existing communities within the master plan area. Since the introduction of Levittown to the master plan area in the 1950s, residential development has occurred principally on greenfield sites, with little infill development except of commercial sites. With the exception of a few large parcels, the master plan area is now built-out to the extent of the current zoning code.
Source: GIS Data Catalogue, Prince George’s County Planning Department.
Figure 53. Parcel Land Use by Zoning Class (Total Acres)
Bowie MARC Campus Center Zoning Map Amendments
A-10029 November 2011
A-10016 March 2009
State University Bowie Local Town Center
A-10039 October 2010
A-9401-02 September 2008
A-8589-01
A-8589-02 June 2018
A-9838 September 2008
A-9975 May 2019
Area Zoning Map Amendments
A-9968 May 2019
A-8589-04 March 2020
A-10031 December 2013
Source: GIS Data Catalogue, Prince
County Planning Department.
Old Town
Cameron Grove
Duckettsville
Idlewild
Queen Anne Estates
Sherwood Manor
High Bridge Estates
Collington
Overbrook
Hall
Patuxent Riding
Heritage Hills
Ternberry
Pin Oak Village
There exists an opportunity in the master plan area to accommodate new growth while allowing existing residents to comfortably age in place.
AUTO-CENTRICITY AND RESIDENTIAL DENSITY
A low density urban form, such as that seen in the master plan area, perpetuates car dependency. A lack of public transit access further aggregates this problem; while the master plan area is relatively close to Washington, D.C., the major jobs center in the region, it has few frequent transit options connecting residents to those jobs. In general, a personal vehicle is required for master plan area residents to live comfortably and access jobs. Some form of residential density may be suitable in certain focus areas, such as the Bowie Local Town Center and Bowie State MARC Station.
Other pockets, such as the Colington trade zone and Old Town Bowie, provide future avenues for densification.
Without increased transit connectivity, walkability, and other efforts to reduce auto-dependence, there is little rationale and few remaining opportunities to add residential density to the master plan area at a large scale. Adding significant residential density could conflict with the preservation goals set forth by Plan 2035 and disrupt existing communities. Regulatory tools such as zoning present an opportunity to develop more dense and transit-connected centers in BowieMitchellville and Vicinity. However these tools may not be sufficient in creating the diverse places needed in the master plan area. Land use and zoning changes need to account for market realities, and strategically position land to allow for pockets of densification
MULTIFAMILY HOUSING
Multifamily housing makes up a very small portion of current land use in Bowie-Mitchellville and Vicinity. There are opportunities to add higher density multifamily housing in key areas, provide the infrastructure for aging residents to downscale and age in place, and also address the housing needs and preferences of many millennials. Further, there exists the opportunity to redevelop existing, underperforming commercial and retail areas, making them more vibrant and attractive to residents. In the master plan area, Bowie Local Town Center provides multiple opportunities to create pockets of mixed-use neighborhoods. The local town center is more accessible and well connected than other focus areas (as seen in the betweenness centrality analysis in this section) and is in close proximity to important public amenities.
Accomplishing this will require the right zoning approach. In the master plan area, comprehensive design zones have provided the County with the ability to carefully control the built character, amenities, and density of certain areas.
2.5 Transportation and Mobility
The Bowie-Mitchellville and Vicinity master plan area is conveniently located in the middle of a triangle formed by the cities of Baltimore, Annapolis, and Washington, D.C. As a result, there are several important road and rail links traversing the area. Bowie is in close proximity to the metro and bus transit services provided by the Washington Metropolitan Area Transit Authority (WMATA), and has portions of the East Coast Greenway biking and walking route running through the area.
Transportation and mobility in Bowie-Mitchellville and Vicinity revolve heavily around car travel. Planning documents over the past 20 years or more have imagined a walkable, bike-friendly, and transit-accessible community that is committed to sustainability and economic development. However, residents rely on the single-occupancy automobile for the overwhelming majority of all trips, especially the journey to work. The transportation system and land use pattern in the master plan area both support and reflect this reliance on car travel.
The transportation system has a rigid hierarchy of roads that feeds all traffic onto increasingly high-volume, highspeed, and multilane highways that are major barriers to walking, bicycling, and transit. There are few realistic alternatives to driving due to a lack of infrastructure (e.g., sidewalks and bike lanes) or transit service. Land uses are separated so that the places people live are disconnected from the places they need to access for shopping, education, recreation, employment,
healthcare, and government services. The boundaries of these different land uses are frequently defined by busy roads that are frustrating for people in cars, and difficult to cross and inhospitable for people walking, bicycling, or taking transit.
Driving in Bowie-Mitchellville and Vicinity presents a convenient option for residents. There are few roads that experience any prolonged periods of congestion, there is an ample supply of free or inexpensive parking, few trips are short enough to walk or bike even if conditions on the road encouraged these modes of travel, and there is limited transit service.
The master plan area is caught in a cycle of autodependency that has adverse effects on the quality of life, health, safety, environment, and sustainability of the community. The reliance on cars for almost every trip has resulted in a network of busy, wide roads that are difficult to cross; acres of parking lots that are inhospitable for walking; and long and inconvenient trips by foot, bike, and transit that further discourage their use even for local trips and activities such as getting to school. There is a perception of a busy and congested roadway network, which is fueled by regional congestion hotspots nearby (e.g., the Capital Beltway and sections of US 50 outside the master plan area).
COVERED IN THIS SECTION:
• Transportation Context
• Inventory of Major Transportation Assets
• Transportation Safety
Source: M-NCPPC. MD 214 at Hall Station Road, near the South Bowie Library
What are the current conditions of Bowie-Mitchellville and Vicinity’s transportation infrastructure? What are the greatest barriers to a more walkable, transitaccessible, and bike-friendly community?
Transportation Context
According to the Center for Neighborhood Technology, the City of Bowie has a Housing and Transportation Index score of 43, which means that the average household spends 43 percent of its income on housing and transportation.1 This is fractionally below the 45 percent figure considered as “affordable.” In the City of Bowie, annual transportation costs are slightly higher than recommended, while housing costs are slightly under the threshold considered affordable. In several areas adjacent to the city, housing prices are significantly higher than the national recommended threshold of 30 percent of household income. This pushes the exurban areas of Woodmore and Fairwood to Housing and Transportation Index scores that are 10 points above the recommended total.
Bowie-Mitchellville and Vicinity is an affluent and diverse suburban bedroom community. The master plan area population of 85,000 is predominantly nonWhite (62,000) and homeowners—only 11,000 live in rented housing. There are 46,000 people who commute to work, and the overwhelming majority drive to locations outside the master plan area for their employment. For example, only 1,418 City of Bowie residents live and work in the city; more
than 25,000 leave the master plan area. The biggest commuting destination is Washington, D.C., where approximately 20 percent of commuters in the master plan area commute. The second highest is the City of Bowie at approximately 5 percent. Other destinations are distributed throughout the surrounding counties and cities, including Baltimore, Columbia, and Parole in Maryland, none of which exceed three percent of master plan area commuters.
Seventy-five percent of commuters drive to work alone, and an additional 8.5 percent carpool. Only 10 percent take transit as their primary mode, and even this number may include people who drive to park and ride lots and to regional transit services (e.g., the New Carrollton and Largo Town Center Metro Stations or the MARC station at BSU). One percent of commuters walk and just a handful of people ride their bikes to work (approximately 20 people).
Within this overall picture, there are some notable local variations. Commuters in Glenn Dale are more likely to take transit to work (12 percent), while residents in the Fairwood neighborhood are more likely to carpool (13 percent) than their neighbors. Residents in the Woodmore neighborhood have a
Source: Center for Neighborhood Technology, 2017.
1 Based on the Center for Neighborhood Technology’s Housing and Transportation Affordability Index. See: https://htaindex. cnt.org/about/.
Figure 54. Housing and Transportation Index in Bowie-Mitchellville and Vicinity
higher-than-average drive-alone rate (77 percent) and more than 5 percent of them have “super-commutes” of more than 90-minutes each way.
Mean travel times for commuting are typically 10 minutes longer than the national average of 25 minutes each way. Glenn Dale commuters have the shortest average commute time of 34 minutes each way, Woodmore residents have the longest at 38 minutes, the City of Bowie residents typically drive 35 minutes each way.
The suburban nature of the community is also evident in data around car ownership. Nationally, four percent of households do not have access to a motor vehicle in the master plan area the figure is one-quarter of this. Just one percent of households in the City of Bowie and Woodmore have no cars; in Fairwood there are no households without a car. Glenn Dale is the only part of the study area with the national average figure of four percent of households with no car.
Conversely, 75 percent of households nationwide have 2 or more cars and 35 percent have 3 or more cars. In the master plan area, Glenn Dale has the lowest percentage of households with 2 or more or 3 or more cars (83 percent and 48 percent respectively), while Woodmore has the highest (88 percent and 54 percent respectively). Almost one-quarter of Woodmore households have four or more cars. This is a very high level of car ownership.
These data points are significant because many of the common demand factors for active transportation (walking, biking, and taking transit), such as households in poverty, zero-car households, proximity to major employment centers, and mixed-use, high-density development are largely absent from the study area.
Figure 55. Total Commuters in Bowie-Mitchellville and Vicinity, by Mode
EMERGING TRANSPORTATION TECHNOLOGIES
The heavy dependence on motor vehicles and high car ownership levels may also explain the limited presence of emerging transportation technologies, vehicles, and micromobility devices. Bikesharing systems and scooters work well where there is a high density of users and destinations within a well-defined geographic area that generates a high number of short trips that can be made on safe streets. Those conditions do not exist in the master plan area, even at the Bowie Local Town Center or the BSU Campus—although the latter may be the most likely place for a system to thrive.
Electric-assist bikes and electric scooters can help overcome longer distances—but still require safe infrastructure to make them feasible and desirable. Even ride-hailing services such as Uber and Lyft appear less present in the master plan area than elsewhere in the region, based on anecdotal insights. It is said to be easier to arrange for a trip to the study area, but much harder to find a ride once in the area.
Source: American Community Survey (2017).
Source: M-NCPPC.
Source: American Community Survey 2017, Five-Year Estimates.
Prince George’s County Planning Department
Mitchellville
Idlewild
Queen Anne Estates Sherwood Manor
Bridge Estates
Collington
Overbrook
Hall
Patuxent Riding
Heritage Hills
Ternberry
Pin Oak Village
Map 47. Percentage of Population that Walks to Work (2017)
Map 48. Percentage of Population Using Public Transit (2017)
Mitchellville
Collington
Overbrook Hall
Patuxent Riding
Heritage Hills
Ternberry
Pin Oak Village
Queen Anne Estates
Collington
Overbrook
Hall
Heritage Hills
Ternberry
Pin Oak Village
Inventory of Major Transportation Assets
This section documents the major transportation assets in Bowie-Mitchellville and Vicinity in four key categories: driving, walking, transit, and bicycling.
DRIVING INFRASTRUCTURE
The master plan area is dominated by two major state highways that carry high volumes of traffic.
US 50 (John Hanson Highway), which dissects the study are from east to west, is one of the busiest roads in the state and the metropolitan region, carrying up to 155,000 vehicles a day. By comparison, the busiest interstates in the region carry volumes in excess of 250,000 vehicles a day and the busiest major arterial roads (not limited access) carry approximately 100,000 vehicles per day. The limited access highway has two large, grade-separated intersections in the master plan area, at MD 3/US 301 (Crain Highway) and MD 197 (Collington Road). This is a major regional commuting corridor linking Annapolis and Washington, D.C., and is also the primary route to the Eastern Shore of Maryland via the Chesapeake Bay Bridge. The most recent State Highway Administration (SHA) congestion assessment identified US 50 as “uncongested” in the morning peak and “congested” on the westbound side in the evening peak.2
MD 3/US 301, which traverses the eastern side of the master plan area, is a principal arterial route that carries volumes in excess of 75,000 vehicles a day. This busy north-south highway is a critical regional link to Interstate 97 and Baltimore to the north and connects to the rapidly growing communities of Waldorf and La Plata to the south.
The SHA has identified US 301 south of the intersection with US 50 as a congested corridor. The SHA’s 2013 Congestion Assessment identifies the corridor as having “moderate” congestion in both directions between US 50 and Collington Road in the mornings; the southbound side has heavy congestion in the afternoons. MD 3 to the north of US 50 is rated as having heavy congestion southbound in the mornings and moderate congestion in both directions in the evening peak hours.3 There is a long term plan to change the corridor to a limited access freeway or interstate. This will have an important impact on future land use and development decisions, as land to the east of the corridor will effectively be cut off from development to the west.
Other major state highways in the master plan area include east-west routes such as MD 214 (Central Avenue) and MD 450 (Annapolis Road); MD 193 (Enterprise Road), a busy north-south route that marks the western edge of the master plan area; and MD 197, which connects the Bowie Local Town Center with BSU and the Bowie State MARC Station to the north.
These arterial roads are typically multilane, divided highways with significant volumes of high-speed local and regional traffic, often carrying up to 35,000 vehicles per day. Most of the major commercial and retail areas within the community are located on these roadways, which generates significant volumes of local traffic.
Enterprise Road is rated as having moderate congestion in the morning and heavy congestion in the evening peak hours between MD 214 and MD 450. For much of this stretch, the road is two- or three-lanes wide with turn lanes at intersections.
Central Avenue is rated as “uncongested.” Annapolis Road experiences moderate congestion in the direction of flow—eastbound between US 3 and Collington Road, and westbound for the entire length inside the master plan area.
MD 197 between US 50 and MD 450 was identified as having “heavy” congestion in the 2013 statewide congestion assessment. This section of roadway carries most of the traffic accessing and egressing US 50 and traveling to the north of the master plan area, it serves several commercial and retail areas (including Bowie Local Town Center further to the south), and is close to several schools and recreation areas. The state has an ongoing project to widen this section of road and increase the capacity of the intersection with MD 450.
Relatively few County or local roads traverse the master plan area or provide long, continuous routes within it. For example, Church Road and Woodmore/ Mt. Oak Road are the only County or local roads in the southern half of the master plan area that create a connected through network—they effectively create a two-mile grid within the boundaries of US 301, US 50, MD 214, and MD 193. In the northern half of the master plan area, MD 197 and MD 450 are the only roads that traverse the master plan area. Roads such as Race Track Road and Church/Highbridge/Chestnut Road offer limited through access.
2 Maryland Department of Transportation. https://www.roads.maryland.gov/OPPEN/PrinceGeorges_Congestion.pdf.
3 Ibid.
A NOTE ABOUT PARKING
Parking is an essential element of the infrastructure necessary to support driving. There is ample car parking throughout the study area and, with few exceptions, it is free. While parking is necessary, the apparent oversupply of surface and on-street parking in the study area exacerbates the lack of walkability and access at every destination. For example, the sea of parking surrounding every building in Bowie Town Center means that the entire development is only practically accessible by car, and only the main street of retail mall is “walkable”.
The master plan area is dominated by two major state highways that carry high volumes of traffic.
These County or local roads tend to be two-lane roads (with some extended, intermittent sections of 3- or 4-lanes) with high speeds (45 mph), except for short periods of intense use during rush hours when they are congested. This tends to exacerbate congestion by forcing all traffic onto a small number of through streets, and makes those streets much more challenging for people on foot or bike.
The overwhelming majority of local and residential roads form a disconnected, suburban cul-de-sac pattern of development that requires all traffic to use the arterial roadway network as part of every trip. These local roads have low volumes of traffic but are typically wide enough to encourage speeds in excess of the posted speed limits and desirable residential traffic speeds.
Several roads in the master plan area are designated scenic and/or historic roads. Church and Woodmore Roads, for example, are designated scenic and historic roads, and sections of Governors Bridge Road are designated as historic roads. Roads including MD 197 (Collington Road) are proposed for historic designation. The designation reflects the valuable viewsheds along these corridors, as well as the important cultural and historic resources found on or near them. Historic roads are typically those that have been identified on maps since before 1828. Development along these corridors, as well as changes to the roadways themselves, is required to consider the impacts to the resource and to preserve the viewshed. Historic and scenic roads are discussed in further detail in Section 2.6. Community Heritage, Culture, and Design.
Source: Consultant Team.
MD 197 near Town Center
Source: Consultant Team. Car parking near Bowie Town Center
Source: Consultant Team. MD 197 and Northview Drive
WALKING INFRASTRUCTURE
There is no walking infrastructure (e.g., sidewalks or paths) along either of the two major highways in the master plan area (US 50 and US 301). There are very limited opportunities to safely or conveniently cross either of these corridors on foot despite the presence of important destinations and services (particularly on US 301 just south of US 50). In fact, in the entire master plan area there are only two at-grade signalized crossings of US 301 (at Ballpark Road and Harbor Way) and one grade-separated crossing of US 50 for people on foot and bicycle to use.
State highways such as MD 214 and MD 450 have limited and intermittent infrastructure to support walking. This presents a challenging environment for people seeking to access shops, services and other destinations along these roads, as well as those taking the bus.
Where sidewalks do exist, they are frequently narrow and in poor condition. The walking experience is significantly enhanced when sidewalks are at least five feet wide and there is a buffer (e.g., a grass strip) from motor vehicle traffic, especially when vehicle speeds exceed 25–30 mph.
Signalized crossing opportunities of state highways are extremely limited and offer minimal protection from turning vehicles. Where unsignalized crossings are provided, they are typically insufficient because of high motor vehicle speeds (30 mph and higher), multiple lanes and long crossing distances, high volumes, and poor markings/visibility.
There are numerous instances of intersections where only three of the four legs have signalized pedestrian crossings (e.g., Collington Road and Northview), requiring people on foot to circumnavigate the entire intersection to cross the road. This is usually done to allow a free right turn or right turn filter for drivers.
County roads (e.g., collectors such as Church and Woodmore Roads) typically have sidewalks only where they have recently been widened from twolane roads to three or more lanes. The result is an inconsistent sidewalk network with significant gaps. The long stretches of two-lane roadway (often with a ditch on either side) offer no safe place to walk; they also have very few destinations along them as land uses are rarely mixed.
The road widening projects frequently do include marked or signalized crossings for pedestrians at intersections—although they also have the
4 https://www.walkscore.com/MD/Bowie
Pedestrian infrastructure at the Bowie Local Town Center is overwhelmed by parking and roads
disadvantage of adding more lanes for pedestrians to cross, and with no protection from drivers turning left or people turning right on red. As with state roads, there are long stretches of these County roads with no marked crosswalks; where they are marked, they are rarely controlled.
Local collector streets in the City of Bowie typically have sidewalks on at least one or both sides of the road, frequently with a buffer from the edge of the travel lane. The sidewalks are narrow and are in varying states of repair. Residential roads do not usually have sidewalks. There are few marked crosswalks, even at intersections.
The City of Bowie has a Walk Score of 25 (out of 100) and is described as “a car-dependent city” with few bike lanes, minimal public transportation, and as a place where “most errands require a car.”4 The lower density areas that make up the rest of the master plan area bring the overall regional score down to just 14. Walk Score measures the number of destinations within walking distance of residents in any given location—and
Source: Consultant Team.
There
or marked
138 • Prince George’s County Planning Department
Poorly maintained sidewalk/sidepath on MD 197 at Old Annapolis Road
Multiple driveways and a narrow buffer between pedestrians and high speed traffic on MD 197
New sidewalk in the Fairwood neighborhood with a wide grass buffer between the sidewalk and roadway
is no signalized
crossing of Northview Drive at Collington Road or anywhere between Collington Road and the Park and Ride facility on Northview Drive .
An unmarked crosswalk connecting to Allen Pond across Northview Drive
Uncontrolled crossing of Church Road and Fairview Vista Drive; scene of a fatal pedestrian crash in 2019
Where the sidewalk ends at Church Road and Fairview Vista Drive
Source (all): Consultant team.
a low score such as this indicates that there are few shops, restaurants, social services, and other similar destinations within walking distance of residents.
TRANSIT INFRASTRUCTURE
The transit system in the master plan area consists of a limited number of bus lines (MTA and Metrobus), a MARC station at BSU, and three park and ride lots. The MARC station serving BSU sees an average of approximately 700 boardings per day and has a car parking capacity of 675.5 Despite the proximity of the BSU campus, potential ridership is relatively low. Only eight percent of off-campus students live within a fivemile radius of the campus and station and there are currently no realistic alternatives to driving to access those locations.6
The MTA and Metrobus lines connect to key locations within Bowie and its vicinity, including BSU and the Bowie Local Town Center. The bus lines connect to surrounding cities with stops and terminate at WMATA Metrorail stations and the MARC station at BSU. There are six bus lines currently serving the master plan area. As all the bus lines connect to the New Carrollton Metro Station, many of them have schedules that are limited to commuter times. This limits connection options during off-peak hours. The bus lines have infrequent and inconsistent schedules, with a minimum of 30-minute headways between buses, and a limited number of routes. This contributes to the need for indirect routes and long trips, which makes relying on transit inefficient and undesirable. For example, Route B21/22 loops around the residential neighborhoods in Somerset instead of taking a direct and quicker route; this also makes getting to the bus stop a trip of its own.
Bus Ridership
Bus ridership in the master plan area is low, as seen in data from daily weekday bus boardings and alightings on all WMATA bus services running in the master plan area for fall 2019. The information includes the average number of passengers who get on and off at each bus stop on every route that passes through the area. There were 2,841 data points (i.e., bus stops). There was no activity recorded at approximately onethird of the stops (more than 830 stops saw no one get on, and no one got off at more than 900 stops), and at more than 2,100 stops fewer than one passenger was recorded getting on or off.
5 MTA/MDOT email correspondence.
6 Margrave Strategies, 2018; Bowie State University Final Review.
Staff
Source: Bowie State University.
In fall 2019, 10 or more people got on a bus 62 times during the average weekday. Forty-one of these occasions were at bus termini outside the master plan area (e.g., New Carrollton, Addison Road, Prince George’s Community College). The Bowie Park and Ride Lot B saw the highest ridership, with 30 or more people boarding a bus on 3 routes and close to 17 passengers on 2 more buses. The BSU campus had 4 buses with more than 10 passengers getting on at the library; there were relatively high levels of use on the midday services. There were three bus stops along MD 214 (Central Ave) where 10 or more people got on a bus, and at one of those locations that happened on 2 different buses. For a timetable of bus routes serving Bowie-Mitchellville and Vicinity, please see Appendix C. Bus Service Timetables on page 231.
Not surprisingly, a similar picture emerges of the number of people getting off buses in the master plan area. There were 81 buses that saw 10 or more people get off at a particular bus stop, 49 of these were at termini outside the master plan area (e.g., Crofton Country Club, Addison Road, and New Carrollton). Seven of the buses served stops on the BSU campus and five dropped passengers at the Bowie Park and Ride Lot, with another two buses dropping people at Northview/Collington Road and two more serving the health center on Northview Drive.
There were two stops on Hall Road (at Pointer Ridge Drive and Central Avenue). that had an appreciable number of passengers, as well as two stops on MD 450 (Annapolis Road) at the western edge of the master plan area. One stop in Old Town Bowie, at 9th Street and Railroad Avenue, has one bus where more than 10 passengers disembarked at one time.
Figure 56. Potential MARC Ridership at Bowie State University (2018)
Collington Overbrook
Hall
Heritage Hills
Ternberry
Pin Oak Village
Map 52. Bus Ridership Activity (Fall 2019)
Overall, the data confirm that transit has limited use in the master plan area, primarily serving BSU and the Bowie Town Center area, with the addition of a hub of transit activity in south Bowie (Central Avenue and Hall Road). People are traveling to and from the regional Metro system, or using the park and ride facilities—which also suggests two short car trips at each end of the bus ride. They are typically traveling in the direction of regional commuting patterns, i.e., from Bowie westwards in the morning toward Washington, D.C., and the reverse direction in the evening.
Bus service is not supported by the necessary infrastructure to provide safe and comfortable use by riders. Lack of bus stops and first and last mile connections for bikes and pedestrians discourages transit users.
There are three park and ride lots within the master plan area at Bowie MARC Station, Bowie Town Center, and on MD 450. These are equipped with covered shelters and benches; however, they are hard to access by foot and by bike and they are not in convenient or central locations (for example, the Bowie Town Center facility is a long walk across at least two busy roads and a sea of car parking from a primary destination such as the shopping center). This limits their functionality and attractiveness.
A potential circulator bus loop has been proposed to connect Bowie Town Center with new developments at Melford. A shuttle service was recently introduced between the BSU campus and Bowie Town Center to serve students, particularly on weekends and evenings when the Metro and MTA bus schedules are nonexistent or very limited.
The nearest Metro stations are New Carrollton (Orange Line), College Park (Green Line), and Largo Town Center (Blue/Silver Line). None of these is within a walking or bicycling distance from the master plan area. They are served by MTA bus lines and the services using the Park and Ride lots. The New Carrollton Metro Station is 8 miles from Bowie Town Center and the Largo Station is approximately 10 miles away. In both cases, the stations provide ample car parking and kiss and ride options for drivers (and their passengers) and the drive time is less than 15 minutes. The bus takes a minimum of 22 minutes and the schedule is frequently set to take much longer than this.
The Bowie MARC Station is part of the Penn Line serving local commuter rail stations between Washington, D.C. and Baltimore, including the New Carrollton and BWI Amtrak stations. Service on the line is daily; the station is fully Americans with
Disabilities Act (ADA) accessible. The station received 703 passenger boardings on an average weekday in 2017. Bowie State University provides a 15 percent discount on MARC passes to students.
Map 54. Bus Stop Walking Access in BowieMitchellville and Vicinity shows the practical pedestrian accessibility of bus stops along routes serving Bowie-Mitchellville and Vicinity, taking into account pedestrian conditions. This map excludes features not suitable for pedestrian activity, including unsafe crossings, significant intersections, limitedaccess highways crossings, and dual carriageway crossings. Crossings identified as unsafe were also removed from the walkable network in this map.
The absence of sidewalks on busy roads and adequate crosswalks at intersections dramatically limits the population within a safe and convenient walking distance of transit. The greatest concentration of walking access to transit lies within the City of Bowie, with relatively strong coverage around the more densely developed Bowie Town Center. New Melford, however, does not fall within the practical walkshed for bus stops. Outside of City of Bowie, Cameron Grove sees relatively greater access to bus stops by foot.
Source: Consultant Team.
Bus stops along MD 197 have no seats, shelter, place to wait, or safe crossings
Collington
Overbrook Hall
Ternberry
Pin Oak Village
Map 54. Bus Stop Walking Access in Bowie-Mitchellville and Vicinity
Map 55. Bicycle-Pedestrian Under and Overpasses
Bicycle-Pedestrian Overpass Park and Ride City of Bowie
Bicycle-Pedestrian Underpass
Source: Aerial Review.
Ternberry
Pin Oak Village
See Appendix D. Inventory of Dangerous Pedestrian Crossings on page 221 for an initial assessment of dangerous intersections within bus stop walksheds.
BICYCLING AND TRAIL INFRASTRUCTURE
The existing bikeway and trail network in BowieMitchellville and Vicinity includes several trails (shared-use paths) and a limited amount of on-street bicycling infrastructure.
There are two segments of the East Coast Greenway within the master plan area. The Washington, Baltimore and Annapolis (WB&A) Trail is an 8-foot-wide paved path with a total length of 13 miles between Annapolis and Glen Burnie, MD. This well-maintained and popular trail crosses the master plan area south of BSU. At its northwestern end, the trail connects to the BWI Trail and is part of regional trail system that extends from Maine to Florida. A new trail bridge has recently been constructed to take the trail across the Patuxent River towards the Two Rivers development in neighboring Anne Arundel County. To the east, the trail brings people close to the New Carrollton Metro Station, although the final mile or so to access the station from the end of the trail is a significant obstacle.
The East Coast Greenway has also designated the sidepath running parallel to Collington Road as part of its interim route. This sidepath is in a poor state of repair with uneven surfaces, accumulations of debris, encroaching vegetation, and disappearing signs and markings. The sidepath also has a dated design. It is narrow and has sharp corners; short, severe elevation changes; non-conforming signs and markings; and outdated intersection designs.
There is a long stretch of sidepath on the north side of MD 450 that is in fair condition. This provides access to retail, commercial, and other destinations along this corridor. The path is the minimum acceptable width and has minimal crossings of side streets, access roads, and entrances to commercial centers.
There are several notable trail bridges and underpasses in the master plan area, as seen in Map 55. BicyclePedestrian Under and Overpasses. There is a bridge carrying the MD 197 trail over US 50/595, and MD 197 has a trail underpass to the north of US 50/595, a bridge carrying the WB&A Trail over the highway, and a trail bridge spanning MD 197 at Northview Drive.
These bridges and underpasses provide critical connections across major regional barriers to walking and bicycling. Bowie Local Town Center is more accessible to people north of US 50 who may want to walk or bike to the shops, restaurants, or facilities as
Source: Consultant Team.
Maintenance challenges on the WB&A Trail
Source: Consultant Team.
The WB&A Trail briefly shares the access road to the Berwyn Rod and Gun Club
a result of the bridges across Collington Road and US 50—but the two bridges are not well connected to each other and the trails they carry do not connect well into adjacent neighborhoods.
There are internal trail and pathway systems in the Fairwood development. Additional trails in the master plan area are discontinuous and inconsistent. In addition to the major gaps in the network, existing infrastructure is not in a condition that encourages use by people riding bikes regardless of their age or ability. Many local and regional trails lack proper maintenance, which seriously compromises the safety and comfort of the infrastructure.
On-road bicycle facilities (e.g., striped bike lanes or separated bike lanes) in the master plan area are rare. For example, new sections of roadway at the intersection of Woodmore and Church Roads have included striped bike lanes, but they do not extend beyond the intersection project limits. There is an “orphaned” bike lane, 1,000 feet long and positioned to the left of a continuous right-turn-only lane, on the southbound side of Crain Highway, just north of Mitchellville Road.
Figure 57 highlights the total number of active transportation facilities by facility type within the master plan area. Hard surface trails are the most common among facility types, followed by natural surface trails and side paths.
There are several planned facilities that include extensions for existing trails and shared lanes on low-stress roads (i.e., the Bowie Heritage Trail that will connect Old Town Bowie to Bowie State University through Jericho Park). Figure 58 highlights the total number of planned facilities per facility type within the master plan area.
The City of Bowie recently adopted an ambitious Trails Master Plan that builds on the Prince George’s County trails plan.7,8 An extensive network of proposed trails in the City was developed (see below) and prioritized based on these criteria:
1. Link existing trails together into a safe and desirable trail experience.
2. Increase safety and connectivity from neighborhoods to trails.
3. Increase safe pedestrian and bicycle access to schools, parks, and public facilities.
4. Increase safe pedestrian and bicycle access to shopping and entertainment centers.
5. Expand opportunities to separate bicycle and pedestrian uses from vehicular traffic.
6. Increase opportunities for drawing regional trail visitors to Bowie’s commercial businesses.
GIS
Source: GIS Data Catalogue, Prince George’s County Planning Department.
It is important to note that the “official” trails and bikeway plan for the County is contained in the Master Plan of Transportation (MPOT). The Strategic Trails Plan and the City of Bowie trails plan would need to be incorporated into the MPOT to have any legal weight.
7 Access the Trails Master Plan at: https://www.cityofbowie.org/2410/Trails-Master-Plan.
8 “Strategic Trails Plan.” 2018. Prince George’s County Department of Parks and Recreation. http://www.pgparks.com/ DocumentCenter/View/9124/Part-1-Plan-Summary-PDF.
Figure 57. Active Transportation Facilities by Facility Type
Figure 58. Planned Facilities by Facility Type
Source:
Data Catalogue, Prince George’s County Planning Department.
Source: M-NCPPC.
Transportation Safety
In an average year, 124 people are killed and 432 are seriously injured in traffic crashes in Prince George’s County. The County, in collaboration with Maryland Department of Transportation (MDOT), Maryland Highway Safety Office (MHSO), and SHA has adopted the Toward Zero Deaths (TZD) approach and is committed to cutting vehicle-related fatalities and serious injuries in half by 2030.
Figure 59. Crash Severity by Victim Type highlights the number of crashes, by severity, involving bicyclists and pedestrians. The data highlights two important points:
• There is relatively little bicycle and pedestrian activity in the master plan area (with the exception of the WB&A Trail, which is largely separated from the roadway), which suggests the exposure rate or relative danger of bicycling and walking is quite high, even though the overall raw numbers are not shockingly high.
• A very high percentage of crashes involving pedestrians and bicyclists result in serious or fatal consequences. By contrast, a very low percentage of crashes involving motor vehicles result in these outcomes—the overwhelming majority result in minor injuries or property damage only.
CRASHES BY LOCATION
More than two-thirds of bicycle crashes between 2015 and 2018 occurred at intersections. This is a high number and suggests that intersection designs featuring multiple through lanes and turn lanes, coupled with unprotected left and right turning traffic, are particularly challenging and dangerous for people on bikes. The fact that more than 40 percent of pedestrian crashes do not record a location makes it very difficult to draw conclusions about counter measures.
The overwhelming majority of bicycle crashes occur during daylight; a significantly higher percentage of pedestrian crashes happen after dark.
A high percentage of bicycle crashes occur at intersections that are signalized (in other words, intersections where there is a traffic light or crossing signal). The number for pedestrians is lower. It should be noted that this figure does not account for the 41 percent of crashes for which location information is unavailable.
There is limited crash data available for the master plan area. Map 56. Vehicle Crashes (2015–2019) highlights the raw number of crashes (all severities) within BowieMitchellville and Vicinity between 2015 and 2019. Unsurprisingly, there are high concentrations of crashes at intersections, particularly the busier intersections along US 301, MD 197, and MD 450.
Figure 59. Crash Severity by Victim Type
Source: Prince George’s County Planning Department.
Figure 60. Bicycle and Pedestrian Crashes by Location on the Roadway
Source: Prince George’s County Planning Department.
Ternberry
Pin Oak Village
Map 56. Vehicle Crashes (2015–2019)
57. Top 25 Most Dangerous Intersections Measured by Number of Vehicle Crashes (2015–2019)
Map 57. Top 25 Most Dangerous Intersections Measured by Number of Vehicle Crashed (2015–2019) shows that more than half of the top 25 crash locations are along MD 197.
Source: State of Maryland.
Between 2015 and 2019, 139 out of 5,894 total crashes involved people on bikes or on foot. Seven of the 139 crashes resulted in a fatality. In addition, there were 17 people who suffered incapacitating injuries and another 53 people with a possible incapacitating injury.
Queen Anne Estates
Sherwood Manor
Collington
Overbrook Hall
Patuxent Riding
Heritage Hills
Ternberry
Pin Oak Village
Map
Map 58. Pedestrian Involved Crashes by Severity (2015–2019) shows the location of pedestrian crashes in the master plan area.
While these crashes are dispersed along all the major arterials and high-density areas, there are a number of locations where the concentration of crashes is notable; for example, in and around the intersection of Church Road and US 50, and within the Bowie Town Center and adjacent commercial centers, the pedestrian crashes are much more dispersed than motor vehicle crashes. Based on initial observations, they are happening in locations with common roadway characteristics (e.g., multiple lanes, posted speeds of 35 mph or higher, and no signalized crosswalk).
There have been three fatal or serious injury crashes on Church Road in the vicinity of US 50. Two of them occurred near the Freeway Airport, and a third, that caused the death of a pedestrian, was at the intersection with Fairview Vista Road. Church Road, at this location, is a wide, four-lane road with a marked, uncontrolled intersection with Fairview Vista Road. It is easy to witness a steady flow of vehicles exceeding the posted speed limit by more than 20 mph on Church Road at this location. The posted speed along Church Road in this area is 30 mph but radar speed display signs document speeds as high as 54 mph in some cases.
MD 197 (Laurel Bowie Road) between Old Chapel Road and US 50 has experienced several crashes involving pedestrians in recent years, at least two of which were fatal or caused serious injury. The Old Chapel Road/MD 197 intersection has several features
that make pedestrian crashes very predictable at this location. There is a strip shopping center on one side of a busy, high-speed road and a thriving residential area on the other side of the road. There are bus stops along the main highway with infrequent bus service. There is one signalized intersection with marked and controlled pedestrian crossings—the next closest controlled crossing is two-thirds of a mile to the south and several miles to the north.
MD 450 is also a hotspot for crashes, particularly at the Bowie Marketplace area, which recorded a cluster of crashes, and the intersection with Belair Road where there was a fatal or serious injury crash. The Belair/ MD 450 intersection features long crossing distances that expose pedestrians to high risk, in part due to the wide turning radii that encourages speeding.
Another obvious hotspot for crashes that involved pedestrians is the Bowie Town Center and surrounding commercial centers. The higher density of people and traffic in this area, in addition to the concentration of businesses, increases potential for pedestrian volumes crossing at the main intersections. Most pedestrian crashes, especially those that caused a fatality or serious injury, took place in this area.
Three specific intersections are a major concern: Mitchellville Road at MD 197 (Collington Road), Northview Drive at Collington Road, and Excalibur Road between Crain Highway and Collington Plaza.
Figure 61. Bicycle and Pedestrian Crashes by Lighting Conditions on the Roadway
Source: Prince George’s County Planning Department.
Figure 62. Bicycle and Pedestrian Crashes by Intersection Signalization
Map 58. Pedestrian Involved Crashes by Severity (2015–2019) Source:
Collington
Overbrook
Ternberry
Pin Oak Village
Discussion of Challenges and Opportunities
CAR DEPENDENCE
Bowie-Mitchellville and Vicinity is a quintessential American post-war suburban community that has developed around the automobile. Land use and planning decisions, as well as significant transportation investments over the years, have built a community in which driving—usually alone—is the default for virtually every trip regardless of distance or purpose. There is very little persistent traffic congestion, there is an ample supply of free parking, and gas is cheap.
These factors present some advantages to local drivers. However, there are significant downsides to this state of affairs, and it stands in direct contrast to the stated desires of the community as captured in prior planning documents. Land use and zoning policies for the past 20 years envisage a higher density of development in the community, with more mixed land uses and walkable, bike-friendly areas. Car dependence results in a number of related challenges, including costs to car owners/drivers, safety, environmental impacts, and health impacts.
• Environmental Impacts: Automobiles are the primary reason the transportation sector contributes up to 30 percent of greenhouse gas emissions in the United States; vehicle exhausts continue to cause dangerous levels of air pollution, traffic noise is a growing problem, and roads and parking lots are a major stormwater management headache.
• Health Impacts: Auto-dependence contributes massively to a sedentary lifestyle and to mental health challenges, both of which are a major threat to our health system. Obesity, cardiovascular and heart disease, diabetes, and a wide variety of cancers are linked to a lack of physical activity caused in part by a lack of daily physical activity such as walking and bicycling.
• Road Conditions and Congestion: While drivers may experience the frustration of minor delays on area roads at certain times of the day, the lack of any alternative means of transportation leaves area residents at the mercy of congestion hotspots throughout the metropolitan region. Bowie residents have longer-than-average car commutes in part because they drive on busy and congested roadways closer to Washington, D.C.; in busy suburbs adjacent to the Beltway; or on the Beltway itself.
MIXED-USE, MULTIMODAL DEVELOPMENT
Current land use patterns in Bowie-Mitchellville and Vicinity create challenges to multimodal transportation, as residential areas are largely cut off from commercial and employment areas for reasonable access by bicycle or foot. In the past, land uses have been rigidly separated to avoid mixed-use development—this, coupled with the hierarchical network of major roads that creates significant physical barriers to walking and bicycling, results in the need for longer, more roundabout trips for even the simplest purchase or activity. Mixed-use development, increasingly a priority for the County and the master plan area, presents an opportunity to create more opportunities for active transportation, and increase connectivity between where residents live, work, and play.
Principles for making long-term decisions to move Bowie-Mitchellville and Vicinity closer to the vision of a more mixed-use, multimodal community include:
• Making land use and transportation decisions together.
• Focusing on increasing access for people to jobs, shopping, schools, recreation, and other services.
• Building a safe system for all transportation users regardless of age, ability, and choice of travel mode.
• Improving resiliency and redundancy in the system by providing more realistic and attractive choices to driving alone.
Source: Consultant Team.
Church Road: actual speeds exceeding posted speed
Mixed-use development, increasingly a priority for the County and the master plan area, presents an availability to create more opportunities for active transportation, and increase connectivity between where residents live, work, and play.
MOBILITY AND SENSE OF PLACE
From a transportation perspective, the City of Bowie and surrounding area is in a challenging position. On the one hand, it is a well-established, mature, and affluent community with affordable housing and relatively easy access by car to a great many destinations. On the other hand, those destinations are rarely in Bowie-Mitchellville or Vicinity and residents often look elsewhere at examples of things or places to which they have aspirations. There is transit service in the area but it is very limited; people prefer to drive to New Carrollton or Largo to access Metro and more distant regional destinations.
This is a challenge faced by suburban communities all over the country. A recent planning report by the Chesterfield County Planning Commission, a sprawling suburban and rural county adjacent to
Richmond, Virginia, highlights the need to create more of a sense of place in suburbia. Public outreach activities found that 60 percent of Richmond-area millennial respondents said they preferred “denser development and easy access to rapid transit, with shopping, restaurants, offices, and homes close by.” More than two-thirds of millennials travel into Richmond for recreation due to “the clustering of venues and the ability to move between them without a car.” In the same survey, more than 60 percent of participants said that bike lanes and sidewalks are more important than new car lanes. An article in the Richmond Magazine summed up the dilemma in its title: “Chesterfield wants to attract millennials. First, it’s got to build sidewalks.” The same could be said of Bowie-Mitchellville and Vicinity.
Source: M-NCPPC.
Source: M-NCPPC. Participants at Zumbathon 2019 in Bowie
2.6 Community Heritage, Culture, and Design
The Bowie-Mitchellville and Vicinity master plan area is rich in history and culture.
The historic Town of Bowie has its origins as a railroad settlement in the 1870’s, at the juncture of the Baltimore and Pacific Railroad’s new line through Prince George’s County into southern Maryland, and its spur line into Washington, D.C.1 Originally called Huntington City, the town was renamed to Bowie in honor of Oden Bowie, a former Maryland governor and then-president of the Baltimore and Pacific Railroad Company. Although the Bowie railroad station was closed and moved to Bowie State University in 1989, Old Town Bowie remains an important historic site for the master plan area. The original railroad station and settlement has a small concentration of notable historic landmarks. It features a tourism office and welcome center and the Bowie Railroad Museum, which houses the National Railroad Historical Society’s Martin O’Rourke Railroad Research Library.
African American communities play a central role in the history of Bowie-Mitchellville and Vicinity. Fletchertown, located just south of Old Town Bowie (which is itself recognized as a historic African American community), and Duckettsville (1.5 miles away to the northwest) are examples of historic communities settled at the turn of the twentieth century by African American families. Many families in these farm communities were farm workers or small farmers, while others worked for the railroad around which Bowie was founded and developed.
The master plan area also boasts many sites from the Mid-century modern movement in architecture. After World War II, Bowie-Mitchellville and Vicinity came to be one of the most important suburbs in the Washington metropolitan region. Bowie-Mitchellville and Vicinity’s mid-century modern development was anchored by the Levitt & Sons’ suburban community at the site of the Belair Mansion, which began construction in 1957.
1 “Prince George’s County Tricentennial.”1996. http://www pghistory org/PG/PG300/obowie html
Bowie-Mitchellville and Vicinity Master Plan: Existing Conditions Report
How can future planning efforts uphold and enhance the unique character of Bowie-Mitchellville and Vicinity?
The master plan area’s existing historic and cultural assets can be leveraged in future planning and urban design efforts. Bowie-Mitchellville and Vicinity is home to many artists and hosts an annual public festival, Bowiefest, to celebrate the culture and talents of local residents. The Anacostia Trails Heritage Area, which has over 9,500 acres within Bowie-Mitchellville and Vicinity, presents communities with the opportunity to apply for state grants to promote heritage and tourism related to the trail system. Finally, through coordinated long-range planning, Bowie-Mitchellville and Vicinity can position Old Town Bowie or Bowie Local Town Center as future centers of culture and entertainment.
This report considers a variety of questions related to culture and heritage in the master plan area, including: where are the most treasured cultural and historic sites and features within the Bowie-Mitchellville and Vicinity master plan area? What are the historic or scenic routes and corridors? How can future planning efforts uphold and enhance the unique character of Bowie-Mitchellville and Vicinity? And finally, what are the challenges and opportunities to preserving and capitalizing upon the master plan area’s history and culture?
Current Centers of Community Heritage
What are the current centers of community heritage in Bowie-Mitchellville and Vicinity? How accessible are they? Are any of them under threat? Geographically, are there any trends or clusters related to the way these sites are distributed within the master plan area?
The master plan area has a rich African American history, and several properties are recognized as having historic significance in this regard. There are 10 historic African American properties in the master plan area, including historic school sites, churches, residences, and two historic African American communities. Old Town Bowie is recognized as a historic African American
Source: M-NCPPC. Bowie Railroad Museum
HISTORIC SITES AND FEATURES IN BOWIEMITCHELLVILLE AND VICINITY
• 2 historic African American communities
• 10 historic African American properties
• 20 mid-century modern structures have been identified
• 31 cemeteries
• 48 historic sites and resources, 10 of which are included in the National Register of Historic Places
community, as is the community of Fletchertown, a rural residential subdivision established in the 1890s, located about a mile to the south, and centered on Old Fletchertown Road.2,3
The master plan area also includes several midcentury modern buildings that Prince George’s County identified in an architectural survey.4 These structures, dating 1941–1978, reflect the County and master plan area’s twentieth century history as an important suburban community.5
2 Historic African American Communities are identified by the Prince George’s County Planning Department based on historic preservation files. See: https://gisdata.pgplanning.org/metadata/#.
3 Historic site data from the Prince George’s County Planning Department, accessed via PG Atlas. Historic data was last updated in December 2019. More information can be found in the 1992 Historic Sites and Districts Plan for Prince George’s County.
4 The survey was last updated in 2019. A table of properties can be found here: https://www.mncppc.org/DocumentCenter/ View/11926/Prince-Georges-Table-of-Properties.
5 For more on Prince George’s Modern, see: https://www.mncppc.org/DocumentCenter/View/631/Prince-Georges-ModernContext-Narrative-PDF.
• Prince George’s County Planning Department
Map 59. Historic Sites and Corridors in Bowie-Mitchellville and Vicinity
Source: GIS Data Catalogue, Prince George’s County Planning Department.
Map 60. Historic and Cultural Features in Bowie-Mitchellville and Vicinity
Source: GIS Data Catalogue, Prince
George’s County Planning Department.
Collington
Overbrook
One clear area of historic significance to the master plan area is Old Town Bowie, known for the Bowie Railroad Museum and the Old Town Bowie Welcome Center. Although Old Town Bowie contains many historic sites either designated by the County or listed in the National Register, the area is not designated as a local historic district or listed in the National Register.
HISTORIC SITES AND FEATURES
Map 60. Historic and Cultural Features in BowieMitchellville and Vicinity demonstrates the range of historic sites and features in the master plan area. Each can present a challenge or an opportunity in regard to development and planning. In some cases, a site or resource may create the opportunity for heritage tourism, which could be supported by the various County, state, and federal level programs and grants. In other cases, they may present special planning considerations, such as evaluation of the effect on a historic site by the Historic Preservation Commission (HPC). In other cases, there may be no planning policies or regulations associated with a feature, yet its presence should still be considered an asset to the master plan area (as in the case of recognized African American communities and mid-century modern structures).
The Anacostia Trails Heritage area covers more than 9,500 acres within the master plan area, including the land around three of the five central focus areas (Old Town Bowie, Bowie State MARC Station, and Bowie Local Town Center). This network of trails connects to important historic, cultural, and recreational sites in the County, and presents communities with the opportunity to apply for state grants to promote heritage and tourism related to the trail system. The master plan area features several museums that bring visitors into contact with Bowie-Mitchellville and Vicinity’s history. This includes the Railroad Museum in Old Town Bowie; Belair Mansion, which interprets life of Bowie residents in the 1740s–1940s; and Belair Stables Museum, which highlights the area’s thoroughbred horse breeding and racing legacy.6 The National Capital Radio and Television Museum is housed in a storekeeper’s house built in 1906.
Some sites of historical significance may not be recognized as historic sites or resources by the County or National Register but carry great significance to local or regional history. For instance, Blacksox Park on Mitchellville Road is a baseball park where African American sandlot baseball teams played in
Source: M-NCPPC. Hazelwood Historic Site (top); Belair Mansion and Cemetery, built in 1745 (bottom)
the 1930s–1970s, including the Homestead Grays, a professional Negro League team.7
One County-designated Historic Site in the master plan area is currently on the HPC Properties of Concern list—Goodwood, a historic property located in the Rural/Agricultural Reserve to the east of US 301, near the southern limit of the master plan area. Built in 1799, Goodwood sits on 15 acres and is the only historic rural villa in the Federal style in Prince George’s County.8
Appendix E. Table of Historic Designations on page 223 provides brief descriptions of each of the types of historic features described in this section of the report, and lists planning considerations for each.
HISTORIC CORRIDORS
Designated by the County Council, “scenic and historic roads are important resources that need to be protected and preserved for enjoyment both today and in the future.”9 Scenic and historic roads are designated through a master/sector plan according to core sets of criteria. Historic roads must align with historic landscapes and context through such criteria as views of historical sites, structures, and landscape patterns, and the presence of historic villages and farmstead groupings. Scenic roads are determined to have substantial amounts of scenic views through natural or man-made features, including forests, woodlands, meadows, scenic topography, historic sites and structures, roadway features such as curving or rolling, and more.10 Any development of these roads (i.e., road improvement) or adjacent to them must be evaluated by M-NCPPC’s Countywide Planning Division, Environmental Planning Section for preservation or enhancement. The County strives to preserve the historic views, natural features, landscapes, and sites and structures along and near historic roads.11
Source: M-NCPPC
To preserve the viewsheds and character of scenic and historic roads in the master plan area, in accordance with County regulations, development within these corridors must be carefully evaluated.12 Two of the opportunity area corridors profiled in this report are designated as historic roads by the County: MD 450 (Annapolis Road) and MD 197 (Laurel Bowie Road/ Collington Road).
Future land use planning and development in these corridors must take into account this historic designation and the need to preserve historic views, landscape patterns, and sites and structures.
The Washington, Baltimore and Annapolis (WB&A) Electric Railway Bridge traverses MD 197, and the D.S.S. Goodloe House, a National Register site, also falls along this historic corridor. The Fair Running and Duvall Family Cemetery also lies along MD 197. MD 450 features the historic Holy Trinity Church, cemetery, and rectory.
There is a cluster of mid-century modern structures along the historic MD 450 corridor including the Bowie High School and the Bowie Volunteer Fire Department. The 2015 Prince George’s Modern survey includes sites in the mid-century modern architectural style, which date between 1941–1978.13
7 The history of the Blacksox Park is discussed in the Prince George’s County Parks Historic Sites brochure: http://pgparks com/DocumentCenter/View/4599/Historic-Sites-Brochure-PDF?bidId=
9 “2009 Approved Countywide Master Plan of Transportation.” 2009. The Maryland-National Capital Park and Planning Commission.
10 Subtitle 23 of Prince George’s County code, Roads and Sidewalks, establishes the criteria and guidelines for historic and scenic roads.
11 2009 Approved Countywide Master Plan of Transportation. 2009. The Maryland-National Capital Park and Planning Commission.
12 See Subtitle 23, Roads and Sidewalks at: https://library municode com/md/prince_george’s_county/codes/code_of_ ordinances?nodeId=PTIITI17PULOLAPRGECOMA_SUBTITLE_23ROSI
13 Read more about the history of Prince George’s modern architecture at: https://www mncppc org/DocumentCenter/View/631/ Prince-Georges-Modern-Context-Narrative-PDF
Page 160 • Prince George’s County Planning Department
Source: M-NCPPC. Bowie High School, a mid-century modern building within the MD 450 Corridor
OLD TOWN BOWIE CLUSTER: HISTORIC RAILROAD TOWN HISTORY
The greatest concentration of historic sites and features in the master plan area is in Old Town Bowie and its vicinity, where there is a cluster of historically relevant sites and designations.
Though Old Town Bowie contains the highest concentration of historically significant properties and significant history for the master plan area and region, a 2009 historic district survey conducted by M-NCPPC found that the district had lost too much of its historic integrity to be recommended either as a National Register Historic District or as a Prince George’s County Historic District. The survey cites the encroachment of nearby suburban development, twentieth century infill, and the construction of new subdivisions. Few original historic structures remain in Old Town Bowie for it to garner County or national recognition as a complete historic district, and the report notes a loss of historic design, setting, and feeling.14
The first phase of the Bowie Heritage Trail—proposed in 2009 as part of the update to the Bowie Trails Master Plan—was completed in 2019, connecting 10th Street and 12th Street in Old Town Bowie. A second phase of the trail was removed from the budget last year due to fiscal concerns.15
MID-CENTURY MODERN HISTORY: MD 450 CORRIDOR AND BELAIR CLUSTER
Another significant era in the history of Prince George’s County and the master plan area is that of suburban development post-World War II, which was marked by the arrival of the Levitt & Sons development of Belair. The Belair development was constructed between 1957 and 1965 after William Levitt purchased the historic Belair Estate with plans to develop a suburban community fashioned after his planned subdivisions in New York, New Jersey, and Pennsylvania. Levitt’s acquisition of the 2,200-acre estate coincided with the naming of Bowie as a city.
14 Huntington/Bowie (71B-002).” 2009. M-NCPPC. http://www mncppcapps org/planning/HistoricCommunitiesSurvey/ CommunityDocumentations/71B-002%20Huntington/PG%2071B-002,Huntington-Bowie%20Community%20Survey pdf 15 https://www capitalgazette com/maryland/bowie/ac-cn-bowie-trails-0103-story html
Development of the Belair subdivision accompanied and contributed to the County’s growth as one of the region’s fastest-developing suburbs.16 This growth was buoyed by the construction of new roads and highways, including the opening of the Capital Beltway in 1964, the large booming federal government in nearby Washington, D.C., and wider trends of suburbanization and “White flight” from cities during this era.
The Prince George’s County Planning Department identifies and tracks the location and condition of structures built during the mid-century modern period (1941–1978) that retain the architectural integrity and character of the era. Some, though not all, of these structures are designated as historic sites and are thus subject to HPC review for modifications and new construction.17 Some of the original model homes for the Levitt & Sons development, such as the “Country Clubber,” are recognized for their architectural and historic significance.
ARCHEOLOGICAL SURVEY SITES
In addition to historic sites and clusters, the master plan area includes various archeological survey sites that have required, and may continue to require, archeological evaluation for development. Most archeological survey sites in the master plan area as of 2019 are located in Established Communities.
Within the focus areas, the Melford Property archeological survey site makes up a large portion of the northeast subarea of the Bowie Local Town Center. The conceptual site plan for the live/work mixed-use site of Melford Village was reviewed by HPC in 2013 for impacts on the historic character of the Melford Historic Site.18 Melford is a historically and architecturally significant site, designated as a Prince George’s County Historic Site and listed in the National Register of Historic Places. As such, any proposed development within or adjacent to the environmental setting of the site is subject to review by the County HPC for a recommendation of approval, denial, or approval with conditions to the Planning Board or the Prince George’s County
District Council. Melford Village was designed to highlight the Melford plantation house and grounds, and the Duckett Family Cemetery as “community assets and design focal points.”
Additionally, a large cluster of archeological survey sites is adjacent to the Collington Trade Zone and includes the Willow Pond Property, the Oak Creek Club, Locust Hill, and the Willowbrook Property— from which the Bowie Family Cemetery was moved to accommodate development at the site.19 In the Established Communities, there are a number of archeological sites grouped along the US 50 Corridor, including the Pleasant Prospect property, which is the site of a plantation complex owned by the family of Richard Duckett from the 1720s to 1790s. Artifacts collected at this site are highly regarded by researchers in the region looking to understand the late colonial period.20
16 M-NCPPC. 2015. “Prince Georges Modern.” https://www.mncppc.org/DocumentCenter/View/631/Prince-Georges-ModernContext-Narrative-PDF.
17 Guidelines for historic review are outlined in Subtitle 29 of Prince George’s County code, which can be found here: https://library municode com/md/prince_george’s_county/codes/code_of_ordinances?nodeId=PTIITI17PULOLAPRGECOMA_ SUBTITLE_29PRHIRE
18 Goodwin and Associates, R Christopher. 2013. “Historic Preservation Analysis: Melford Village Conceptual Site Plan.”
19 “Approved Historic Sites and Districts Plan.” n.d. Issuu. Accessed March 26, 2020. https://issuu com/mncppc/docs/
20 “Maryland Unearthed: A Guide to Archaeological Collections at the Maryland Archaeological Conservation Laboratory.” n.d. Accessed March 26, 2020. https://apps jefpat maryland gov/mdunearth/SiteSummaries/Site18PR705 aspx
162 • Prince George’s County Planning Department
Source: M-NCPPC. Melford Historic Site
Detailed asset inventory can be found in Appendix F. Asset Inventories: Community Heritage and Culture on page 238.
Archeological Survey Site (2019)
Rural/Agricultural Reserve
Established Communities Focus Area
Source: GIS Data Catalogue, Prince
County Planning Department.
George’s
Fairwood
Woodmore
Huntington
Mitchellville
Jericho Park
Duckettsville
Idlewild
Queen Anne Estates
Sherwood Manor
High Bridge Estates
Collington
Overbrook
Hall
Patuxent Riding
Heritage Hills
Ternberry
Pin Oak Village
Culture: Arts and Entertainment District
Maryland has 28 designated arts and entertainment (A&E) districts, each reflecting the traditions and culture of its local community. The Maryland State Arts Council launched the program in 2001 “to stimulate the economy and improve quality of life” and offer tax incentives to locales that apply and receive the state designation.21 Counties and municipalities in Maryland can apply for the designation for particular area(s) within their jurisdiction that meet established criteria related to arts and entertainment activity and potential that the municipality or county would like to support and encourage through the program.
Since the inception of the program in 2001, the state has achieved many social and economic benefits associated with creative placemaking projects. The program’s most recent economic impact study shows that, in FY 2018,
events and new businesses in these A&E districts collectively supported more than $1 billion in state gross domestic product, $72.1 million in state and local tax revenues, and 9,987 jobs (that paid more than $320 million in wages).
One of the state’s A&E districts—The Gateway Arts and Entertainment District—is located in Prince George’s County. However, none are in the BowieMitchellville and Vicinity master plan area. In 2019, local independent artists and the Bowie Regional Arts Vision Association began pushing the Bowie City Council to apply for a state A&E designation for Old Town Bowie.22
There may be an opportunity to create an A&E district in Bowie-Mitchellville and Vicinity by leveraging the existing character of Old Town Bowie or the retail concentration of the Bowie Local Town
21 “Maryland Incentive Zones - Arts and Entertainment Districts.” n.d. Accessed March 19, 2020. https://data imap maryland gov/datasets/57ca8c352332496b86280e9ff0be8d57_2
22 Pacella, Rachael. 2019. “Group Pushes for Old Bowie Revitalization through Art.” Capitalgazette.com. January 30, 2019. https://www capitalgazette com/maryland/bowie/ac-cn-arts-entertainment-0207-story html
Page 164 • Prince George’s County Planning Department
Source: M-NCPPC.
Mid-century Modern Home: Cloydd Barnes House on Smithwick Lane
Bethesda Arts & Entertainment District
Wheaton Arts & Entertainment District
Silver Spring Arts & Entertainment District
Gateway Arts & Entertainment District
Annapolis Arts & Entertainment District
Prince George’s County
Master Plan Area
Arts and Entertainment Districts
Source: Maryland Open Data, GIS Data Catalogue, Prince George’s County Planning Department.
Center. The following highlights examples from existing A&E districts that may inspire potential branding and programming for Old Town Bowie or Bowie Town Center:
• Oakland A&E District: Oakland’s A&E district builds on the far-western Maryland town’s roots as a mecca for the Appalachian region. Located in downtown Oakland, the A&E district includes murals that reflect the town’s rich history as well as the Garrett County Arts Council’s gallery that sells artwork by more than 150 regional artists. With a population of less than 2,000 people, Oakland’s main entertainment attractions include the Our Town Theatre, the Oakland B&O Railroad Museum, the Garrett County Museum of Transportation, and the Garrett County Historical Museum.
• Silver Spring A&E District: Silver Spring’s A&E district comprises a variety of options for live music, theatre, film, and dance. The AFI Silver Theatre and Cultural Center is a restored movie theater that hosts a series of film festivals in addition to classic movies and documentaries. The Black Box Theater is a neighborhood theater
company providing year-round live shows that includes plays and live concerts. The Fillmore Silver Spring is a live music venue that draws both local artists and mainstream music acts and includes several bars. Silver Spring’s A&E District also includes live summer concerts and public art.
• Havre de Grace A&E District: Havre de Grace’s A&E district is comprised of several art galleries, specialty shops, and antique stores in addition to hosting annual art festivals. This waterfront town includes a variety of art centers including The Artists’ Emporium art gallery, the Cultural Center at the Opera House performing arts theater, and the Arts by the Bay art gallery.
• Gateway A&E District: The Gateway Arts and Entertainment District, located in Prince George’s County, is another important reference point for Bowie-Mitchellville and Vicinity to consider as a precedent for arts-based revitalization. Formed in 2001, the Gateway A&E district makes up a twomile stretch along US 1 (Baltimore/Rhode Island Avenue). The Gateway A&E district features over 100 arts-based organizations. The district includes
galleries, artist studios, cafes, restaurants, a media arts lab, and three dedicated artist housing properties. It is managed by a team of public- and private-sector agencies/individuals, including the Gateway Community Development Corporation, a 501c3 nonprofit formed to drive arts-based revitalization in the district. Given the large size of this district (358 acres) and the number of artists located there (685), the examples above present a closer match to the scale of a potential A&E district in the master plan area.23
POPULATION WORKING IN ARTS AND ENTERTAINMENT
One precedent for the establishment of an A&E district in the master plan area is the presence of working artists and cultural workers in and near the master plan area. The following map shows the number of residents who report to work in arts and entertainment occupations, according to the 2017 American Community Survey.
Within the master plan area there are an estimated 1,781 citizens whose occupation is in arts, design, entertainment, sports, and media (ACS 2017) within an area of approximately 37,670 acres.24
The tract with the highest proportion of residents in the arts industries is 1,980 acres and has approximately 201 artists (ACS 2017). It is unclear from these numbers alone whether there is an adequate artist population in any one zone within the master plan area to sustain an A&E district, but Figure 63. Artist Population per Acre in Select A&E Districts shows the presence of working arts and entertainment professionals, particularly near Old Town Bowie. Residents and advocacy groups in the City of Bowie have advocated for the designation of an A&E district, including a citizen advisory council called Connect Bowie.25
A&E DISTRICT POTENTIAL BY FOCUS AREA
In addition to the existence of artists and arts advocates, the Maryland State Arts Council evaluates potential A&E district applicants according to a core set of criteria, some of which present opportunities for planning and land use. In order to sustain a local or regional center for arts and culture, a potential A&E district should contain the capacity for affordable housing options for working artists, a cultural anchor institution, and available space to establish new cultural venues or host public events such as outdoor performances and festivals. Both Old Town Bowie and Bowie Town Center present some potential in the pursuit of an A&E district designation.
OLD TOWN BOWIE
Affordable Artist Housing
There is not a high potential within Old Town Bowie for affordable artist housing. There is not a high concentration of houses with distinctive architectural features that could be repurposed into creative housing marketed to attract artists. The area’s overall low-density, lack of connectivity and lack of amenities limit its potential as an opportunity for successful, affordable or artist housing. If an A&E district were to be pursued in Old Town Bowie, successful programming, and an increase in events and visitation, will be needed to activate the node and establish an identity to then support residential development.
Source: Maryland State Arts Council.
23 More information about the Gateway A&E District can be found at: http://mygatewayarts org/live/living-in-the-arts-district/ learn-about-the-districts-municipalities/# XqyGZMhKh3g
24 Note: Neustar reports: 3,408 (2019, Q4) in “Arts Industries.”
Figure 63. Artist Population per Acre in Select A&E Districts
Map 63. Total Population with Occupation in Arts, Entertainment, Design, and Media (2017)
Mitchellville
Duckettsville
Idlewild
Queen
Sherwood Manor
High Bridge Estates
Collington
Overbrook
Hall
Patuxent Riding
Ternberry
Pin Oak Village
Source: M-NCPPC.
New Anchor Cultural/Arts Institution
Rather than pursue new institutions in Old Town Bowie, the City of Bowie should focus on its existing assets. The strongest opportunity is to expand the Railroad Museum into a cultural anchor with robust programmatic offerings and a greater variety and frequency of events. The historic nature of the railroad buildings and their importance in regional transit and connectivity could be leveraged as the foundation of the district’s identity, helping to build a historic theme for arts, music, fairs, and other events offered in the district. There would need to be engagement with residents, business owners, and museum officials to better understand this potential.
Vacant Land
There is a large wooded parcel to the southeast of the intersection at 5th and Chestnut Avenue, in Old Town Bowie. It is accessible from the Bowie Railroad Museum and Old Bowie Town Grille. This could be used in the summer and through the fall to host outdoor events and gatherings in partnership with the museum, which would attract residents and visitors to the area. An aerial view of this vacant area can be seen in the Figure 65. Vacant Parcel South of IMI Training Center at Melford Town Center.
BOWIE LOCAL TOWN CENTER
Affordable Artist Housing
There is potential for mixed-income residential development to be delivered as part of infill development around Bowie Town Center. This would need to be included as part of a mixed-use development that promotes connectivity to existing retail and food and beverage establishments in the area. However, without a clear identity in the area and a lack of existing arts assets or cultural anchors, it would be difficult to market this as “artist” housing.
New Anchor Cultural/Arts Institution
One opportunity for the master plan area to consider is the development of an entertainment or performance venue at Bowie Town Center, potentially near Melford Town Center, in addition to the existing Courtyard Marriott, would add significant residential density to the area. Pursuit of an entertainment or performance venue should be considered only after Melford’s residential development has begun to deliver, so that there is increased density in place to help support a venue. In exploring the potential and feasibility of a new performance or entertainment venue at Bowie Town Center, the City of Bowie and vicinity should engage with Bowie State University (BSU) about potential collaboration, leveraging BSU’s existing performance capacities. BSU’s Fine and Performing Arts Center opened in 2012 and the BSU Theatre produces two main stage productions and two black box productions per season. The BSU Theatre also hosts student produced work and visiting companies, as well as other co-curricular activities for students, faculty/staff, and the community. The fine and performing arts center features a 400-seat main stage theater, a 200-seat black box theater, and a 90-seat movement studio. Conversations with the arts center could help planners understand the level of demand for performance space in the area and explore the potential for BSU resources to help activate a new venue at Bowie Local Town Center.
Vacant Land
At Melford Town Center, there is a parcel slated for future residential development. The parcel is directly south of the existing IMI Training Center and provides potential for integrating a mix of uses, which could include art-related uses or artist housing.
Wooded Parcel Near Bowie Railroad Museum
Source: GIS Data Catalogue, Prince George’s County Planning Department.
Vacant Parcel South of IMI Training Center at Melford Town Center
Melford Town Center
Old Town Bowie
Parcels
Bowie Railroad Museum Chestnut Ave Maple Ave
Source: GIS Data Catalogue, Prince George’s County Planning Department.
Discussion of Challenges and Opportunities
HISTORY AND HERITAGE
While the master plan area features a variety of historic sites and features, preservation of historic integrity and character has presented a challenge to BowieMitchellville and Vicinity in the past. Twentieth-century suburban development has replaced or diminished many historic structures. The master plan area faces general barriers to historic preservation and adaptive reuse, including understanding the complexities of historic preservation designations and registries.
Old Town Bowie was not included in the 2010 Historic Sites and Districts Plan and has not qualified in the past for historic district designation. An MIHP form compiled by a consultant in 2009 found that Old Town Bowie lacked the historic integrity, character, and feeling necessary for historic district status. The City of Bowie should consider the pros and cons of pursuing a historic district designation for Old Town Bowie at the County level, including weighing the possible benefits to such a designation in future planning and preservation. The Goodwood historic site (74B-014), listed on HPC’s Properties of Concern list, is located in the Rural and Agricultural Reserve—past the County’s growth boundary. The current sales listing advertises the property as a development opportunity to subdivide and construct housing. This points to the challenge of turnover of historic sites and properties that, in addition to threatening historic preservation, may run counter to County and local planning objectives.
WAYFINDING AND THE ANACOSTIA TRAIL HERITAGE AREA
The Anacostia Trail Heritage Area presents an opportunity to apply for heritage grants through the state to further highlight the natural and historic assets in the master plan area. The Anacostia Trail Heritage Area encompasses all, or parts of all, focus areas considered in this report, except for the Collington Trade Zone. This may point to opportunities to better connect the focus areas to local history and to each other. Local and regional tourism can be expanded using grant funding and the existing sites and tourism assets of Old Town Bowie.
HIGHLIGHTING AFRICAN AMERICAN HISTORY AND CULTURE
Bowie-Mitchellville and Vicinity is home to many significant historic African American communities and sites, as well as BSU, a historically Black university. The master plan area can further highlight African American history and heritage sites around Old Town Bowie and the nearby historic rural community of Fletchertown. The master plan area may consider structural enhancements such as wayfinding and signage at sites and along trails, as well as programmatic approaches such as tours, festivals, and cultural events that highlight the historical and ongoing contributions of African American communities to Bowie-Mitchellville and Vicinity.
ARTS AND ENTERTAINMENT DISTRICT
Both Old Town Bowie and Bowie Town Center present some challenges toward the establishment of an A&E district. In Old Town Bowie, there is a lack of potential for artist housing and other residential growth, while Bowie Town Center lacks a clear art-related identity or existing art-related assets.26
The master plan area has the potential to create its own arts and entertainment district by incorporating local art, community activities, and entertainment events in either Old Town Bowie or Bowie Town Center. The existing population who work in the arts, and the presence of residents and citizen advisors who have recently advocated for an A&E designation, are assets in laying the foundation for an A&E district in the master plan area.
There is an opportunity to learn from the experiences of the arts community in the Gateway Arts District in recent years and leverage local collaboration to assess the potential of arts-based strategies and funding streams (within or apart from A&E district designation). For instance, one lesson learned from the Gateway Arts District is the challenge of rising housing costs that can drive the displacement of artist residents whose work and livelihood have driven development and revitalization in the district.
26 “Group Pushes for Old Bowie Revitalization through Art—Capital Gazette.” n.d. Accessed April 6, 2020. https://www capitalgazette com/maryland/bowie/ac-cn-arts-entertainment-0207-story html
2.7 Healthy Communities
Bowie-Mitchellville and Vicinity is an area rich with natural features including plentiful open space, parks, and agriculture/farmland. The majority of residents can access a local or regional park with a 10-minute drive and the City of Bowie has the most extensive trail network of any municipality within the County.
The master plan area also faces challenges related to community health, such as a large and growing population of senior residents and automobile dependence, which can contribute to less active lifestyles for residents and inhibits active forms of transportation such as walking or bicycling.
As Bowie-Mitchellville and Vicinity plans for a healthy and sustainable future, this set of analyses considers existing conditions related to green space and recreational facilities access, food access and resources, senior population and wellness, and environmental conditions and sustainability.
COVERED IN THIS SECTION:
• Park Access
• Food Systems
• Senior Care and Services
• Sustainability and Environment
How can the master plan area ensure the health and sustainability of its communities, now and in the future, through active transportation, food and healthcare access, and promoting access to the County’s Green Infrastructure Network?
The Bowie Farmers Market
Source: The City of Bowie.
Park Access Analysis
PARK LAND PER CAPITA
Approximately 10 percent of the master plan area is comprised of publicly accessible parks. This places the master plan area above most planning standards for desired amounts of parks and green space.
Calculating the total number of green space per capita, or per 1,000 residents, can be a helpful way to rate a planning area’s level of park access. In BowieMitchellville and Vicinity, an area of 37,670 total acres, approximately 3,646 acres are parks or about 10 percent of total land area. The total population in the master plan area, as of 2019, is approximately 88,590—meaning there are about 42 acres of park land per 1,000 residents. The Prince George’s County system-wide park land level of service (LOS) standards, as established in the Formula 2040 plan, sets 35 acres per 1,000 population as a countywide benchmark, placing Bowie-Mitchellville and Vicinity well above the LOS standard.
The master plan area’s total park land equates to about 170 square meters per capita. This places the master plan area above the planning standards for urban green space, in which 50 square meters per capita is held as a standard by many researchers.1
However, as seen in Figure 68. Park Land as Percentage of Total Area, National and Regional Comparison, the master plan area falls below the national median for the percentage of land used for parks and recreation.
There are 64 parks in the master plan area, and approximately 66 percent of them have trails or active recreation facilities for the enjoyment of residents and visitors—31 parks have recreational facilities such as playgrounds, sports complexes, or exercise equipment; 26 parks have trails for walking and/or biking; and 15 parks have both recreational facilities and trail access.2
1 Russo, Alessio, and Giuseppe T. Cirella. 2018. “Modern Compact Cities: How Much Greenery Do We Need?” International Journal of Environmental Research and Public Health 15 (10). https://doi.org/10.3390/ijerph15102180.
2 Parks data come from the Prince George’s County Planning Department.
42 acres per 1,000 residents
Parks (3,646 acres)
Other (34,024 acres)
* Washington, DC has the second highest ParkScore rating in the country from the Trust for Public Land as of 2020.
Figure 66. Acreage of Park Land in BowieMitchellville and Vicinity
Figure 67. Acreage of Active Recreation or Trail in Bowie-Mitchellville and Vicinity
Source (all figures on this page) : GIS Data Catalogue, Prince George’s County Planning Department.
Figure 68. Park Land as Percentage of Total Area, National and Regional Comparison
Based on data from the Prince George’s County Planning Department, almost all parks in the master plan area are owned and operated by M-NCPPC. Two facilities are municipally owned (Bowie Community Center and Huntington Community Center) and the Prince George’s Boys and Girls Club operates a parks facility on Woodmore Road.
PARK ACCESS IN BOWIE-MITCHELLVILLE AND VICINITY
Local and regional parks provide space for recreation, sports, gathering, and outdoor access for residents of Bowie-Mitchellville and Vicinity. This set of analyses considers park access in the master plan area—via foot, bicycle, and car—both as a percentage of total land area, and as a percentage of population served.
In the following analyses, walking distances in BowieMitchellville and Vicinity are calculated along existing road networks using the Mapbox Isochrone API, a tool that computes geographic areas that are reachable within a specified distance or amount of time, by mode of travel. This methodology accounts for barriers and hazards for walkers and cyclists, but does not strictly adhere to sidewalks, trails, or bike lanes. These features are shown on the maps in this section for added reference and context.
While 86 percent of land in the master plan area falls within a 10-minute drive of a park, only 22 percent of Bowie-Mitchellville and Vicinity falls within a 10-minute walk from a park. This discrepancy does not come as a surprise given the historic development of this suburban community around the automobile. In terms of population, the walkable service area for parks in Bowie-Mitchellville and Vicinity includes about 29 percent of the master plan area’s population.
Source: M-NCPPC.
Formula 2040 calls for a 20,000-square-foot nonaquatic addition to the Bowie Community Center, which is owned and operated by the City of Bowie
By comparison, 64 percent of the land area in BowieMitchellville and Vicinity falls within a 10-minute bike ride from a park. While this figure does not account for the master plan area’s challenges related to bike safety and infrastructure (e.g., lack of bike lanes and side paths, and poor route connectivity), it does suggest that there may be potential to expand bicycle use as a form of active transportation to and from local parks.
The Formula 2040 Parks Plan, approved in 2014, established the Department of Parks and Recreation’s (DPR) framework to meet the County’s future parks and recreation needs. An overriding goal of this plan is to connect County residents to quality parks, recreational facilities, and trails that match their needs according to level of service (LOS) standards.
Formula 2040 calls for a 20,000-square-foot nonaquatic addition to the Bowie Community Center and a 20,000-square-foot nonaquatic addition to the South Bowie Community Center. The plan also calls for an expansion of the Glenn Dale Community Center, just outside the master plan area boundaries, into a multigenerational center, including the addition of three sizable facilities (including indoor and outdoor aquatic facilities).
Policy PF6 of Plan 2035 calls for future planning in the County to support the objectives of Formula 2040, including a shift toward intergenerational recreational facilities with aquatic elements, and adopting comprehensive standards related to parks land acquisition, facilities design, and more.
FUNCTIONAL MASTER PLAN FOR PARKS, RECREATION AND OPEN SPACE
FORMULA 2040 PARKS PLAN (2014)
Detailed asset inventory can be found in Appendix G Asset Inventories: Healthy Communities on page 240
Source: GIS Data Catalogue, Prince George’s County Planning Department.
Collington
Overbrook
In terms of public transportation, over 60 percent of bus stops in the master plan area are within a 10-minute walk from a park. This equates to 171 of 282 bus stops. Note that only about 67 percent of dwelling units in Bowie-Mitchellville and Vicinity are located within a quarter-mile walk of a bus stop. This figure, paired with challenges related to bus reliability and ridership, indicates that residents are unlikely to access parks and outdoor recreation via public transportation.
Transportation conditions and infrastructure, including pedestrian and cyclist safety and public transit ridership and access, are discussed in greater length in Section 2.5. Transportation and Mobility.
Residents in the master plan area are considerably less likely to live within a 10-minute walk of a park than their counterparts in Washington, D.C., which, at 98 percent, has the highest ParkScore of all U.S. cities, as measured by the Trust for Public Land. However, park access is not spread evenly throughout the master plan area. Residents within the City of Bowie are much more likely to live within walking distance of a park than the master plan population overall. In fact, at 64 percent of residents within a 10-minute walk of a park, the City of Bowie ranks above the national average of cities and towns assessed by the Trust for Public Land’s ParkScore. This speaks to the greater density and
walkability within the City of Bowie, and the higher prevalence of public neighborhood parks.
Portions of the master plan area north of MD 450 (Annapolis Road) are generally better served by walkable local parks. There are 10-minute walksheds within or adjacent to each of the master plan focus areas, aside from the Collington Trade Zone. Residents in established communities are less consistently served by parks within walking distance. There are fewer small, local parks in parts of the master plan area, particularly south of MD 450. There is also less sidewalk infrastructure connecting residents to parks in some established communities, including along the Church Road corridor south of MD 450.
Some residents in Bowie-Mitchellville and Vicinity have walking access to parks just outside the master plan area boundaries—with the most significant example being Watkins Regional Park, situated directly west of MD 193, which has a walkshed that is relatively well serviced by sidewalks.
Map 66. Master Plan Area Park Access: 10-Minute Bike Ride illustrates park access in the master plan area by bike and is calculated using road network distances. These calculations do not take cycling conditions into account such as road safety and bike infrastructure. However, bike lanes are identified with green lines.
*Washington, D.C. has the highest ParkScore of all U.S. cities, as measured by the Trust for Public Land.
Source: Trust for Public Land
Figure 69. Park Access in Bowie-Mitchellville and Vicinity (as Percentage of Land Area)
Source: GIS Data Catalogue, Prince George’s County Planning Department
Figure 70. Park Access in Bowie-Mitchellville and Vicinity (as Percentage of Land Area)
Bike Lane
Playground
Picnic Areas Park
10-Minute Cycling Zone
Focus Area
Map 66. Master Plan Area Park Access: 10-Minute Bike Ride Source: GIS Data Catalogue, Prince George’s County Planning Department; Mapbox Isochrone API.
Queen Anne Estates
Collington
Overbrook Hall
Patuxent Riding Heritage Hills
Ternberry
Oaktree
Pin Oak Village
Yorktown Belair
Area Map 67. Regional Parks Access: Local and Regional Park 10-Minute Drivesheds
10-Minute Driveshed of Master Plan Area Parks
10-Minute Driveshed of Nearby Parks (Outside Master Plan Area)
GIS
Globecom Wildlife Management Area
Glenn Dale Community Center
Park
miles
Source:
Data Catalogue, Prince George’s County Planning Department; Mapbox Isochrones API.
Most bike infrastructure is concentrated in and around Bowie Town Center, with some longer routes north of MD 450. The actual percentage of master plan area within a 10-minute bike ride of a park may be lower if we account for biking conditions and infrastructure— particularly in the southern half of the master plan area.
REGIONAL PARK ACCESS
Bowie-Mitchellville and Vicinity boasts many parks, including many with facilities such as community centers, playgrounds, picnic areas, and trails. However, residents also enjoy access to many parks that fall outside the boundaries of the master plan area. The 10-minute drivesheds of these nearby parks are shown in Map 67. Regional Parks Access: Local and Regional Park 10-Minute Drivesheds.
Glenn Dale Community Center, located just outside the master plan area in Glenn Dale, Maryland, is a short drive away for many Bowie-Mitchellville and Vicinity residents, particularly those residing in the northwest portion of the master plan area. Glenn Dale Community Center features a wide array of facilities and programming, including childcare and specialized programming for teens and seniors. The 19,653-square-foot Glenn Dale Splash Park includes aquatic facilities, such as an outdoor pool, water slide, locker rooms, and a vending area, and can be accessed seasonally for an admissions fee between $5.00–$8.00. In accordance with Formula 2040 plan recommendations, the Glenn Dale Community Center will be expanded as a multigenerational community
center, with an additional 65,000 square feet of aquatic and nonaquatic recreational facilities.
Directly to the east of the master plan area in Anne Arundel County is the Globecom Wildlife Management Area in Davidsonville, Maryland, a 207-acre reserve known for wildlife, birdwatching, hunting, and more.
Enterprise Park, an M-NCPPC-owned park situated just outside the master plan area on Enterprise Road in Mitchellville, features an 18-hole, year-round public golf course.
TRAILS NETWORK
With approximately 19 miles of paved and unpaved trails, the City of Bowie has the largest trail network of any municipality in the County.3 The 2016 Trails Master Plan for Prince George’s County rates current trail access (as of 2016) in the City of Bowie as “good,” and rates future trail access with the buildout of planned or proposed trail networks as “excellent.”
The plan does not consider City of Bowie to move from “disconnected” to “connected” to the County’s primary and secondary trail networks through the implementation of planned trails.4
Major barriers to trails access and expansion that impact the master plan area include US 50 (John Hanson Highway) and the Northeast Corridor (Amtrak and MARC rail line). MD 197 (Laurel Bowie Road), MD 214 (Central Avenue), and US 301 (Crain Highway) are classified as minor barriers.
3 The Maryland-National Capital Park and Planning Commission. 2016. “Trails Master Plan for Prince George’s County.” https:// issuu.com/pgparks/docs/trails_master_plan_low_res.
4 The City of Bowie. 2019. “The City of Bowie Trails Master Plan and Complete Street Policy.” https://www.cityofbowie. org/2410/Trails-Master-Plan.
Source: M-NCPPC.
Food Systems
Food access is another important consideration in understanding and improving the health of communities in Bowie-Mitchellville and Vicinity. This report considers the degree of access master plan area residents have to fresh food sources including supermarkets, farmers markets, and farms that sell locally.
Close proximity to agricultural land, and the potential for community gardens and farms within more densely populated parts of the master plan area, are assets to consider in planning for a sustainable local food system.
Bowie-Mitchellville and Vicinity possesses other strong assets related to the availability of fresh food including two publicly managed community gardens, two farmers markets, several food pantries, and other resources. However some areas within the master plan area are less well served by fresh food options including a portion of the US 301 Corridor and much of the northern portion of the master plan area—including Old Town Bowie and Bowie State University (BSU).
FRESH FOOD ACCESS
Consistent with other trends related to access and mobility in the master plan area, supermarkets are more easily accessible by car than by foot. While the master plan area features corner stores and convenience stores that sell food, these stores are not included in the fresh food access analysis as they are not considered to provide a full range of healthy, fresh, and affordable food options.5
In terms of land area, about 62 percent of the master plan area falls within a 10-minute drive of a supermarket. There is far less access to supermarkets by foot. In terms of land area, only 4 percent of BowieMitchellville and Vicinity falls within a 10-minute walk of a supermarket.
Seventeen percent of bus stops are located within a 10-minute walk of a supermarket (48 of 282 bus stops in the master plan area). As mentioned previously, only about 67 percent of dwelling units in the master plan area falls within a quarter-mile walk of a bus stop, and the local bus system faces challenges with ridership and schedule consistency. In today’s conditions, bus travel is likely not the most practical way for residents to access supermarkets and other food sources.
Five out of seven supermarket walksheds (10-minute walk) contain at least one bus stop, or 71 percent of supermarket walksheds. While the master plan area faces broader challenges related to bus service, as mentioned in the discussion of parks and green space access, these bus stops may warrant consideration as an asset to prioritize future improvements of the local bus system.
As seen in Map 68. Supermarket Access in the Master Plan Area (Walking and Driving), a large portion of the master plan area is covered by the 10-minute driveshed for supermarket access. Much of the rural and agricultural preserve to the east of US 301 (Crain Highway) falls outside of this driveshed. However this is not alarming, given that most standards for fresh food access would expect those residing in areas classified as rural to travel farther than 10 minutes for supermarket access.6
Much of Bowie State University (BSU) and its vicinity, as well as nearby subdivisions along the west side of MD 197, fall outside of the 10-minute driveshed for supermarket access. As discussed in the upcoming analysis of limited supermarket access areas (LSA’s), this area also presents low food access relative to other blocks of comparable population size, density, and car ownership.
Most supermarkets, and their 10-minute walksheds, are concentrated in the US 301 (Crain Highway) corridor near Bowie Local Town Center and along the MD 450 (Annapolis Road) corridor west of MD 197 (Collington/Laurel Bowie Road).
The map also indicates smaller grocery options such as convenience stores and corner grocers, which are most prevalent along US 301 but also found in other commercial centers, including along MD 450 and MD 197.
While bus is likely not the most practical way to travel to and from supermarkets in the master plan area, it is worth noting that five supermarkets have bus stops situated at, or adjacent to, their entrances/parking lots. This figure does not take into account walking conditions, pedestrian safety, or other barriers to access between bus stops and supermarket entrances. Further analysis is recommended to evaluate these factors.
5 See, for example, the USDA Food Access Research Atlas: https://www.ers.usda.gov/data-products/food-access-researchatlas/documentation/
6 See, for example, USDA Food Research Atlas Standards: https://www.ers.usda.gov/data-products/food-access-researchatlas/documentation/
Page 180 • Prince George’s County Planning Department
Source: GIS Data Catalogue, Prince George’s County Planning Department; Mapbox Isochrones API.
SUPPLEMENTAL NUTRITIONAL ASSISTANCE PROGRAM (SNAP) BENEFITS AND FOOD RESOURCES
As of 2017, approximately 9.6 percent of the population in Prince George’s County participated in Supplemental Nutrition Assistance Program (SNAP). The master plan area has a much lower rate of SNAP enrollment overall as compared to the County, with the average SNAP enrollment rate for census block groups at approximately four percent. The census block with the highest percentage of household SNAP participation between 2014–2018 is on par with the County average, with a rate of 9.7 percent.
LOW FOOD ACCESS: LIMITED SUPERMARKET ACCESS AREAS (LSA)—2018
The Limited Supermarket Access Areas analysis is a national analysis conducted by The Reinvestment Fund (TRF) that identifies areas with relatively limited access to supermarkets. This analysis uses supermarkets as a proxy for healthy food access, given that these stores tend to provide a wider variety of healthier foods, at lower prices.7
Each block group in this analysis is assigned a class based on population density and car ownership. Distance traveled to the nearest supermarket is then compared to typical distances traveled by residents in well-served block groups. Block groups are then assigned a low access score: the percentage by which that block group’s distance to the nearest supermarket would need to be reduced to equal the typical distance for well-served block groups in that class. If a block’s score is greater than or equal to 0.45, it is considered to be limited-access. These residents travel almost twice as far, on average, to a supermarket as those in well-served block groups with similar profiles based on population density and car ownership.
LSA areas are contiguous sets of limited access block groups with a population of 5,000 people or more, in which there may be enough market demand to support expanded supermarket offerings.
In Prince George’s County, a total of 229,480 residents (as of 2018) live within LSA areas—which constitutes about 25 percent of the population. Approximately 12,367 of these residents—or about 5 percent of the total—reside within the master plan area.8
7 “2018 Update of the Limited Supermarket Access Analysis.” 2018. Reinvestment Fund. 2018. https://www.reinvestment.com/ research-publications/2018-update-analysis-of-limited-supermarket-access/.
8 “Limited Supermarket Access Areas 2018.” 2018. Johns Hopkins Center for a Livable Future. 2018. https://data-clf.hub.arcgis. com/datasets/bd52388c5f6d4b41b0d06833690dbb6e_258.
Prince George’s County Planning Department
Figure 71. Supermarkets in Bowie-Mitchellville and Vicinity
Source:
Data.
Map 69. Supplemental Nutrition Assistance Program (SNAP) Participation and Food Resources Map (2018)
Source: U.S. Census Bureau, Johns Hopkins Center for a Livable Future.
Ternberry
Oaktree
Pin
AGRICULTURE AND FRESH FOOD
There are about 6,200 acres of agricultural land in Bowie and Vicinity, representing approximately 16 percent of total acres in the master plan area.9
There are two farmers markets in the master plan area, and five farms that sell locally, either through farmstand, markets, community supported agriculture (CSA), or through wholesale. There are several others near the master plan area, particularly adjacent to the southeast boundary in Anne Arundel County.
The master plan area features two community gardens accessible to the public: the Bowie Community Garden at the Kenhill Center and the community garden at South Bowie Community Center.10 The Kenhill Center community garden is available only to residents of the
City of Bowie, and is managed by the municipality. Just outside the master plan area, there is a community garden located in Watkins Regional Park, which is managed by M-NCPPC.
In July 2019, the Prince George’s County Council introduced CB-14-2019, a bill that defines urban farms within the County’s zoning code. This bill authorizes urban farming in 21 zones, including a range of residential, commercial, and industrial zones.
According to the Prince George’s Soil Conservation District, approximately 79 percent of land in the County now allows urban agriculture thanks to the passage of this bill.
9 Data provided by the Prince George’s County Soil Conservation District, 2020.
10 There may be additional community gardens in the master pan area. Many community gardens are located on private properties. The County does not keep an inventory of active community gardens and urban farms in the County or master plan area.
Source: M-NCPPC.
A small farm near Mitchellville
The County also offers an Urban Agricultural Property Tax Credit, established by the Council in 2015. Applicants may pursue up to $5,000 in tax credits annually for property owners using their land for urban agriculture (defined as land between one-eighth of an acre and five acres zoned for agricultural uses or recognized as an urban farm pursuant to the County zoning ordinance).
One of the goals of the City of Bowie Sustainability Plan (FW1) is to “achieve 20 percent resident participation in programs that promote the production, distribution, purchase, and consumption of food that is sourced within 200 miles.” Under this goal are objectives such as:
• Create and maintain a community garden with plots on City property that residents can use to grow food (opened in 2019).
• Expanding the city Food Pantry— which now serves produce three times per week during peak season.
• Expand Bowie Farmers Market on main street and Old Town Bowie (to provide wider range of products, and to accept SNAP payment).
• Including a pilot program in which residents can buy a plot to grow food.
• Create a vertical farm or food forest for residents to use.
The expanded supply of land zoned to allow for urban agriculture, paired with the proximity to active and preserved farmland in the rural and agricultural Reserve (including several farms that sell locally), the master plan area possesses assets that can help advance goals such as those above.
Queen Anne Farm, Inc. 18102 Central Ave 20716 http://www.queenannefarm.com 3 Cabin Creek Heritage Farm 18235 Clagett Landing Rd 20774 http://www.cabincreekheritagefarm.com 4 Ciminellis Ecoasis Garden Center* 18301 Central Ave 20711 http://www.ecoasisgardencenter.com/ 5 Hall's Green Farm 506 Crain Hwy 20774 http://pickyourown.org/mdbalt.htm
Source: Maryland State Open Data.
Figure 72. Farms Selling Locally in Bowie-Mitchellville and Vicinity
Pictured in Map 70. Agriculture and Farm Fresh Food in Bowie-Mitchellville and Vicinity.
Source: M-NCPPC.
South Bowie Community Center offers a public community garden
Map 70. Agriculture and Farm Fresh Food in Bowie-Mitchellville and Vicinity
*Farms (2018) data is based on land use data from the Prince George’s County Planning Department, and represents parcels recorded as Agricultural-Natural Resources, with Farm as the detailed land use type
Source: U.S. Census Bureau, Johns Hopkins Center for a Livable Future.
Fairwood Woodmore
Queen Anne Estates
Sherwood Manor
High Bridge Estates
Collington
Overbrook Hall
Patuxent
Ternberry
AGRICULTURAL PRESERVATION
Bowie-Mitchellville and Vicinity’s active farmland is concentrated largely in the southeastern quadrant of the master plan area, east of US 301 within the Rural and Agricultural Reserve. In addition to the Plan 2035 imperative to avoid new development in the reserve (which is outside of the County’s growth boundary), some farms within the master plan area are preserved under state and County preservation programs.
The Maryland Agricultural Land Preservation Foundation (MALPF) is a program administered by the state, which purchases agricultural easements on prime farmland and restricts development of this land in perpetuity. Statewide, 300,916 acres of farmland have been permanently preserved through MALPF easements. About 168 of those acres preserve farmland that falls within the master plan area.11
The Historic Agricultural Resource Preservation Program (HARPP) is a program of Prince George’s County which preserves farmland that does not qualify for preservation under state-level programs like MALPF. It is managed by the Prince George’s County Soil Conservation District. HARPP Easements must fall within the County’s rural tier and be a minimum of 35 acres. The program has preserved over 1,850 acres of farmland, over 300 of which are in Bowie-Mitchellville and Vicinity.12
In addition to the MALPF and HARPP easements in the master plan area, there are four protected rural legacy parcels: two abut or fall within the MALPF easement on Swanson Road Spur, and the other two form an approximately 11-acre lot on Queen Anne Road, just north of the Clagett Landing property.
11 “Welcome MALPF.” n.d. Accessed May 19, 2020. https://mda.maryland.gov/malpf/pages/default.aspx
12 “HARPP.” 2019. Prince George’s Soil Conservation District. September 10, 2019. https://www.pgscd.org/agricultural-landpreservation/harpp/.
Figure 73. Agricultural Easements in Bowie-Mitchellville and Vicinity Pictured in Map 70. Agriculture and Farm Fresh Food in Bowie-Mitchellville and Vicinity.
Source: GIS Data Catalogue, Prince George’s County Planning Department
Senior Care and Services
Approximately 25 percent of the master plan area population is 65 years old and above. As discussed earlier in this report, the senior population represents the fastest growing segment of Bowie-Mitchellville and Vicinity, with the segment aged 65–74 growing most rapidly in recent years.
The master plan area includes seven senior housing facilities. Six of them are located in, or adjacent to, Bowie Town Center. All are located within a 10-minute drive of a supermarket.
The total capacity of all dedicated senior housing in Bowie-Mitchellville and Vicinity is 1,032. One of the senior living facilities, Bowie Commons, offers subsidized senior housing. Bowie Commons is reserved for Section 8-qualified elderly or disabled individuals, and has a capacity of 43 residents.
The master plan area has one senior center, the Bowie Senior Center, which offers a range of services and programming for older residents, including social events, recreational activities, educational programs, and a congregate lunch program. The senior center also provides transportation services for seniors, including door to door pick-up and drop-off by appointment.13
The medical center at Largo, featuring Largo Medical Center and University of Maryland Capital Regional Health, is a resource for many senior residents in Bowie-Mitchellville and Vicinity. The complex is only about a 10-minute drive from Cameron Grove, the master plan area’s largest retirement community and concentration of senior residents.
13 More information available at: https://www.cityofbowie.org/563/Transportation-for-Seniors
Figure 74. Senior Housing in Bowie-Mitchellville and Vicinity Pictured in Map 71. Senior Resdients and Resources.
Source: GIS Data Catalogue, Prince George’s County Planning Department..
Source: M-NCPPC.
Evergreen Senior Community
Map 71. Senior Residents and Resources
Source: U.S. Census Bureau, Johns Hopkins Center for a Livable Future.
Source: U.S. Census Bureau, Johns Hopkins Center for a Livable Future.
N 1 mile
Collington
Ternberry
Oaktree
Pin Oak Village Yorktown
LEED Certified Building (unspecified) Solar Array
Clean Water Partnership Area
LEED Certified Building (Silver)
LEED Certified Building (Gold)
Focus Area
City of Bowie
Belt Woods Natural Area
Sustainability and Environment
Bowie-Mitchellville and Vicinity has made strides in recent years in establishing and expanding sustainability programs, including renewable energy generation, recycling, community gardens, and stormwater management. These efforts are most concentrated and well-documented within the City of Bowie, which is guided by its own Sustainability Plan and Climate Action Plan, and also manages its own recycling, waste, and sewage.
The City of Bowie has made an effort to expand sustainable building design and renewable energy infrastructure in accordance with the plans above. In addition to the four nonresidential solar arrays seen in Map 72. Sustainability and Environmental Features in the Master Plan Area, approximately 1,514 houses in City of Bowie have solar panels as of 2018.14
Leadership in Energy and Environmental Design (LEED) is a global rating system for green building. LEED provides a framework for the development of healthy, efficient, and low-impact buildings of all kinds. LEED-certified buildings present a range of benefits, including promoting the health of residents, workers, and visitors due to environmental quality standards, lowered maintenance costs, and reduced energy and water usage. There are currently at least seven LEED-certified businesses (hotels, retail, industrial buildings, and office spaces) in the master plan area. This includes the City of Bowie Park Maintenance Facility on Mitchellville Road. The City of Bowie reports 13 LEED-certified buildings within municipal boundaries as of 2018.15
15 Ibid. Plan 2035 envisions sustainability as a pillar of future planning and development in Prince George’s County. The plan defines sustainability as “meeting the needs of present generations without compromising the ability of future generations to meet their needs.” Sustainability is key to the health of residents, the survival of plants and animal species, and a vibrant local economy.
While many sustainability related initiatives in the master plan area are City of Bowie programs, BowieMitchellville and Vicinity is included in Countymanaged sustainability and conservation initiatives, such as the Clean Water Partnership and special conservation areas.
CLEAN WATER PARTNERSHIP (CWP)
The Clean Water Partnership program is a community-based public private partnership (CBP3) between Prince George’s County Department of the Environment and Corvias Group. The initiative began in 2014 as an innovative way to address the County’s challenges with federal stormwater regulatory compliance. The partnership includes a stormwater compliance program where faith-based and nonprofit organizations can take advantage of incentives to allow small stormwater retrofit projects on their properties. The CWP includes a procurement program to engage local, small, minority, and women-owned businesses in implementing stormwater management projects. The program also engages schools in educational programming.
Several stormwater management projects have been conducted or are in planning stages in BowieMitchellville and Vicinity as part of the CWP, including public ponds, stream restoration, wet pond excavation, and stormwater conceptual plans. As of January 2020, the Prince George’s County Planning Department reports 13 active projects within the master plan area and, according to the CWP, many others are in the planning phase. Sites include the Presbyterian Church of Bowie, Tall Oaks High School, and Woodmore Elementary School—which is one of eight schools in the County selected to receive a new outdoor classroom as part of the program’s Treating and Teaching Program.
Source: The City of Bowie Planning and Community Development Department.
14 “City of Bowie State of the Environment Report.” 2018. Department of Planning and Community Development. https://www. cityofbowie.org/ArchiveCenter/ViewFile/Item/2453.
Figure 75. Solar Energy Projects in City of Bowie (2016–2019)
BOWIE SUSTAINABILITY PLAN (2016)
Adopted in 2016, the Bowie Sustainability Plan outlines objectives and actions to promote environmental sustainability. A wide range of themes are covered, including transportation, health and wellness, jobs and business, and energy and climate. City of Bowie publishes a Sustainability Plan Update each year to report on the city’s progress toward achieving plan objectives. Some highlights from the 2019 update include:
• The city recycled 9,175 tons in 2018.
• City renewable energy systems now equal 82 KW total. Annual generation is about 98 MW hours.
• Green Bowie Business Certification Program grew to 10 certified green businesses.
• Opening of a community garden with plots available for sale to residents.
• Native tree planting rebate program and tree planting workshop held.
• A bike rack inventory, including the installation of four new bike racks.
• Engagement and educational events, such as a rain barrel sale and “bayscaping” workshop, and a Lightbulb Exchange program.
The full 2019 plan update is available at: https:// www cityofbowie org/DocumentCenter/
SPECIAL CONSERVATION AREAS
These areas, designated in the 2005 Approved Countywide Green Infrastructure Plan, are deemed to be of special countywide significance and in need of ecological preservation. The Prince George’s County Planning Department’s data on these conservation areas was last updated in 2007.
The Belt Woods Natural Environmental Area
The Belt Woods Natural Environmental Area is a special conservation area currently owned by the State of Maryland and managed by the Western Shore Conservancy. Belt Woods has ecological features of great importance not only to the County, but to the wider region, the nation, and beyond. According to the Trust for Public Land, “some of the deepest, richest soils in Maryland and the last stand of virgin hardwood forest on the Atlantic coastal plain” can be found at Belt Woods. Additionally, the site is recognized internationally as a critical nesting site for neotropical songbirds.16 Belt Woods is recognized by the National Park Service as a national natural landmark.
The 2017 Approved Prince George’s County Resource Conservation Plan: A Countywide Functional Master Plan stresses that development surrounding Belt Woods must be highly sensitive to the protection of the area’s flora and fauna.
Patuxent River Corridor
The Patuxent River Corridor is known as one of the most important greenways in the State of Maryland. Since the passage of the Maryland Patuxent River Watershed Act in the 1960s, preservation of the ecosystems lining the Patuxent River has been a mandate for several counties in the state, including Prince George’s County. One of the key actors in the protection of the Patuxent River includes the Patuxent River Commission, formed in 1984, the commission produces an annual action plan that includes immediate and long-term strategies to improve the river’s ecosystem. The County is an important stakeholder in implementing the action plan give its location and because parts of the corridor are owned by M-NCPPC. Other parts are owned by the Maryland Department of Natural Resources. Parts of the corridor are owned by M-NCPPC, while others are owned by the Maryland Department of Natural Resources.
In Bowie-Mitchellville and Vicinity, the Patuxent River Corridor runs through the east edge of the master plan area, designated as Rural and Agricultural preserve area, where development is discouraged, and outside the public water and sewage service area.
The Bowie-Mitchellville and Vicinity Master Plan Staff Preliminary Environmental Existing Conditions Report, completed in January 2020, offers further analysis of environmental conditions in the master plan area, including watersheds and water quality, the 100-year floodplain, soil information, impervious surfaces, and noise, air, and light pollution.
16 Trust for Public Land. https://www.tpl.org/our-work/belt-woods.
• Prince George’s County Planning Department
Discussion of Challenges and Opportunities
ACCESS TO PARKS AND GREEN SPACE
Bowie-Mitchellville and Vicinity presents excellent access to parks and green space for residents, as demonstrated by the high percentage of green space per capita, and the multitude of parks, trails, and natural preserves in the master plan area. A very high percentage of residents can access parks and open space via car, but considerably fewer have easy access by foot or by bike. This relates to the broader challenge in the master plan area of automobile dependence (discussed at greater length in the Transportation and Mobility section). Reliance on the automobile to reach outdoor space presents a challenge to health of communities in the master plan area. Expanding pedestrian and biking infrastructure and considering park access in future residential development in focus areas may help encourage more outdoor activity and access for residents.
AGRICULTURE AND FRESH FOOD ACCESS
The master plan area has many assets related to access to fresh food, including farms in and nearby the area that sell locally, and the presence of two farmers markets. The City of Bowie has also made progress toward its food sustainability goals by establishing a community garden and has plans to establish other local agricultural sources such as vertical farms/food forests. However, Bowie-Mitchellville and Vicinity has low access to fresh and healthy food by foot or by bike, with less than a tenth of residents living within a 10-minute walk of a supermarket. Future mixed-use planning that concentrates residential and commercial uses is an opportunity to encourage more active means of transportation for resident food needs, while supporting the master plan area’s larger objectives to encourage healthy lifestyles and lessen environmental impact.
LOW SUPERMARKET ACCESS AREAS (LSAs)
Identified low supermarket access areas may present an opportunity to improve health outcomes through better access to healthy food, while bringing new retail to key corridors or nodes in the master plan area, particularly the BSU/MARC Station area and Old Town Bowie which
have limited nearby fresh food options. These nodes make up the southern portion of a large LSA, which presents an opportunity to provide needed food sources.
SENIOR POPULATION
The growing senior population in BowieMitchellville and Vicinity presents both challenges and opportunities. One opportunity is the high concentration of senior living facilities and services in and around the Bowie Town Center, which can facilitate aging in place for older residents, and allows for more concentrated services and programming. One challenge for future planning efforts includes that of creating multi-generational centers to fulfill the changing needs and demands of aging adults, while addressing the needs of a broader range of residents.17
SUSTAINABILITY WITHIN AND OUTSIDE OF CITY OF BOWIE
City of Bowie monitors progress toward environmental sustainability goals, and has a Green Team devoted to carrying out these goals. Planning areas outside of the City of Bowie do not have the same degree of local data and monitoring of progress toward these objectives. Conversely, residents and businesses within City of Bowie may not qualify for certain environmental incentives and rebate programs through the County (and vice versa). For example, City of Bowie residents may participate in programs such as the Tree-bate rebate program for planting trees, in addition to other sustainability programs such as those listed under “Bowie Sustainability Plan” on page 204.18 Conversely, the County’s Rain Check Rebate Program reimburses applicants for the installation of approved stormwater management practices, but is not available within City of Bowie, which manages its own stormwater.19 Coordination between City of Bowie and the County presents an opportunity for more effective goal-setting and tracking of progress toward environmental aims.
17 As a case study, see the Northtown Branch of Chicago Public Library, which features senior living and programming: https://www.marketwatch.com/story/boomers-are-reinventing-retirement-housing-imagine-galleries-walkability-and-multi-agecommunities-2019-05-22
18 Learn more about the Tree-bate program at: https://www.cityofbowie.org/treerebates
19 See the Chesapeake Bay Trust: https://cbtrust.org/grants/prince-georges-county-rain-check-rebate/.
Bowie-Mitchellville and Vicinity Master Plan: Existing Conditions Report
2.8 Public Facilities
Does Bowie-Mitchellville and Vicinity have the public facilities needed to serve its current population?
This section examines public facilities in the Bowie-Mitchellville and Vicinity master plan area. Community facilities may be spaces for learning and social gathering like libraries and community centers; or the infrastructure that makes communities safe and healthy, like fire and police stations, hospitals, and health clinics; schools too, are important community facilities.
This section asks: Does Bowie-Mitchellville and Vicinity have the public facilities needed to serve its current population? In anticipation of population growth, will these public facilities meet the needs of future generations?
All types of public facilities in Bowie-Mitchellville and Vicinity are concentrated in older existing communities, particularly within the City of Bowie. This means that these areas The City of Bowie and
older established residential communities have better access to community these facilities of all types.
This poses a challenge for new development, which is largely of lower density and taking place outside of existing residential communities, mostly along the Church Road corridor and east of US 301. These Low-density new residential areas outside of the City of Bowie, in particular along the Church Road corridor and east of US 301, have relatively less access to community facilities than residents of in older communities the City of Bowie.
COVERED IN THIS SECTION:
• Community Infrastructure, libraries, community centers, fire stations, and police beats
• Hospitals and health clinics
• Public schools
Source: M-NCPPC.
South Bowie Community Center
Source: GIS Data Catalogue, Prince George’s County Planning Department.
74. Library Access in the Bowie-Mitchellville and Vicinity Master Plan Area
George’s County
Source: GIS Data Catalogue, Prince George’s County Planning Department.
Community Infrastructure
LIBRARIES AND COMMUNITY CENTERS
The master plan area is home to two libraries, seen in Map 74. Library Access in the Bowie-Mitchellville and Vicinity master plan Area. This map displays the areas accessible within 10 minutes by bike and 10 minutes by car for the libraries in the master plan area.
Examining the map above, we find that the City of
Bowie has the best access to libraries, with much of the city able to access a library within 10 minutes by bike. Communities outside of the City of Bowie have good access to libraries by car.
There are similar levels of access for community centers in the Bowie-Mitchellville and Vicinity master plan area, where most of the City of Bowie and older
Map 75. Community Center Access in the Bowie-Mitchellville and Vicinity Master Plan Area
Largo/Perrywood/ Kettering Community Center
Community Center Access
Community Center
Community Center 10-Minute Walkshed by Bicycle Focus Area
Community Center 10-Minute Walkshed by Car
City of Bowie
Source: GIS Data Catalogue, Prince George’s County Planning Department.
existing residential communities have good access to the three community centers in the master plan area. Most residents of these areas are within a 10-minute bike ride of a community center and nearly all residents of the area are within a 10-minute car ride of the community centers. This is by design—community centers are located in areas where there is a critical mass of population, such as Bowie.
HEALTH AND SAFETY
Map 76 examines the distribution of Fire Stations in Prince George’s County and the master plan area. Here, we examine the spatial coverage of the master plan area within five- and seven-minute travelsheds by vehicle, from the fire stations. The target response travel time for emergency services is defined by the
Ternberry
Map 76. Fire Station Travelsheds in Prince George’s County and Bowie-Mitchellville and Vicinity Master Plan Area
Source: GIS Data Catalogue, Prince George’s County Planning Department.
National Fire Protection Association guidelines as 320 seconds, or 4 minutes. The Prince George’s County Fire/EMS Department (PGFD) has set a maximum of five minutes as the target time for emergency services to arrive to nonresidential areas. Prince George’s County strives to ensure that all residential emergency services arrive within a maximum of seven minutes.
As with community centers and libraries, we find that the City of Bowie is better covered within these fourand seven-minute travel areas than areas outside of the City of Bowie in the master plan area. As a result of this discrepancy, the fire department has identified three potential sites for new fire stations within the master plan area, all three in the Church Road corridor.
Source: GIS Data Catalogue, Prince George’s County Planning Department.
The map above examines the coverage of Prince George’s County and the master plan area by police beats, calculated using the center point of each police beat. As with fire stations, four- and seven-minute travel distances are used here.
200 • Prince George’s County Planning Department
As discussed above, the City of Bowie is better covered by police beats, with large sections of the master plan area—in the Church Road corridor and east of US 301—poorly covered by these Police Beats.
Map 77. Police Beats in Prince George’s County and Bowie-Mitchellville and Vicinity Master Plan Area
Anne Arundel County
Prince George’s County
The City of Bowie and older established residential communities have better access to community facilities of all types.
Healthcare Facilities
HOSPITAL ACCESS
According to surveying conducted by the Pew Research Center, the average travel time by car to a hospital is about 12 minutes for residents of suburban areas and 17 minutes for residents of rural areas.1
There are no full-service hospitals located within the master plan area. However, the Bowie Health
Clinic (University of Maryland Bowie Health Campus) in the Bowie Local Town Center is able to provide routine care and has a small emergency room, so it is included in the analysis above. Nearly all residents of the master plan area reside within the 21-minute threshold that is the national average for hospital access in suburban areas.
1 Onyi Lam, Brian Broderick and Skye Toor. “How far Americans live from the closest hospital differs by community type.”Pew Research Center. https://www.pewresearch.org/fact-tank/2018/12/12/how-far-americans-live-from-the-closest-hospitaldiffers-by-community-type/
Source: M-NCPPC. University of Maryland Bowie Health Campus
Map 78. Hospital Access and EMT Travelshed in Prince George’s County and Bowie-Mitchellville and Vicinity Master Plan Area
Source: GIS Data Catalogue, Prince George’s County Planning Department.
Bowie-Mitchellville and Vicinity Master Plan Area
or More 0–80% 80–95% 95–120% 120% or More
Schools
ENROLLMENT
Between 2010 and 2018, the utilizations of public schools in Prince George’s County have diverged, with fewer schools within Prince George’s County Public School’s (PGCPS) target utilization range of 80 to 95 percent of state rated capacity (SRC). In particular the number of schools with utilizations above 100 percent has grown significantly, especially at the middle school level.
The maps on the following pages illustrate the utilization of PGCPS schools across the County. Bowie High School is one of only three high schools in the County within the target utilization range of 80 to 95 percent.
Map 81 examines the change in number of schoolaged children by high school attendance area in Prince George’s County. The Bowie High School attendance area has seen a decline of about 1,500 students between 2010 and 2018, the last year for which census
data is available. Adjacent high school attendance areas have seen similar patterns, with substantial declines in the number of school-aged children living within them.
The maps on the following pages examine the utilization rates of schools, which have attendance area boundaries overlapping the master plan area or are in the general vicinity of the master plan area. School utilizations are indicated by the color of their labels.
With the exception of three elementary schools, all schools in Bowie-Mitchellville and Vicinity are either within PGCPS’s target utilization range of 85 to 100 percent or below 85 percent. A utilization rate below 85 percent is not considered desirable as it reflects underenrollment and a suboptimal allocation of resources. This indicates that there is substantial opportunity to balance utilization rates across elementary schools within the master plan area. PGCPS is undertaking a comprehensive boundary study to address these
Source: Prince George’s County Public Schools.
High School Utilization Rate High School Attendance Areas Under-Utilized (less than 80%)
Source: Prince George’s County Public Schools. Map 79. High School Utilization Rates (2019–2020)
204
(90-120%) Optimum Utilization (80-95%)
Prince George’s County Planning Department
Vicinity
Area
Map 80. Absolute Change in High School Utilization Rates (2010–2019)
High School Utilization Rate High School Attendance Areas
(less than 80%)
City of Bowie Master Plan Area
Source: Prince George’s County Public Schools.
City of Bowie
Bowie-Mitchellville and Vicinity Master Plan Area N5 miles
Map 81. Change in School-Aged Children by High School Attendance Area (2010–2018)
206 • Prince George’s County Planning Department
and Vicinity Master Plan Area City of Bowie
Source: ACS 5-Year Estimates.
Bowie-Mitchellville
77. Elementary School Utilizations of Public Schools Serving the Master Plan Area
Source: Prince George’s County Public Schools.
78. Middle and High School Utilization of Public Schools Serving the Master Plan Area
Source: Prince George’s County Public Schools.
Figure
Figure
County Public Schools. Map 82. Elementary School Utilization of Public Schools Serving the Master Plan Area
Source: Prince
George’s
Prince George’s County Imagine Foundations
School, K-8
Pointer Ridge ES
Northview ES
Heather Hills ES
Whitehall ES
Meadowbrook ES
Kenilworth ES
Yorktown ES
Perrywood ES
Kingsford ES
Woodmore ES Tulip Grove ES
Highbridge ES
Glenn Dale ES
Rockledge ES
Map 83. Middle School Utilization of Public Schools Serving the Master Plan Area Middle
Source: Prince
George’s County Public Schools.
Samuel Ogle MS
Benjamin Tasker MS
Thomas Johnson MS
Robert Goddard Montessori, K-8
Imagine Foundations Charter School, K-8
Kettering MS
Thomas G Pullen Arts Focus School, K-8
Ernest Everett Just MS
1 mile City of Bowie
Map 84. High School Utilization of Public Schools Serving the Master Plan Area
Source: Prince
County Public Schools.
George’s
Anne Arundel County
Prince George’s County
Bowie HS
Largo HS
International HS Largo
Duval HS
Academy of Health Sciences HS
Dr Henry A Wise HS
Tall Oaks Vocational HS
Charles Herbert Flowers HS
N 1 mile
City of Bowie
challenges in the master plan area and the County as a whole (anticipated to begin in 2020).
Maps 82–84 examine utilization rates in elementary, middle, and high schools within the vicinity of the master plan area. All schools with attendance area boundaries overlapping the master plan area are included. Compared to elementary schools, middle and high schools are relatively better utilized, with three middle schools falling within PGCPCS’s target utilization range of 85 to 100 percent of SRC. With the exception of Thomas Johnson MS, all other middle schools are utilized below 85 percent, suggesting issues of persistent under-enrollment may exist in and around the master plan area.
Three of seven high schools within the vicinity of the master plan area for which we have data are utilized between 85 and 100 percent, PGCPS’s target utilization range. Bowie High School falls within this range.
Discussion of Challenges and Opportunities
Across facilities, areas seeing residential development in the master plan area have comparatively less access to these facilities than older residential communities. Should the County seek to increase residential densities in these areas, additional public facilities may be required. The fire department has begun this process, identifying three potential sites for new stations.
Access to public facilities in the City of Bowie and older residential areas within the master plan area is very good, with the large majority of residents of these areas living near a library or community center and within the coverage areas of fire stations and existing police beats.
Nevertheless, most parcels in the master plan area have been developed to their zoning envelopes and the population in the master plan area is projected to increase only modestly through 2024.
Yorktown Elementary School
Source: M-NCPPC.
Appendix Section 3
Appendix A. Glossary of Terms
ABSORPTION
The rate at which newly built space in a given area is either leased or sold during a given time period.
ACTIVE TRANSPORTATION
Any form of getting around that is humanpowered, such as walking, rolling, or cycling. Active transportation contributes to positive health outcomes, as well as to environmental sustainability by reducing the use of automobiles.
AREA MEDIAN INCOME (AMI)
AMI represents the midpoint in the distribution of household incomes within a certain geographic region, such as a city, county or metropolitan statistical area. The United States Department of Housing and Urban Development (HUD) publishes annual AMI levels for regions, adjusted for family size. The HUD-provided AMI is used to determine applicants’ eligibility for both federally and locally funded housing programs where participation is dependent on income levels.
BIG-BOX-RETAIL
A big-box retailer is a retail store that occupies an enormous amount of physical space and offers a variety of products to its customers. These stores achieve economies of scale by focusing on large sales volumes.
COMPOUND ANNUAL GROWTH RATE (CAGR)
A way to look at accumulated growth on an annual basis within a defined period of time, as opposed to simple growth, which measures total growth over a defined period of time.
CUL-DE-SAC
A street or passage that is closed at one end.
HOUSING-COST BURDEN
& EXTREME HOUSING-COST BURDEN
HUD defines housing-cost burden as households that pay more than 30 percent of their monthly income on gross housing costs such as rent, utilities, mortgage payments, and/or homeowners/rental insurance, and as a result, may have difficulty affording necessities such as food, clothing, transportation, and medical care. Extreme housing-cost burden refers to households that pay 50 percent or more of their monthly household income on gross housing costs, often leaving them with very little to cover remaining expenses. Both renters and homeowners can experience housing cost-burden.
DELIVERY
The completion of a new building within a given market.
DEMAND
The amount of goods or services a consumer wants to purchase within a market during a specific time period. For example, a city’s multifamily demand refers to how many people want to rent or purchase apartments in that city.
DENSITY
A measure of the intensity of a given land use, usually measured as the ratio of a particular land use per given area of land. For example, a neighborhood may have a maximum residential density of five residential units per acre, or a downtown may have a high density of office buildings, if office buildings are the predominate land use within the downtown.
DEVELOPER RETURN
The minimum financial return required by a developer to complete a project.
DRIVESHED
A driveshed is the area encompassed by a driving distance (a 10-minute drive, or a defined distance) from a single location. They may be drawn as perfect circles, but in practice drivesheds have irregular shapes because they cover the actual distance driven, not the straight-line distance.
ENTERTAINMENT DISTRICT
An arts district with a high concentration of movie cinemas, performance theaters, or other entertainment venues that may either be officially designated by local governments through zoning regulations or by public and private investment in urban design and branding.
EUCLIDEAN ZONING
An approach to zoning in which a city, town, or other geography is divided into areas in which particular kinds of land uses are permitted. For example, in a commercial zone, only commercial uses would be permitted.
FORECLOSURE
A legal process that transfers the right of home ownership from the owner to the bank or lender after the owner defaults on their mortgage payments. Once the owner receives a notice of default, the owner has an opportunity to make up the missed mortgage payments, get out of default, and continue making monthly payments before the bank officially seizes ownership of the home.
GREENFIELD
An undeveloped site or parcel that is either used for agriculture or landscape design, or otherwise undeveloped. Greenfields are typically sites earmarked for urban development.
GREAT RECESSION
An estimated 18-month period of national economic downturn that is widely considered to be the worst U.S. economic crisis since the Great Depression of the 1930s. Between late 2007 to 2009, the Great Recession had severe and extremely adverse impacts on the United States’ economy, including a loss of nearly $8 trillion of stock value, an unemployment rate that rose to a peak of 10 percent in October 2009, a home foreclosure rate that increased by 120 percent from 2007 to 2008, and a $9.8 trillion loss in American wealth due to stark declines in home values and retirement savings.1
INFILL
The repurposing of vacant or underutilized land in established neighborhoods to prepare these sites for redevelopment or new development in an effort to increase urban density and foster economic growth. Infill development is a key strategy for helping cities revitalize neighborhoods with many vacant lots, and is also an important way to encourage density.
MARKET-RATE MULTIFAMILY APARTMENTS
An apartment building that has no rent restrictions, allowing the landlord to rent the housing unit at the maximum amount the local market can withstand.
MASTER-PLANNED DEVELOPMENT
A large-scale residential neighborhood developed by private developers who decide the recreational and commercial amenities provided as part of the residential neighborhood, such as swimming pools, lakes, parks, restaurants, and retail stores. Some master-planned developments include additional facilities such as schools, office space, large shopping centers, and hotels.
NATURALLY OCCURRING AFFORDABLE HOUSING (NOAH)
Housing that is priced by market forces at levels that are affordable to low-income residents. Housing is traditionally considered affordable if the total housing cost (rent or mortgage plus utilities) for the household represents no more than 30 percent of its income. NOAH housing is typically found in older properties, and often makes up a significant portion of a jurisdiction’s affordable housing stock, in addition to publicly-subsidized housing.
PRODUCT
The available supply of a residential or commercial asset type, e.g., new housing product refers to newly constructed apartments, townhomes, and singlefamily homes.
RENTABLE SQUARE FEET
The total square footage of a building a tenant leases from a landlord.
1 Merle, Renae “A Guide to the Financial Crisis—10 years later ” The Washington Post 10 September 2018
RETAIL GAP
The gap between demand and supply within a given market that occurs when residents’ demand for goods exceeds available supply, resulting in consumers leaving the market’s retail area to shop elsewhere.
SENIOR-LIVING MULTIFAMILY APARTMENTS
An apartment building that is age-restrictive, typically designed for senior residents aged 55 and older. Seniorliving apartment buildings can be either independent living communities or assisted care communities. Independent living communities are catered to seniors who do not require assistance with daily activities or 24/7 medical care. Assisted living communities are catered to seniors who require assistance with daily activities such as medication, eating, and bathing.
STOCK
The existing inventory of a residential or commercial asset type, e.g., all of the office buildings in a neighborhood represent that neighborhood’s office stock.
SUPPLY
The amount of goods or services that are available to consumers within a market at a given price during a specific time period.
TRAVELSHED
A travelshed is the set of all the destinations that can be reached from a location within a specified time. Travel sheds are valuable both for visualizing and analyzing access to key services and destinations such as schools, transit stations, hospitals, community centers, parks, retail hubs, and so forth. May be referred to according to the mode of travel (i.e., walkshed).
TRANSIT-ORIENTED DEVELOPMENT (TOD)
TOD includes a mix of commercial, residential, office, and entertainment centered around, or located near, a transit station. Dense, walkable, and mixed-use development near transit attracts people and adds to vibrant, connected communities.
UNMET SPENDING POTENTIAL
An area’s unmet spending potential represents the total dollar value of the retail gap, demonstrating how much money consumers are spending on retail outside of their area. The total dollar value of unmet spending potential represents the amount of money the given market would likely receive if its retail supply met demand.
WHITE FLIGHT
This term refers to the large-scale migration of White city dwellers out of urban areas, particularly those with significant racial minority populations. This term arose during the 1950s and 1960s, when many American cities saw the exodus of White residents into developing suburbs.
WALKSHED
A walkshed is the area encompassed by a walking distance (a 5-minute walk or a defined distance mile) from a single location. Although they may be drawn as perfect circles, in practice walksheds have irregular shapes because they cover the actual distance walked, not the straight-line distance.
VACANCY
The amount of space that is vacant or unoccupied within a market at a particular time.
ZONING
A planning tool used primarily by local governments that helps regulate a building’s use, size, and shape. Other factors regulated can also include parking, signage, accessory structures, and landscaping.
Appendix B. Overview of Selected Recent Plans
2017 PRINCE GEORGE’S COUNTY RESOURCE CONSERVATION PLAN
This plan aims to coordinate the County’s planning efforts with regard to green infrastructure, and urban and agricultural conservation, in alignment with the goals of the Plan 2035 General Plan. The document contains three complementary countywide functional master plans: the Green Infrastructure Plan (GI), Agricultural Conservation Plan (ACP), and Rural Character Conservation Plan (RCCP).
The GI Plan updates the approved 2005 GI Plan. It updates the County’s GI network map, and stipulates that gaps in this network should be addresses either in future sector and master plans or permits for development where gaps exist. The GI Plan emphasizes regulatory issues such as water quality, air, tree canopy, encourages green buildings and construction, expands traditional green infrastructure to include considerations related to climate change and sea level rise.
The ACP Plan updates the 2012 Adopted and Approved Priority Preservation Area Functional Master Plan. It includes policies and strategies for agricultural and forestry practices in the County, and also makes technical adjustments to the existing Priority Preservation Area (PPA) map and Sustainable Growth and Agricultural Preservation Act (SGA) tier map. The ACP Plan places an emphasis on food systems, especially the need to provide fresh food to urban communities through urban agricultural and local food systems.
The RCCP builds upon the vision and zoning ordinances set by the Plan 2035 general plan by establishing more detailed design standards for preserving rural and agricultural character in the County, as well as strategies for preserving viewsheds. The RCCP emphasizes Special Roadway corridors, and the Mount Vernon viewshed.
The components of this plan are important to consider as the master planning process considers the rural and agricultural areas in Bowie-Mitchellville and Vicinity, as well as the network of green infrastructure that connects the various parts of the master plan area.
BOWIE SUSTAINABILITY PLAN (2016)
This 10-year plan builds upon Bowie’s Climate Action Plan, and was a collaboration between the City of Bowie and M-NCPPC. Community engagement was central to the development of the plan: over 1,000
residents were engaged through 14 events, and an outreach campaign called ImagineBowie. The plan makes short-, mid-, and long-term recommendations on sustainability structured around key themes: jobs and business, food and wellness, nature and environment, communication, community, education, transportation and mobility, water, composting and recycling, energy, and climate.
The plan’s strategies include a combination of actions for everyday residents or businesses to take to contribute to sustainability, and infrastructural and programmatic strategies for the public sector. The plan sets targets for reducing greenhouse gas emissions by 20 percent by 2026, and increasing renewable energy generation in Bowie, including through such public programs as community solar programs for renters and low income residents, and a possible renewable microgrid project. Additionally, the plan calls for other strategies that are germane to the current master planning process, including more amenities in public spaces, and expansion of existing biking and hiking trail networks. The plan also operates in tandem with other programs and plans, and calls for updates, to or adoptions of, related plans including the Public Art Master Plan, a Watershed Plan, and the Climate Action Plan.
PLAN PRINCE GEORGE’S 2035 (2014)
An update to Prince George’s County’s General Plan, Plan Prince George’s is the vision for future growth in the entire county. It lays out six main strategies, several of which are relevant to Bowie, including concentrating future growth in existing communities; connecting “our neighborhoods and significant places” by investing in sidewalks, trails, and transit; and protecting natural resources by reducing reliance on driving. It identifies two locations in Bowie as “Local Centers” where infill development should be encouraged, Bowie State University and Bowie Regional Center, and emphasizes improving pedestrian and bike connections to those places. The plan requires all road and streetscape improvements in Local Centers to improve travel conditions for pedestrians, bicyclists, and transit ridership. There are also recommendations about converting existing arterial streets, such as MD 197 (Collington Road) in Bowie, to multiway boulevards that improve pedestrian and bicycle connectivity, and to rebuild local streets as Complete Streets while coordinating with local schools to improve safety. While the plan does not make any major transit recommendations for
Bowie, it does identify bike-sharing and transportation demand management as two programs that should be introduced to Local Centers.
BOWIE STATE MARC STATION SECTOR PLAN (2010)
The Prince George’s County Council approved this plan, which envisions a new “college town” community center adjacent to Bowie State University (BSU) and the Bowie State MARC Station with a mix of housing, shopping, an office and research campus, and new university buildings. Included in its recommendations are relocating the Bowie State MARC Station slightly north, expanding the parking lots, and creating a bus hub for local and regional bus services, including a proposed shuttle between the MARC station, Old Town Bowie, and the Bowie Regional Center. It also includes a new vehicular/pedestrian passageway beneath the train tracks connecting the new town center to the university, and a pedestrian overpass over the train tracks that would provide a second connection. A new street grid in the college town would provide a continuous network of walking and bicycling facilities within the community, and to a new trail between Bowie State University and Old Town Bowie. In response to comments from residents and students that they felt unsafe walking and bicycling in the area, the plan also recommends new bike facilities along Race Track Road and Jericho Park Road.
BOWIE HERITAGE TRAIL REPORT (2009)
The City of Bowie, working with the Metropolitan Washington Council of Governments, commissioned this report investigating a new trail connection in the northern part of the city. The new trail would run along a series of existing streets and public rights-ofway between Old Town Bowie, Bowie State University, both of the city’s MARC stations, and several parks and residential areas. A key part of the trail would be two plazas along the route next to the Bowie Railroad Museum and the end of 12th Street, which would provide opportunities for placemaking, interpretive signage, or other community amenities.
PRINCE GEORGE’S COUNTY MASTER PLAN OF TRANSPORTATION (2009)
The Master Plan of Transportation is Prince George’s County’s official vision for pedestrian, bicycle, transit, and highway infrastructure, and includes all of the projects the County intends to build in the coming decades. The 2009 plan’s goals are to reduce congestion and vehicle miles traveled, to address major highway and transit projects, and to reconcile
• Prince George’s County Planning Department
recommendations from 31 neighborhood plans, including the Bowie-Mitchellville and Vicinity Master Plan. Key to this plan for Bowie are policies to promote pedestrian and bicycle access to schools, parks, recreation areas, commercial areas, and employment centers, and to embrace Complete Streets design. The plan recommends several significant pedestrian and bicycle projects around Bowie, including extending the Washington, Baltimore and Annapolis Trail across the Patuxent River into Anne Arundel County, constructing the Collington Branch Stream Valley Trail between MD 214 (Central Avenue) and Western Branch, and a new trail through Old Town Bowie. It also recommends new bike lanes or side paths on several major roads, including MD 197 (Collington Road), MD 450 (Annapolis Road), Race Track Road, Jericho Park Road, Church Road, Mount Oak Road, Mitchellville Road, and Health Center Drive. There are also several large road projects, including widening MD 197 from two to four lanes between Jericho Park Road and the Baltimore-Washington Parkway.
2006 BOWIE AND VICINITY MASTER PLAN
The last comprehensive plan for the master plan area was completed nearly 15 years ago for the 2006 Bowie and Vicinity Master Plan.
In following the 2002 Prince George’s County General Plan, this plan lays out a tiered vision of development along rural and developing tiers and designates a regional center at the intersection of US 301 and US 50.
The plan outlines a thorough vision for centering future development around the Regional Center–which remains a planning opportunity area today. The plan recognizes the potential for this center to serve as a regional activity center and transit hub, given its prime location between Annapolis, Baltimore, and Washington, D.C., but also notes the challenge of US 50 as a barrier that divides the center and is prohibitive to pedestrian friendliness. The plan envisions the regional center as a multimodal transit hub.
The plan places emphasis on Old Town Bowie, including the establishment of a development district overlay zone, design standards, table of uses, and other guidelines for future development of Old Town Bowie.
The 2002 plan also calls for a possible future Community Center at the Bowie State MARC Station and BSU, including redevelopment of the station parking lot and surrounding properties, and recommends a dedicated sector plan to this end (which came to pass in the MARC Station Plan, described below).
The plan’s Development Pattern element details mixed use activity centers at Old Town Bowie, Bowie Main Street, West Bowie Village, Pointer Ridge Mixed-Use Activity Center, and Bowie Regional Center. The Areawide Infrastructure Element outlines numerous recommendations, including the development of green infrastructure and new parks, the establishment of high value residential development and senior housing, improvement of existing transportation systems, and expansion of public transit.
CITY OF BOWIE TRANSIT SYSTEM ENHANCEMENT STUDY (2006)
The City of Bowie commissioned this study to investigate options for expanding their transit system. Then as now, the city’s transit options consist of two MARC stations with rush hour commuter train service to Washington, D.C. and Baltimore, and a handful of Metrobus routes that connect the city to the New Carrollton Metro Station. These services primarily run during weekday rush hour with limited evening service and no weekend trips. The plan highlighted several populations that are likely to support demand for additional transit service, including a substantial population of adults over 65, children under 18, and zero-car households. All of these populations are generally concentrated in the southern part of the city, near the Bowie Regional Center south of US 50, and west of Collington Road. Noting that 88 percent of surveyed residents said they would use transit more if it were easier to access, the study explored several options for expanding service, including adding frequency and adding new routes within the city or to surrounding communities. It recommended reconfiguring the existing bus service as a series of circulators converging on the Bowie Regional Center, which has not been implemented.
BOWIE AND VICINITY PLAN (2005)
The Bowie and Vicinity Plan sets the community’s land use and transportation vision for the coming years, which is being updated in this plan. The plan’s goal is to encourage transit-oriented and transit-supporting design around the Bowie Regional Center (comprising Bowie Town Center and surrounding shopping, office, and residential areas) and the city’s two MARC stations. In Old Town Bowie, the plan recommends creating an internal street grid in Old Town Bowie to diffuse traffic on MD 450, and redesigning the bridge carrying MD 564 over the train tracks into Old Town Bowie to reduce crashes. New multi-use trails are envisioned between Old Town Bowie and Bowie State University alongside the MARC tracks, along Collington Branch, and around Bowie Town Center. A network of bike lanes would connect the city’s activity centers to surrounding neighborhoods, while bridging major roads like MD 3 (Robert Crain Highway), the MD 3/MD 450 intersection, and MD 214 (Central Avenue). The plan also recommends expanding the city’s transit network, including a Bowie Area Transit Shuttle to serve Old Town Bowie, and to expand local bus service throughout the city, starting with the area around Bowie Regional Center.
Additional plans reviewed as part of this study include:
• Prince George’s County Economic Drivers and Catalysts (2013)
• Prince George’s County Primary Healthcare Strategic Plan (2015)
• Prince George’s County Retail Marketability and Competitiveness Study (2016)
• Bowie State Master Plan (2016)
Appendix C. Bus Service Timetables
Figure 79. WMATA Bus Ridership: Passenger Pick Up (Fall 2019)
Source: WMATA APC system, Fall 2019 weekday averages.
Figure 80. WMATA Bus Ridership: Passenger Drop Off (Fall 2019)
Appendix D. Inventory of Dangerous Pedestrian Crossings
Map 85. Inventory of Dangerous Pedestrian Crossings
Source: Open Street Map, WMATA, M-NCPPC.
Source: GIS Data Catalogue, Prince George’s County Planning Department.
Figure 81. WMATA Bus Ridership: Passenger Drop Off (Fall 2019)
Appendix E. Table of Historic Designations
48
Historic Site (County) 32 An “individual historic resource that is significant and contributes to historical, architectural, archeological, or cultural values” classified in the 2010 Historic Sites and Districts Plan.
Historic Resource (County) 6
Sites or attributes that may be historically significant but are unclassified and not subject to Historic Work Area requirements. Requires Historic Preservation Commission (HPC) evaluation. Historic resources are listed in the County Inventory of Historic Resources
National Register of Historic Places 10 Sites of importance to the history of the community, County, state, or country. These must be nominated by the state for approval by the federal government. Almost every county in the U.S. has at least one National Register of Historic Places property.3
Threatened Historic Site 1 Historic site designated as “threatened” by M-NCPPC.
Roads designated by County Council for historic and/or scenic significance. Criteria for designation is outlined in Section 23 of Prince George’s County code.
20 Sites identified by the County for significance to Mid-century Modern Movement. The County keeps a record of the status of these sites. Some are designated as County Historic Sites, others are not.
Historic Environmental Setting 32 Indicates the areas subject to HPC review in connection to historic sites/ resources. All County historic sites have an associated environmental setting.
Requires Historic Preservation Commission (HPC) review and Historic Area Work permit for any construction on the property. Preservation tax credit available for conservation and restoration work.1 If designated a historic site by the County, in order to get a tax credit, sites must be in good standing regarding permits, and the work must be sensitive to the site’s historic nature. Tax credit may cover 25% of owner expenses.2
HPC evaluation required; Requires historic area work permit, which triggers evaluation to determine if the property should be designated a County Historic Site.
If federally owned, requires comment from Advisory Council on Historic Preservation (Federal) and the Maryland Historical Trust; there may be federal grant and tax credits available.
Sites are tracked and evaluated by HPC staff and monitored on the commission’s Properties of Concern list.
Adjacent development must be evaluated and approved by County. Historic roads are listed in the Master Plan of Transportation. Scenic roads are designated by County Council resolution or master/sector plans.4
Historic site regulations apply to those that are designated as historic sites.
Area is subject to HPC review.
1 See: http://mncppcapps org/planning/publications/PDFs/235/Approved%20Historic%20Sites%20and%20Districts%20Plan pdf
2 Prince George’s County Historic Preservation Commission. 2018. “PRINCE GEORGE’S COUNTY HISTORIC PRESERVATION TAX CREDITS Policies and Procedures.” http://www pgparks com/DocumentCenter/View/670/Tax-Credit-Policies-and-Procedures-PDF
3 “What Is the National Register of Historic Places? - National Register of Historic Places (U S National Park Service) ” n d Accessed April 3, 2020 https://www nps gov/subjects/nationalregister/what-is-the-national-register htm
4 “Approved Historic Sites and Districts Plan ” n d Issuu Accessed March 26, 2020 https://issuu com/mncppc/docs/hsdp_approved_ book_for_web
Designation
African American Historic Community 2
African American Historic Property
Trails Heritage Area
Indicates the boundaries of a site recognized by the HPC as a Documented Historic Community with significance for African American history.
A property recognized by the Prince George’s County Planning Department for significance in African American history. Some are recognized historic sites, some are not.
Designated natural features (cemeteries are not natural features) that must be retained in development for the purposes of conservation (in this case, for historic and scenic reasons). The Planning Department calls this data set non-authoritative and incomplete due to the nature of easements.
9,529 total acres Area included in the Anacostia Trails Heritage Area Management Plan (2001), a functional heritage tourism plan. Includes a network of trails that connect to important historic, cultural, and recreational sites in the County.
Archaeological Sites 38 These properties are subject to archeological investigation to determine any archeological resources on the property.7 If a development is proposed, these sites would be further evaluated to determine if they are significant.
Historic District (County; National Register) 0 From County code: “A historic resource comprised of two (2) or more properties which are significant as a cohesive unit and contribute to historical, architectural, archeological, or cultural values, which has been so classified in the master plan for historic preservation. A historic district includes all property within its boundaries.”
Historic districts may also be recognized by the federal government and included in the National Register.
These communities are not regulated by County historic preservation ordinance. They are recognized “for reference only.”5
Historic Site regulations apply if the site is recognized as such. Otherwise, no known regulations or incentives.
Consultation is required with Planning Department staff for future development at the site.
County code mandates that natural features and buffers that protect historic/scenic sites be retained in development.6
Heritage grants could be available to communities through the state.
Phase 1 archeological survey must be reviewed by Planning Board. Further phases of archeological investigation may be required if there are known historically significant sites on the property. The results of Phase 1 dictate whether there is need for a Phase 2.
County tax credits available for rehabilitation of historic properties within historic districts.
Additional federal tax incentives are available for properties within National Register districts.
Source: GIS Data Catalogue, Prince George’s County Planning Department.
5 See: http://mncppcapps org/planning/publications/PDFs/235/Approved%20Historic%20Sites%20and%20Districts%20Plan pdf
6 See 24-135 01: https://library municode com/md/prince_george’s_county/codes/code_of_ ordinances?nodeId=PTIITI17PULOLAPRGECOMA_SUBTITLE_24SU
7 See 2005 County policy on archaeological surveys here: https://www mncppc org/DocumentCenter/View/423/Guidelines-forArcheological-Review-PDF
Anacostia
1 Albert Smith House 71A-002 9201, Laurel Bowie Road, Huntington South, Old Town Bowie, Bowie, Prince George's County, Maryland, 20720
2 Boyden House 71A-034 6501, Hillmeade Road, Springfield, Bowie, Prince George's County, Maryland, 20720
3 Carroll Chapel
74B-006 1811, Mitchellville Road, Hall, Bowie, Prince George's County, Maryland, 20716 4 Claggett House at Cool Spring Manor
17500, Claggett Landing Road, Heritage Hills, Greater Upper Marlboro, Prince George's County, Maryland, 20774 5 Colbert Family Farm Site 71B-019 9000, Race Track Road, Huntington South, Patuxent Riding, Prince George's County, Maryland, 20715 6 Duvall-Hopkins Store
74B-030 15512, Hall Road, Hall, Bowie, Prince George's County, Maryland, 20721
7 Elliot-Beall House 74B-016b 1600, Heritage Hills Drive, Heritage Hills, Greater Upper Marlboro, Prince George's County, Maryland, 20774 8 Fair Running 71B-015 CLUBHOUSE, Washington, Baltimore & Annapolis Trail, Huntington South, Bowie, Prince George's County, Maryland, 20720
Bowie, Prince George's County, Maryland, 20720
23 Mullikin's Delight and Cemetery
24 Partnership and Cemetery
25 Ryon House
74A-010 2307, Church Road North, Woodmore, Prince George's County, Maryland, 20721
74A-015 Six Flags America Amusement Park, Sonora Speedway, Kolbes Corner, Woodmore, Prince George's County, Maryland, 20721
71B-002-03 13125, 11th Street, Huntington South, Old Town Bowie, Bowie, Prince George's County, Maryland, 20715
26 Sacred Heart RC Church & Cemetery 71A-019 16505, Annapolis Road, Idlewild, Bowie, Prince George's County, Maryland, 20715
27 Seton Belt Barn
28 St. James Chapel
29 Straining House
74A-014 Belt Woods Heritage Conservation Fund Site, Church Road South, Kettering, Prince George's County, Maryland, 20774
71B-002-05 13010, 8th Street, Huntington South, Old Town Bowie, Bowie, Prince George's County, Maryland, 20720
71B-002-01 13005, 7th Street, Huntington South, Old Town Bowie, Bowie, Prince George's County, Maryland, 20720
30 WB&A Electric Railway Bridge 71A-006 Washington, Baltimore & Annapolis Trail, Huntington South, Old Town Bowie, Bowie, Prince George's County, Maryland, 20715
*Threatened site on Properties of Concern list.
Source: GIS Data Catalogue, Prince George’s County Planning Department.
1 Enfield Chase Site
71B-006 4319, Collington Road, Pin Oak Village, Heather Hills, Bowie, Prince George's County, Maryland, 20716 2 Hopkins House 74B-011 100, Queen Anne Bridge Road, Hardesty, Prince George's County, Maryland, 20716
3 Magruder Cemetery
71A-012 4917, Smithwick Lane, Holmehurst, Woodmore, Prince George's County, Maryland, 20720, United States of America
4 Mitchell Cemetery 71B-008 15503, Porsche Court, Hall, Bowie, Prince George's County, Maryland, 20716
5 Noble Strother House
71A-022-04 12500, Fletchertown Road, Huntington South, Springfield, Bowie, Prince George's County, Maryland, 20720 6 William Wells House 74B-016a Heritage Hills, Greater Upper Marlboro, Prince George's County, Maryland, United States of America
7 WB&A Electric Railway Bridge 71A-006 Washington, Baltimore & Annapolis Trail, Huntington South, Old Town Bowie, Bowie, Prince George's County, Maryland, 20715
Source: GIS Data Catalogue, Prince George’s County Planning Department.
1 Belair Mansion and Cemetery 71B-004 12207, Tulip Grove Drive, Collington, Heather Hills, Bowie, Prince George's County, Maryland, 20715
2 Belair Stables 71B-005 2835, Belair Drive, Collington, Heather Hills, Bowie, Prince George's County, Maryland, 20715
3 Bowie Railroad Buildings 71B-002-09 Huntington Railroad Museum, Chestnut Avenue, Huntington South, Old Town Bowie, Bowie, Prince George's County, Maryland, 20720
4 Bowieville 74A-018 601, Bowieville Manor Lane, Leeland, Prince George's County, Maryland, 20774
5 D.S.S. Goodloe House 71A-030 Goodloe House, 9300, Laurel Bowie Road, Huntington South, Jericho Park, Prince George's County, Maryland, 20720
6 Hamilton House 74B-007 16810, Federal Hill Court, Kidwells Corner, Prince George's County, Maryland, 20716
7 Hazelwood 74B-013 18611, Queen Anne Road, Hardesty, Washington, D.C., Prince George's County, Maryland, 20774
8 Melford, Outbuildings & Cemetery 71B-016 17107, Melford Boulevard, Bowie, Prince George's County, Maryland, 20715
9 Pleasant
Source: GIS Data Catalogue, Prince George’s County Planning Department.
Source: Prince George’s County Planning Department.
Source: Prince George’s County Planning Department.
Figure 90. Asset Inventory: Parks
expansion recommended in Formula 2040
by the City of
Appendix H. Bowie-Mitchellville and Vicinity Master Plan Natural Environment Existing Conditions Report
BOWIE-MITCHELLVILLE AND VICINITY MASTER PLAN
Natural Environment Existing Conditions Report August 2020
Table of Contents
Maps
3 Bowie-Mitchellville and Vicinity Known Streams, Known Wetlands, and FEMA Floodplain Delineation 256
Map 4 Green Infrastructure (2017)
Map 5 Location of Special Conservation Areas (SCAs) within the Plan Area
Figures
Tables
Table 1 Watersheds Countywide and within the Master Plan Area 246
Table 2 Water Quality Data by Watershed 249
Table 3 Known Streams, Wetlands and Floodplains within the Master Plan Area* 254
Table 4 Green Infrastructure Network (2017) 258
Table 5 Green Infrastructure Network (2017) 262
Map 11 The 65 dBA Ldn Noise Contour Along the Master Plan Area’s Major Roadways
Table 6 Plan Area Soil Types, Acreages, and Percentages
Table 7 Green Infrastructure Network (2017)
Table 8 Master Plan Area Impervious Surfaces by Watershed (2017)
Table 9 Projected Noise Contours for Major Roadways in the Master Plan Area
PURPOSE OF THE REPORT
The purpose of this report is to provide a compilation of readily available environmental existing conditions information for the Bowie-Mitchellville and Vicinity master plan area. Plan Prince George’s 2035 General Plan (Plan 2035) has designated parts of the northern and eastern portions of the master plan area as part of the Rural and Agricultural Areas policy area. The remainder of the master plan area is within Plan 2035’s Established Communities policy area. The information in this report is intended to be used by Planning Department staff to understand the technical basis for the recommendations and implementable action steps in the Bowie-Mitchellville and Vicinity Master Plan. Publicly available sources of information were used to develop the report’s contents. This information
is general in nature and has not been completely verified. Specific questions regarding individual properties being evaluated should be addressed to the various agencies listed at the back of this report. Additional information on specific properties being evaluated, as well as areas of those properties that are developable and areas required to be preserved, may be obtained from an approved Natural Resource Inventory (NRI). NRIs are prepared in conformance with the Environmental Technical Manual (ETM). Information on NRIs and the ETM is available on the Prince George’s County Planning Department website, www.pgplanning.org.
MASTER PLAN AREA DESCRIPTION
The Bowie-Mitchellville and Vicinity master plan area covers approximately 37,670 acres, or 59 square miles, representing 12 percent of the land area of Prince George’s County. The master plan area is generally contained within the area framed by the Patuxent Research Refuge to the north, MD 193 (Enterprise Road) to the west, Leeland and Queen Anne Roads to the south, and the Patuxent River to the east. US 301 and MD 3 (Robert S. Crain Highway) generally bisects the master plan area from the north to the south, while MD 450 (Annapolis Road), US 50 (John Hanson Highway), and MD 214 (Central Avenue) generally bisect the master plan area from the west to the east (see Map 1). These are some of the major transportation corridors in the area.
The master plan area is located within Councilmanic Districts Four, Six, and Nine and Planning Areas 71A, 71B, 74A, and 74B. It consists predominantly of single-family residential communities with multifamily residential housing mainly near Bowie City Hall and in the Heather Ridge area near the US 301/MD 197 intersection. Some of the residential development was already well established in the Levittown area north of US 50 by 1965. Commercial corridor activity is largely in the hubs along US 301 and US 50, and there is some industrial development in Collington to the south.
Residential development is now concentrated mostly in the area between US 301 and MD 197, on high ground that creates a drainage divide between the
Middle Patuxent River and the Collington Branch/ Horsepen Branch watersheds. The development impacts stream systems in these watersheds because of the high percentage of impervious surfaces and soil compaction that limits infiltration. In many areas, runoff from impervious surfaces enters receiving streams directly or via concrete or metal pipes (see Figures 1 and 6).
Well-drained soils of the Collington-Wist, Marr-Dodon, Annapolis, and Adelphia groups cover nearly 60 percent of the master plan area, concentrated south of MD 450. North of MD 450 there are small pockets of poorly drained Zekiah, and Issue soils associated with streams generally, and there are Whitewater and Issue soils associated with floodplains and other frequently flooded areas near the Patuxent River, Collington Branch stream, and tributaries to Northwest Branch. The southwestern (Collington) portion of the master plan area overlays extensive areas of Marlboro and Christiana clays.
• The master plan area contains properties with previously approved Natural Resource Inventories and Tree Conservation Plans. These should be consulted prior to the preparation of new development applications.
ENVIRONMENTAL INFORMATION AND STATISTICS
The following statistics were derived from a template developed using GIS software to clip information from specified GIS data layers. Unless otherwise noted, most of the GIS data layers are from the 2009 planimetric data capture. Planimetric data capture or planimetric mapping is the process of obtaining information about terrain using an aircraft to fly over an area and record the horizontal position of features such as roads, buildings, and bodies of water on the landscape below.
Watershed Data
The master plan area lies within nine watersheds in the Patuxent River basin: Upper Patuxent River and Horsepen Branch to the north, Northeast Branch to the west, Collington Branch in the center and south, and Middle Patuxent River to the east. Very small portions of the master plan area to the north, west, and south are within the Upper Beaverdam Creek, Folly Branch, Lottsford Branch, and Western Branch watersheds, respectively. The relative acreages of these watersheds are shown in Table 1, while their locations in relation to the master plan area boundaries are illustrated in Map 1.
Figure 1. (Left) Part of a roadway and unshaded surface parking lot near Baysox Stadium; (Right) Stormwater channeled to a stream via a metal pipe Note the potential for siltation of the stream .
Table 1. Watersheds Countywide and within the Master Plan Area
Vicinity Master Plan: Existing Conditions Report
Map 1. Bowie-Mitchellville and Vicinity Plan Area Watersheds
BOWIE-MITCHELLVILLE AND VICINITY MASTER PLAN
The Patuxent River, forming the master plan area’s eastern boundary, is a major tributary to the Chesapeake Bay and one of three main river drainages for Central Maryland (along with the Potomac River to the west and the Patapsco River to the northeast). The Patuxent is the longest and largest river entirely within Maryland and its watershed is the largest completely within the state. US 301, US 50, and MD 214 are three main transportation corridors crossing the southern section of the Patuxent River watershed. The nontidal portion of the Patuxent River Upper watershed is from MD 214 north.
The Patuxent River crosses the highly urbanized corridor between Baltimore and the District of Columbia. Urban runoff, agriculture, and unchecked erosion from rapid development within upstream areas of the watershed in the 1960s and 1970s have contributed to current issues with pollution, sedimentation, and siltation in the river’s downstream areas. Habitat quality has also degraded over time. The Patuxent River is subject to state and federal pollution limits addressing its poor water quality and restoring its ecosystems.
Within Prince George’s County, the Patuxent River falls under three (8-digit, Hydrologic Unit Code) watersheds: Patuxent River Upper, Patuxent River Middle, and Patuxent River Lower. Patuxent River Upper is impaired for chlorides, sulfates, bacteria, and total suspended solids (TSS). Patuxent River Middle is impaired for sulfates and TSS1. Patuxent River Lower is impaired for TSS. Additionally, bay impairments are also listed along the Patuxent River because it is within the Chesapeake Bay Watershed.
Regulatory Pollution Limits in the Patuxent River
When streams and rivers reach certain levels of pollution, the U.S. Environmental Protection Agency (EPA) places them on a national (303d) list of impaired waters and may set standards that must be met to restore water quality. These standards are called total maximum daily loads (TMDLs) and are set statewide by major river basins. TMDLs are a calculation of the maximum amount of a pollutant that a waterbody can receive and still meet water quality standards. Watershed Implementation Plans (WIPs) are then created to improve water quality to meet or exceed the standards.
The EPA established a TMDL for total nitrogen (TN), total phosphorus (TP), and total suspended solids (TSS) for the Chesapeake Bay in 2010. The Patuxent
River basin drains to the Chesapeake Bay; therefore, all three segments of the Patuxent River are subject to the Bay TMDLs. These TMDLs are divided among the relevant jurisdictions within the basin leaving each with certain responsibilities for addressing the issue
Each jurisdiction has also created WIPs to improve water quality to meet or exceed their designated TMDL. Due to stream degradation, the Patuxent River has also been placed on the national list of impaired waters. Separate (nonbay) TMDLs for bacteria and TSS have also been established for the Patuxent River Upper segment.
Portions of the master plan area may be developed over the life of this plan, presenting many opportunities to address the TMDLs as development occurs. Stormwater management requirements current at the time of the development, and the use of environmental site design to the maximum extent practicable, must be incorporated as standard practices to address water quality as development occurs.
The Bowie-Mitchellville and Vicinity master plan area is already making significant efforts to address water quality issues. Compliance with current stormwater management regulations to treat the first inch of stormwater onsite.
1 TSS are fine particles of sediment (soil, biological solids, decaying organic matter) larger than 2 microns, suspended in the water
248 • Prince George’s County Planning Department
Figure 2. A section of the Patuxent River (Middle) near Governors Bridge Road, Bowie (section impaired for TSS and sulfates) .
Water Quality
Forest and tree canopy coverage and the amount and locations of impervious surfaces are the two main elements that impact water quality within a watershed. Tree canopy coverage in the master plan area is relatively high (38 percent), but the amount of imperviousness is also high at 20 percent, implying that more than a quarter of the master plan area’s watersheds might be developed. While the high tree canopy coverage is advantageous, the high imperviousness and compacted soils, especially in the central portion of the master plan area, result in excessive, rapid stormwater runoff into the receiving streams and wetlands. The impact of agricultural lands can also be detrimental to water quality when no protection measures are implemented. These all contribute to the poor and very poor water quality narrative ratings shown in Table 2 as reported in 2003 Biological Assessment and Monitoring of Streams and Watersheds in Prince George’s County
A reassessment done through the 2017 Prince George’s County Resource Conservation Plan showed slightly improved watershed habitat condition ratings for Horsepen Branch (from poor to fair), Upper Patuxent River (from poor to fair), and Middle Patuxent River (from poor to fair) for the stream reach north of MD 214,” with conditions being the same or worse elsewhere.
Aerial photos of the master plan area in 1938 (Figure 3) and 1965 (Figure 4) show the area’s transformation from farm fields, woodlands, and a scattering of residential development, to high imperviousness. The land use change is especially striking in the central core, the western boundary areas, and a network of stream systems—most of which remain.
Most of this land was developed by the 1970s, before the adoption of environmental regulations regarding woodland conservation, stormwater management, or stream, wetland, and floodplain protections. Without these important controls, stream buffers were removed, wetlands were filled, some streams were channelized, and multiple stream crossings were constructed using standard culverts to access more land for development. This process was also accompanied by the creation of large areas of impervious surfaces.
Without the presence of forests and trees to manage stormwater runoff or mimic predevelopment conditions, rainwater is unable to infiltrate into the ground. Instead, the water flows off impervious surfaces during rain events, carrying loose soil, trash, debris, and pollutants such as fuel and oil from vehicles, which it deposits into storm drains
Collington Branch Very Poor Poor
Folly Branch Very Poor Very Poor
Horsepen Branch Fair Poor
Lottsford Branch Very Poor Very Poor
Middle Patuxent River Fair (North of MD 214); Poor (South of MD 214) Poor
Northeast Branch (WB) Very Poor Poor
Upper Beaverdam Creek Very Poor Poor
Upper Patuxent River Fair Poor
Western Branch Very Poor Poor
Source: 2017 Resource Conservation Plan (p.39); 2005 Green Infrastructure Plan (p.30).
or directly into the receiving wetlands and streams. The more impervious surfaces there are on a site, the more run-off there is during storm events. Fecal bacteria, sediments, nutrients, and man-made organic chemicals such as polychlorinated biphenyls (PCBs), carried in stormwater, contribute to the degraded habitat conditions that are typical of urban streams.
Structural problems such as deep ravines, failing slopes, and severe erosion of the streams, wetlands, and floodplains downstream, can result from high volumes of stormwater from development entering receiving streams. Figure 7 shows a deeply incised stream within the Middle Patuxent River watershed
Table 2. Water Quality Data by Watershed
Figure 3. Master Plan Area Land Use, 1938
Figure 4. Master Plan Area Land Use, 1965
Figure 6. In parts of the plan area, stormwater from roadways and other impervious surfaces is channeled directly into receiving streams via concrete storm drains, severely impacting fragile ecosystems, as illustrated in Figure 7
Prince George’s County Planning Department
Figure 5. Stormwater from roadway and nearby parking lot in Bowie
Figure 7. Green Branch tributary near US 301, showing stream channel erosion caused by the conveyance of significant volumes of stormwater
that functions mainly for stormwater conveyance. The siltation of local streams can be substantially reduced if steps are taken to protect soils from erosion by stormwater. Placing of riprap boulders at pipe outlets (see Figure 8) is a common method used to protect stream banks and drainage canals.
Additionally, in keeping with current stormwater regulations, many parts of the master plan area contain environmental site design (ESD) features to treat stormwater onsite prior to its release to the storm drain system (see Figures 8 and 9). Current stormwater regulations include requirements for dealing with the water quality volume (WQV) on a site (i.e., the runoff volume) including 90 percent of all rainfall events each year. Per these regulations, disturbance (e.g., grading) of an area of land greater than 5,000 square feet requires a stormwater management plan, while redevelopment of an existing developed site must be designed to treat 100 percent of the WQV from all impervious area within the proposed disturbed area.
For new development, the first inch of rainwater must be treated onsite. Map 2 shows parts of the County (including the master plan area) where development design must provide for management of the 100-year storm onsite, during site development.
STRONGHOLD WATERSHEDS
Stronghold watersheds are those watersheds in the State of Maryland where rare, threatened, or endangered species of fish, amphibians, reptiles, or mussel species identified by the Maryland Biological Stream Survey, occur in the highest numbers and the greatest frequency. Stronghold watersheds are considered very important for the long-term protection of Maryland’s aquatic biodiversity. Special protection of these watersheds is necessary to ensure the survival of these imperiled aquatic fauna. Prince George’s County contains 19 stronghold watersheds.
• The State of Maryland has designated the Patuxent River (including its main plan area tributaries: Patuxent River Upper, Patuxent River Middle, Horsepen Branch, Collington Branch, and Northeast Branch watersheds) as a stronghold watershed.
Vicinity
Figure 8. Part of the Bowie Town Center showing ESD technique to treat stormwater prior to its release to the storm drain system
Figure 9. Functioning ESD stormwater feature at Bowie Town Center
Map 2. 100-Year Stormwater Management Control Map for Prince George’s County
Source: DPIE
SENSITIVE SPECIES PROJECT REVIEW AREAS
Sensitive Species Project Review Areas (SSPRAs) are a digital map layer created by the staff of the Wildlife and Heritage Service (WHS) of the Maryland Department of Natural Resources. This data layer represents the general locations of most state-regulated and documented rare, threatened, or endangered species. It
is revised regularly to incorporate new information obtained by WHS field surveys.
• There are SSPRAs in parts of all the watersheds within the master plan area. A digital copy of the SSPRA layer is available at DNR’s data download site: http://dnrweb.dnr.
Figure 10. Strategic placing of riprap boulders to help prevent stream channel and streambank erosion (Compare this photo with Figure 1 )
Known Streams, Wetlands, and Floodplain Delineations
• There are about 400 miles (2,153,407 linear feet) of known streams, 2,175 acres of known wetlands, and 2,946 acres of FEMA2 floodplain within the master plan area.
• There are approximately 180 acres of Wetlands of Special State Concern (WSSC) within the master plan area.
This report includes all stream features found in the GIS layer in its calculation of linear feet of known streams. These features are described as “known” because there may be streams and wetlands in the area that are currently unidentified. Some of these stream centerlines may represent piped or otherwise hidden streams. Information regarding streams and their buffers, wetlands and their buffers, severe slopes, and other regulated environmental features must be verified through the NRI review and approval process.
The master plan area’s main streams are the Patuxent River forming the eastern boundary, Collington Branch in the central core, Northeast Branch on the western portion, and Horsepen Branch to the north. There are approximately 2,300 acres of wetlands associated with these stream systems. The location of these environmental resources is shown in Table 3 and illustrated in Map 3.
MARYLAND TIER II CATCHMENTS/ WATERSHEDS
Tier II catchments are nontidal watersheds that exceed minimum applicable water quality standards and criteria. They are under antidegradation regulations (under COMAR 26.08.02.04) that set standards to protect and enhance water quality. These catchments are identified based on fish and benthic indices of biotic integrity.
Within Tier II catchments, Tier II streams or highquality waters exceed applicable water quality standards. Their designation is based on having healthy biological communities as determined by the Maryland Biological Stream Survey data (for both fish and macroinvertebrate). Tier II waters may require additional regulatory protections such as environmental site design, wider stream buffers, special permit conditions, pre/post project monitoring, and/or other appropriate measures to make sure that biological integrity is maintained.
The Horsepen Branch and Upper Patuxent River Watersheds in the northern portion of the master plan area are within the broader Patuxent River (Upper) Watershed which is a designated Tier II Watershed. However, there are no designated Tier II waters within the master plan area.
2 Federal Emergency Management Agency (FEMA)
Table 3. Known Streams, Wetlands and Floodplains within the Master Plan Area*
*The information in this table and on maps in this report regarding the known streams and wetlands within the master plan area was provided by the Maryland Department of Natural Resources and has not been completely field tested. The data should be considered conceptual and for planning purposes only.
• Prince George’s County Planning Department
Wetland mapping information from the Department of Natural Resources shows about 2,628 acres of known wetlands in the master plan area (see Table 3). About half of the master plan area’s wetlands are associated with the Middle Patuxent River watershed. An updated floodplain study will likely be required before development can occur on any property where the County floodplain is shown, or on properties having streams with a drainage area of 50 acres or greater.
WETLANDS OF SPECIAL STATE CONCERN
Wetlands of Special State Concern (WSSC) are nontidal3 wetlands of very high ecological and educational value. They are the best examples of Maryland’s nontidal wetland habitats and many contain the last remaining populations of native plants and animals that are now rare and threatened with extinction in the state. WSSC wetlands receive special protection under the state’s nontidal wetlands regulations, including a minimum 100-foot-wide buffer. There are approximately 180 acres of WSSC wetlands at three locations within the master plan area:
1. Within the Belt Woods Special Conservation Area in the southwestern portion of the master plan area, north of Central Avenue, and west of Six Flags America. In that location, WSSC wetlands occur in areas of poorly drained Widewater and Issue soils in frequently flooded areas along the Northeast Branch stream system. Small patches of WSSC wetlands also occur further north along Northeast Branch streams within the Belt Woods Natural Environment Area south of Woodmore Road.
2. In the Huntington Crest subdivision south of MD 197, within the Horsepen Branch Watershed.
3. The northern portion of the master plan area adjacent to the Patuxent Research Refuge and along the Patuxent River north of Lemon Bridge Road.
THE 100-YEAR FLOODPLAIN
Floodplains are low, flat lands immediately adjacent to streams, rivers, and other waterbodies, which are subject to periodic flooding. For informational purposes, floodplains are delineated in two ways. The Federal Emergency Management Agency (FEMA) periodically maps areas that are in or out of the 100-year (or “regulatory”) floodplain based on current conditions and existing land uses within the watershed. Map 3 shows the delineation of the FEMA floodplain, which is used for insurance purposes.
The second type of floodplain delineation considers both existing conditions and projected future development within the watershed based on the zoning of property. This delineation is called a “floodplain study” and it identifies the “development floodplain,” used for development purposes. Floodplain studies usually result in a wider area of floodplain delineation than the FEMA floodplain because their analysis is based on ultimate development or build-out conditions in a watershed as opposed to the FEMA floodplain, which is based on present land use conditions. The most recent County Floodplain Study covered the Laurel area north of the master plan area; hence there are no County floodplain delineations for the master plan area.
Undisturbed floodplains are nonbuildable portions of a parcel that must be protected to the fullest extent possible; however, many parcels within the 100-year floodplain in the master plan area have already been developed. The degree of development allowable and the mitigation techniques required for stormwater and floodplain impacts from these parcels must be determined by the implementing agencies (DPIE, DoE) prior to development or redevelopment of these areas. Where development in the floodplain is unavoidable, the County Floodplain Ordinance requires an equal volume of compensatory storage be provided. The approximate floodplain delineation based on the FEMA study is shown in Map 3. The County Floodplain Study did not cover the master plan area. A floodplain study may be needed to determine the ultimate limits of the 100-year floodplain based on existing and proposed development, at the time of land development application review.
3 Nontidal wetlands are inland, freshwater areas that are not subject to tidal influence They typically occur where the land is covered by shallow water or where the water table is at or near the surface Examples of nontidal wetlands are marshes, swamps, bogs, wet meadows, and the shallow edges of lakes and ponds
Prince George’s County Planning Department
Map 3. Bowie-Mitchellville and Vicinity Known Streams, Known Wetlands, and FEMA Floodplain Delineation
BOWIE-MITCHELLVILLE AND VICINITY MASTER PLAN
Countywide Green Infrastructure Network
• About 25,000 acres or 66 percent of the master plan area are within the 2017 Green Infrastructure Network.
In 2017 Prince George’s County adopted the Approved Prince George’s County Resource Conservation Plan: A Countywide Functional Master Plan, which replaced the 2005 Green Infrastructure Plan. 4 The 2017 plan builds on the policies and strategies of the 2005 plan to achieve the County’s long-term vision of an interconnected network of significant countywide environmental features that retain ecological functions, maintain or improve water quality and habitat, and support the desired development pattern of Plan 2035. The 2017 Green Infrastructure Plan (GIP), housed within the 2017 Resource Conservation Plan, used the same general guidelines to update the green infrastructure network:
• Regulated Areas are environmentally sensitive features such as wetlands and streams with their regulated buffers, the 100-year floodplain, and their adjacent steep slopes, that are protected (regulated) during the land development process by laws, guidelines, or regulations at the county, state, or federal level. Development of such areas is not permitted except for necessary construction of road crossings and the installation of public utilities. The features shown are the generalized (conceptual) locations of regulated landscapes. Their exact location must be confirmed at the Natural Resource Inventory (NRI) stage of the development review process.
• Evaluation Areas are lands outside the regulated areas that are not currently protected and may contain sensitive features such as upland forest, interior forest, unique habitats, and the environmental settings of cultural resources. While some of these areas are regulated by the County and/or the state, their exact location is not known because many of the layers used to develop them are conceptual in nature. These areas must be evaluated during the development review process to determine whether resources are present that need protection or whether there are suitable areas where mitigation could be used to expand existing or adjacent environmental resources.
The 2017 GIP expands and amends the strategies of the 2005 Green Infrastructure Plan, the 2010 Water Resources Plan, and Plan 2035. It also expands the definition of green infrastructure to include elements that “green” the built environment by introducing strategies to address green and open spaces, to preserve irreplaceable landscapes such as the designated SPAs, and ultimately to guide growth appropriately throughout the County, essentially ensuring the conservation of significant environmental features and the incorporation of green elements into all communities in support of a green economy. Significant improvements of the 2017 GIP over the 2005 Green Infrastructure Plan include:
• Prioritizing the restoration and protection of ecological green infrastructure elements inside the Capital Beltway.
• Acknowledging the importance of connecting wildlife corridors in urban areas to improve ecosystem services.
• Providing larger riparian buffers and shoreline protections.
• Protecting forests by removing invasive plants and avoiding the building of green stormwater infrastructure in forested places.
• Addressing the causes of climate change, sea level rise, and extreme weather events.
• Preserving and/or restoring stream health and functions.
• Requiring that only native trees that are supportive of habitat, and are long-lived, are transplanted.
• Adopting restrictions on hydraulic fracturing and other unsustainable energy sources.
• Requiring public projects to meet environmental requirements.
• Granting fewer exemptions from Tree Canopy Coverage Ordinance requirements.
The main acreages of regulated areas shown are mostly known streams and wetlands, regulated slopes, and the 100-year floodplain associated with the Middle Patuxent River, Collington Branch, and Upper
4 In 2005, Prince George’s County adopted the Approved Countywide Green Infrastructure Plan, which identified a network of ecological resources that meet the designated criteria for countywide significance , throughout Prince George’s County In the 2005 plan the term ‘green infrastructure’ was used to define the connected system or network of significant environmental resources such as forests, waterways and other natural areas on public and private lands, which provide valuable ecological services for current and future generations That plan also identified a conservation mechanism to preserve, protect and enhance these resources when certain development applications were proposed It sought to preserve and improve water quality and a diversity of plant and animal species by reducing forest fragmentation and preserving habitat diversity through connection and enhancement
Table 4. Green Infrastructure Network (2017)
Figure 12. Some of the Master Plan area’s woodlands are Regulated Areas within the Countywide Green Infrastructure Network .
Figure 11. Wetlands associated with the Patuxent River mainstem, Patuxent River Park near Governor Bridge Road (top)
Bowie-Mitchellville and Vicinity Master Plan: Existing Conditions Report
Map 4. Green Infrastructure (2017)
BOWIE-MITCHELLVILLE AND VICINITY MASTER PLAN
Map 5. Location of Special Conservation Areas (SCAs) within the Plan Area
BOWIE-MITCHELLVILLE AND VICINITY MASTER PLAN
Patuxent River Watersheds, as shown in Table 4. The designation is conceptual in nature and field work at the time of development applications may determine whether the boundaries need to be revised.
SPECIAL CONSERVATION AREAS
The GIP also named areas of specific countywide significance that need special attention. These areas, identified as special conservation areas (SCAs), are to be given careful consideration when land development proposals in their vicinity are reviewed to ensure that their ecological functions are protected or restored and that critical ecological connections to these areas are established or maintained. The northern, eastern, and southwestern portions of the master plan area are within the Beltsville Agricultural Research Center or BARC (1), Patuxent River Corridor (3), and Belt Woods (4) SCAs, respectively (see Map 5).
• The Beltsville Agricultural Research Center (BARC), owned by the United States Department of Agriculture (USDA), is in the northern part of the County. At approximately 6,500 acres, it is one of the largest and most diversified agricultural research complexes in the world. BARC has experimental pastures, orchards, gardens, nurseries, fields for cultivated crops, forest ecosystems, and a wide variety of habitats that provide extensive opportunities for research. As part of the green infrastructure network’s evaluation areas, future land use in the area should be carefully considered.
• The Patuxent River Corridor, known collectively as the Patuxent River Park, is a result of the Maryland Patuxent River Watershed Act’s efforts starting in the 1960s, to encourage the seven counties bordering the Patuxent River to preserve the river’s natural lands. M-NCPPC currently owns 7,400 acres of marshes, swamps, and woodlands along the river together with thousands of acres of protected lands owned by the Maryland Department of Natural Resources and other counties. This corridor is one of Maryland’s key greenways and preservation of the natural environment and the river’s scenic character are priorities along this corridor.
• Belt Woods, recognized by the National Park Service as a national natural landmark, is one of the few remaining old-growth upland forests in the Atlantic Coastal Plain. It is an upland hardwood forest dominated by tulip poplar and white oak that supports a dense and diverse bird population. It is reported that “the density of birds breeding at Belt Woods is
among the highest observed on the East Coast” (Resource Conservation Plan, 2017). This forest is supported by critical wildlife connections and WSSC that should be maintained and enhanced. Development in the vicinity of this landmark should be mindful of the needs of the flora and fauna of this unique community. Belt Woods is owned by the State of Maryland and managed by the Western Shore Conservancy.
Forest and Tree Canopy
• The master plan area still retains about 28,000 acres of forest and tree canopy, and an additional 107 acres of land classified as “barren” where trees could be planted if the properties are not developed.
Forest and tree canopy coverage is very important to protect air and water quality, and an area’s sense of place. Trees help trap airborne fine particulates (such as pollen, dust, and those found in smoke and haze), provide shade which helps reduce urban heat island effect, reduces the thermal impacts of stormwater runoff, and reduces the overall quantity of stormwater runoff.
Comparative mapping of the master plan area in 1938 and 2009 show better connected, larger blocks of forest and tree canopy in 1938 and more forest fragmentation by 2009. The master plan area’s northern and central core areas were most affected by this transition from farmland to development, with stream valleys in the Horsepen Branch, Upper Patuxent River, and Folly Branch watersheds showing an overall loss of tree canopy coverage between 1938 and 2017.
The Northeast Branch and Collington Branch watersheds, as well as headwaters areas of some Middle Patuxent River tributaries (e.g. Mill Branch, Green Branch) became visibly fragmented into scattered small patches from the area’s development, by 2009. This development included the widening of local roads, the construction of MD 450, US 50, MD 197, MD 214, US 301, and the accompanying residential and commercial development.
Table 4 provides a summary of the master plan area’s forest and tree canopy coverage in 1938, 2009, and 2017. The trends show an overall eight percent increase in forest and tree canopy coverage between 1938 and 2017 due in part, to street tree plantings, reforestation programs, and retention of large tracts of woodland at the Patuxent River Park, White Marsh, Belt Woods Natural Environment Area, and in the Agricultural and Rural Areas.
Prince George’s County Planning Department Figure 13. Plan Area Forest and Tree Canopy Coverage Trends, 1938 to 2009
Table 5. Green Infrastructure Network (2017)
POTENTIAL FOREST INTERIOR DWELLING SPECIES HABITAT
Potential Forest Interior Dwelling Species (FIDS) Habitat is a GIS layer that was created to evaluate whether large patches of forest present in an area contain portions of interior forest habitat. The Maryland Department of Natural Resources defines interior forest as forested land cover at least 300 feet from nonforest land cover or from primary, secondary, or county roads (i.e., roads considered large enough to break the canopy). Within the Chesapeake Bay Critical Area interior forest must also be a minimum of 50 acres in area with at least 10 acres of forest interior. In Prince George’s County there is no minimum size for an interior forest patch when evaluating an area for the presence of FIDS habitat.
There are several areas of potential FIDS habitat within the master plan area boundaries, including portions or all of the following:
• The northern part of the master plan area west of the closed Sandy Hill Landfill and north of Duckettown Road.
• The Fran Uhler Natural Area and part of a nearly 250-acre portion of the Patuxent River Natural Resource Management Area in the northeastern part of the master plan area.
• Portions of the Patuxent River Park within the 100year floodplain along the Patuxent River mainstem.
Figure 14. Allen Pond Park showing some of Bowie’s Tree Canopy Coverage (FTC) serving as a community amenity and adding to the sense of place
Figure 15. Mature Woodland at Bowie State University
George’s
Map 6. Master Plan Area Forest and Tree Canopy Coverage (2014)
BOWIE-MITCHELLVILLE AND VICINITY MASTER PLAN
Soils Information
SOIL TYPES
Soil consists, in part, of finely ground rock particles. The type of soil present in an area is determined by the different sizes of mineral particles in a particular soil sample, the structure of the soil (how the particles bind with each other to form aggregates), and by measuring the pH (whether water in the soil is acid or alkaline). The soil types within the master plan area are described in Table 6 and illustrated in Map 7.
The predominant soil series in the master plan area is the Collington series, covering about 35 percent of the area. These soils are categorized as being deep, moderately well-drained soils with fine to moderately coarse textures. The description of this series indicates a potential for moderate to high runoff when saturated. Zekiah, Widewater, and Issue soils occur individually, or in combination, along the master plan area’s streams and in areas that are frequently flooded, while Adelphi, Annapolis, and Sassafras soils are generally prevalent on steeper slopes. Christiana soils are associated with Marlboro clays in most of the central and southern portions of the master plan area. For that reason, soil investigations should be conducted to find the best methods of constructing building foundations. Soil studies will also be needed when planning and locating stormwater management facilities to ensure that they are found on sites where stormwater infiltrates easily. Detailed soils investigations will be needed before preparing specific development applications.
SOIL HYDROLOGY
Soil hydrology is a measure of the movement, distribution, and quantity of water in the soil and underlying rock. The rate at which rainwater infiltrates into the earth in areas with permeable surfaces (e.g., forests, wetlands, and streams) depends on the type of soils present. In that regard, soils are placed into hydric groups based on their runoff potential or the rate at which they allow water to infiltrate. The Natural Resource Conservation Service (NRCS) classifies soil into four soil hydric groups (A, B, C, and D) with A having the smallest runoff potential and D the highest. (See Table 6)
• Group A consists of sand, loam, or sandy loam types of soils. They consist of deep, well- to excessively-drained sands or gravels. These soils have high infiltration rates and low runoff potential even when saturated because they allow water to drain freely. Group A soils generally have about 10 percent clay and 90 percent sand or gravel.
• Group B soils are loams or silt loams with moderately low runoff potential. They are reasonably deep and well-drained allowing unimpeded water movement. These soils have textures that range from relatively fine to coarse. They typically have 10 percent to 20 percent clay and 50 percent to 90 percent sand or gravel.
• Group C soils are sandy clay loams with low infiltration rates when thoroughly saturated. The group has moderately high runoff potential because it consists mainly of soils with a layer that impedes the downward movement of water. Group C soils generally have 20 percent to 40 percent clay and less than 50 percent sand.
• Group D consists mainly of shallow soils with high clay content (typically more than 40 percent) and high shrink-swell potential (i.e., a strong tendency to shrink when dry and swell when wet). Soils in this group have a permanent water table resulting from a clay pan or other nearly impervious layer at or near the surface (i.e., 50 to 60 centimeters below the surface). They have very low infiltration rates and the highest runoff potential.
• Group B/D consists of soils given dual classification based on their proximity to a water table or other impermeable layer.
Map 8 and Table 6 show that the master plan area consists mostly of soils in hydrologic groups B and C, meaning sandy and clay loam soils with relatively slow infiltration rates, and moderately high to high rates of runoff. Soils of this group normally have a layer that impedes downward movement of water. They have high potential to support wetlands vegetation or streams. Thorough soils investigations will be needed to determine the location of stormwater management facilities to mitigate water volume input, or the location of sites for creating new wetlands.
Table 6. Plan Area Soil Types, Acreages, and Percentages
Collington-Wist-Urban
Table 6. Plan Area Soil Types, Acreages, and Percentages
(Continued)
Matapeake
Table 6. Plan Area Soil Types, Acreages, and Percentages
(Continued)
Potobac-Issue complex, frequently flooded
Russett-Christiana complex, 0 to 2 percent slopes
Russett-Christiana complex, 2 to 5 percent slopes
Russett-Christiana-Urban land complex, 0 to 5 percent slopes
and Croom soils, 10 to 15 percent slopes
and Croom soils, 15 to 25 percent slopes
Sassafras and Croom soils, 25 to 40 percent slopes
Sassafras sandy loam, 0 to 2 percent slopes
land complex, 5
7. Master Plan Area Soil Types
Bowie-Mitchellville and
Vicinity Master Plan: Existing Conditions Report
Map
BOWIE-MITCHELLVILLE AND VICINITY MASTER PLAN
270 • Prince George’s County Planning Department
Map 8. Soil Hydrology
BOWIE-MITCHELLVILLE AND VICINITY MASTER PLAN
Map 9. Soil Erosion Factors (K-Factors)
Bowie-Mitchellville and Vicinity Master Plan: Existing Conditions Report
BOWIE-MITCHELLVILLE AND VICINITY MASTER PLAN
SOIL EROSION FACTORS
The soil erodibility factor (K-factor) is a measure of the likelihood of soil particles to be detached and transported by rainfall and runoff. The erodibility factor describes soils in the master plan area that should be carefully considered, to avoid siltation and pollution of nearby streams when land is being developed. Erodible soils within the master plan area are the Christiana, Elkton, Adelphia, Beltsville, and Issue series; these are of particular concern when they occur on slopes of 15 percent or greater.
Map 9 shows that generally, the master plan area contains soils with relatively low susceptibility to erosion (K-factor ≤0.28). Scattered throughout the master plan area are patches of soils with higher K-factor (≥0.35) indicating slightly higher risk of soil erosion by rainfall.
MARLBORO CLAY FORMATIONS
Marlboro Clay is composed of dense, brittle clay that is very unstable and prone to slippage when disturbed. Marlboro clay can cause serious structural problems for road and building construction unless special footings are used to penetrate (pin) the Marlboro clay layer. There are extensive Marlboro clay formations in the southern quarter of the master plan area, generally on both sides of US 301 south of Queen Anne Bridge Road. Marlboro clays are commonly associated with Christiana clays.
Impervious Surfaces and Stormwater Runoff
Impervious surfaces include roof-tops, parking lots, sidewalks, roads, and other materials that impede the infiltration of rainwater into the ground. The amount and location of impervious surfaces are a significant factor affecting both the quality (pollution level) and quantity (volume) of stormwater runoff entering streams, rivers, and eventually the Chesapeake Bay. Runoff also carries loose soil, trash, and debris into the waterways, adversely impacting overall water quality. As development occurs within a watershed and impervious
surface area increases, stormwater runoff can become the primary source of water entering a stream. Impervious surfaces also absorb and emit heat, creating surface, air, and stormwater runoff temperatures that are considerably higher than in rural areas.
Heated stormwater runoff mixes with and increases the base temperature of the receiving streams, significantly impacting their ecology. Degradation of water quality caused by changes in ambient water temperature is referred to as thermal pollution. Small streams, such as the one shown in Figure 16, are highly sensitive to changes in temperature. Low concentrations of dissolved oxygen (DO), which negatively affect the behavior of fish and aquatic insects, are a common impact of thermal pollution. Wooded stream buffers, street trees, and stormwater management systems that retain run-off in subsurface storage can mitigate the effects of thermal pollution.
The stream pictured in Figure 16 is shaded by tree canopy. However, the exposed roots in the left foreground indicate heavy streambank erosion, while the gravel buildup and silted streambed all point to the conveyance of high volumes of stormwater runoff. The Baysox Stadium development within the southwestern quadrant of the US 50/US 301 intersection, as well as parts of the Bowie Town Center and portions of Collington Road, US 50, and US 301, all drain to this tributary.
• Imperviousness within the master plan area is high at nearly 8,000 acres or 20 percent of the master plan area.
• Roads, buildings, and parking lots cover nearly 5,000 acres accounting for 62 percent of the master plan area’s total impervious cover as shown in Table 7.
Tables 7 and 8, and Map 10, show impervious area coverage within the master plan boundaries. According to the Environmental Protection Agency (EPA), stream degradation can result when imperviousness in a watershed is 10 percent or greater; leading to structural problems such as failing slopes, deep ravines, siltation,
Table 7. Green Infrastructure Network (2017)
and severe erosion present in some of the area’s streams, wetlands, and floodplains.
Table 8 shows that portions of the Middle Patuxent River and Collington Branch watersheds that are within the master plan area have high imperviousness at 7.27 percent and 6.48 percent, respectively, consistent with the Poor and Very Poor watershed quality ratings in the two watersheds.
Additionally, the total acreage of pervious surfaces in the master plan area is 1,280 acres more than the amount of forest and tree canopy and other vegetation combined, meaning that about 3 percent of the existing impervious surfaces is currently shaded. This is greater than the countywide percentage of approximately 2.7 percent of impervious surfaces that are shaded. Increasing the percentage of shaded impervious surfaces further, has multiple benefits including reduced urban heat island effect, reduced thermal heat impacts on receiving streams, and reduced stormwater run-off.
Figure 16. Green Branch, a Middle Patuxent River tributary near Governor Bridge Road
Table 8. Master Plan Area Impervious Surfaces by Watershed (2017)
17. Bowie’s roadways cover 1,940 acres accounting for 24 percent of the master plan area’s total impervious surface coverage
18. Bowie Residential Neighborhood . Street trees shade roadways, sidewalks, and parking lots, lowering the temperature of stormwater runoff from these areas and minimizing the risk of thermal pollution of local stream sand wetlands
274
Prince George’s County Planning Department
Figure
Figure
10. Master Plan Area Impervious Surfaces
BOWIE-MITCHELLVILLE AND
MASTER PLAN
Bowie-Mitchellville and Vicinity Master Plan: Existing Conditions Report
Map
VICINITY
Noise, Air, and Light Pollution
Noise, air pollution, and light pollution must be limited or reduced to ensure that communities are comfortable, livable, and sustainable.
NOISE POLLUTION
Noise is unwanted sound from constructed or natural sources. It is usually the most obvious environmental concern for people who live, work, and recreate near a noise source such as a busy road, highway, airport, or railway. Excessive noise has a significant effect on the quality of life in any community, and more particularly, in a developed community such as the master plan area. US 50, US 301/MD 3, Freeway Airport, and stopand-go traffic contribute to noise.
Noise levels are measured in decibels and reported as average decibels with a 10-decibel penalty for the sensitivity people experience when sleeping (measured as dBA Ldn or average decibels level with a day/ night average). The accepted maximum noise level for outdoor activity areas (e.g., backyards, parks, ball fields, and playgrounds) is 65 dBA Ldn, while the accepted maximum level for indoor areas is 45 dBA Ldn. State noise guidelines and standards require that development such as residential homes, day care centers, or hotels should not be located immediately adjacent to transportation noise sources or in areas where transportation noise levels in outdoor activity areas will exceed 65 dBA Ldn. Where noise impacts cannot be avoided, mitigation should be provided
to reduce noise impacts to 65 dBA Ldn for outdoor activity areas and to 45 dBA Ldn for indoor areas.
Only roadways classified as arterial, freeway, and expressway generate enough traffic to result in noise levels above 65 dBA Ldn for outdoor activity areas. A computer noise model was used to delineate the 65 dBA Ldn noise contour for traffic noise from the sector plan roadways classified as arterial or greater. The location of the noise contour is measured in feet from the centerline of the roadway outward on both sides. Table 8 and Map 11 show the results.
The noise model used for this report does not predict noise or vibration levels from nontransportation sources or adjacent to above-ground railways. Residential and residential-type uses could be placed adjacent to above-ground railways if proper construction and insulation methods are used, though such uses should generally not be placed within 200 feet of the centerline of the tracks.
AIR POLLUTION
The Washington metropolitan area, which includes Prince George’s County, currently does not meet the air quality standards set by the EPA for ground level ozone. Utilities and other industries, motor vehicles, small gasoline-powered engines (e.g., lawnmowers and chainsaws), and small businesses using solvents, paints, insecticides, or cleaning solutions, are the main sources of the pollutants that create ground level ozone.
1 Lanham Severn Road (MD 564) Springfield Road E to Laurel Bowie Road
2 MD 450 (Annapolis Road) from Glen Dale Road east to Robert Crain Highway
3 John Hanson Highway (US 50) from Glen Dale Boulevard east to County Boundary
4 Central Avenue (MD 214) from Enterprise Road/Watkins Park Drive to County Boundary
5 Laurel Bowie Drive/Collington Road (MD 197) from US 301 to Project Boundary
6 Robert Crain Highway (US 301, MD 3) from Leeland Road north to County Boundary
7 Watkins Park Drive/Enterprise Road from Largo Road (202) north to Annapolis Road
**Collector being treated as an Arterial because of high traffic volumes
Table 9. Projected Noise Contours for Major Roadways in the Master Plan Area
BOWIE-MITCHELLVILLE AND VICINITY
Map 11. The 65 dBA Ldn Noise Contour Along the Master Plan Area’s Major Roadways
MASTER PLAN
Though air quality is regulated at the federal rather than the local level, master plans can help address air pollution by promoting actions that result in planting and preserving more trees to reduce the heat islands, or easing traffic congestion and encouraging the use of transit and other modes of transportation that reduce the number of vehicles on the road. Safe and efficient hiker/biker trails, as well as sidewalks and other pedestrian infrastructure also help to reduce the dependency on motor vehicles.
LIGHT POLLUTION
Unwanted light and intrusions caused by glare are commonly referred to as light pollution. Light intrusion from commercial and industrial areas into residential areas and environmentally sensitive areas are concerns within the master plan area. Studies have shown that consistent light levels throughout a community can reduce crime because the human eye does not need to adjust when viewing areas of different light levels. High levels (bright lights) in one area next to an area of low light make an area unsafe. Downward facing light fixtures with appropriate shielding and full cut-off optics should be used to provide consistent light levels throughout the sector plan area.
Special Roadways
Special Roadways include roads that the Prince George’s County Council has designated as scenic or historic, and scenic byways that have been designated by the Master Plan of Transportation or subsequent master or sector plans. There are no special roadways located within or adjacent to the master plan area.
APPENDIX
SOURCES
1. The sources of all Geographic Information System (GIS) data used in this report is The Maryland-National Capital Park and Planning Commission who has compiled GIS layers from a variety of internal and external sources. A list of the GIS layers available and their associated metadata can be found on the Prince George’s County Planning Department’s website, www.pgplanning.org.
2. The photos contained within this document were taken by M-NCPPC staff during the spring of 2015 except for the aerial on page 14 that was clipped from a GIS layer.
3. Water quality data is reported from the Biological Assessment and Monitoring of Streams and Watersheds in Prince George’s County (2003). Copies of the full report are available upon request.
4. The source of soils information is the USDA Natural Resources Conservation Service from the Web Soil Survey.
PRINCE GEORGE’S COUNTY AGENCY CONTACT INFORMATION
Land Development and the Environment
The following information is provided to assist in directing questions about environmental concerns related to land development approvals to the proper department. More information can be found on each department’s website.
Department of Permitting, Inspections, and Enforcement (DPIE) 301-883-5710
Plan review and approval for stormwater management, floodplain impacts, and grading; issuance of building and grading permits; and enforcement.
Department of Public Works and Transportation (DPW&T) 301-883-5600
Review and approval of transportation rights-of-way and proposed roadway design and construction and maintenance of County roadways.
Department of the Environment (DoE) 301-883-5810
Responsible for watershed implementation plan (WIP) to address water pollution, consults with DPIE on floodplain issues, climate change and hazard mitigation planning, and water and sewer planning.
Health Department (HD) 301-883-7605
Perk testing for septic field applications.
The Maryland-National Capital Park and Planning Commission, The Prince George’s County Planning Department 301-952-3650
Review and approval of Natural Resource Inventories (NRIs); review and approval of Tree Conservation Plans and Letters of Exemption; review of development applications for conformance with environmental regulations related to land development. More information regarding preparation of the required environmental documents can be found in the Environmental Technical Manual on the Prince George’s County Planning Department’s website, www.pgplanning.org.
Acknowledgments
The following employees of the Maryland-National Capital Park and Planning Commission’s Prince George’s County Planning Department contributed to this study: