9 minute read
Energy cost management

from Reduc_TOC_Pump_Sys
by Modiconlv

the best efficiency point (BEP) but 75% of the pumping systems are oversized by around 30%. Figure 4 (previous page) illustrates how pumps begin to waste significant efficiency when appropriate maintenance practices are neglected. For example, discharge recirculation can occur if the pump operates at 65% of the BEP flow rate, causing damage to the impeller, and a damaged impeller will be less efficient.
Variable speed drives can help to keep the operating point close to the BEP and also protect the pump against destructive forces generated by inefficiencies. Extreme situations such as dry running, low flow operation, or cavitation (due to low net positive suction head) which can cause instantaneous damage are avoided. Monitoring the operating point of the pump and its efficiency provides diagnostics that can help predict when potential system problems will occur.
Advertisement
Figure 5 illustrates how operating away from the BEP not only decreases the efficiency but speeds up the wear and tear on the pump thereby reducing reliability. For example, operations run at 60% of BEP result in: 50% lifetime reduction of seals 20% lifetime reduction of bearings 25% lifetime reduction of casing and impeller Approximately 100% increase of maintenance cost
Figure 5
Effect of the distance from the BEP on reliability (Courtesy of Barringer & Associates –“Pump practices & life”) % Reliability
Wear is unavoidable due to mechanical parts that are moving and to the action of the fluid being pumped. Erosion is generated by the speed of fluid, and it could be increased by
slurries (sand or bigger particles). Corrosion is due to chemical or electrochemical reaction that attacks the pump materials. Even treated drinking water causes corrosion in cast iron casings as a result of the catalytic effect of bacteria. Erosion and corrosion pipes, the impeller, and the case (which are key operating components).
Efficiency drops by 10 to 15% for an unmaintained pump (see Figure 6). Moreover, the major loss in efficiency occurs in the first few years of the pump’s life. Regular maintenance avoids losses in efficiency and capacity which can occur before the pump fails.
Figure 6
Average wear trends for maintained and unmaintained pumps (Courtesy of ETSU - Energy Savings in Industrial Water Pumping Systems)
Some of the factors that debilitate a pump are visible. Others are not. For example, a worn seal is apparent. However, hydraulic wear is not. A problem that is not visible occurs before it is identified. This creates a situation of urgent corrective maintenance, and the defects may have affected other parts of the pump.
Maintenance practices
A number of approaches are available that can help to address the issue of maintenance in a cost effective manner. Preventive maintenance implies the systematic inspection and detection of potential failures before they occur. Condition-based maintenance is a type of preventive maintenance, which estimates and projects equipment condition over time, utilizing probability formulas to assess downtime risks. Corrective maintenance is a response to an unanticipated problem or emergency.
Figure 7 illustrates the cost curves of these three types of maintenance. Condition -based maintenance is the most cost effective of the three approaches.
Condition-based-maintenance monitors system data on an ongoing basis and provides an accurate assessment of the health, or status of components, devices, and / or the complete system.
As it relates to pumps, variables such as suction pressure, discharge pressure, pump speed, power, flow, and temperatures are monitored to detect a loss of efficiency. Identification of the potential problems is possible by combining the efficiency trends and process variables.
Figure 7
Cost curves of the different maintenance approaches (Courtesy of Penn State University/Applied Research Laboratory - “Open systems architecture for condition-based maintenance”)
Variable speed drives have the capability of measuring process variables, temperature and power with high accuracy and to assess the pump efficiency. If connected to the automation system, they continuously monitor the health of the system and can indicate in a precise manner when proper maintenance is needed.
Figure 8 illustrates how a warn part can impact the pump efficiency curve.
Figure 8
Worn pump curve vs. new pump curve
Step 3: Energy cost management
Figure 9
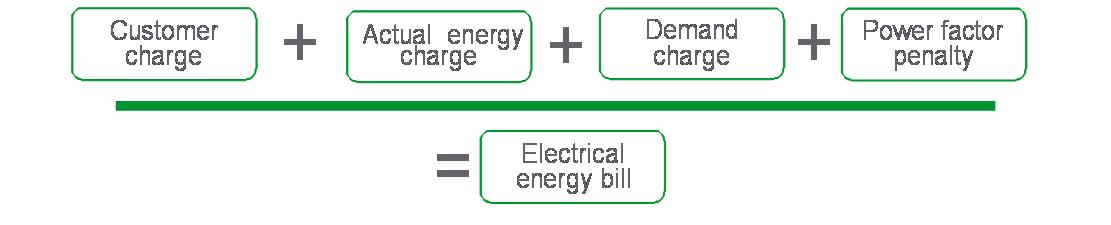
Fundamental elements of a typical industrial electrical bill
Pipes
As part of the overall pumping system, pipes are also subject to issues such as overpressure, leakage, or pipe burst. An overpressure situation can be caused by poor pump control. A situation called “water hammer” can also occur. Water hammer is caused by a pressure or shock wave that travels through the pipes, generated by a sudden stop in the velocity of the water. This sudden acceleration and deceleration on the motor can be avoided with the help of a variable speed drive (sudden variation in flows is avoided). Leakage can also be reduced by automatic adjustments to pressure when appropriate.
Motors
Protection against mains voltage and frequency fluctuations can help maintain the integrity and extend the lifetime of motors. In cases where motors are equipped with variable speed drives, those electrical disturbances are not transmitted to the motor.
Protection against high temperature conditions can also extend the life of the motor assets. Devices such as thermal relays, PTC or PT100 thermal sensors can help and are manageable through the variable speed drive.
In cases where long motor cables are used in conjunction with motors and variable speed drive, it is recommended that filters be installed in order to avoid the dv / dt and motor voltage surge effects (see the Schneider Electric white paper “An Improved Approach for Connecting VSD and Electric Motors” for more details on this subject). Note: For submersible bore hole pumps, it is recommended to verify the peak to peak voltage and the dv / dt at the motor terminals with the motor-pump supplier.
Building owners, water / wastewater and oil and gas facilities operators are presented with utility bills that have multiple components. These can include power demand charges, energy demand charges, time-of-use charges, ratchet clauses, cost-of-fuel adjustments, power factor penalties, customer service charges and national, regional, and local taxes. A misinterpretation of utility rate structures can lead to poor management of electrical consumption and to higher costs.
Most energy bills cover similar basic elements (see Figure 9). Familiarity with the terms can help to understand where the opportunities for cost reductions exist.
Below are some definitions for common terms used:
Customer charge –This is a fixed charge that depends upon the size of the connection that links the industrial installation in question to the electrical utility network. The customer charge is calculated according to an anticipated power consumption range, and the price of
Harmonics
Industrial sites can also be penalized by the utility if the electronics equipment within their walls generate an inordinate amount of harmonics (electronic disturbances) back up the grid.
A detailed explanation of how to reduce harmonic effects is provided in the Schneider Electric white paper entitled “Operational Cost Avoidance through Harmonic Mitigation in Industrial Environments”.
the actual power that is consumed. Both of these elements are influenced by the type of contract that has been signed between the corporation and the utility.
Actual energy charge –This charge corresponds to the consumed active energy, which is the cumulative energy consumed over a given period of time. The kilowatt hours (kWh) rate depends upon the time period the energy was consumed, and whether that consumption occurred during “peak” and / or “off peak” hours.
Demand charge –This charge represents the highest average power consumed within any 15 minute time period over the span of a month’s time is tracked by the utility. This number is then multiplied by the demand charge rate in order to produce the demand charge that appears on the electrical bill. That means consumers are charged for a peak demand even if it only happened once during the month.
Power factor penalty - The power factor is the ratio between the active power (that generates work) and the apparent power (that could potentially be used to generate work). That means that a certain portion of the power that is delivered by the electrical utility to the industrial site is not billed (because it did not generate work). If the power factor is less than the given value mentioned in the contract (say around 0.9), the consumer is invoiced for the power factor (reactive power). A lot of equipment or devices have power factor lower than 1: motors, induction furnaces, transformers, variable speed drives, computers, fluorescent lighting.
Best practices for energy cost reduction through bill management
The electrical energy bill for the site can be reduced by implementing the following series of simple actions:
Locate and review the utility contract itself to better understand the charges associated with the bill and how they can be controlled. Up to 10% savings without any capital investment could be achieved with the support of a company specialist in energy management. Adjust the timing of energy usage from the peak rate period to the off peak period as much as is possible (e.g. by controlling differently reservoir and pumping operations). Reduce the monthly peak demand number in order to reduce the demand charge. In most cases, 75% of the applications are oversized. Variable speed drives, which can reduce power demand by 20%, are a technology that helps organizations to size according to process requirements. Power factor penalties that are due to motor and that mitigate harmonics at 48% of THDi for 80% load, can be canceled out by deploying variable speed drives to pumps. Reduce the amount of energy that is consumed that is not linked with revenue generation. An active control of the leakage will significantly reduce the operational cost.
Conclusion
By pursuing best practices in energy efficiency management, asset management, and energy cost management, total cost of ownership of pumping system networks can be reduced by up to 20%. One simple technology, the variable speed drive with embedded energy management functionality, has the capability of being a major contributor to achieving achieve the TCO target.
The variable speed drive is fully integrated in the numerous steps that can be taken in order to implement an effective energy management plan. These include adopting energy efficient technologies, implementing condition-based maintenance practices, and optimizing cost control of the electrical bill. The linking of pumping processes to energy systems helps to improve business performance through better energy management.
Organizations that are ill equipped to jumpstart an energy efficiency program should seek the assistance of mission-critical subject matter experts. The alternative invites unnecessary delay, risk, and expense.
To achieve operational sustainability, organizations must act quickly to assess their current programs and begin building an operational methodology that emphasizes improvement in energy efficiency.
About the authors
Lionel Gaudrel is a Strategic Marketing Manager within Schneider Electric’s Industry business. He holds a bachelor degree in electrical engineering and a master degree from EMLyon Business School. He has over 20 years of experience in the industrial applications field and holds a patent around variable speed drive automation technologies.
Arnaud Savreux is an Offer Application Expert manager within Schneider Electric’s Industry business. He holds a postgraduate degree in electronics and automation from the University of Rouen (France). He has applied his engineering skills to multiple industry automation projects.
