1 minute read
Revenue Forecasts


Revenue Forecasts
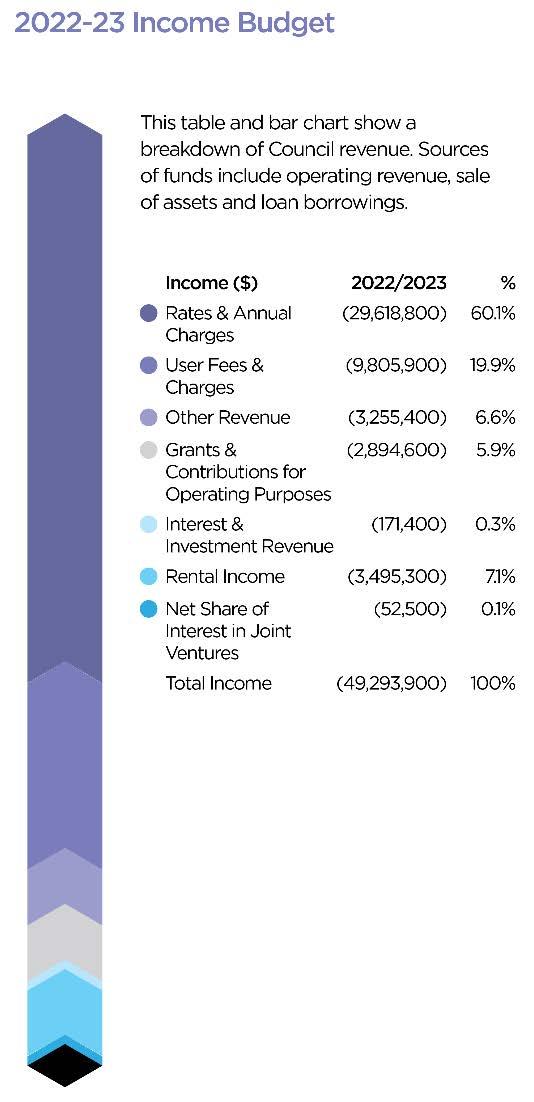
The following graph shows the break-up of Council’s projected operating revenue for 2022/23 by source:
Rates and Annual Charges
Rates
The forecast 2022/23 Rates revenue comprises the following:
Rates
Residential Business Total
2022/23
20,004000 2,021,000 22,025,000
% of Levied Total
90.8 9.2 100.00
Since 2011/2012, the responsibility for setting the rate peg for NSW Councils lies with IPART. Rate pegging is determined by IPART using a Local Government Cost Index less a productivity factor.
The budget projections are based on a rate peg of 2.3% as included in the latest adopted Long Term Financial Plan. The rate pegging assumption for the remainder of the plan is an annual 2.9% increase which is below the general increases expected for other aspects of the Plan.
Annual Charges
The Domestic Waste Management charge is based on full cost recovery for the provision of the waste and recyclable collection service. The collection service is managed by an external contractor selected through a Tender process for a designated period. The LTFP has provided for a sufficient reserve which will be used to fund any required bin replacements. This may result from unexpected changes to legislation or other factors and may lead to revised service collection methods.
User Charges and Fees
Council annually establishes its fees and charges in accordance with the provisions of the Local Government Act 1993. Statutory fees are fixed by regulation, legislation or a State/Federal Authority. As such, Council has no influence on how a statutory fee is determined nor do such statutory fees. Other fees have been increased by 3.0% where appropriate, maintaining relativity with the increase in the Sydney All Groups CPI of 3.1% (December 2021). Parking fees have been set to match similar charges in other Councils.
There are however some user fees that are above CPI due to:
• the need for cost recovery eg processing of various applications • industry standards being higher eg community transport • less than CPI increases in previous years eg food services and seniors activities • market parity eg children's services • upward rounding to achieve increases to the nearest 50c/$1 (marginal only)

