9 minute read
Cleanrooms: On repeat

from MPN EU Issue 61
by MPN Magazine
JOSHUA HASTON, TERRITORY ACCOUNT MANAGER AT CONNECT 2 CLEANROOMS EXPLAINS HOW CLEANROOMS CAN SUPPORT THE ACHIEVEMENT OF GREATER DEGREES OF ACCURACY TO RELIABLY REPEAT THE PRODUCTION OF MICRO PARTS.
For injection moulders, upgrading plastics manufacturing with a cleanroom to gain access to medical markets is a common move and a natural progression pathway. Cleanroom providers typically provide ISO 14644-1:2015 class 7 cleanrooms for such occasions. Having a class 5 cleanroom installed, however, brings additional benefits.
MICROMOULDING
Biplas Medical — a technical injection moulder in South Wales — had an ISO class 7 cleanroom installed when it introduced clean production in 2018. Earlier this year, the company took cleanroom production to another level when it needed an ISO class 5 cleanroom to house a micro-injection moulding machine to facilitate an Innovate UK grant project. Biplas Medical had joined a European consortium to develop a cancer diagnostics device, which, as it turned out, is produced using the smallest moulding ever made.
The larger parts produced by the micromoulding machine for a different project weigh approximately 3–4 g. By comparison, the parts required for the Innovate UK grant project weigh less than 0.1 g. These parts are so small that quality control (QC) inspection requires a microscope and camera.
The cleanroom ISO standard (146441:2015) dictates there can be no more than 10,200 particles of size 0.3 µm per m³ of air within an ISO class 5 cleanroom.1 To give an idea of scale, human hair has an average diameter of 100 µm and smoke particles are 1 µm. Achieving a microscopic level of environmental control is critical when producing micro parts as any contaminants would completely stop the products from working.
Since investing in the ISO class 5 cleanroom, Biplas has received micromoulding contracts for dentistry components and a two-shot biotechnology component that separates fluids and cells as they pass through the product. Both parts cannot be produced in conditions any higher than ISO class 5.
BENEFITS OF CLEAN PRODUCTION
A cleanroom creates a reliable and repeatable environment with controlled levels of airborne particulate. For manufacturers, this consistently clean production environment improves yield by reducing the number of parts that are rejected after QC inspection.
Since the introduction of its first cleanroom in 2018, Biplas Medical has reduced its scrap rate and increased its scope of supply by being able to offer packaging services. Clients also benefit from this value-added service, as components that are cleanroom packed and double-bagged are much easier to transfer into a cleanroom; they are also more reliable as is less chance of contamination causing defects.
TRAINED STAFF
Often, the biggest contamination risk in a cleanroom is people. Operatives need to be trained to develop skills and knowledge in this specialised area of the market. A cleanroom is a large investment; it is, however, only one component of a contamination control strategy. If behaviours aren’t learnt and adhered to then staff pose a contamination risk to the end product. Once trained, a workforce will be aware of the appropriate behaviours that will control the introduction, generation and retention of particles, in line with ISO 14644 standards.
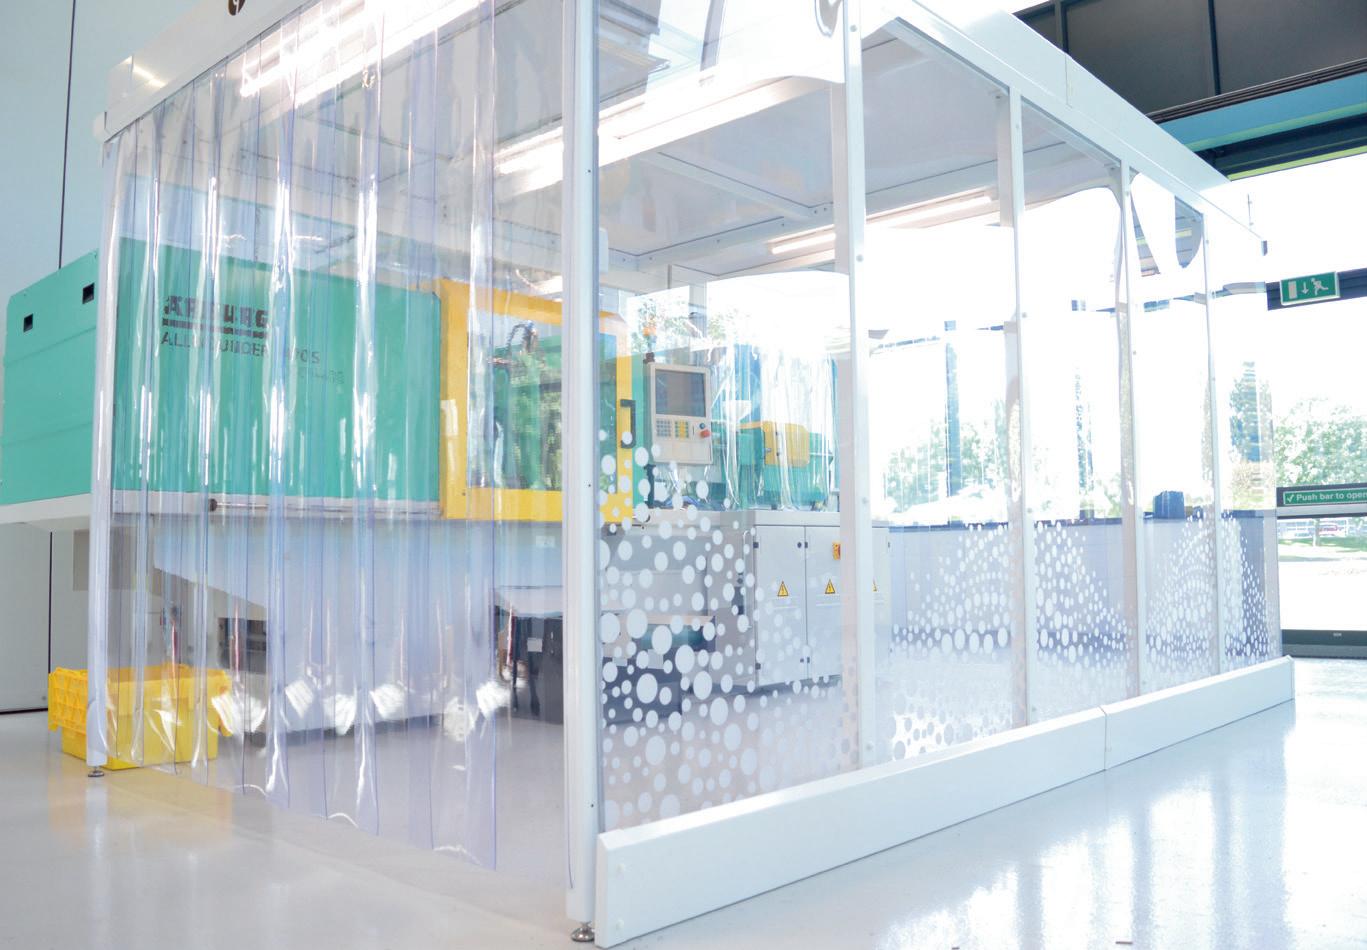
CLEANROOM DESIGN FOR PLASTICS MANUFACTURERS
The challenge with creating a clean environment for medical plastics is that moulding machines produce contaminants during a cycle. A favoured solution is to part-enclose the machine in a clean environment so that the tool face is protected by clean air, but the hopper remains external to the environment. Purpose-built modular cleanrooms can be profiled around machinery, or designed with clean canopies that can be integrated directly with the machine. Canopies with retractable fan filer units can facilitate quicker tool changing procedures, thus reducing production downtime.
It is still possible to achieve a classified environment with full machine coverage. To achieve particle counts according to the levels dictated in ISO 146441, the cleanroom must introduce enough clean air to remove the contaminants produced by the process when operational.
REFERENCE
1. https://www.iso.org/standard/53394. html
Pore size measurement of porous materials
PORVAIR SCIENCES’ DAVE COWIESON, MATERIALS SCIENCE MANAGER, KEN NZERIBE, MATERIALS SPECIALIST, CHARLIE BRIGGS, MATERIALS TECHNICIAN COMPARES CAPILLARY FLOW POROMETRY WITH MERCURY INTRUSION POROSIMETRY FOR DETERMINING PORE SIZE DISTRIBUTION.
Porous materials demonstrate advantageous filtration characteristics which provide precise solutions in myriad applications ranging from large-scale industrial filtration (e.g., water or air filtration) to targeted separation and purification processes in pharmaceutical applications such as sample preparation, drug discovery, drug delivery. Understanding the distribution of pore sizes in porous materials such as porous plastics is crucial to selecting the right porous characteristics for effective filtration and separation performance of the porous material in application.
There are two main methods of measuring pore size distribution (PSD): capillary flow porometry (CFP); and mercury intrusion porosimetry (MIP). In both cases, liquid (Porofil, a fluorocarbon liquid), is used for CFP; mercury is used for MIP) is used to fill the porous structure; for CFP, the liquid fills the structure first and is expelled under increasing pressure whereas for MIP, the material is placed under vacuum to remove the air trapped in the pores of the material before liquid mercury is forced into the pores under increasing pressure.
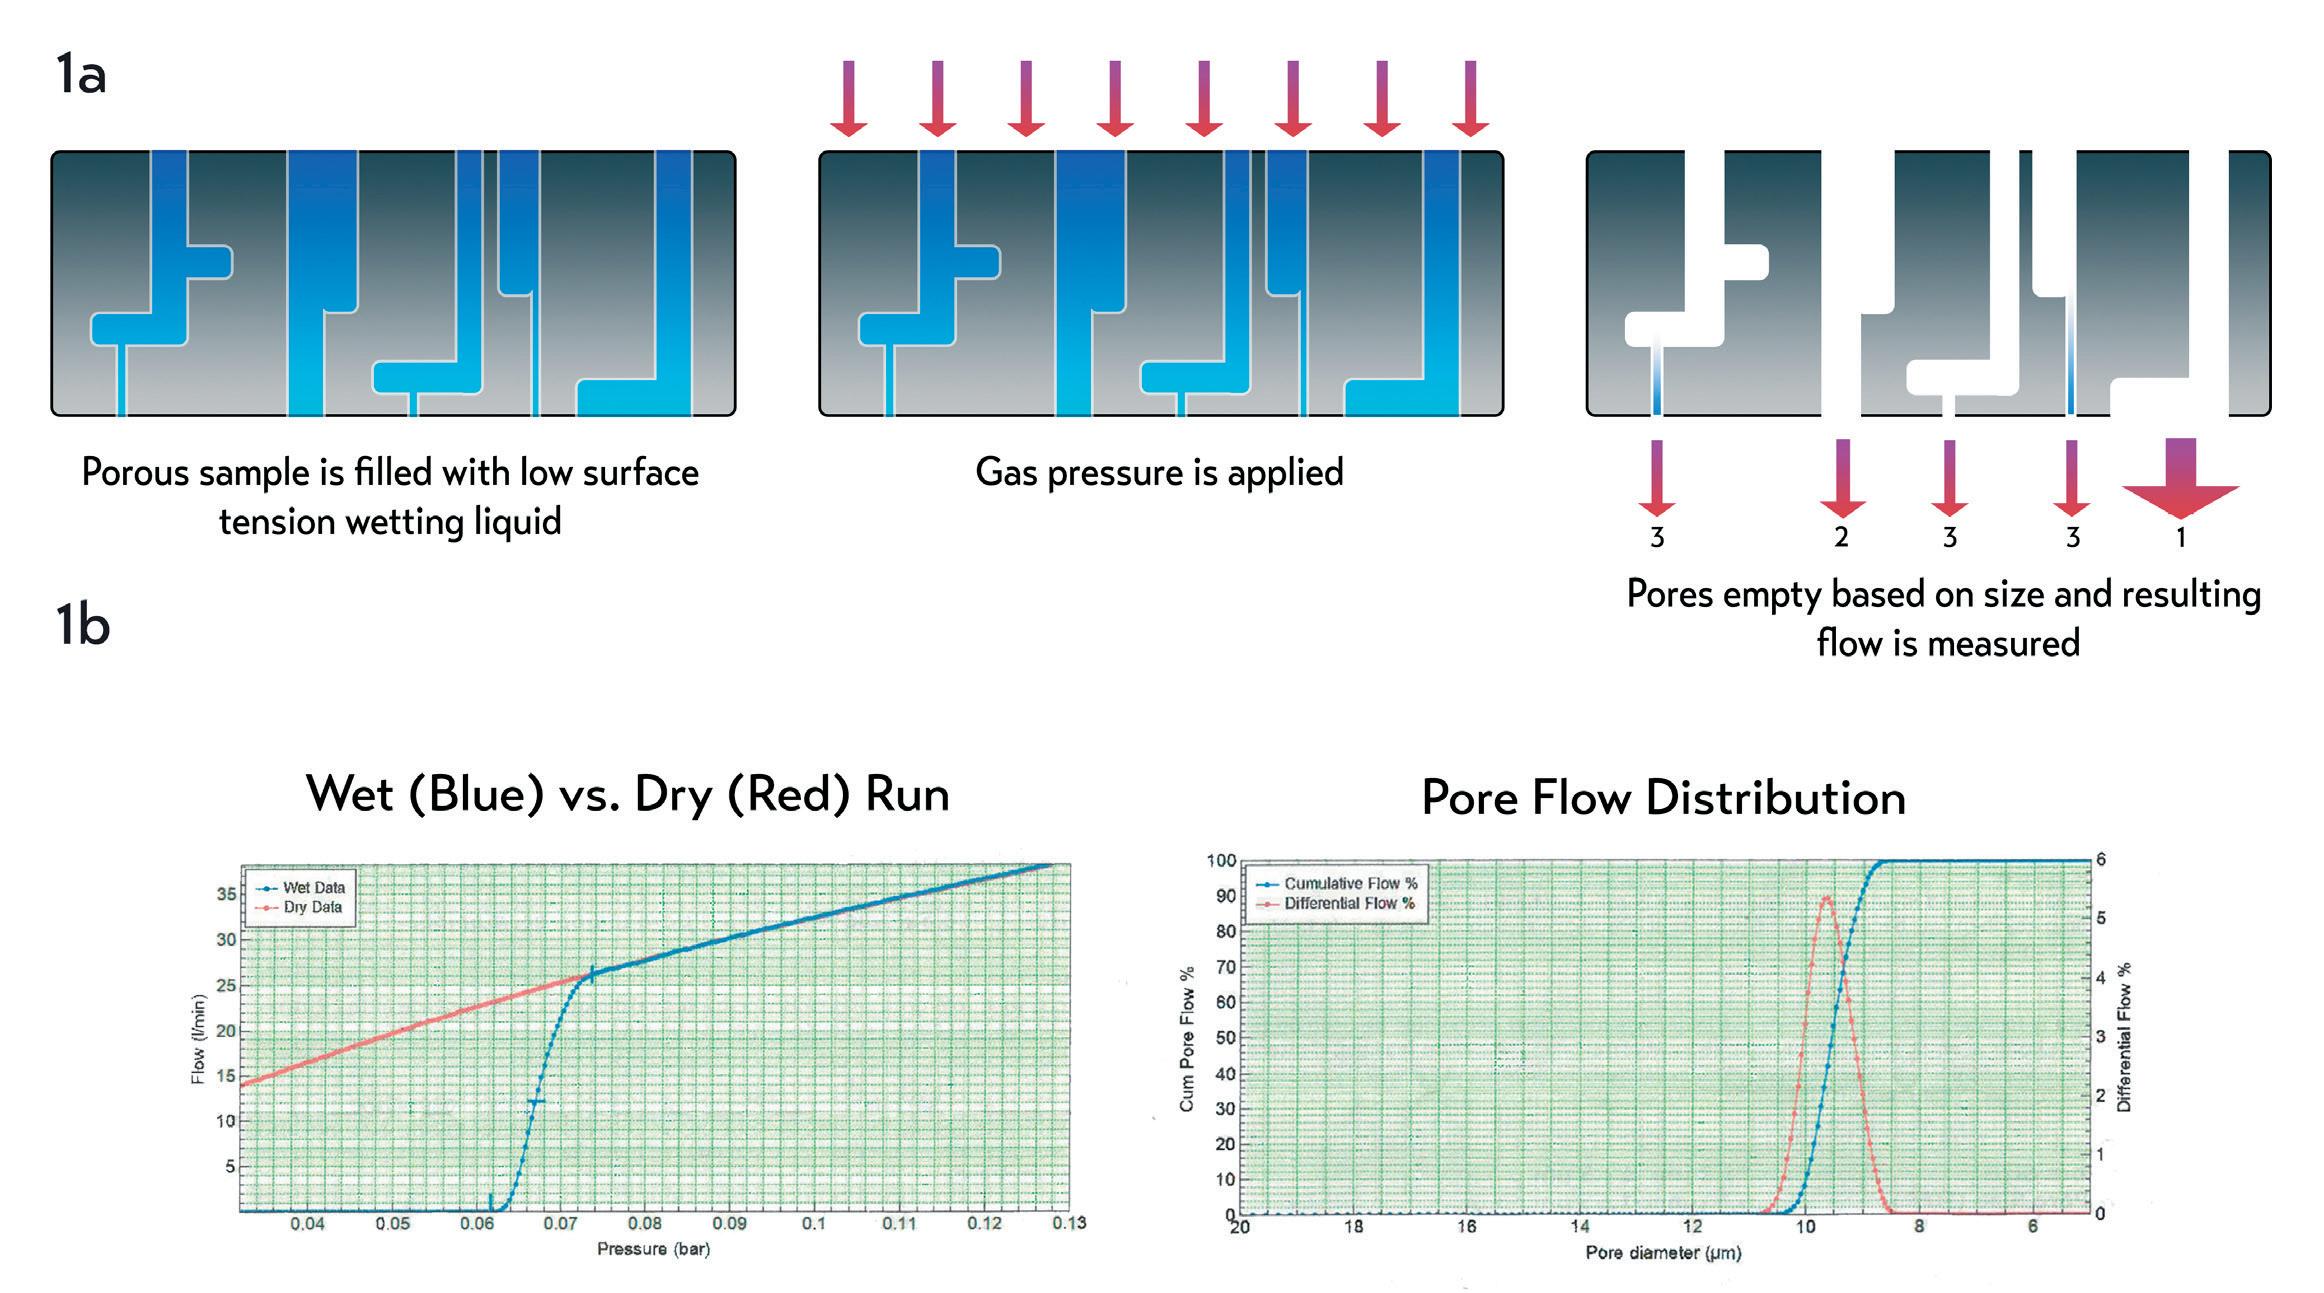
CFP CFP is a pore size characterisation technique that uses liquid expulsion to measure of the size of pores that completely penetrate through a porous network, so-called ‘through-pores’. A liquid is used to wet out and fill the pore structure thus displacing the air present. The wetting liquid is subsequently expelled by force using pressurised gas (air is used for CFP, and nitrogen is used for MIP), and a simple inverse pressurepore-size relationship established. Gas pressure is applied and slowly increased expelling the largest pores first at low pressure and then smallest pores as the pressure increases (Figure 1).
With this technique, a low surface tension liquid at low vapour pressures is used to minimise any potential evaporation during the measurement. The increase in airflow through the structure is used to measure this process, and generates a ‘wet curve’ on a graph. Once all the liquid has been expelled, the process is repeated, this time measuring the airflow through the structure with increasing pressure across the dry material to form a ‘dry curve’ graph superimposed on the wet curve. Data from the wet and dry curves can then be used to calculate the throughpores present in the material shown as a PSD for the material. Typically, manufacturers quote the range of pore sizes, from the minimum pore size to the maximum. This is suitable if the pore size of the sample follows a normal distribution where the mean tends towards the centre of the curve, but this is often not the case as the sample can either lean to the maximum or minimum points. Porvair Sciences quotes a minimum, maximum and mean flow pore (MFP) size from this distribution, providing a better understanding of the PSD of the material. As this distribution is based on air flowing through the structure, the mean must be quoted as MFP rather than a mean based on pore diameter. This is a key difference between these two techniques but, in most cases, MFP can be considered as a mean pore size. Porous structures contain a small percent of
LEFT:
Figure 1: a) An illustration of CFP. Through-pores of decreasing size empty as the pressure is increased across the sample, first pore number 1, then 2, and finally 3. b) Typical wet and dry run measurements (flow vs. pressure) and typical pore flow distribution (pore diameter vs. flow).
dead-end or blind pores, and depending on the thickness of the porous structure, the percent of dead-end pores can increase. Deadended pores are those that terminate partway through the material; this characteristic is important to understand as CFP can only measure the pores that allow fluid flow through the structure from one side to the other. It cannot measure the dead-end pores, which will influence the resulting PSD. CFP measurements must be made on discshaped samples. Although bespoke housings can be offered for specific dimensions there are limits on dimensions that can be measured using CFP. MIP For MIP, mercury is used to fill the pore structure by first placing the porous material under vacuum to remove the air present in the pores which would otherwise interfere with the intrusion of mercury into the porous structure. In addition, gas pressure is applied to allow the mercury to fill the pore structure. The material is inserted into a penetrometer, which is then installed in a pressure chamber in the porosimeter, evacuated, and backfilled with mercury. The penetrometer comprises a cylindrical section large enough to accommodate samples typically <10 mm in diameter/length. Large pores which are directly accessible at the surface are intruded into first and, as the pressure increases, ever-smaller pores accessible at the surface or connected to pores already filled are consequently filled as illustrated in Figure 2. The volume of mercury intruded into the pores can be quantified via the electrical response calibrated against known volumes of mercury, and a graph of the volume of mercury intruded against the pressure required to push it into the pore structure is generated. By relating the pressure of intrusion to the size of the pore being filled, a PSD plot is generated. MIP measures all the pores within the structure including the dead-ended pores to give a more detailed and accurate measurement of the porous structure. The choice of mercury contact angle will greatly affect the calculation of PSD measurement obtained from MIP — a contact angle which provides a PSD comparable with that generated by the CFP method can be adopted; this, however, must be reported
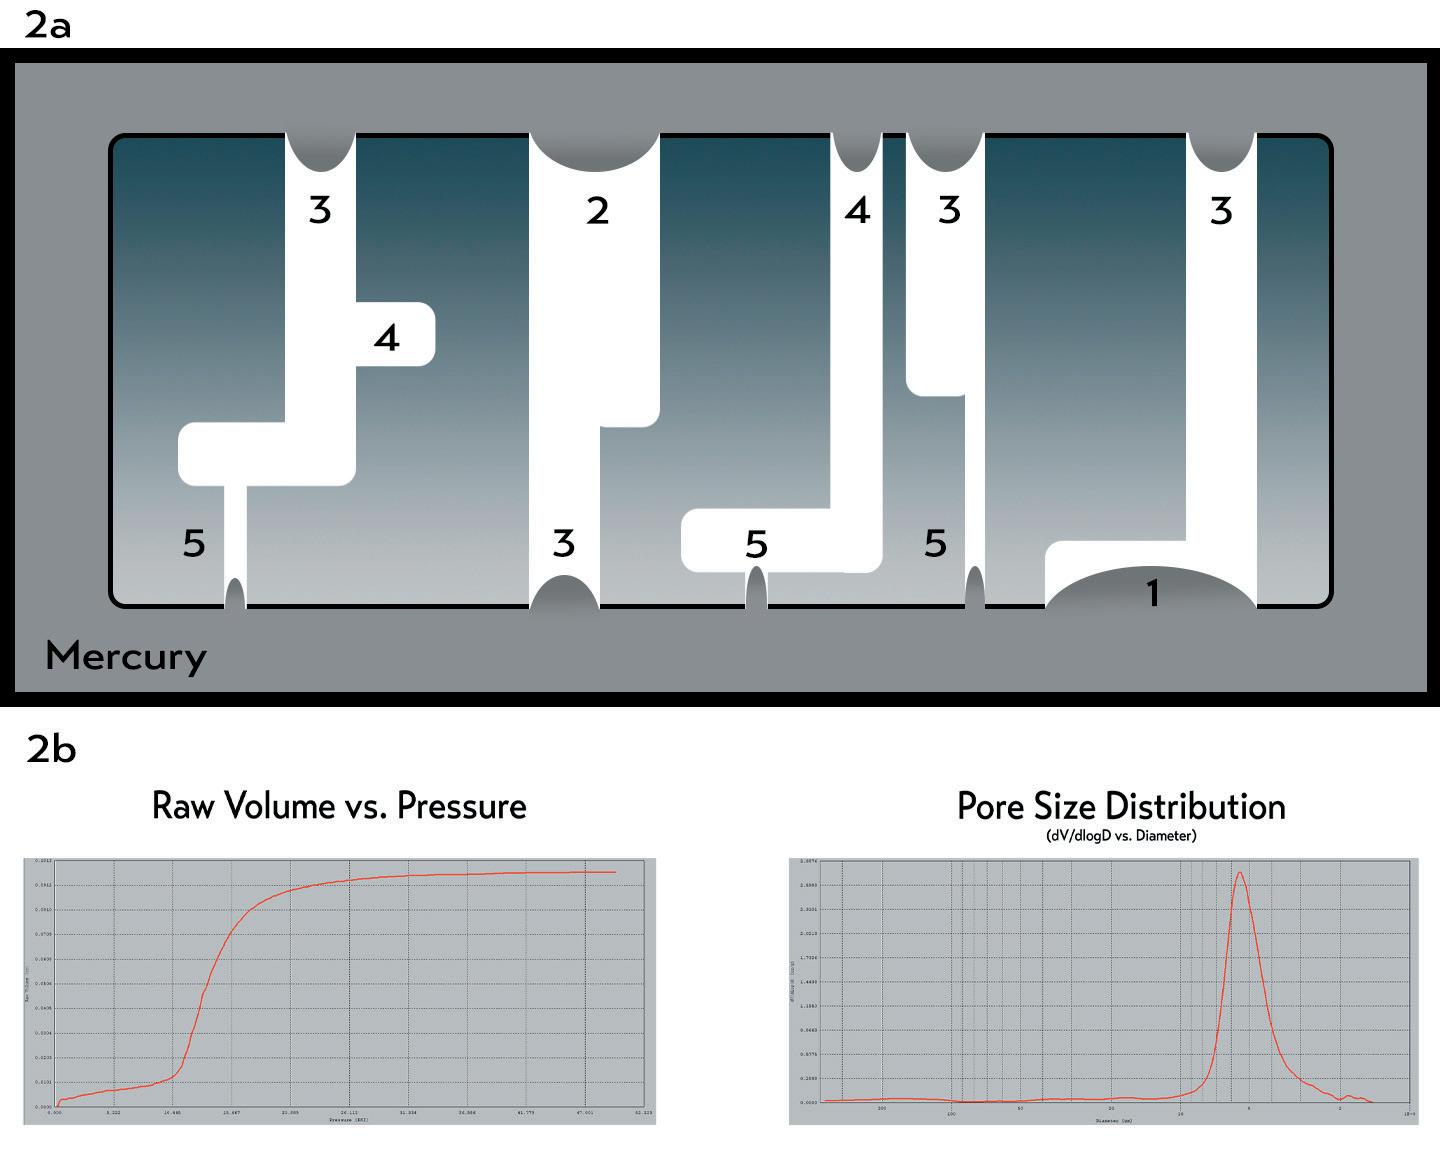
BELOW: Figure 2: a) An illustration of MIP. Pores of decreasing size are filled as the pressure on the mercury is increased: first pore number 1, then pore 2, then 3, then 4, and finally 5. b) Typical raw volume vs pressure curve and pore size distribution curve. alongside the PSD data. The MIP technique can be used to measure any sized sample (including complex shapes) provided it can be cut down to fit into the penetrometer used for the measurement.
Although CFP and MIP yield different pore size distributions, each has their own benefits. It is important to understand the differences when comparing the pore sizes of different materials; it is also essential that the same technique is used for any direct comparisons. Materials with a large proportion of dead-ended pores will have very different particle size distribution when measured with the two techniques. Samples can be remeasured using CFP technique unlike MIP. MIP is destructive — measured samples must be discarded after measurement due to the entrapment of mercury in the pores during intrusion.
CONCLUSION Fluid flow-through applications such as chromatography often require particle/ contamination filtration. Where pores of interest are through-pores, CFP is the appropriate method to predict the performance of an ultrafiltration or microfiltration media, or simply to better understand how a material will affect fluid flow. In drug delivery and dispensing applications such as eyedroppers or nasal sprays where bacterial prevention is necessary, both methods are relevant. MIP accurately measures PSD including dead-end pores to predict bacterial filtration efficiency and CFP is used to predict how the material will affect fluid flow in application.