PIC


This document is confidential and may not be reproduced or redistributed. The information presented herein has been prepared for informational purposes only and is not an offer to buy or sell, or a solicitation of an offer to buy or sell any security or fund interest or any financial instrument and is not to be considered investment advice. This presentation is for institutional use only and is not to be distributed to any party other than its intended recipient.
The following materials present information regarding a proposed creation of a special purpose vehicle (the “Issuer”) which would offer securities (the “Securities”) to finance its acquisition of a portfolio of financial assets to be selected and managed by the portfolio manager referred to herein (the “Manager”). These materials have been prepared to provide preliminary information about the Issuer and the transactions described herein to a limited number of potential underwriters of the Securities for the sole purpose of assisting them to determine whether they have an interest in underwriting the Securities.

The views and opinions expressed in this presentation are those of PassiveInvesting.com, LLC. and are subject to change based on market and other conditions. Although the information presented herein has been obtained from and is based upon sources PassiveInvesting.com believe to be reliable, no representation or warranty, expressed or implied, is made as to the accuracy or completeness of that information. No assurance can be given that the investment objectives described herein will be achieved. Reliance upon information in this material is at the sole discretion of the reader.
This data is for illustrative purposes only. Past performance of indices of asset classes does not represent actual returns or volatility of actual accounts or investment managers, and should not be viewed as indicative of future results. The investments discussed may fluctuate in price or value. Investors may get back less than they invested.
Forward-looking information contained in these materials is subject to certain inherent limitations. Such information is information that is not purely historical in nature and may include, among other things, expected structural features, anticipated ratings, proposed or target portfolio composition, proposed diversification or sector investment, specific investment strategies and forecasts of future market or economic conditions. The forward-looking information contained herein is based upon certain assumptions, which are unlikely to be consistent with, and may differ materially from, actual events and conditions. In addition, not all relevant events or conditions may have been considered in developing such assumptions. Accordingly, actual results will vary and the variations may be material. Prospective investors should understand such assumptions and evaluate whether they are appropriate for their purposes. These materials may also contain historical market data; however, historical market trends are not reliable indicators of future market behavior.
Information in these materials about the Manager, its affiliates and their personnel and affiliates and the historical performance of portfolios it has managed has been supplied by the Manager to provide prospective investors with information as to its general portfolio management experience and may not be viewed as a promise or indicator of the Issuer’s future results. Such information and its limitations are discussed further in the sections of these materials in which such information is presented.
Past performance of indices or asset classes does not represent actual returns or volatility of actual accounts or investment managers and should not be viewed as indicative of future results. The comparisons herein of the performances of the market indicators, benchmarks or indices may not be meaningful since the constitution and risks associated with each market indicator, benchmark, or index may be significantly different. Accordingly, no representation or warranty is made to the sufficiency, relevance, important, appropriateness, completeness, or comprehensiveness of the market data, information, or summaries contained herein for any specific purpose.
Past performance is not indicative of comparable future results. Given the inherent volatility of the securities markets, it should not be assumed that investors will experience returns comparable to those shown here. Market and economic conditions may change in the future producing materially different results than those shown here. All investments have inherent risks.
PassiveInvesting.com. All Rights Reserved. No part of this document may be reproduced, stored, or transmitted by any means with the express written consent of PassiveInvesting.com.

The following information is an investment summary provided to prospective investors and others. This information is not an offering to sell either a security or a solicitation to sell a security. At the request of a recipient, the Company will provide a private placement memorandum, subscription agreement and the Limited Liability Company Operating Agreement. The Managing Member in no way guarantees the projections contained herein. Real estate values, income, expenses and development costs are all affected by a multitude of forces outside the Managing Member’s control. This investment is illiquid and only those persons that are able and willing to risk their entire investment should participate. Please consult your attorney, CPA and/or professional financial advisor regarding the suitability of an investment by you.
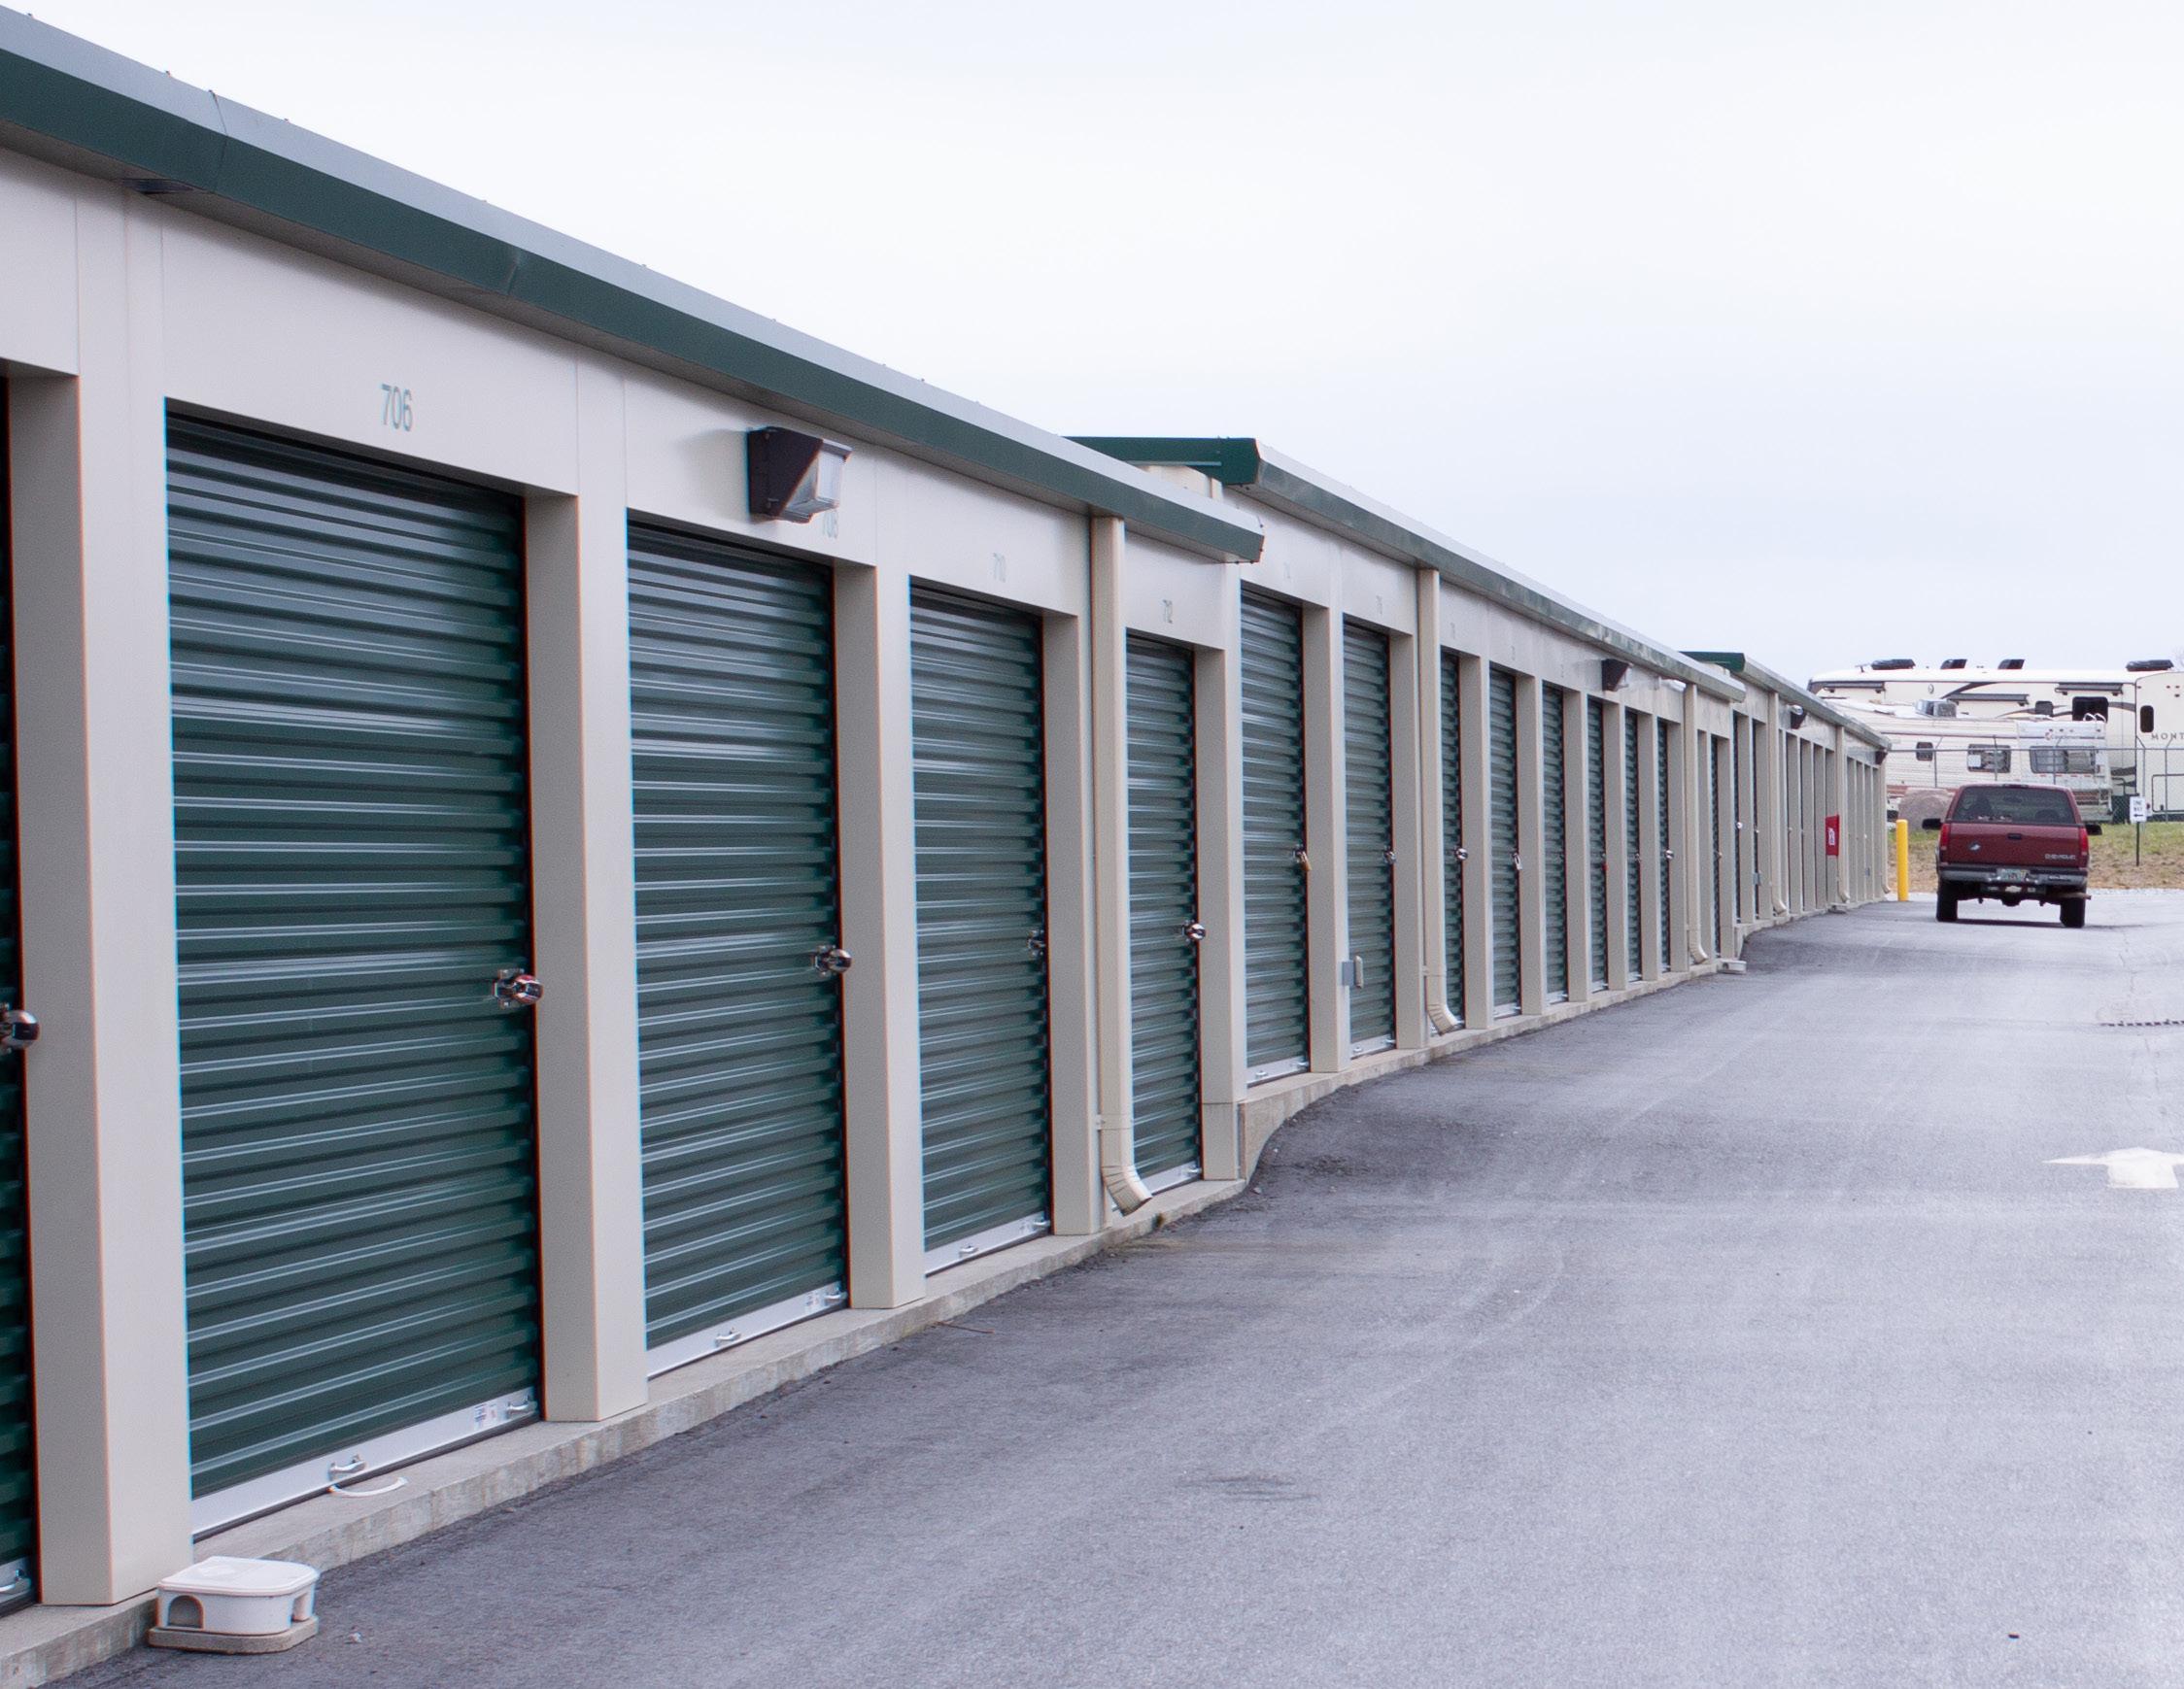

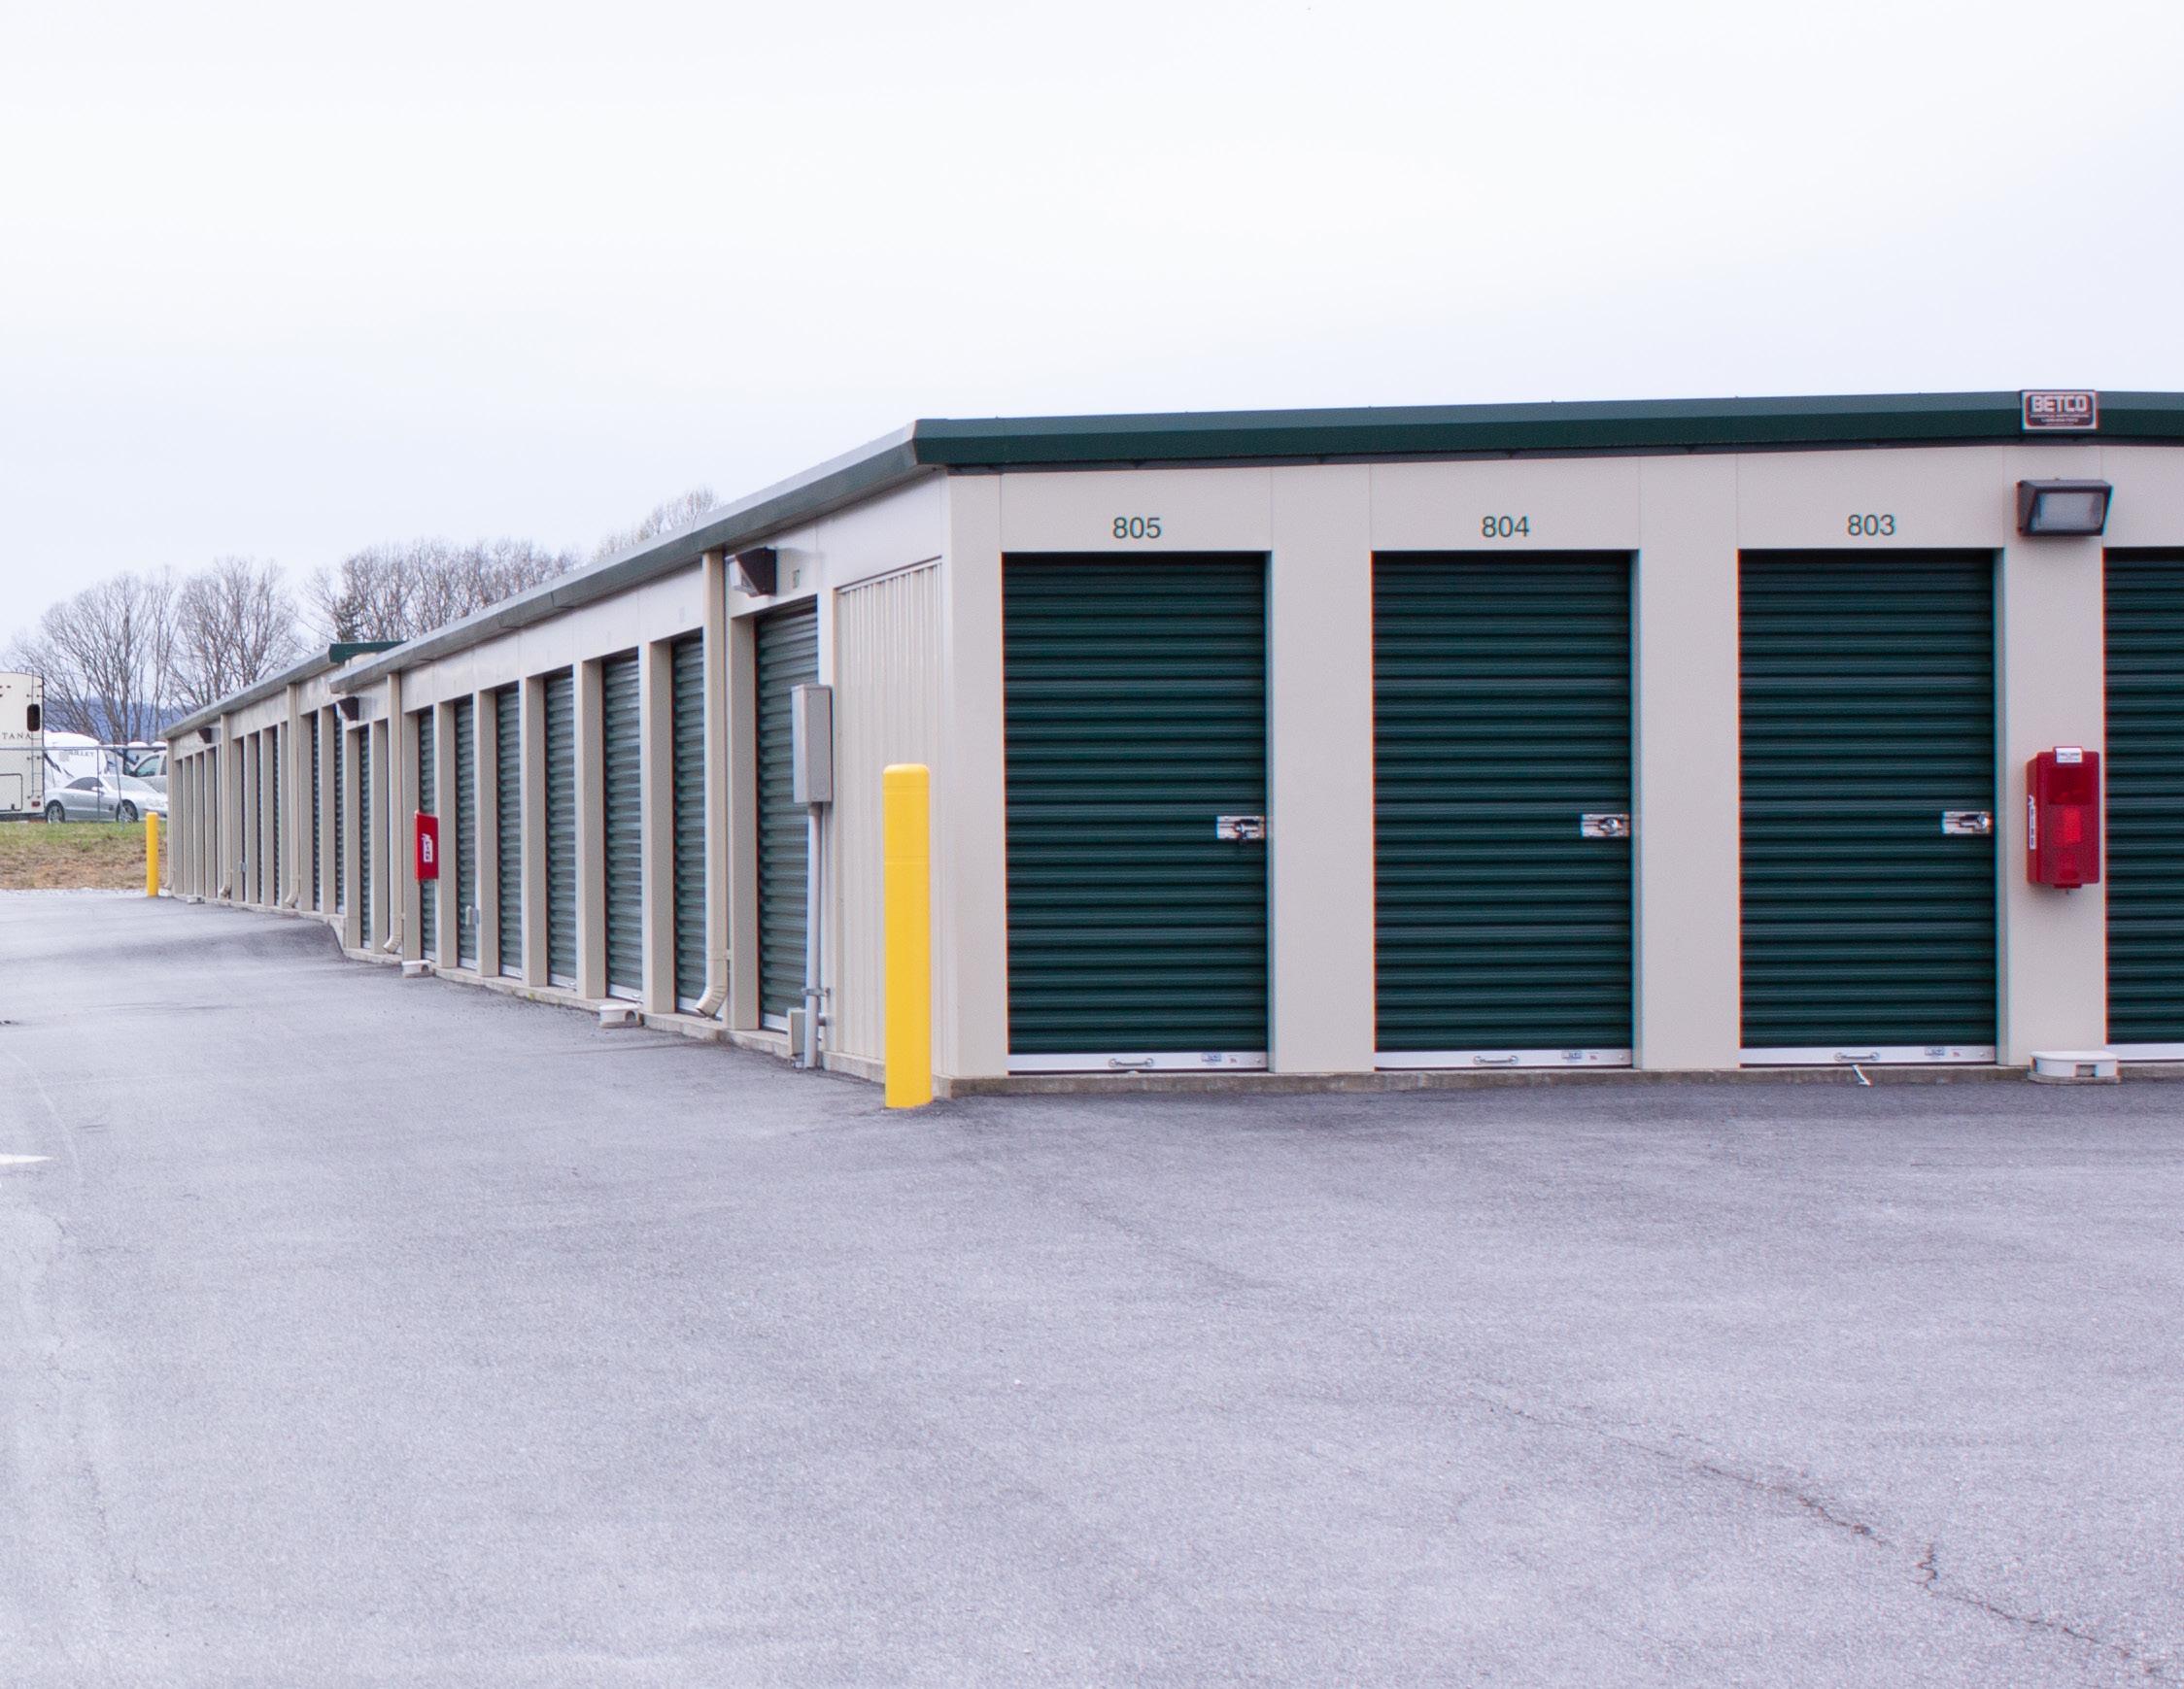

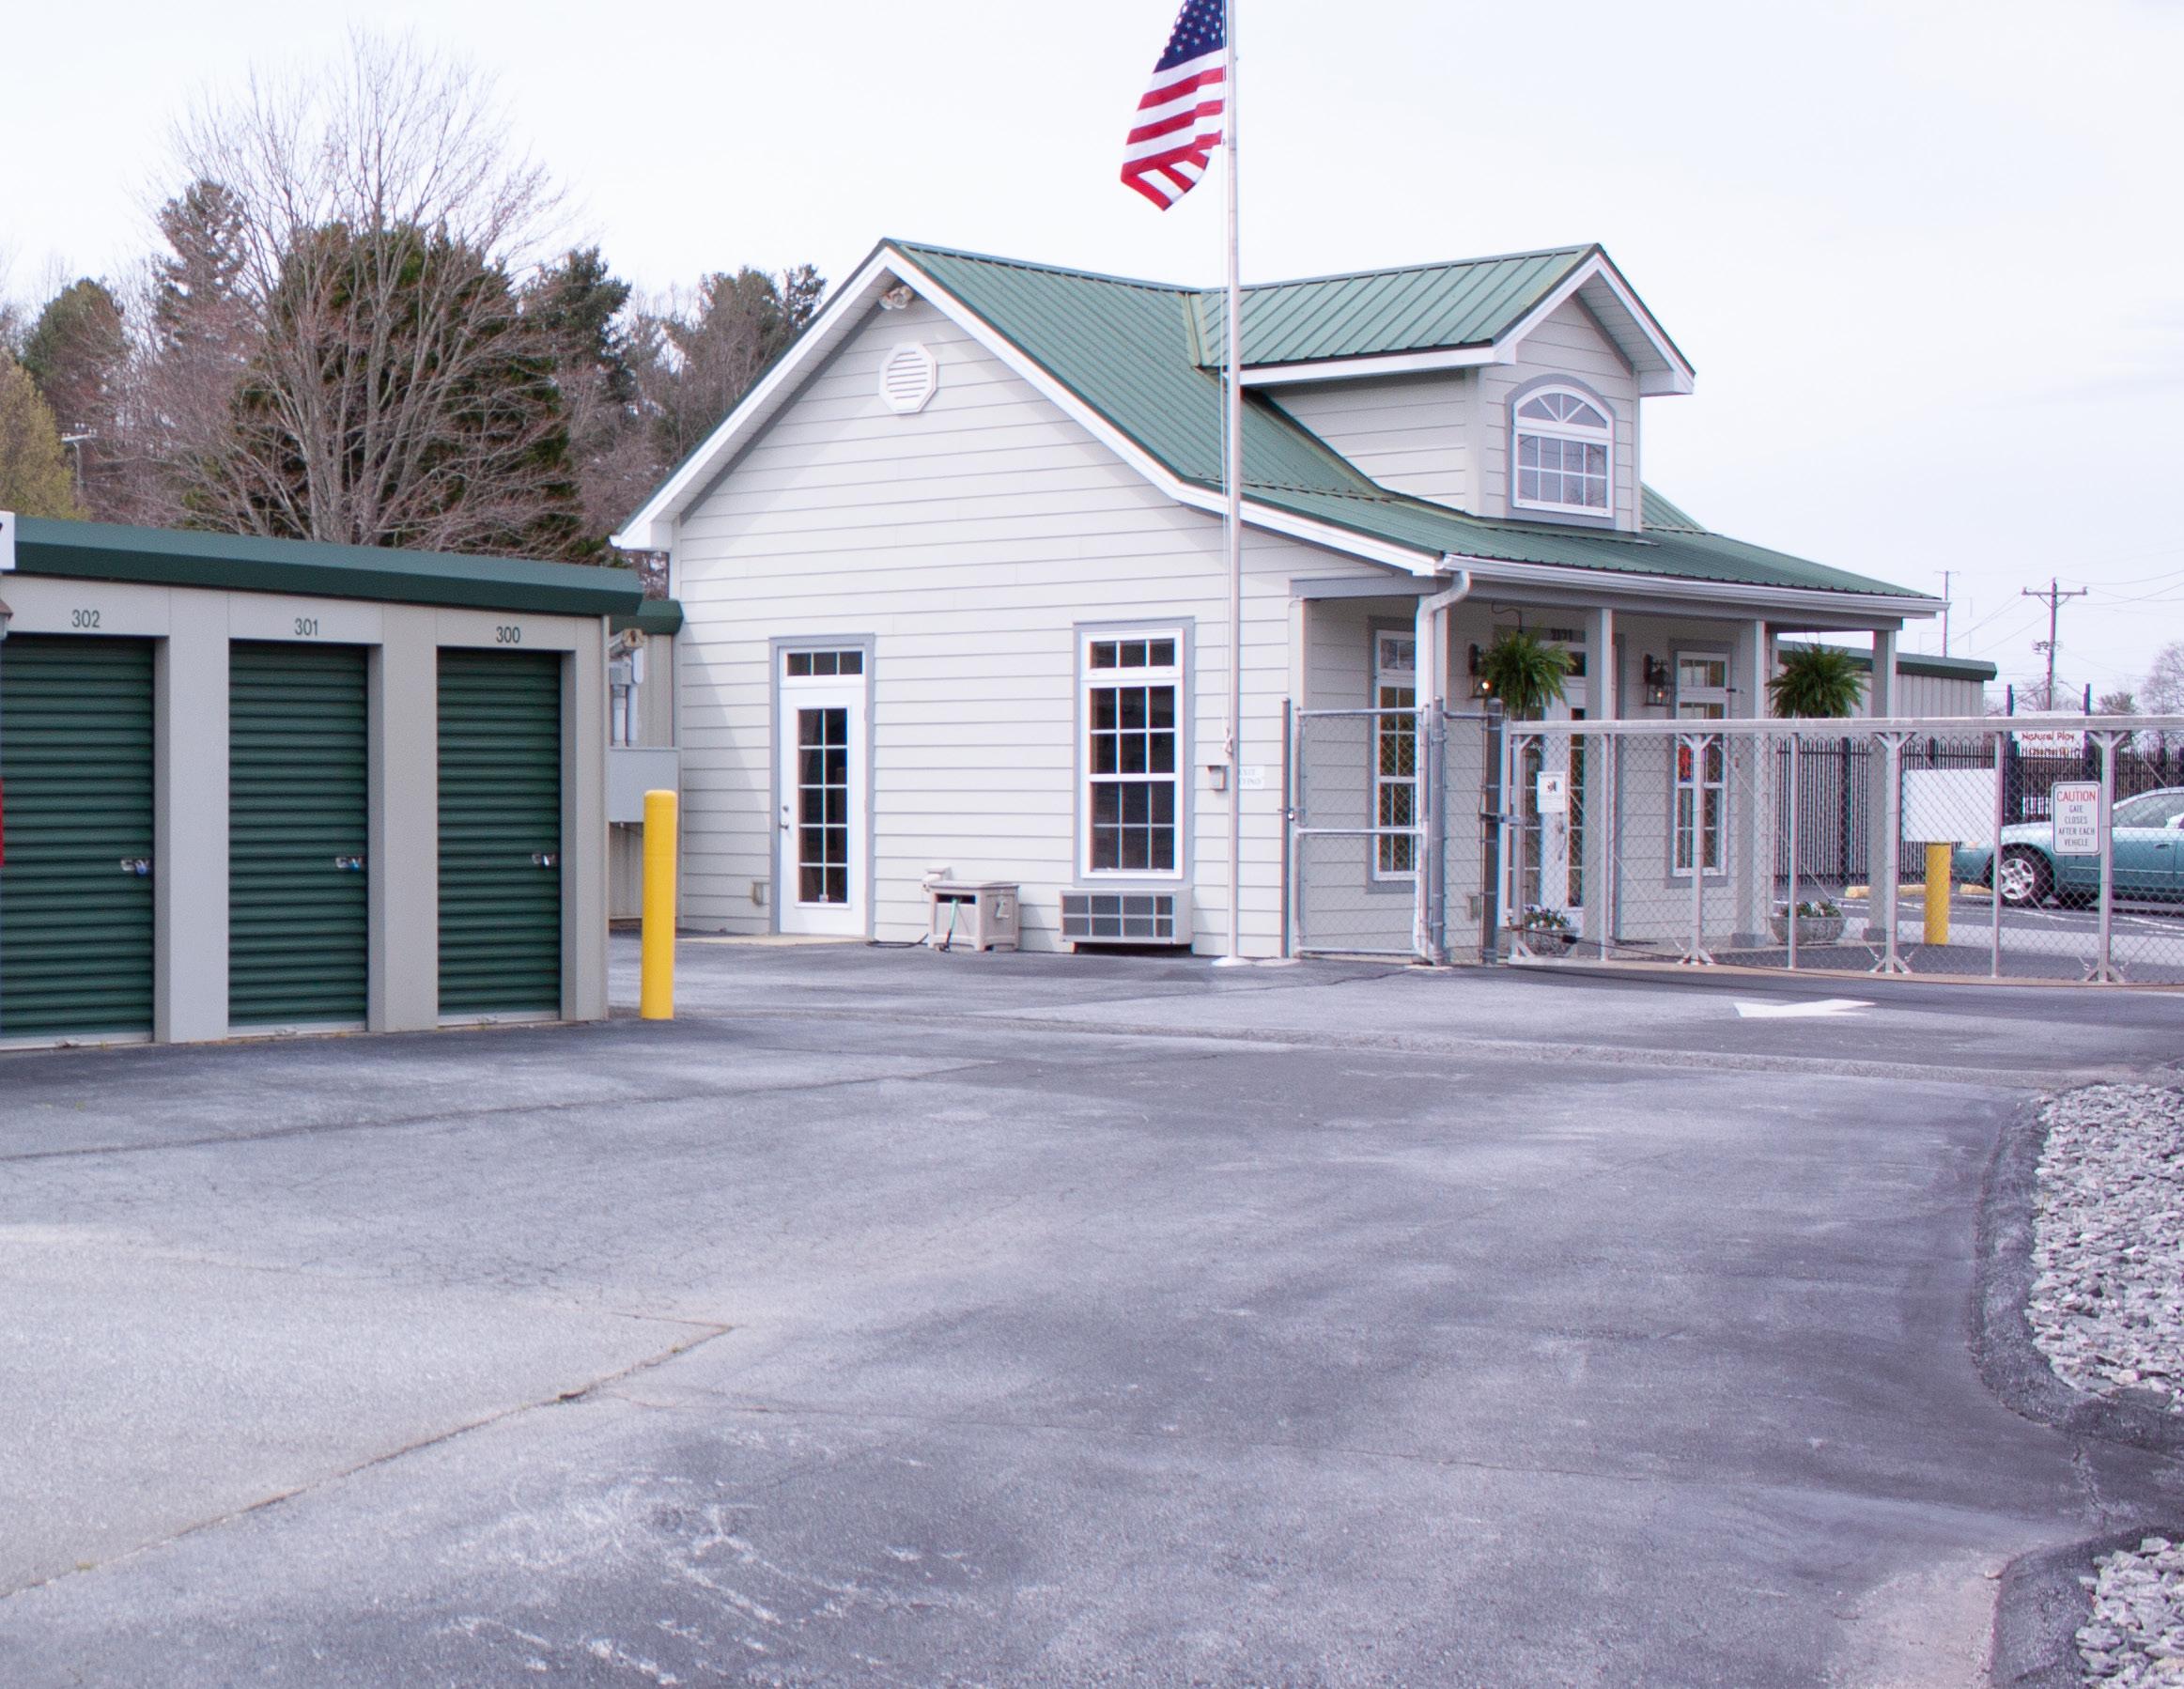

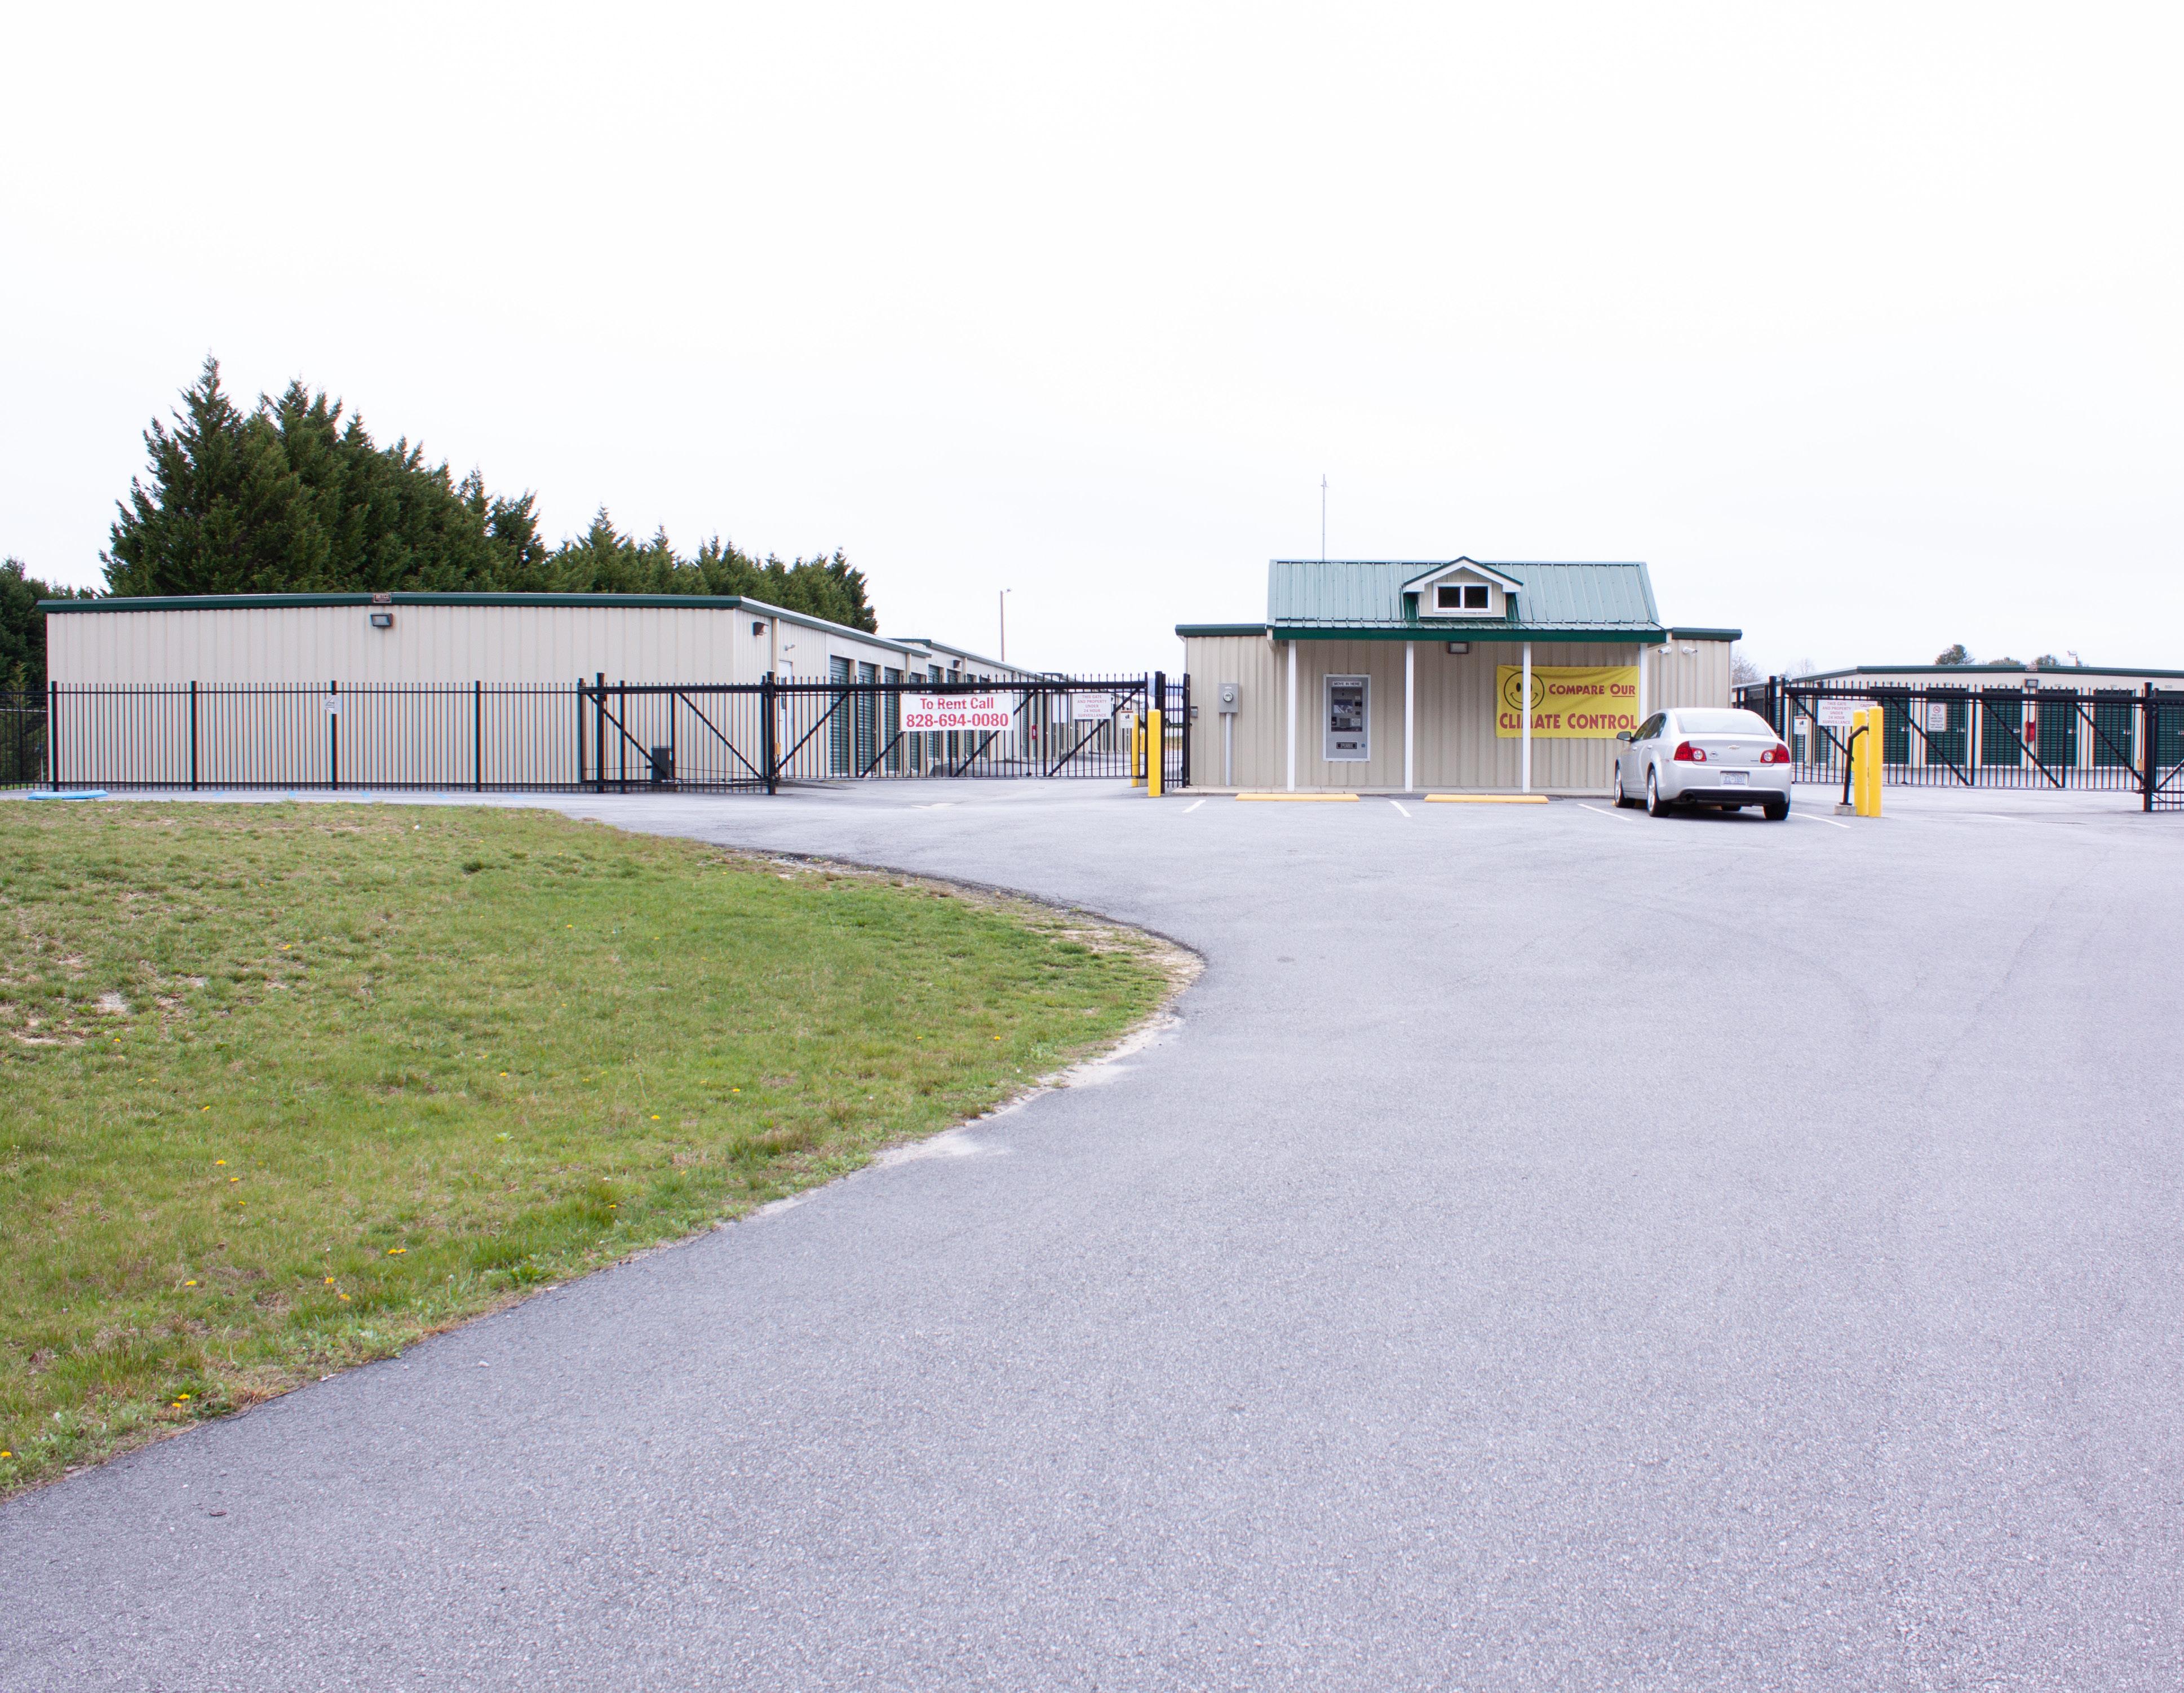
The PassiveInvesting.com Team has identified the three selfstorage locations for the
Storage 2 portfolio for acquisition.
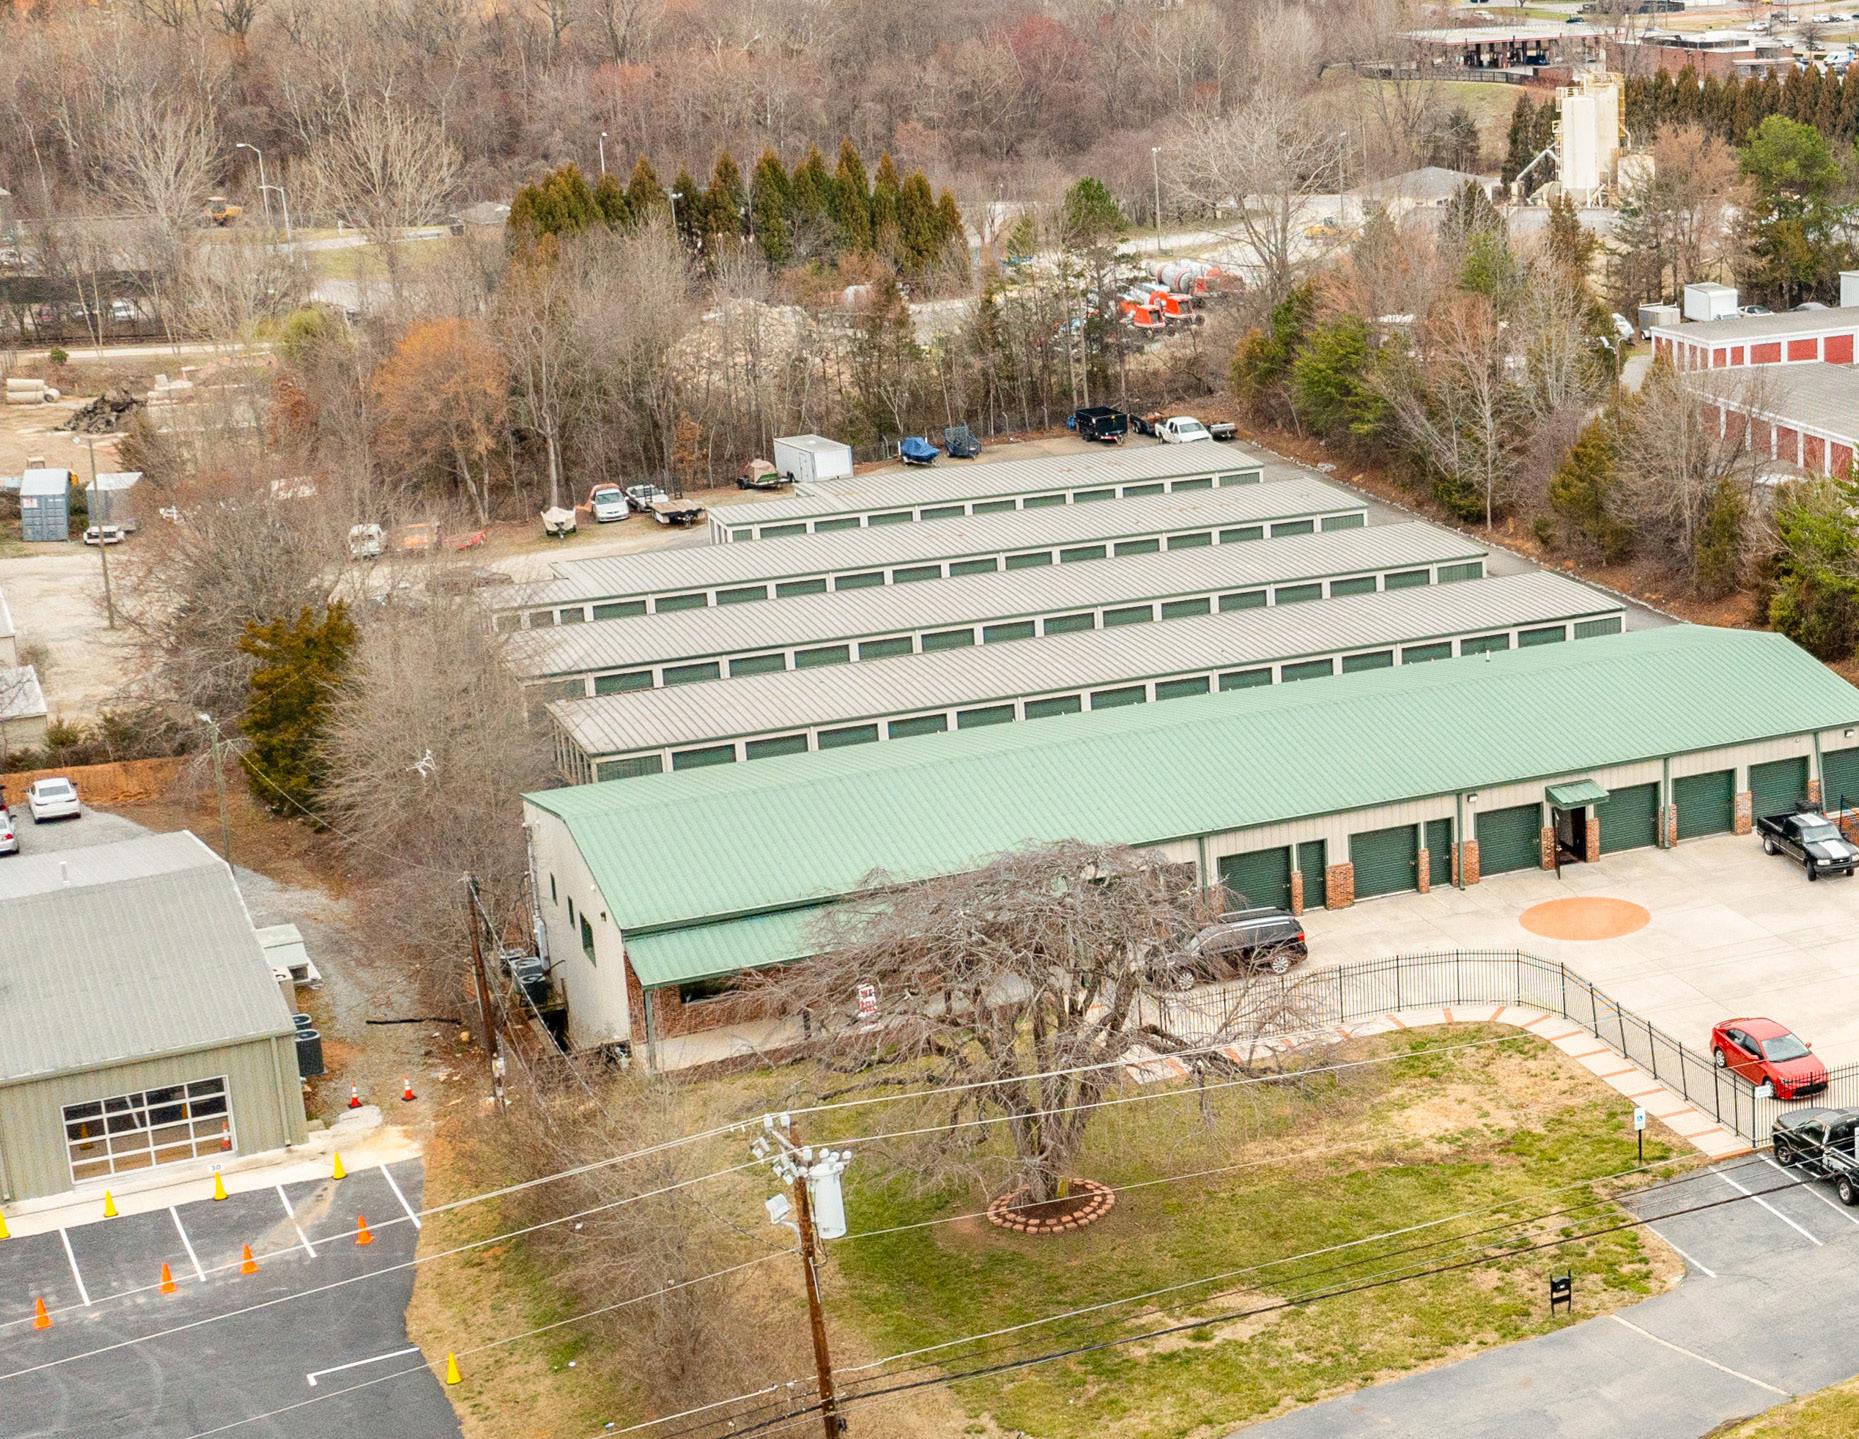
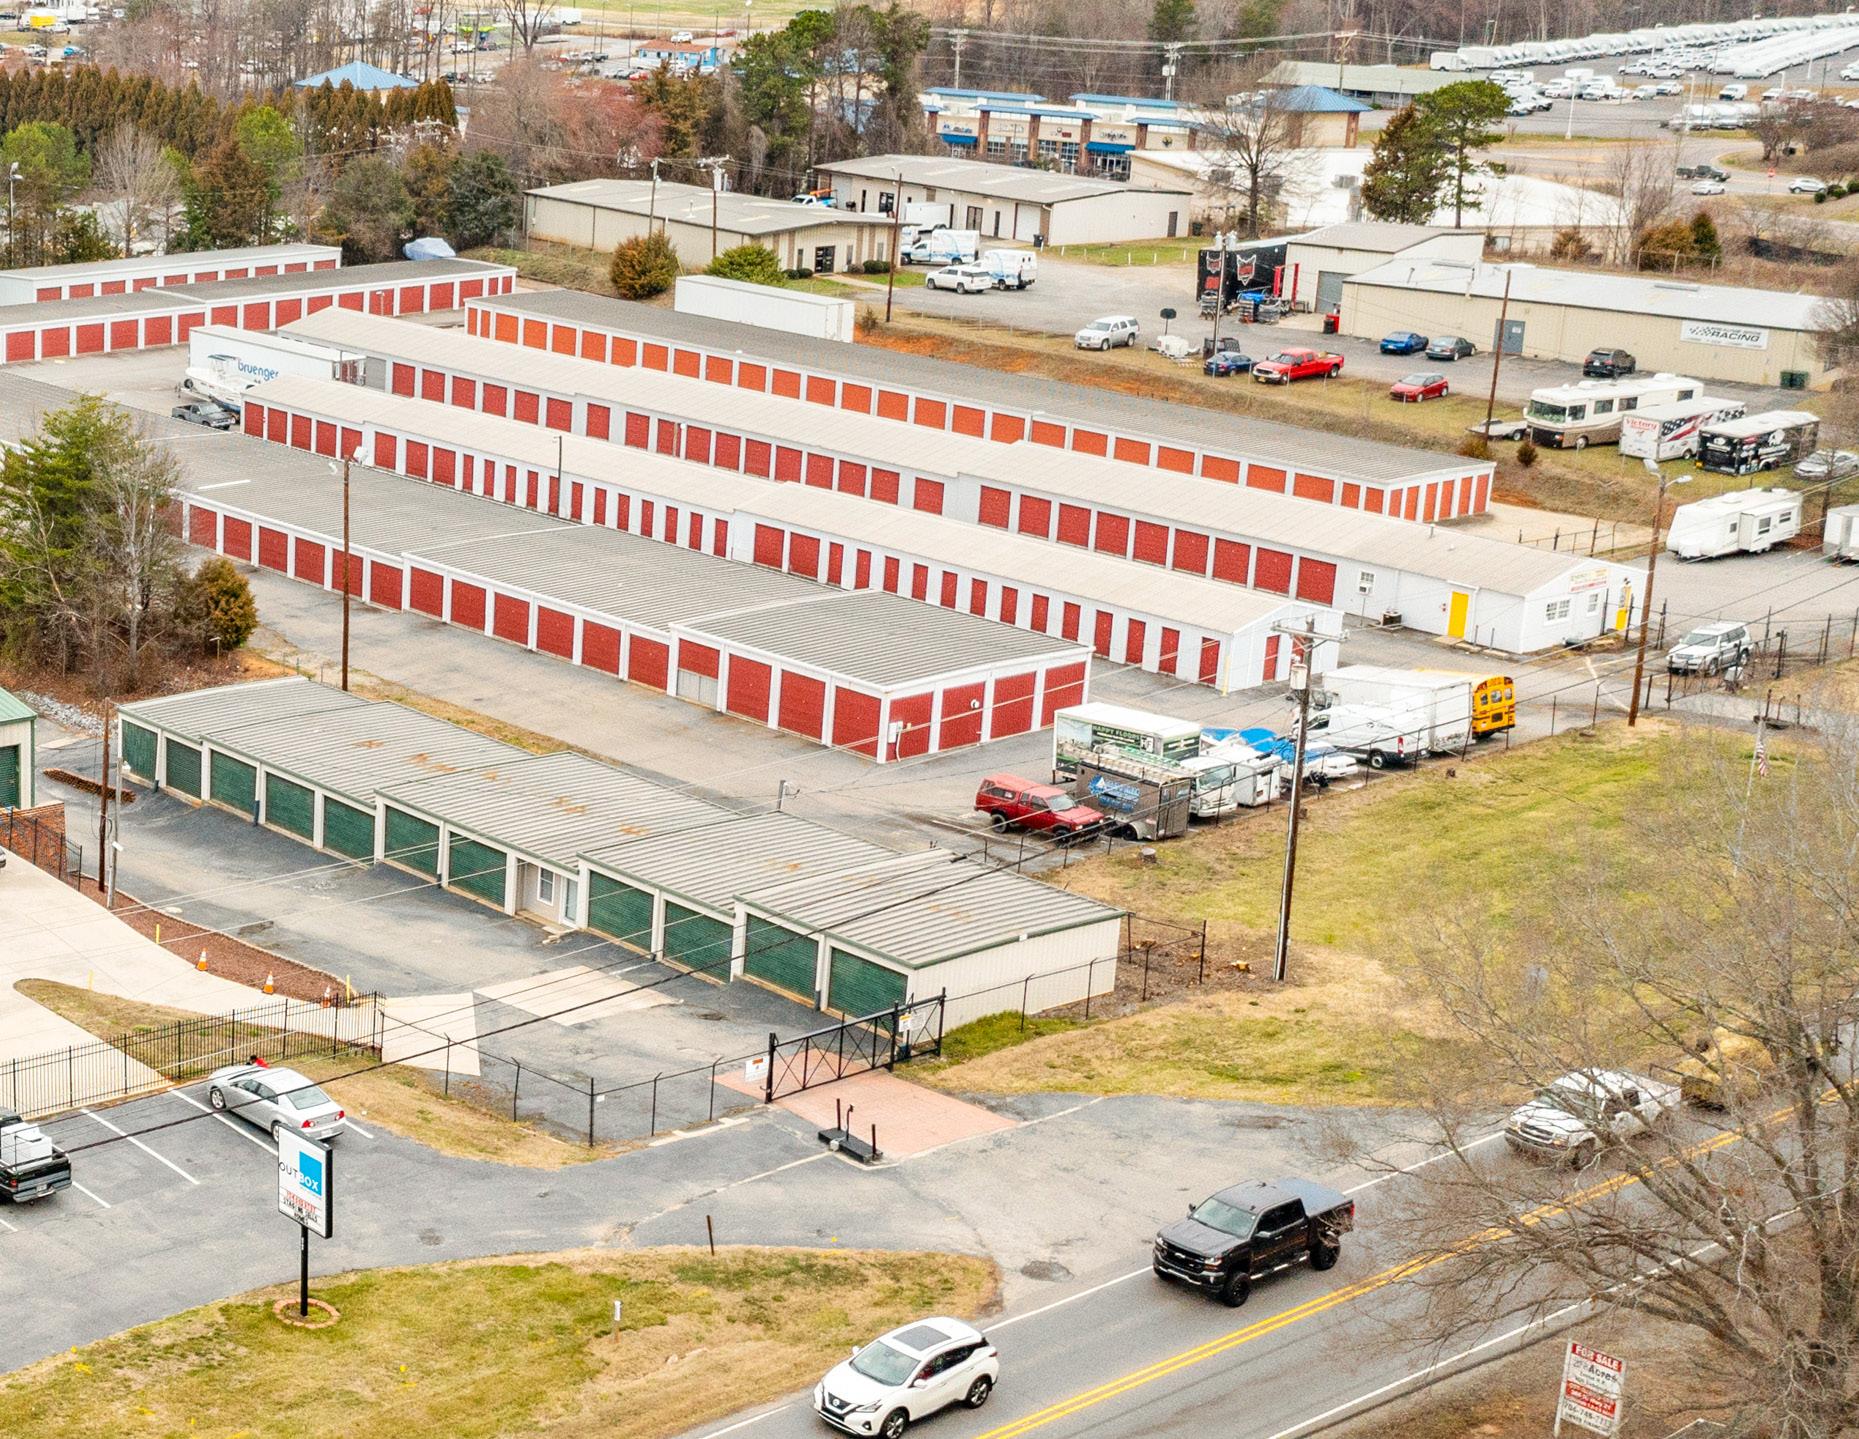
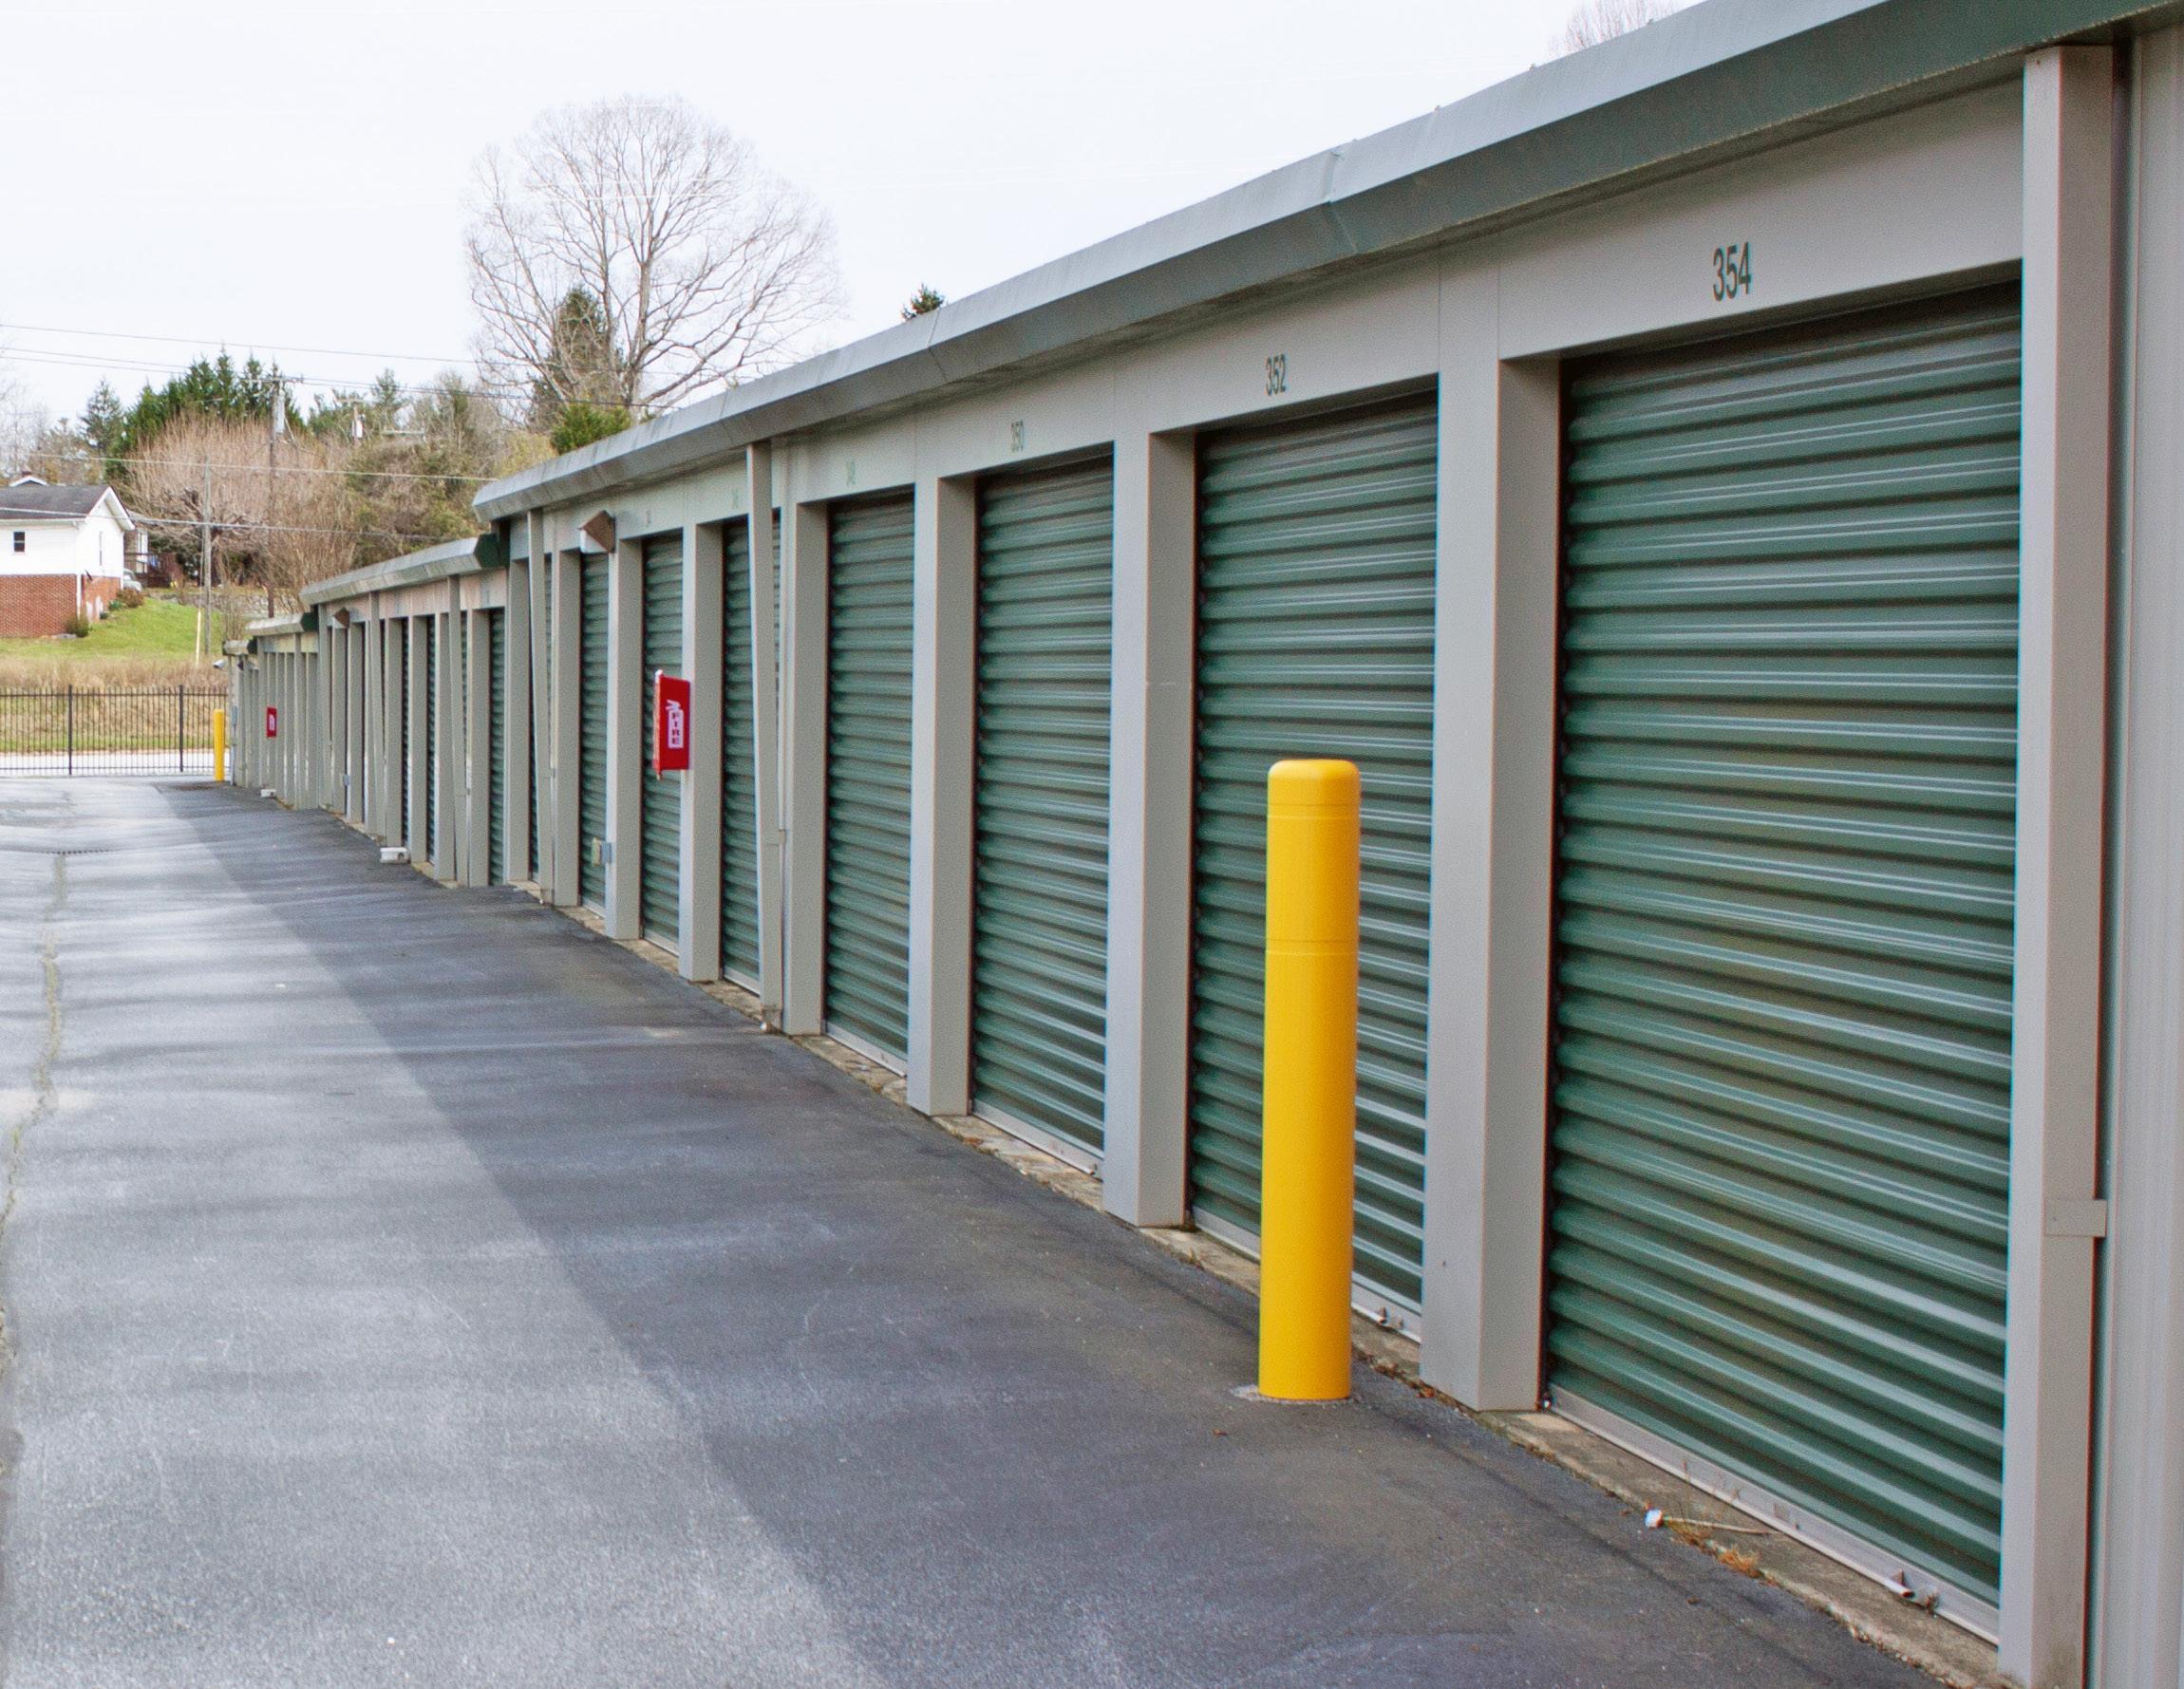
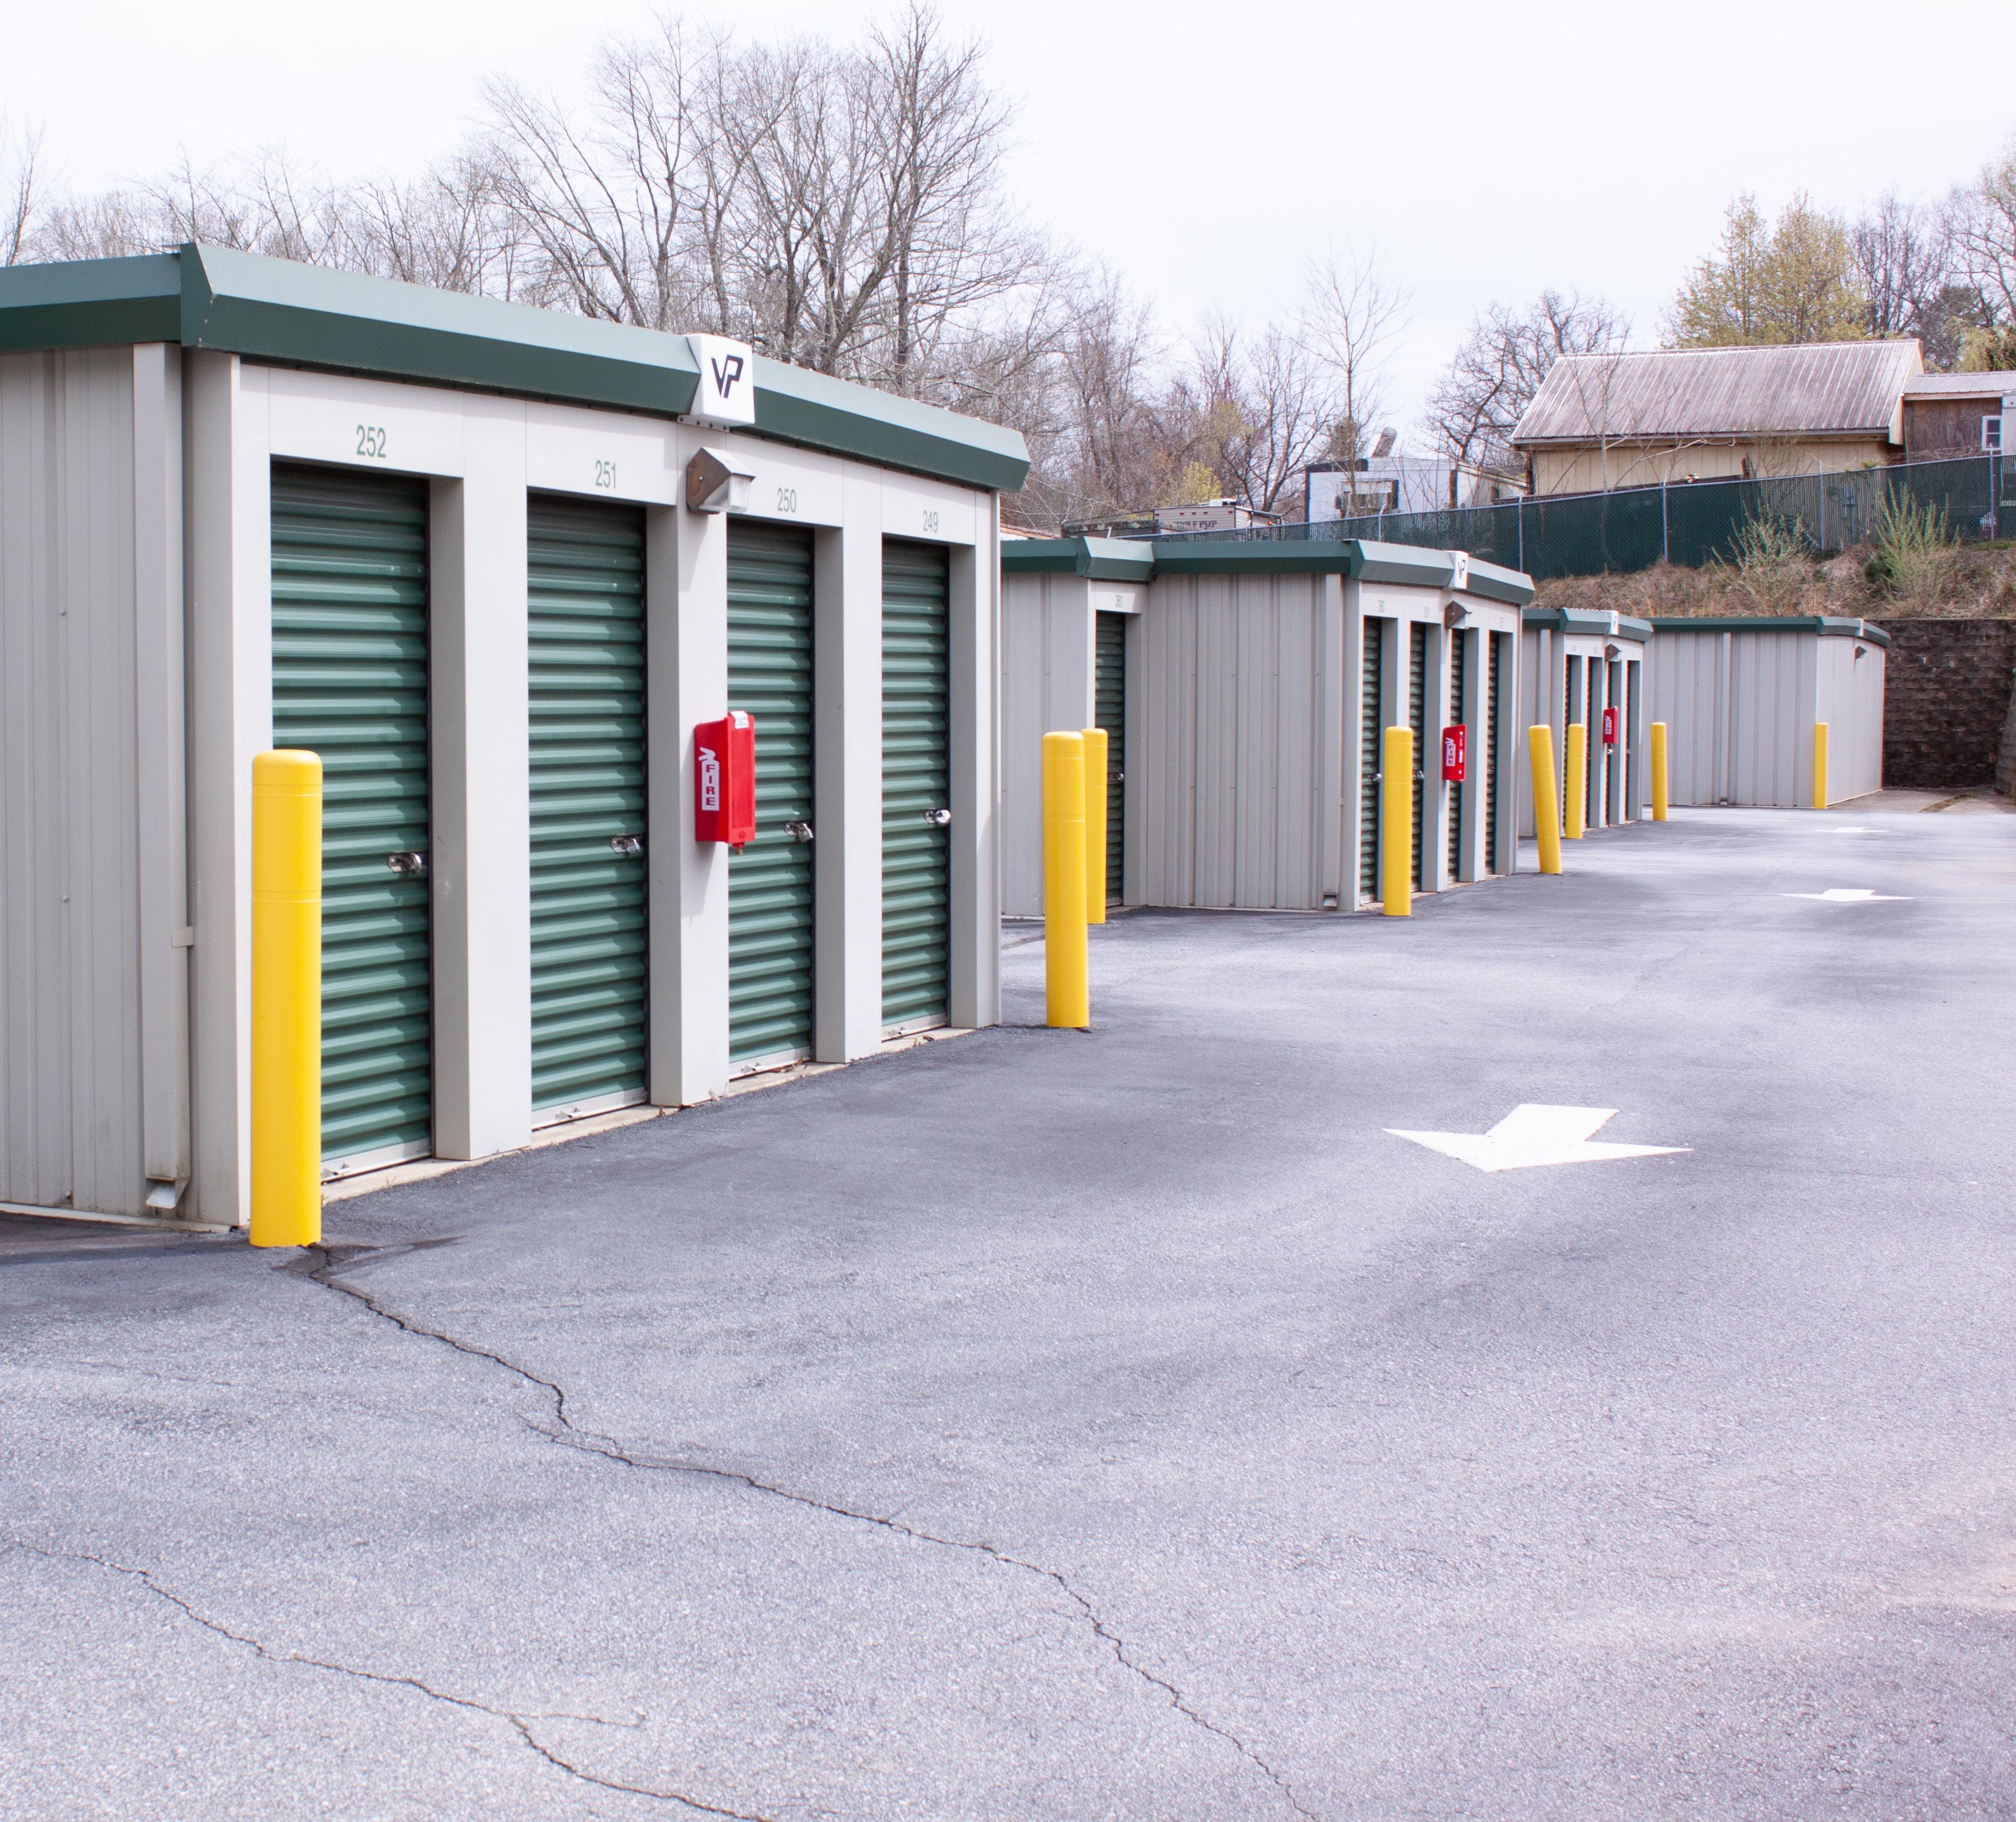
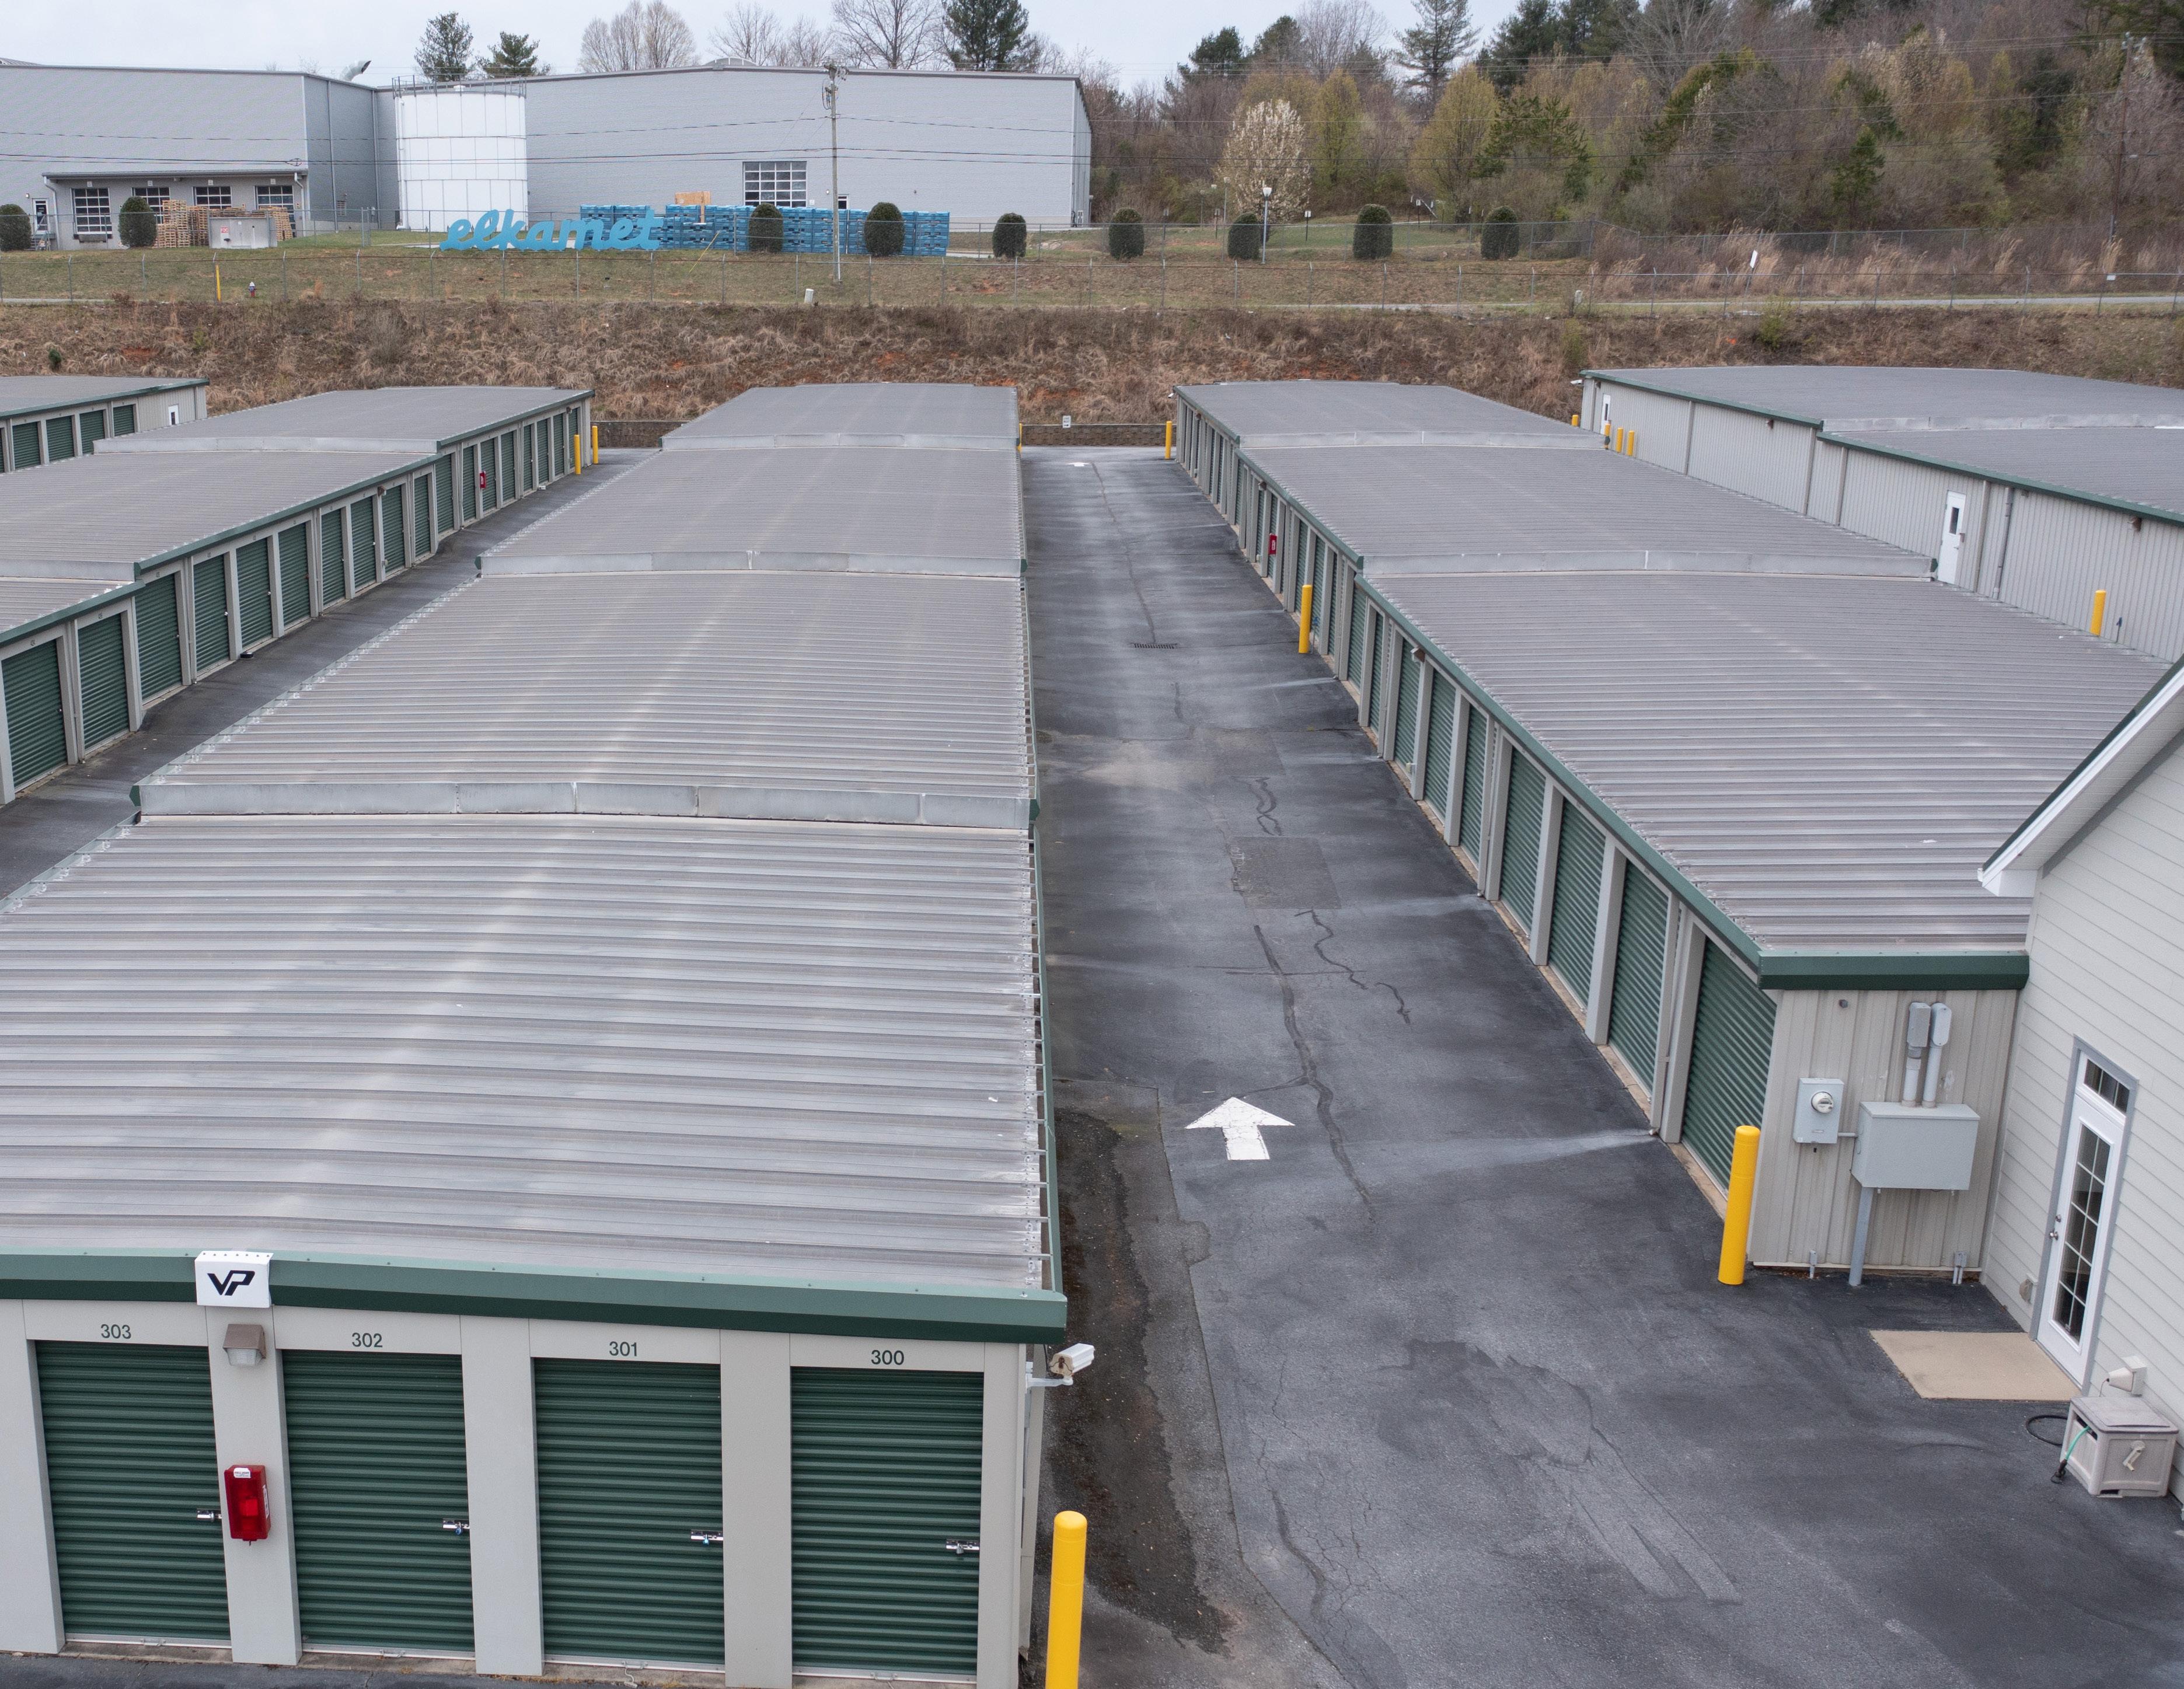
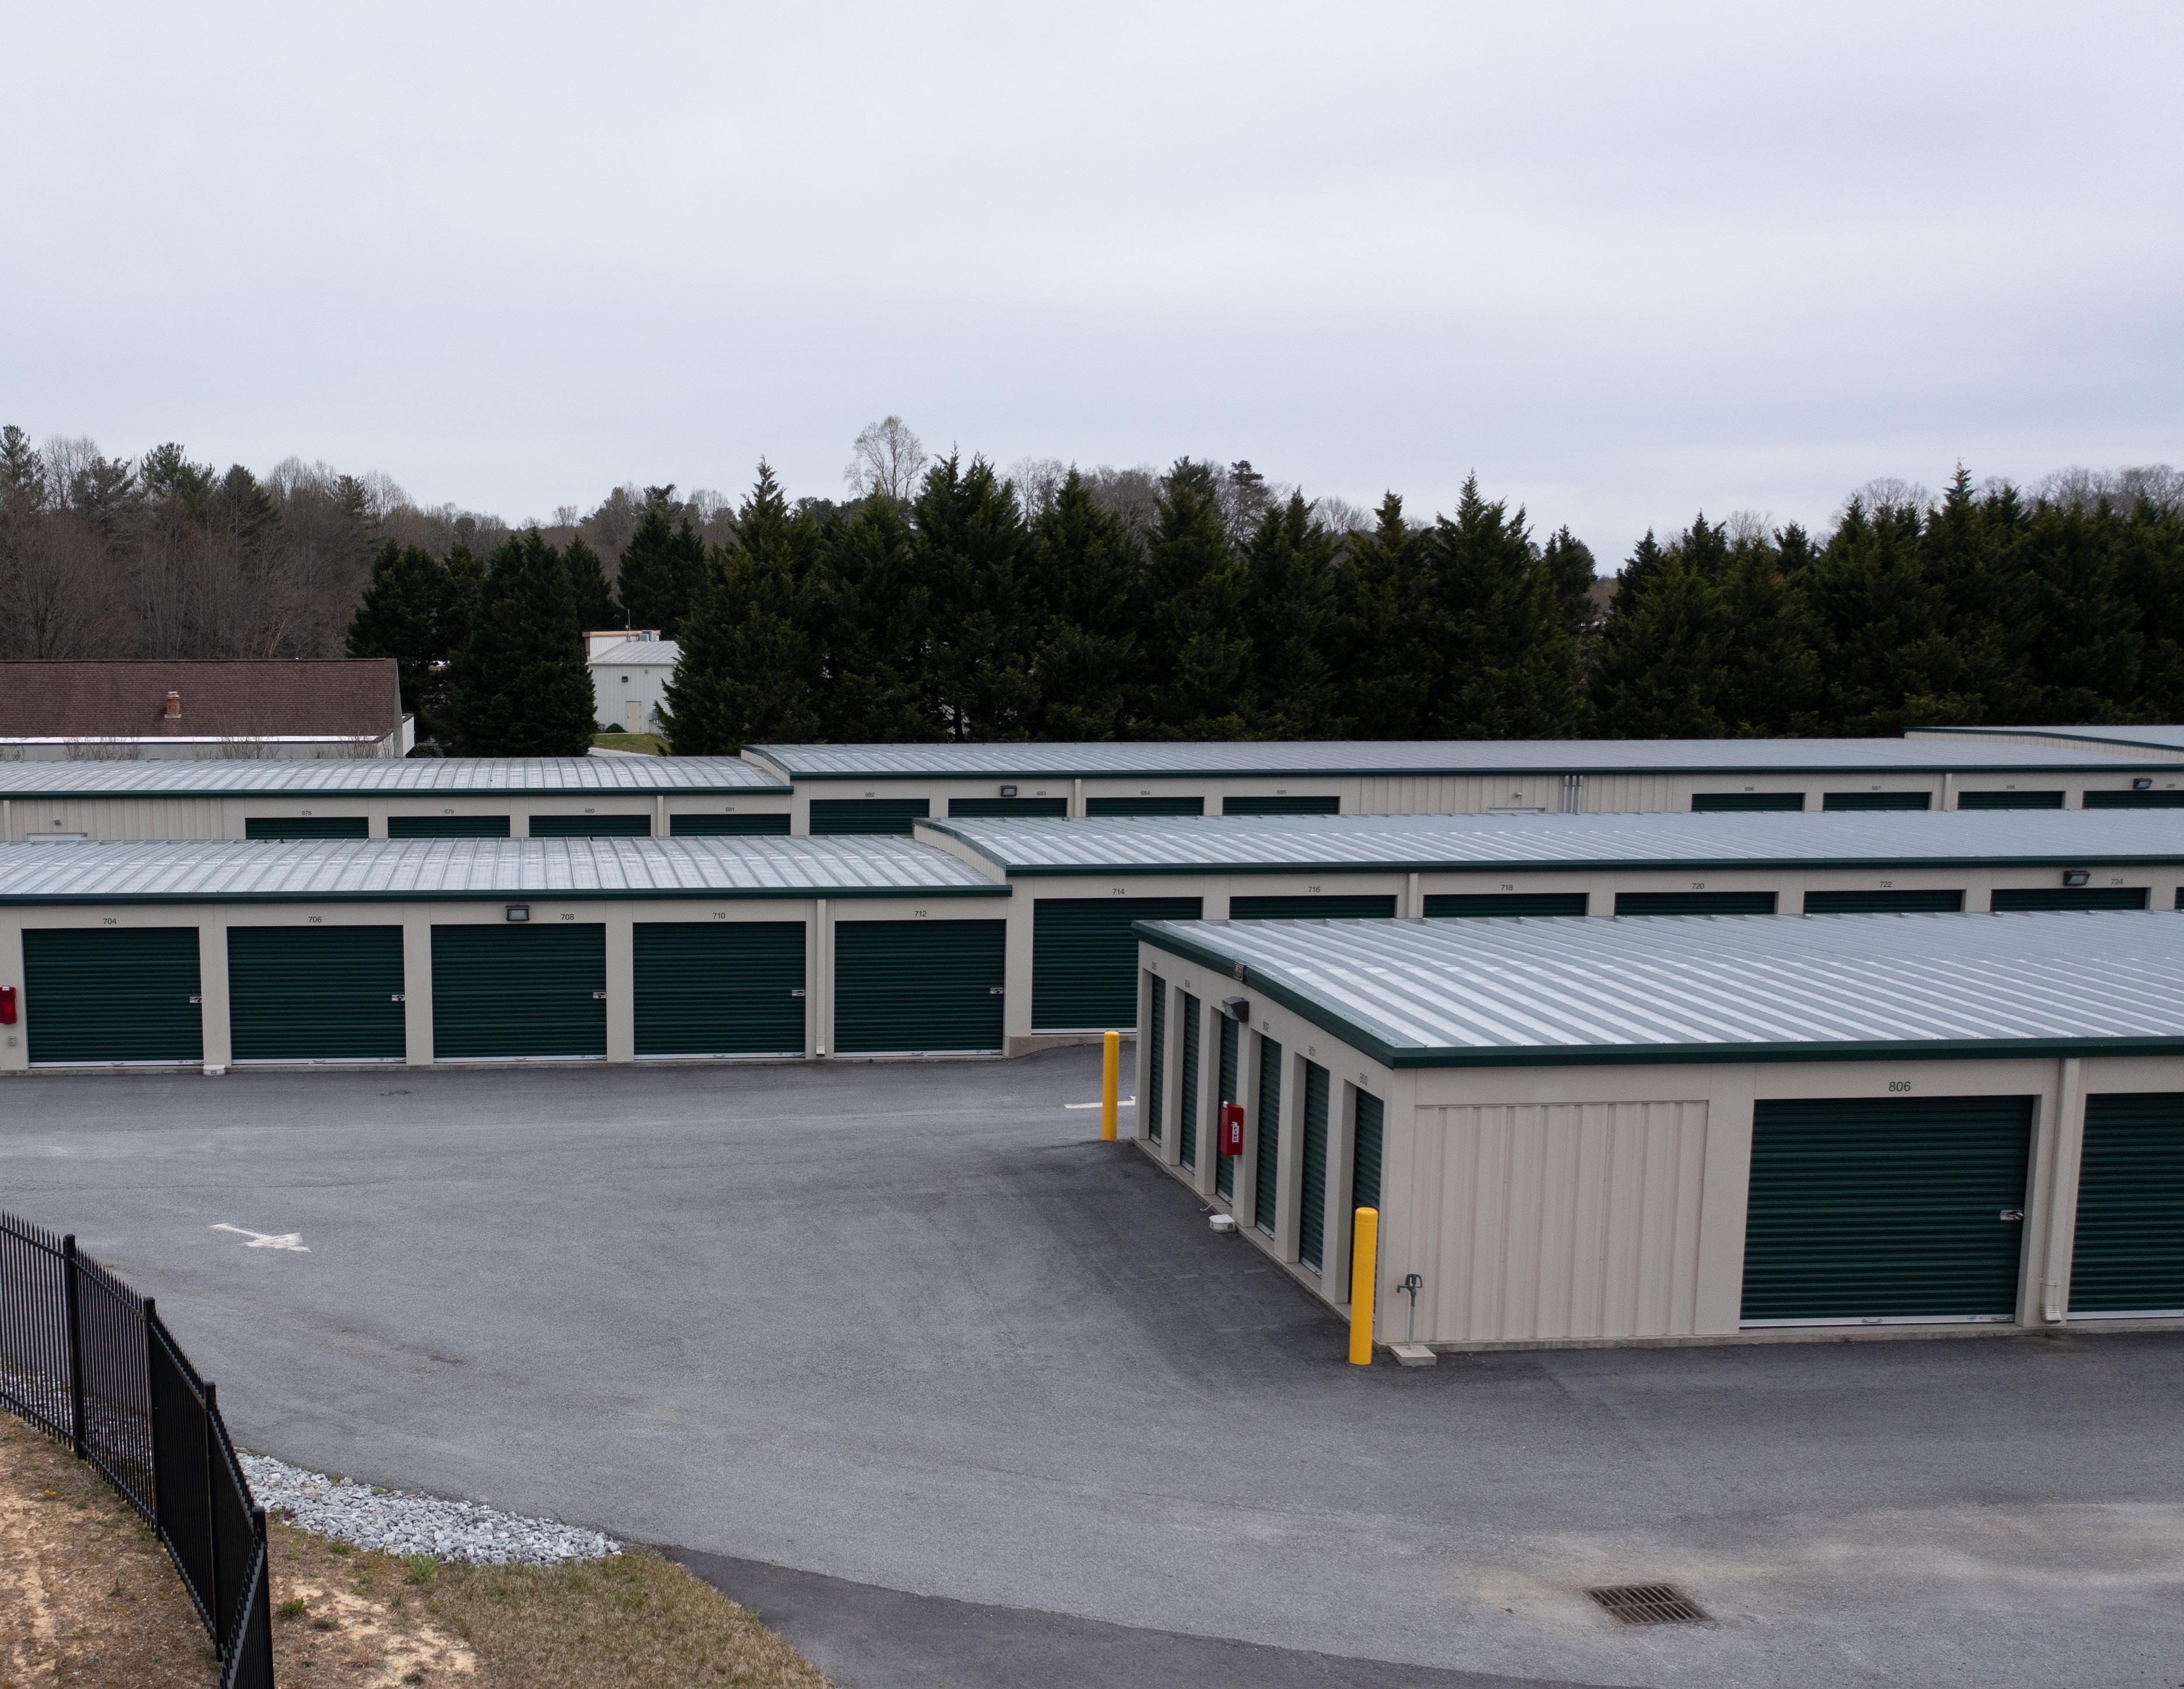
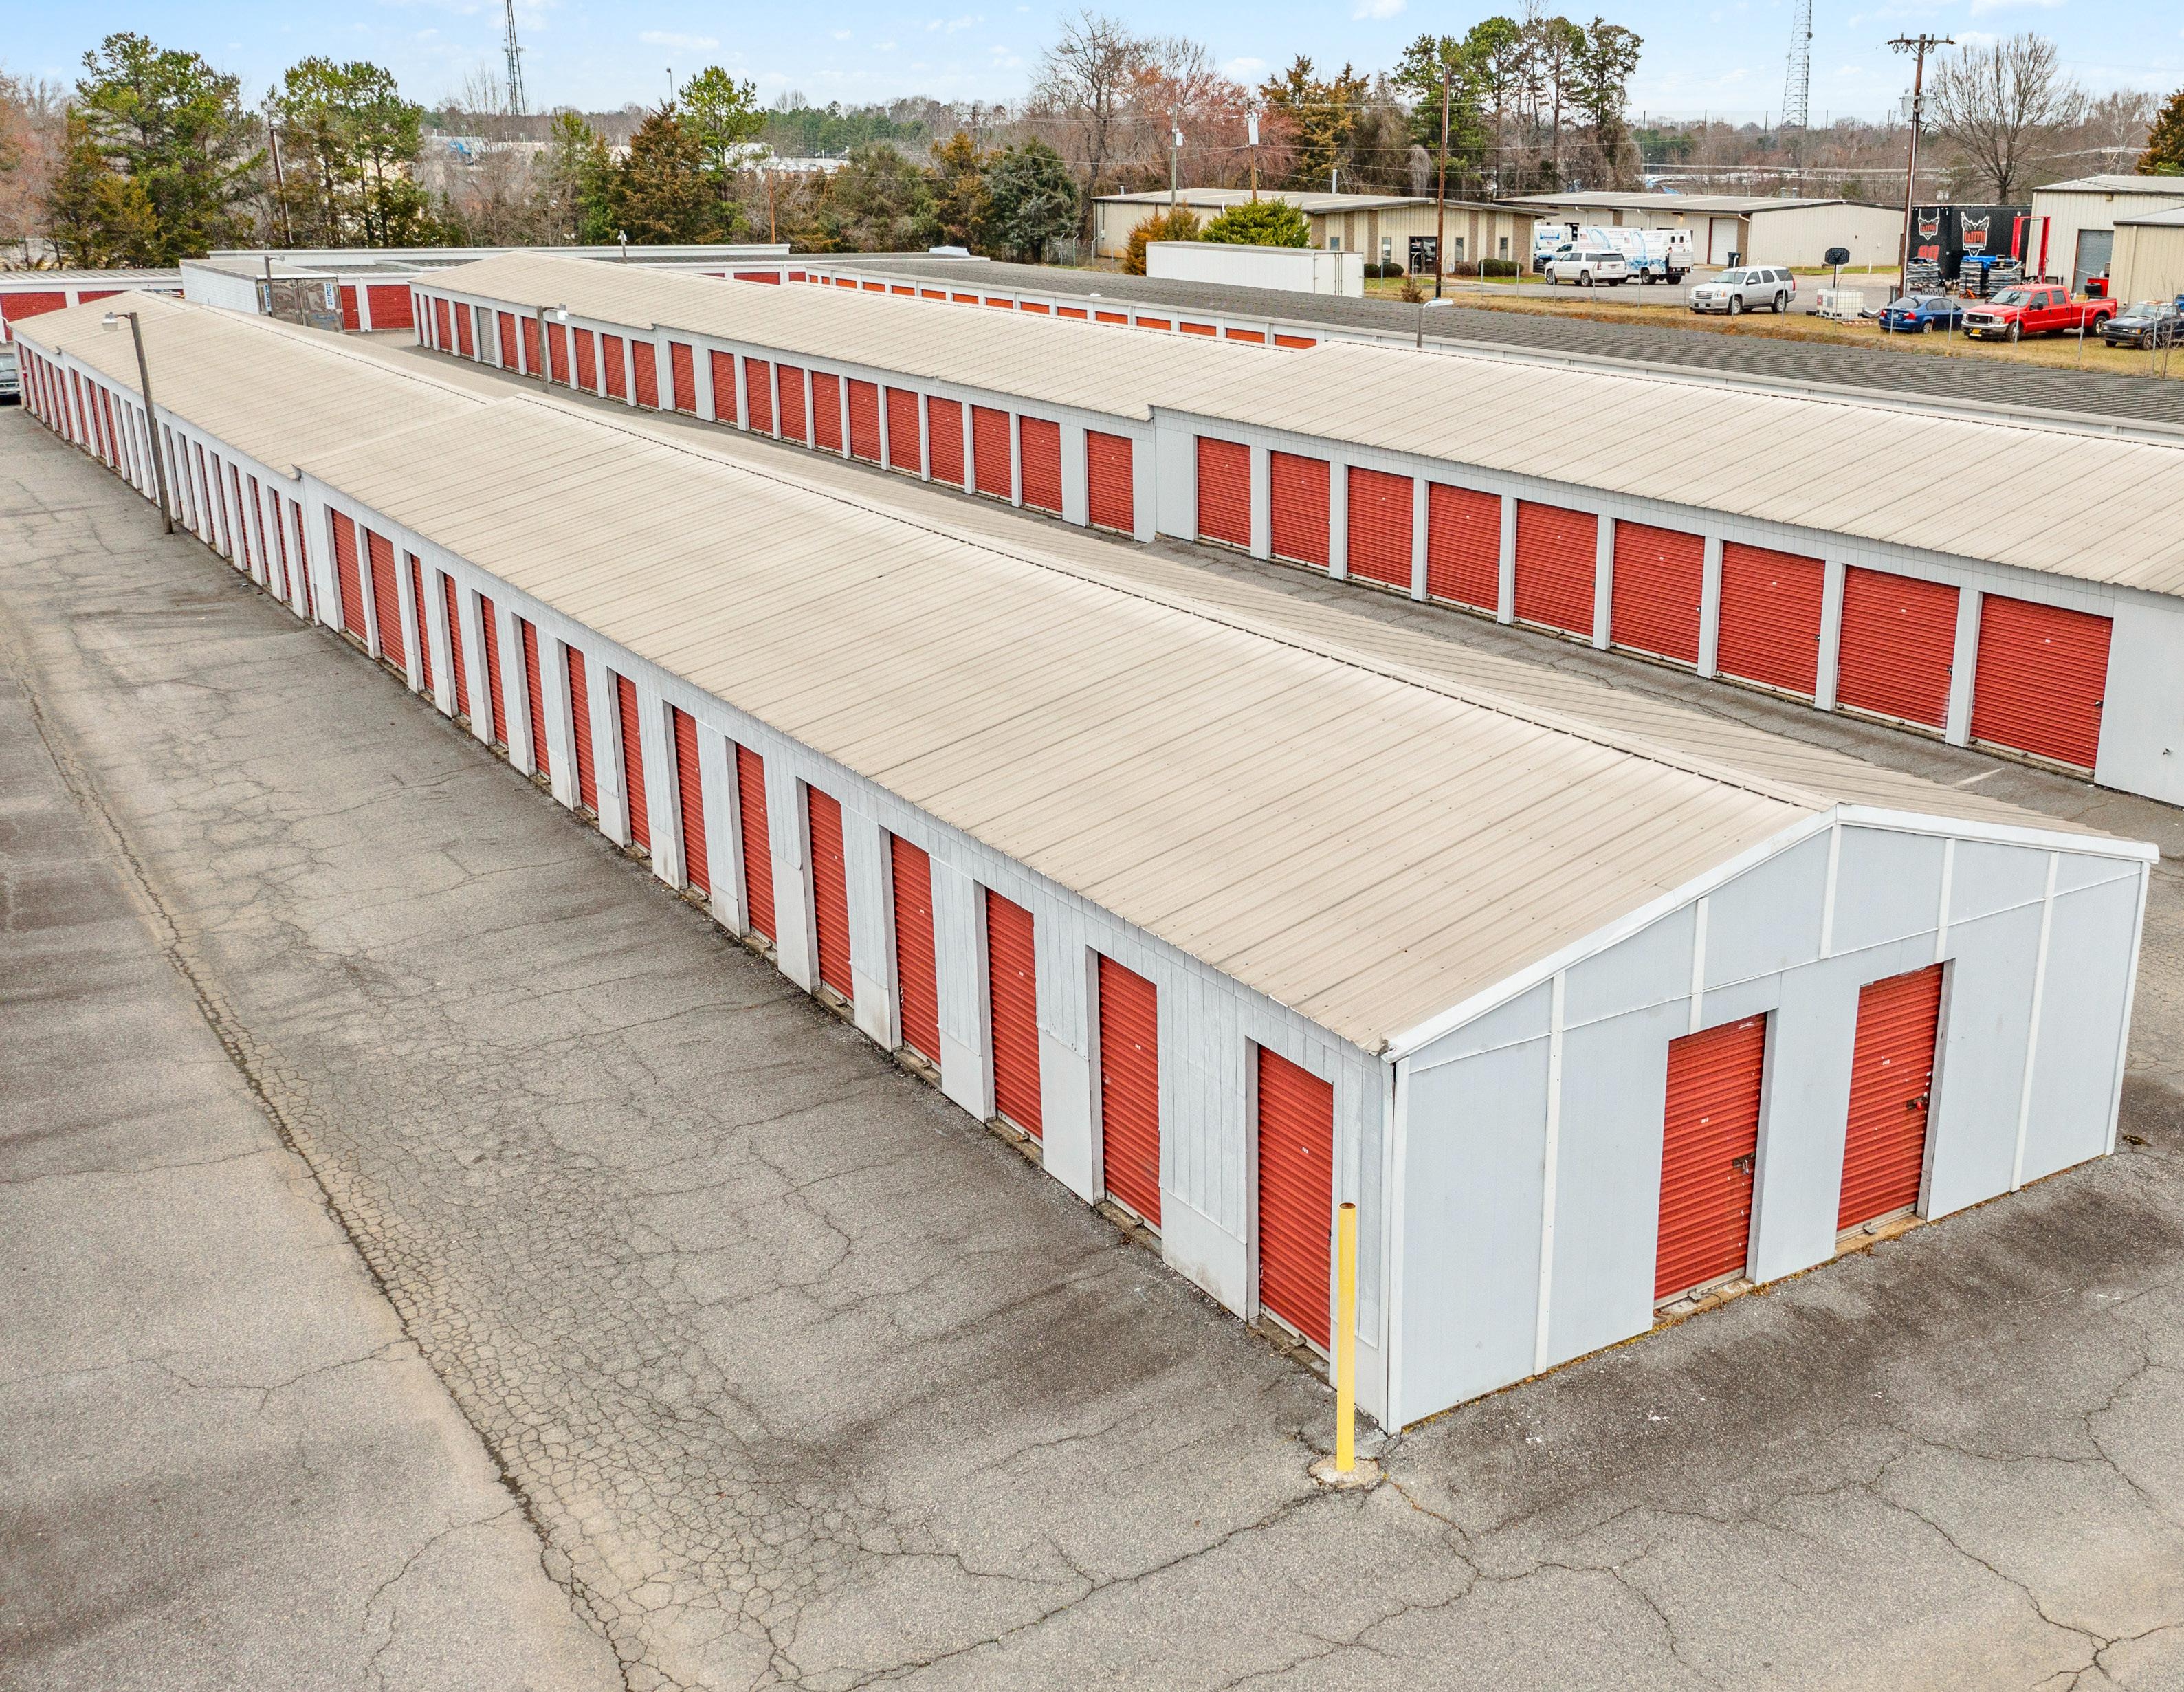
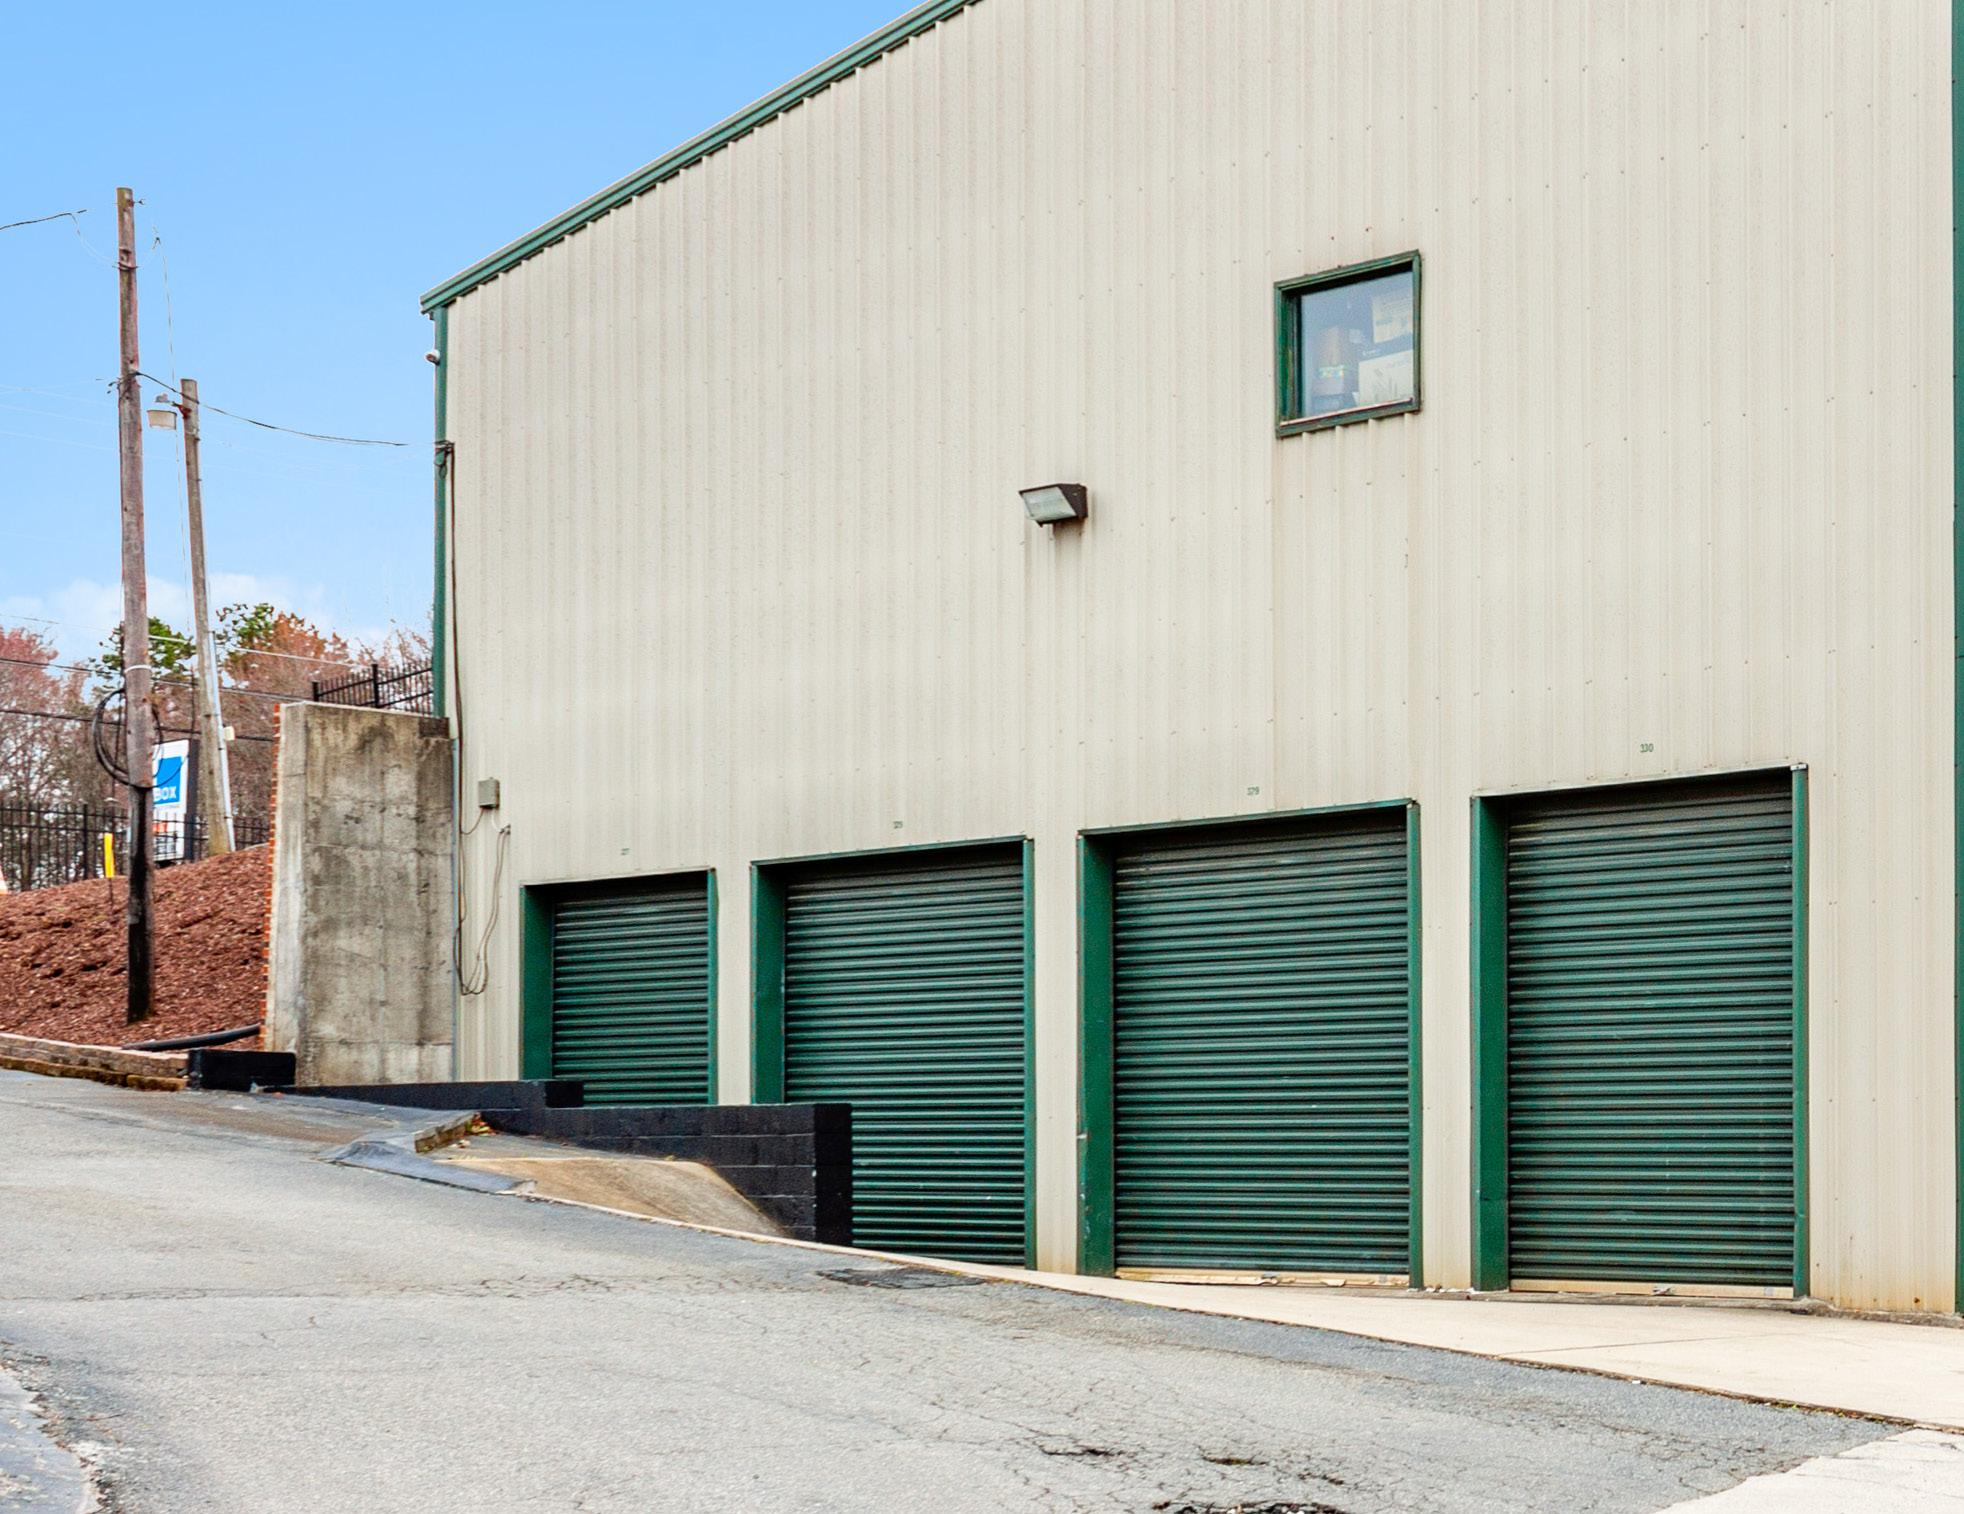
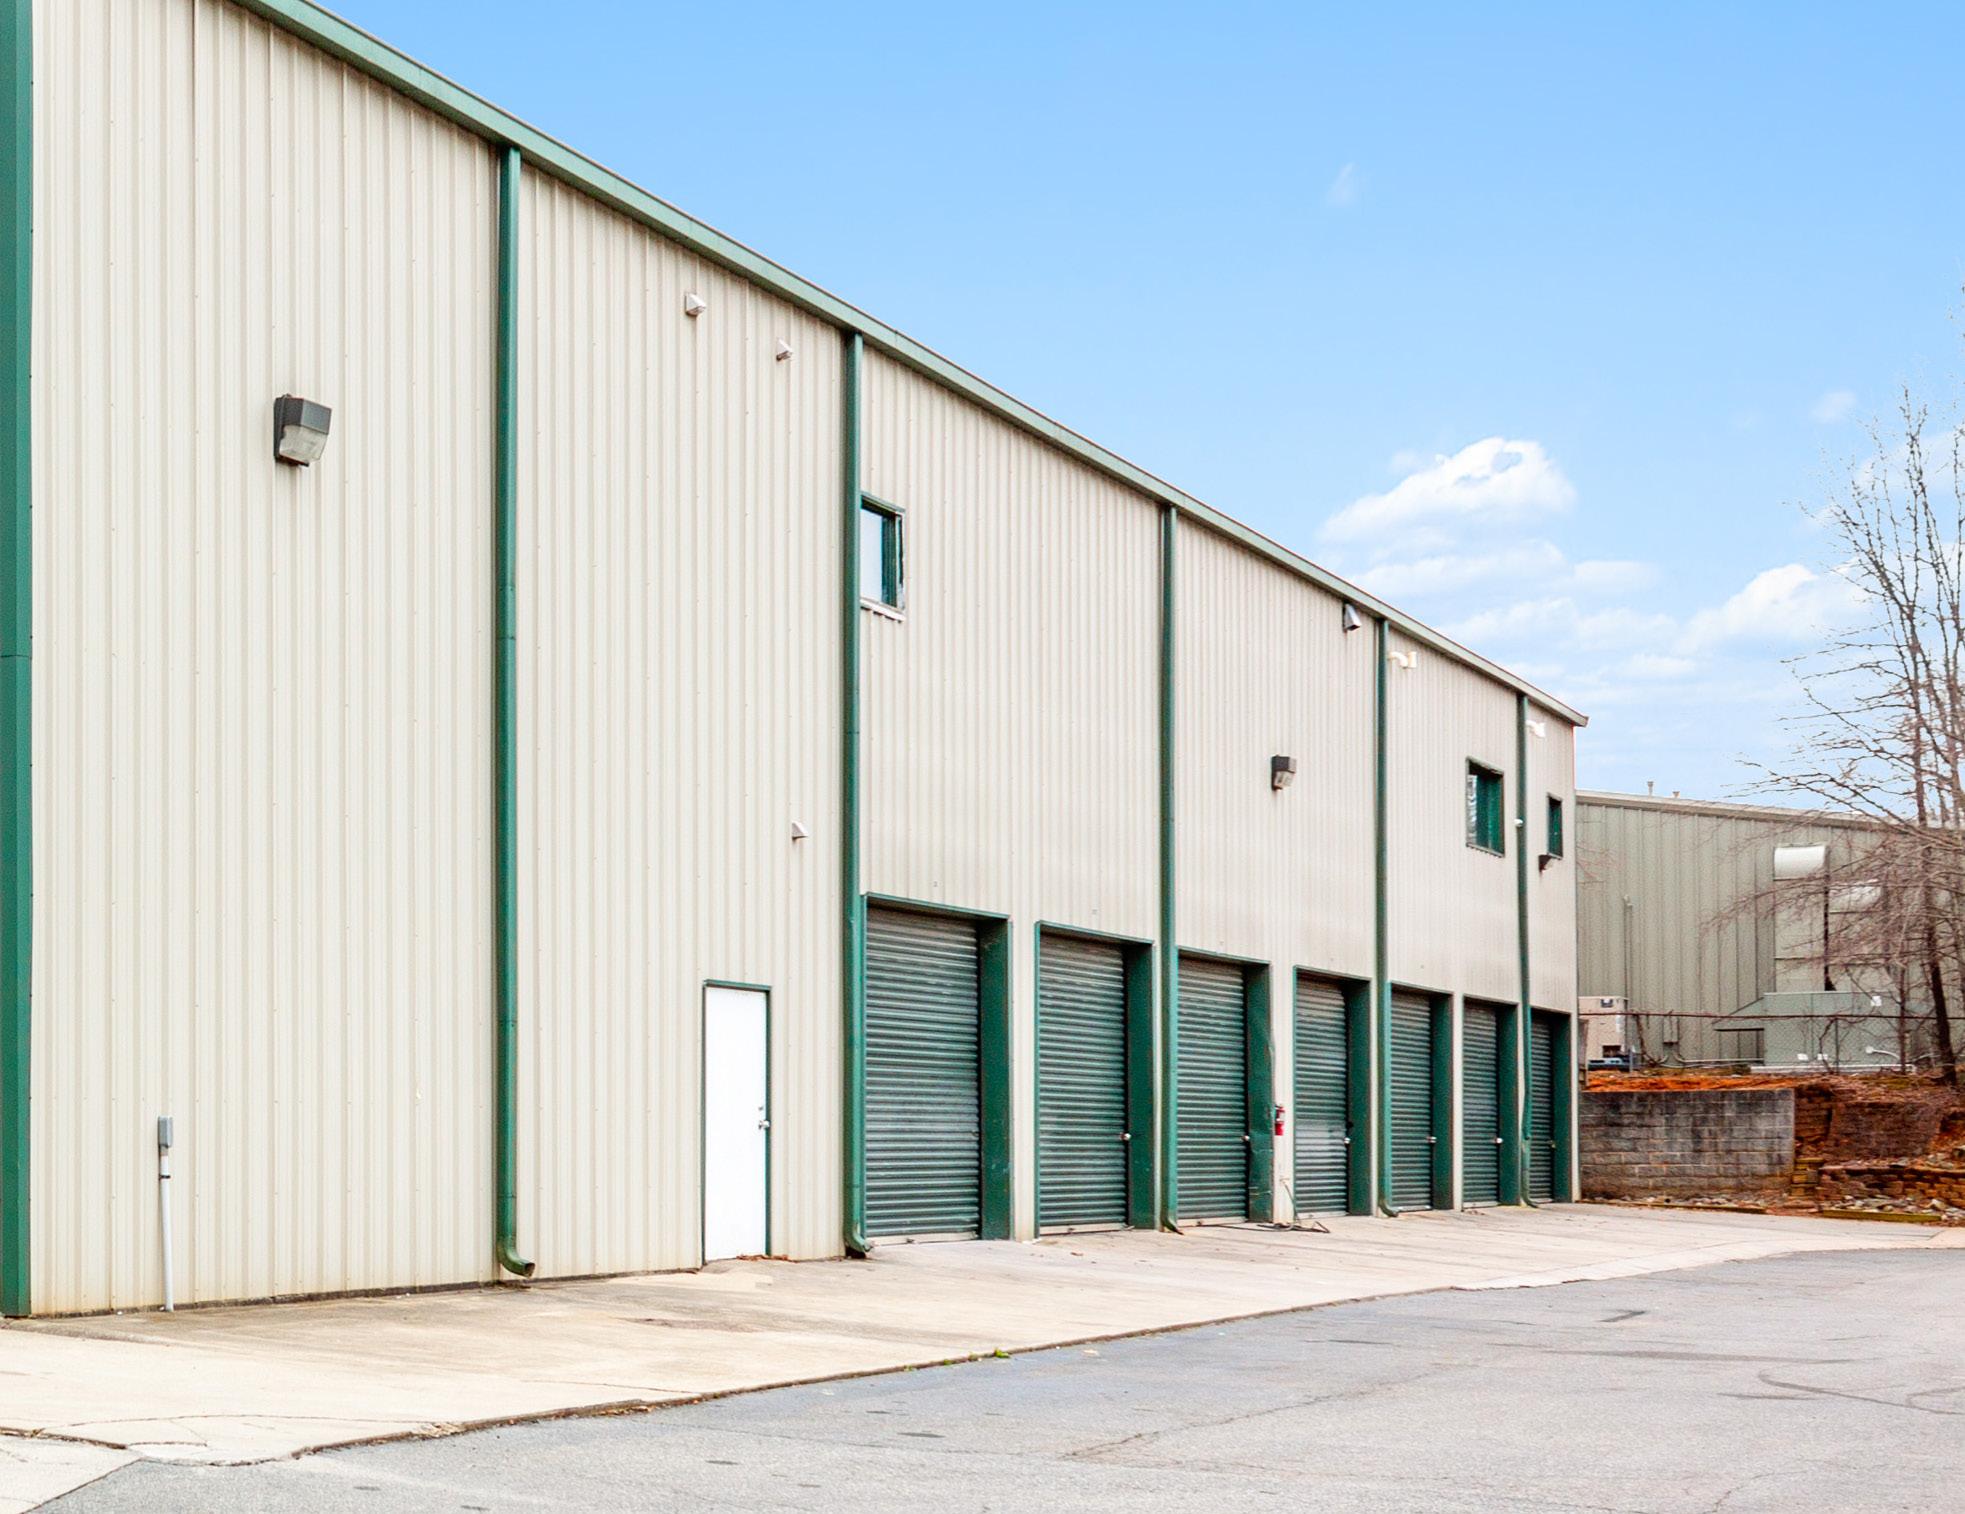
The PIC Storage 2 portfolio consists of 174,528 SF in three selfstorage locations in North Carolina. The portfolio of sites includes Outbox Self Storage located in Mooresville, NC, a suburb of Charlotte; and two Eagle Self-Storage locations, one in Flat Rock, NC and the other in East Flat Rock, NC; suburbs of Asheville, NC.
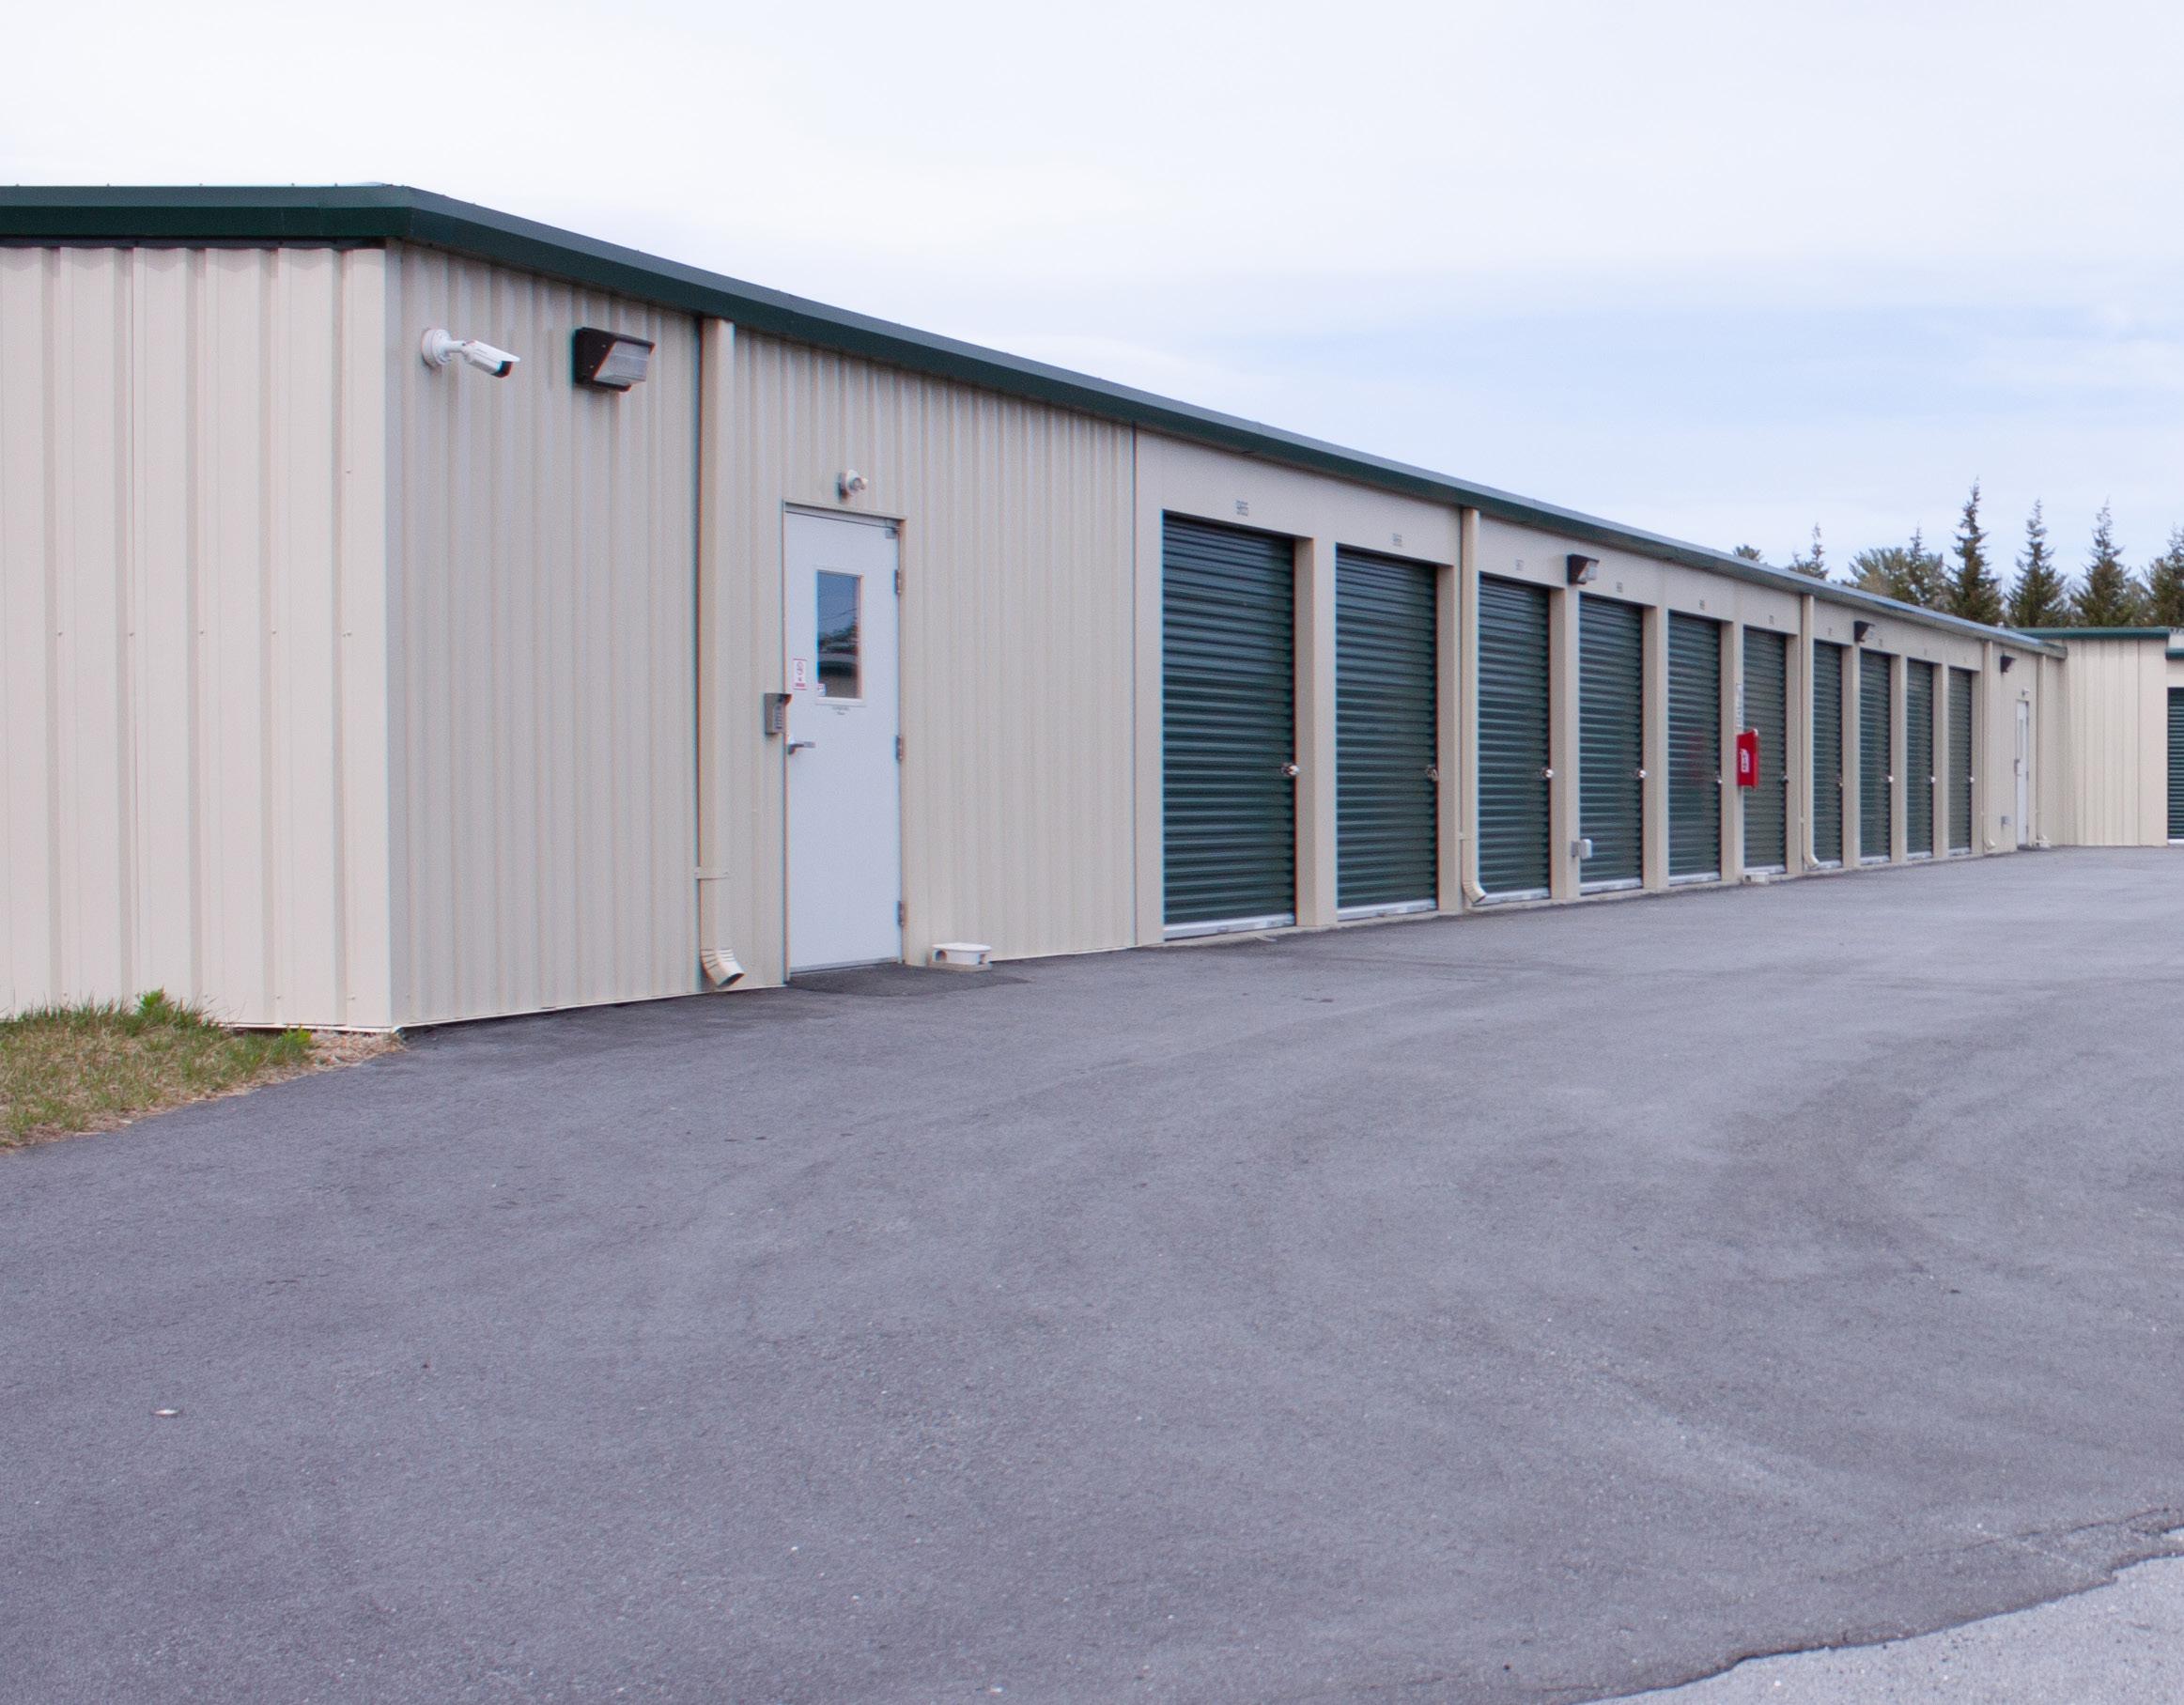
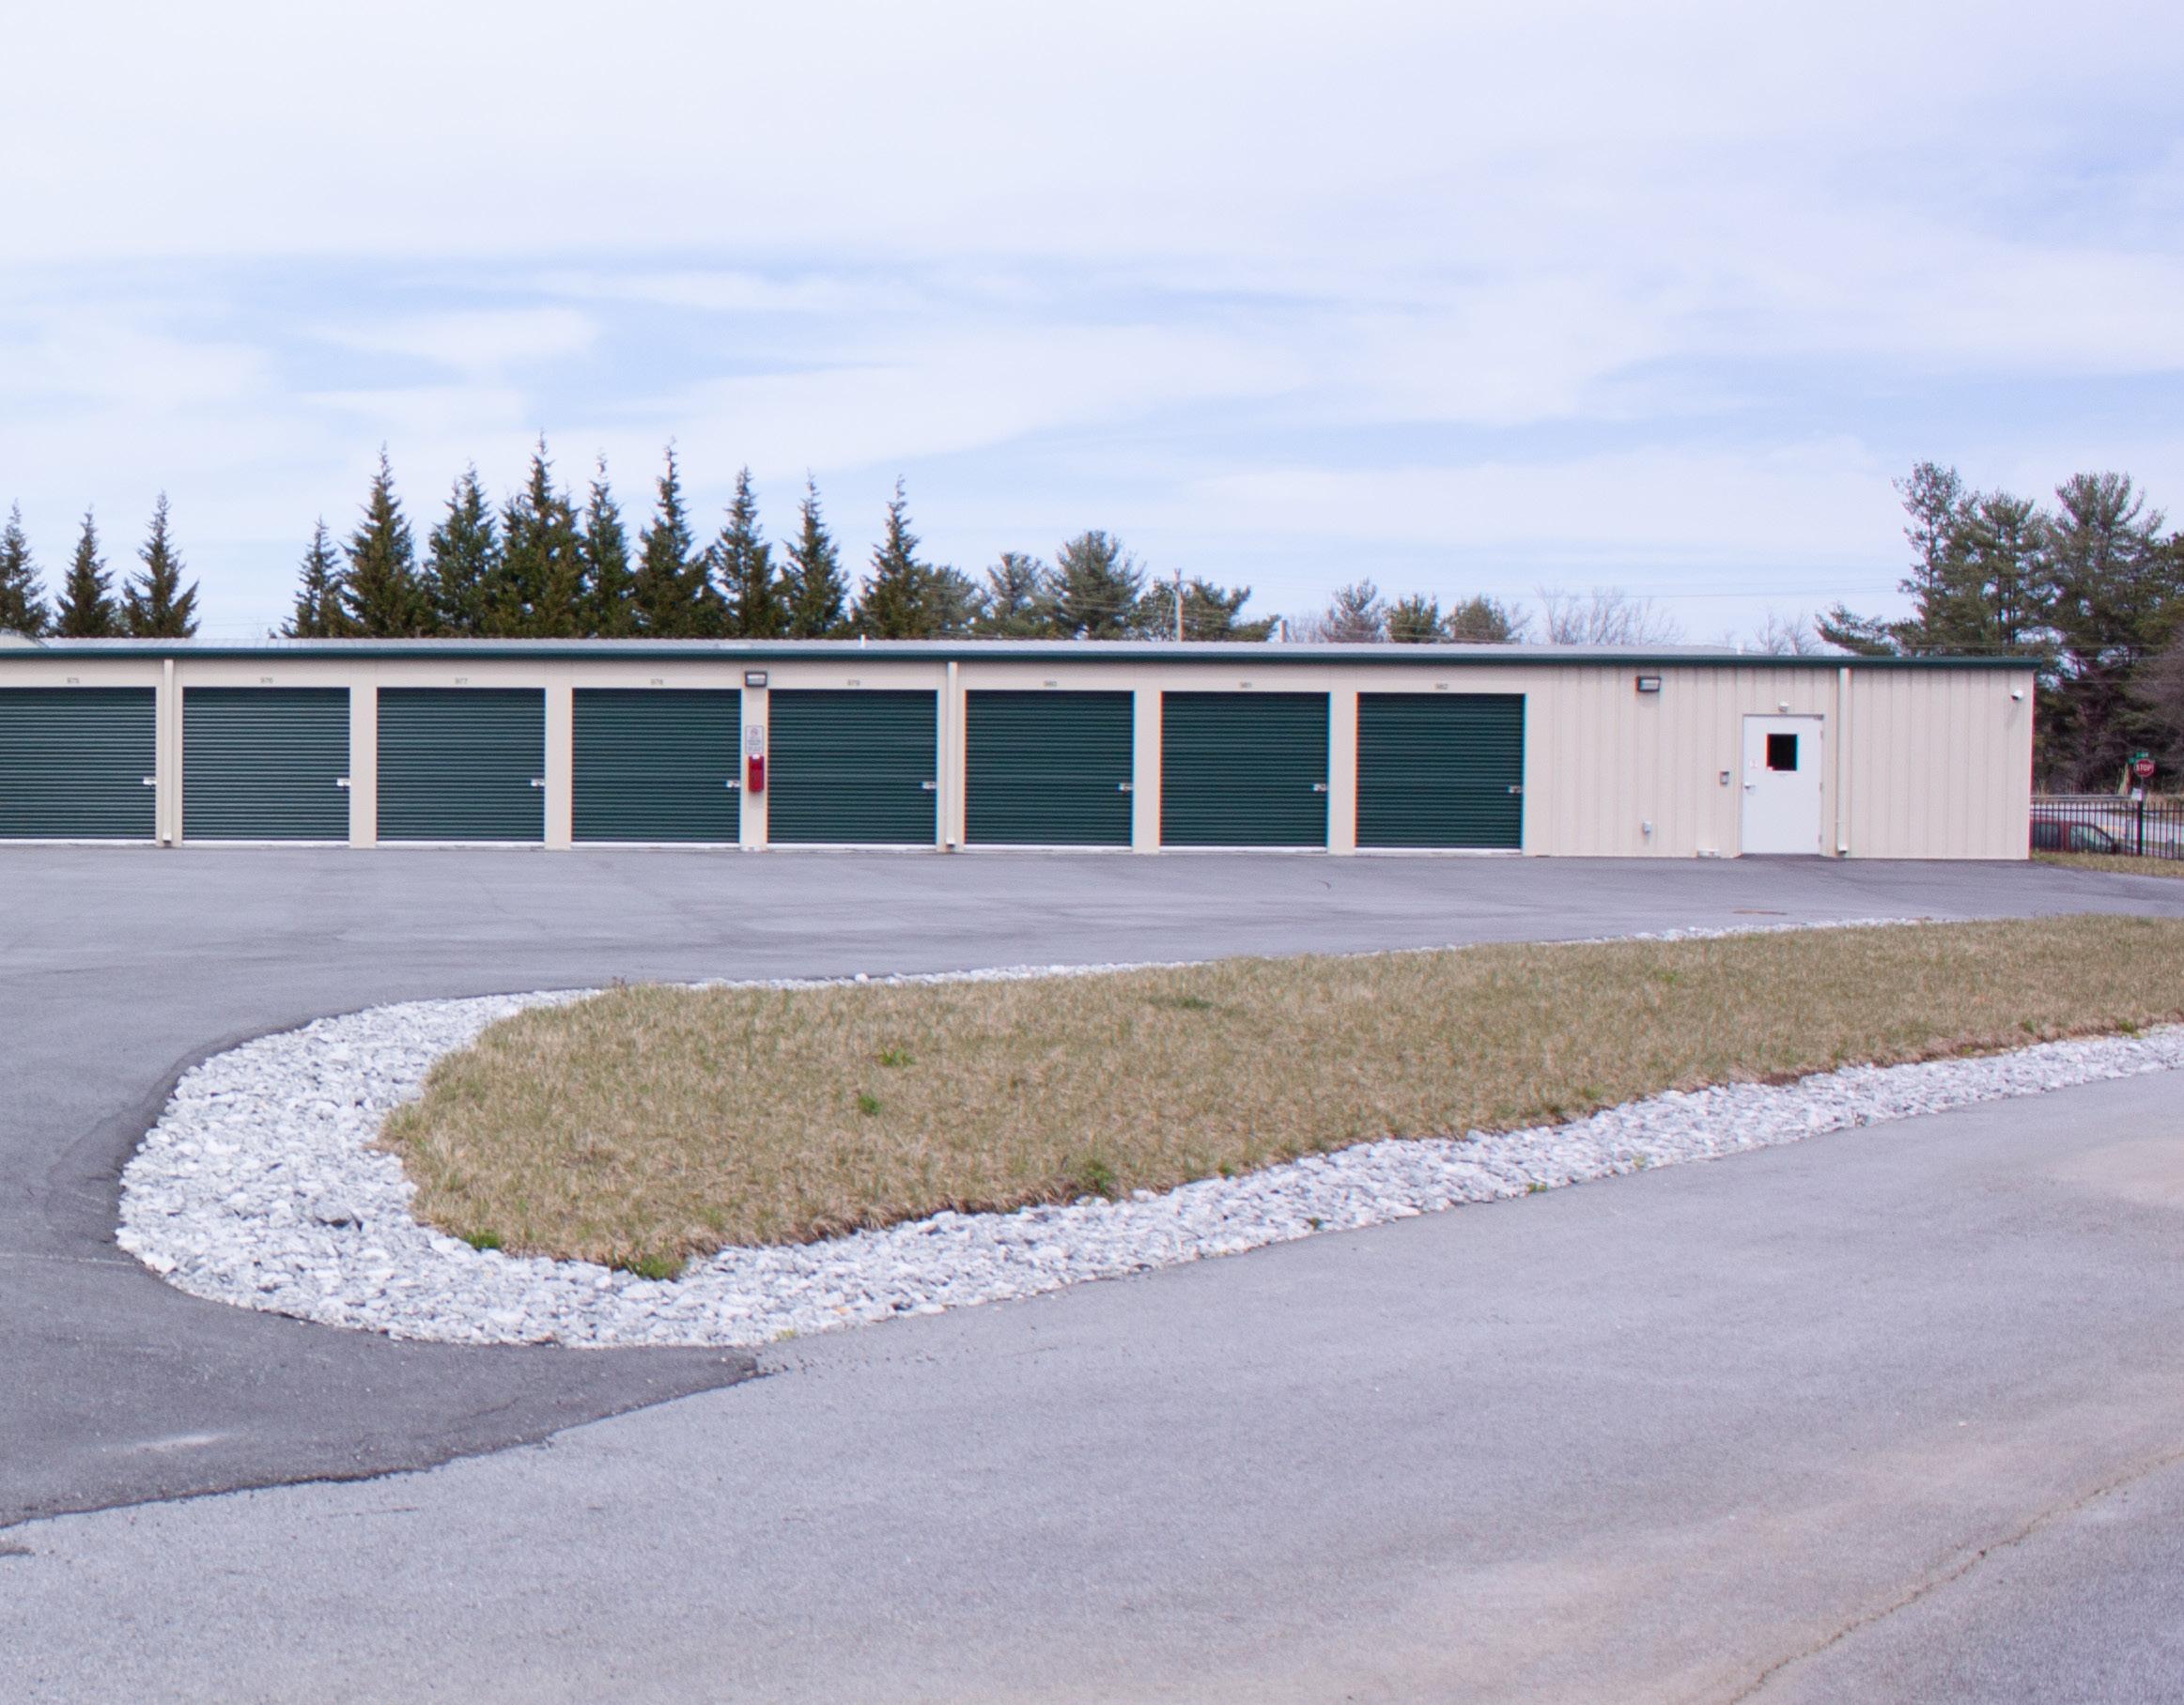
The total number of units in this offering are 1,472, which includes a mix of climate controlled units, non-climate controlled units and parking spaces. Each location is located in a thriving market and is experiencing strong population growth.
We invite you to invest alongside us for this exciting new acquisition.
This offering is a 506(c) and is open to accredited investors only. An accredited investor has either a net worth of $1 million, not including their primary residence, OR an annual income of $200,000 (or $300,000 if married) for the last two years and you have a reasonable expectation that it will continue.


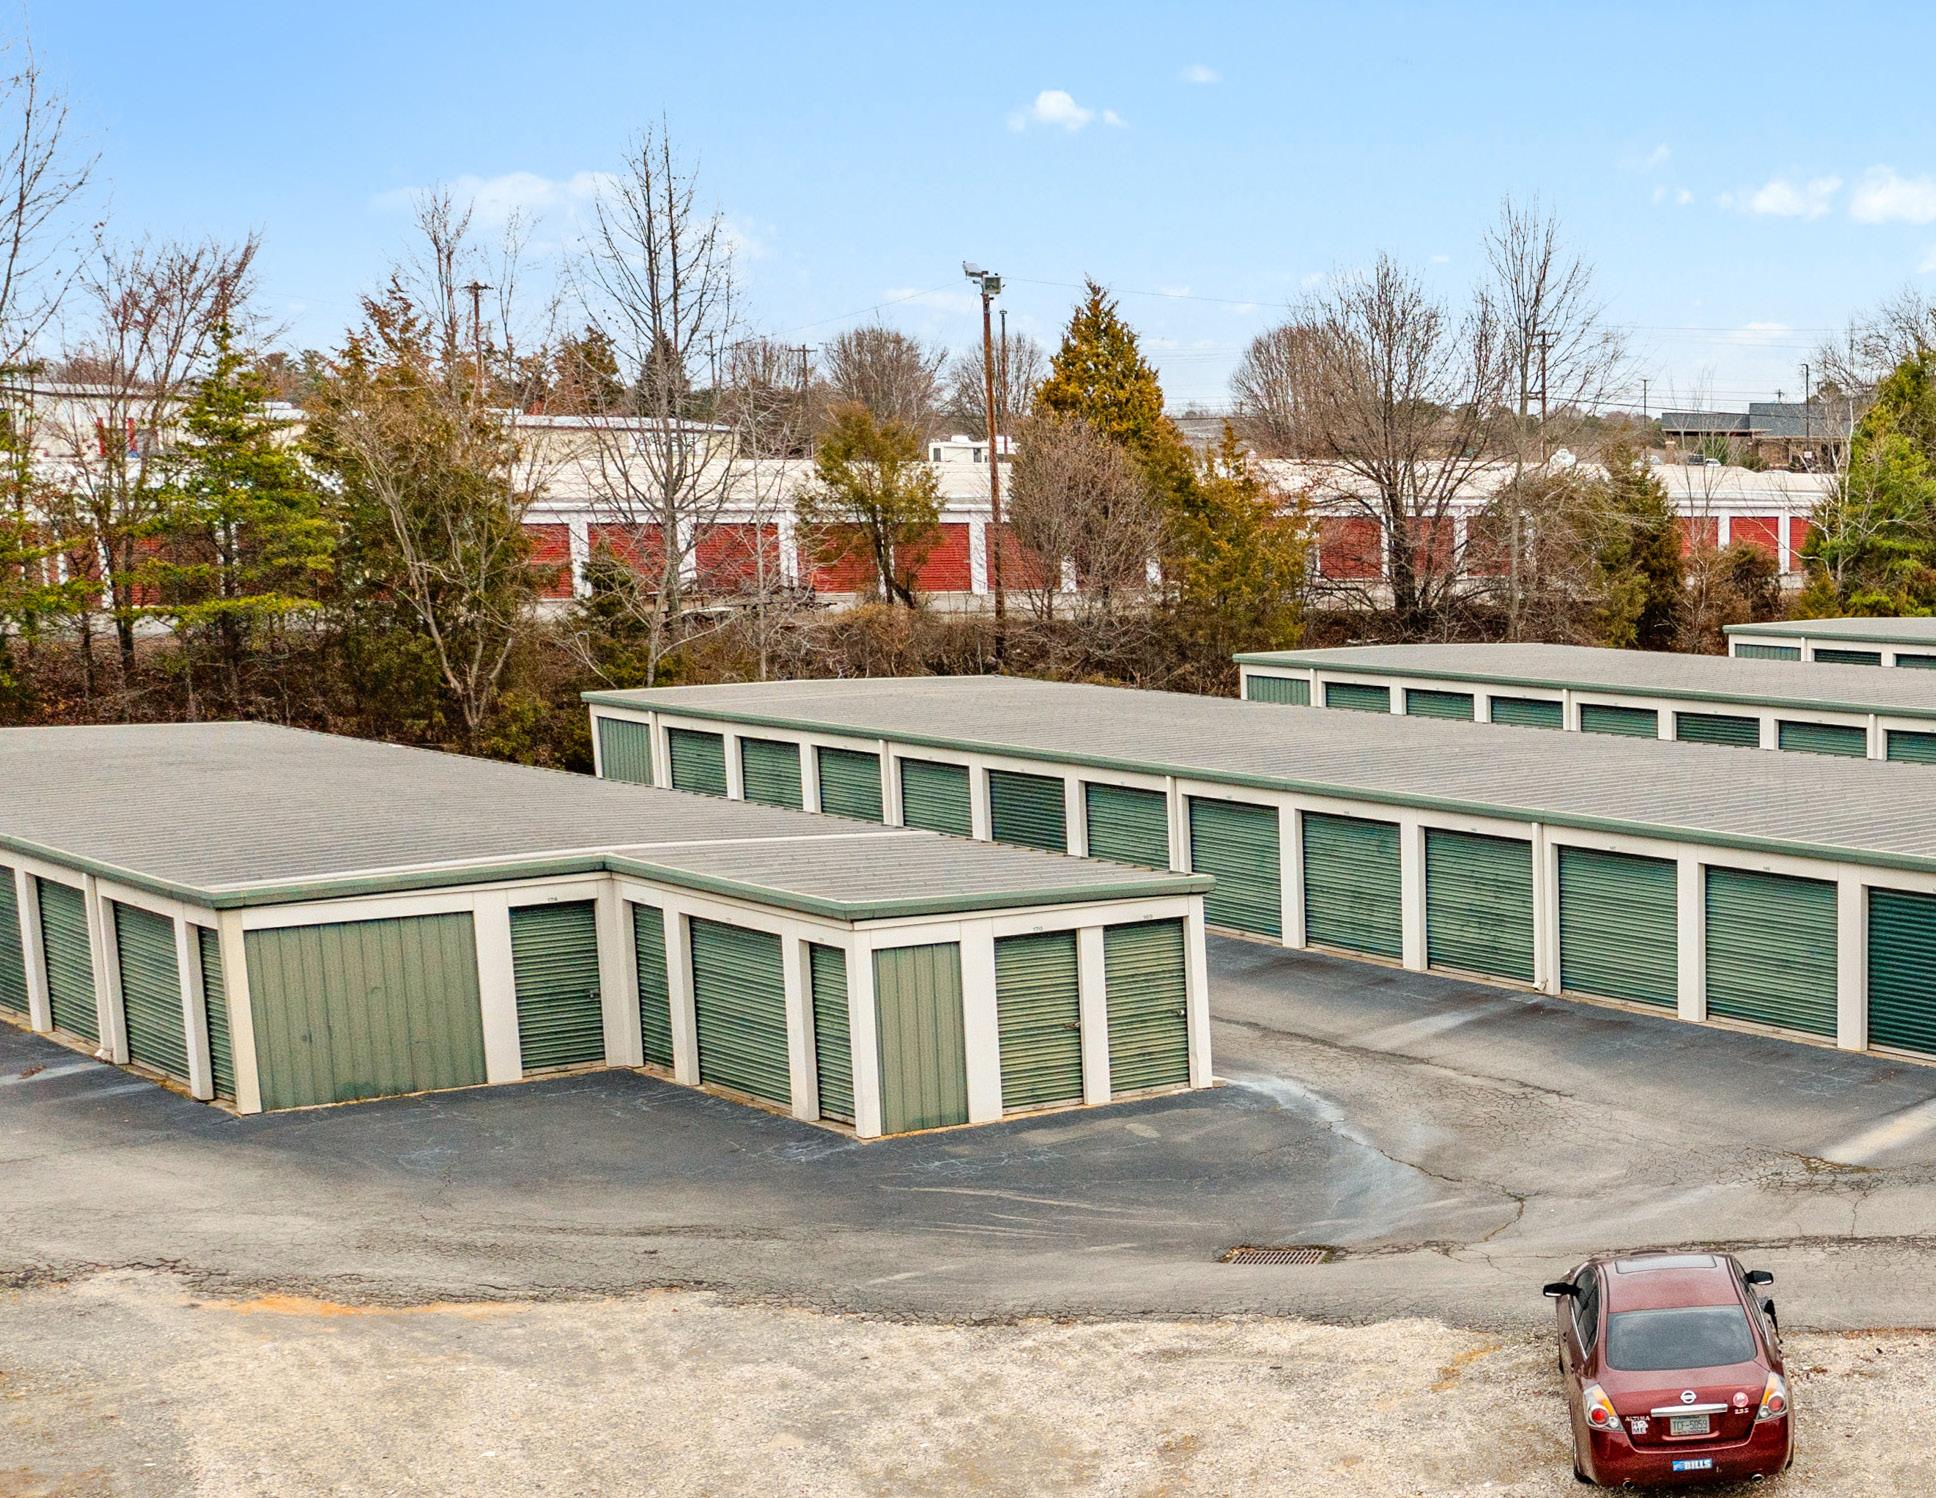
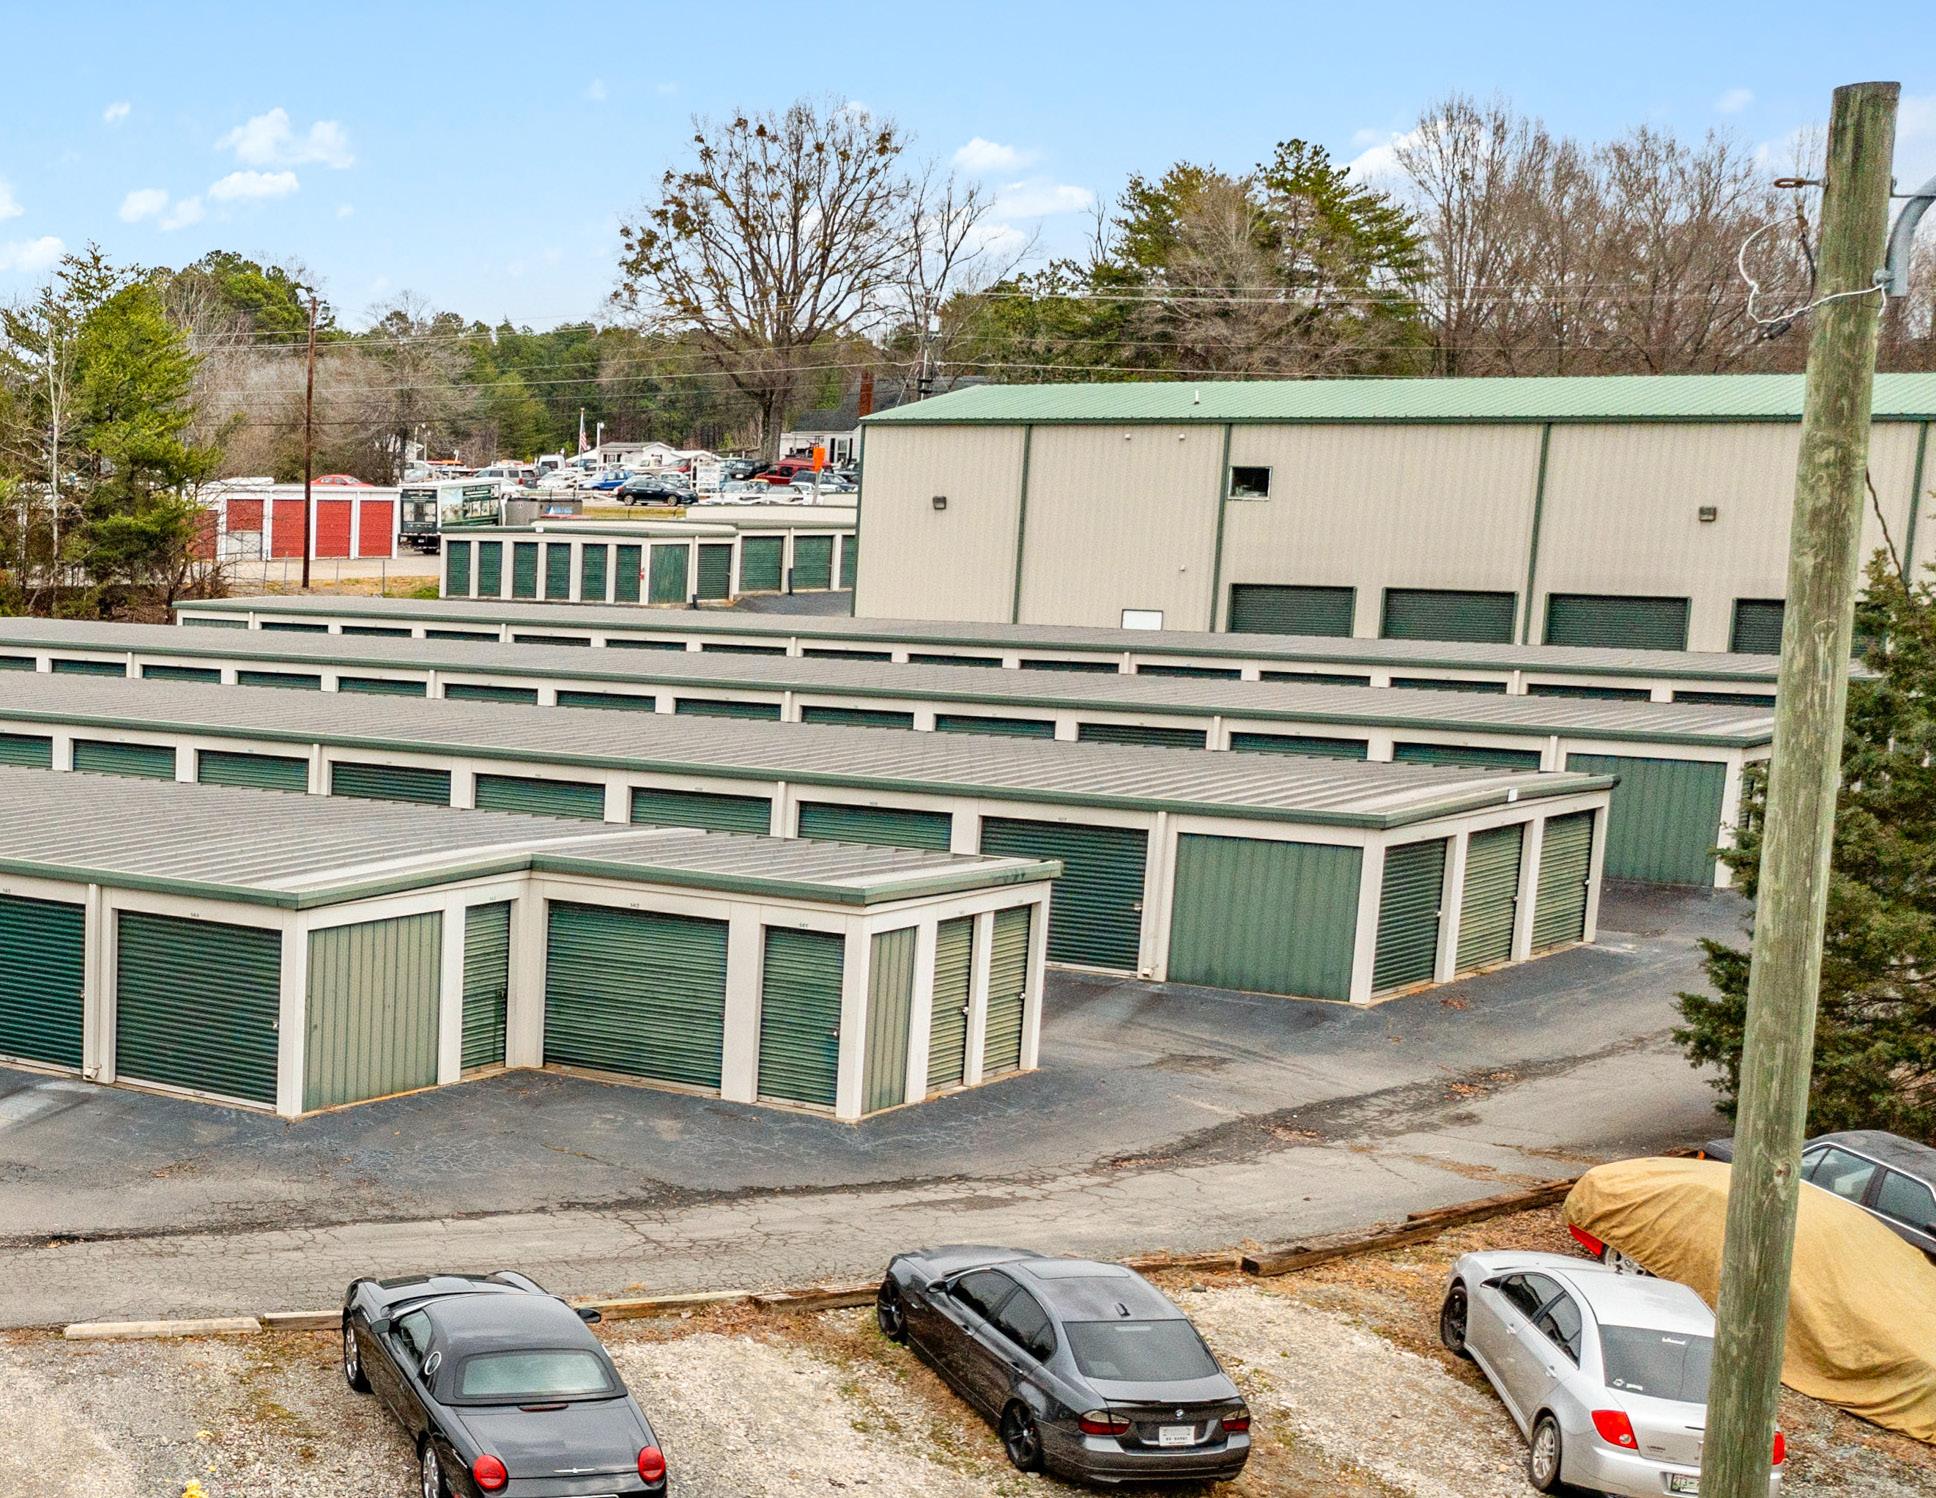

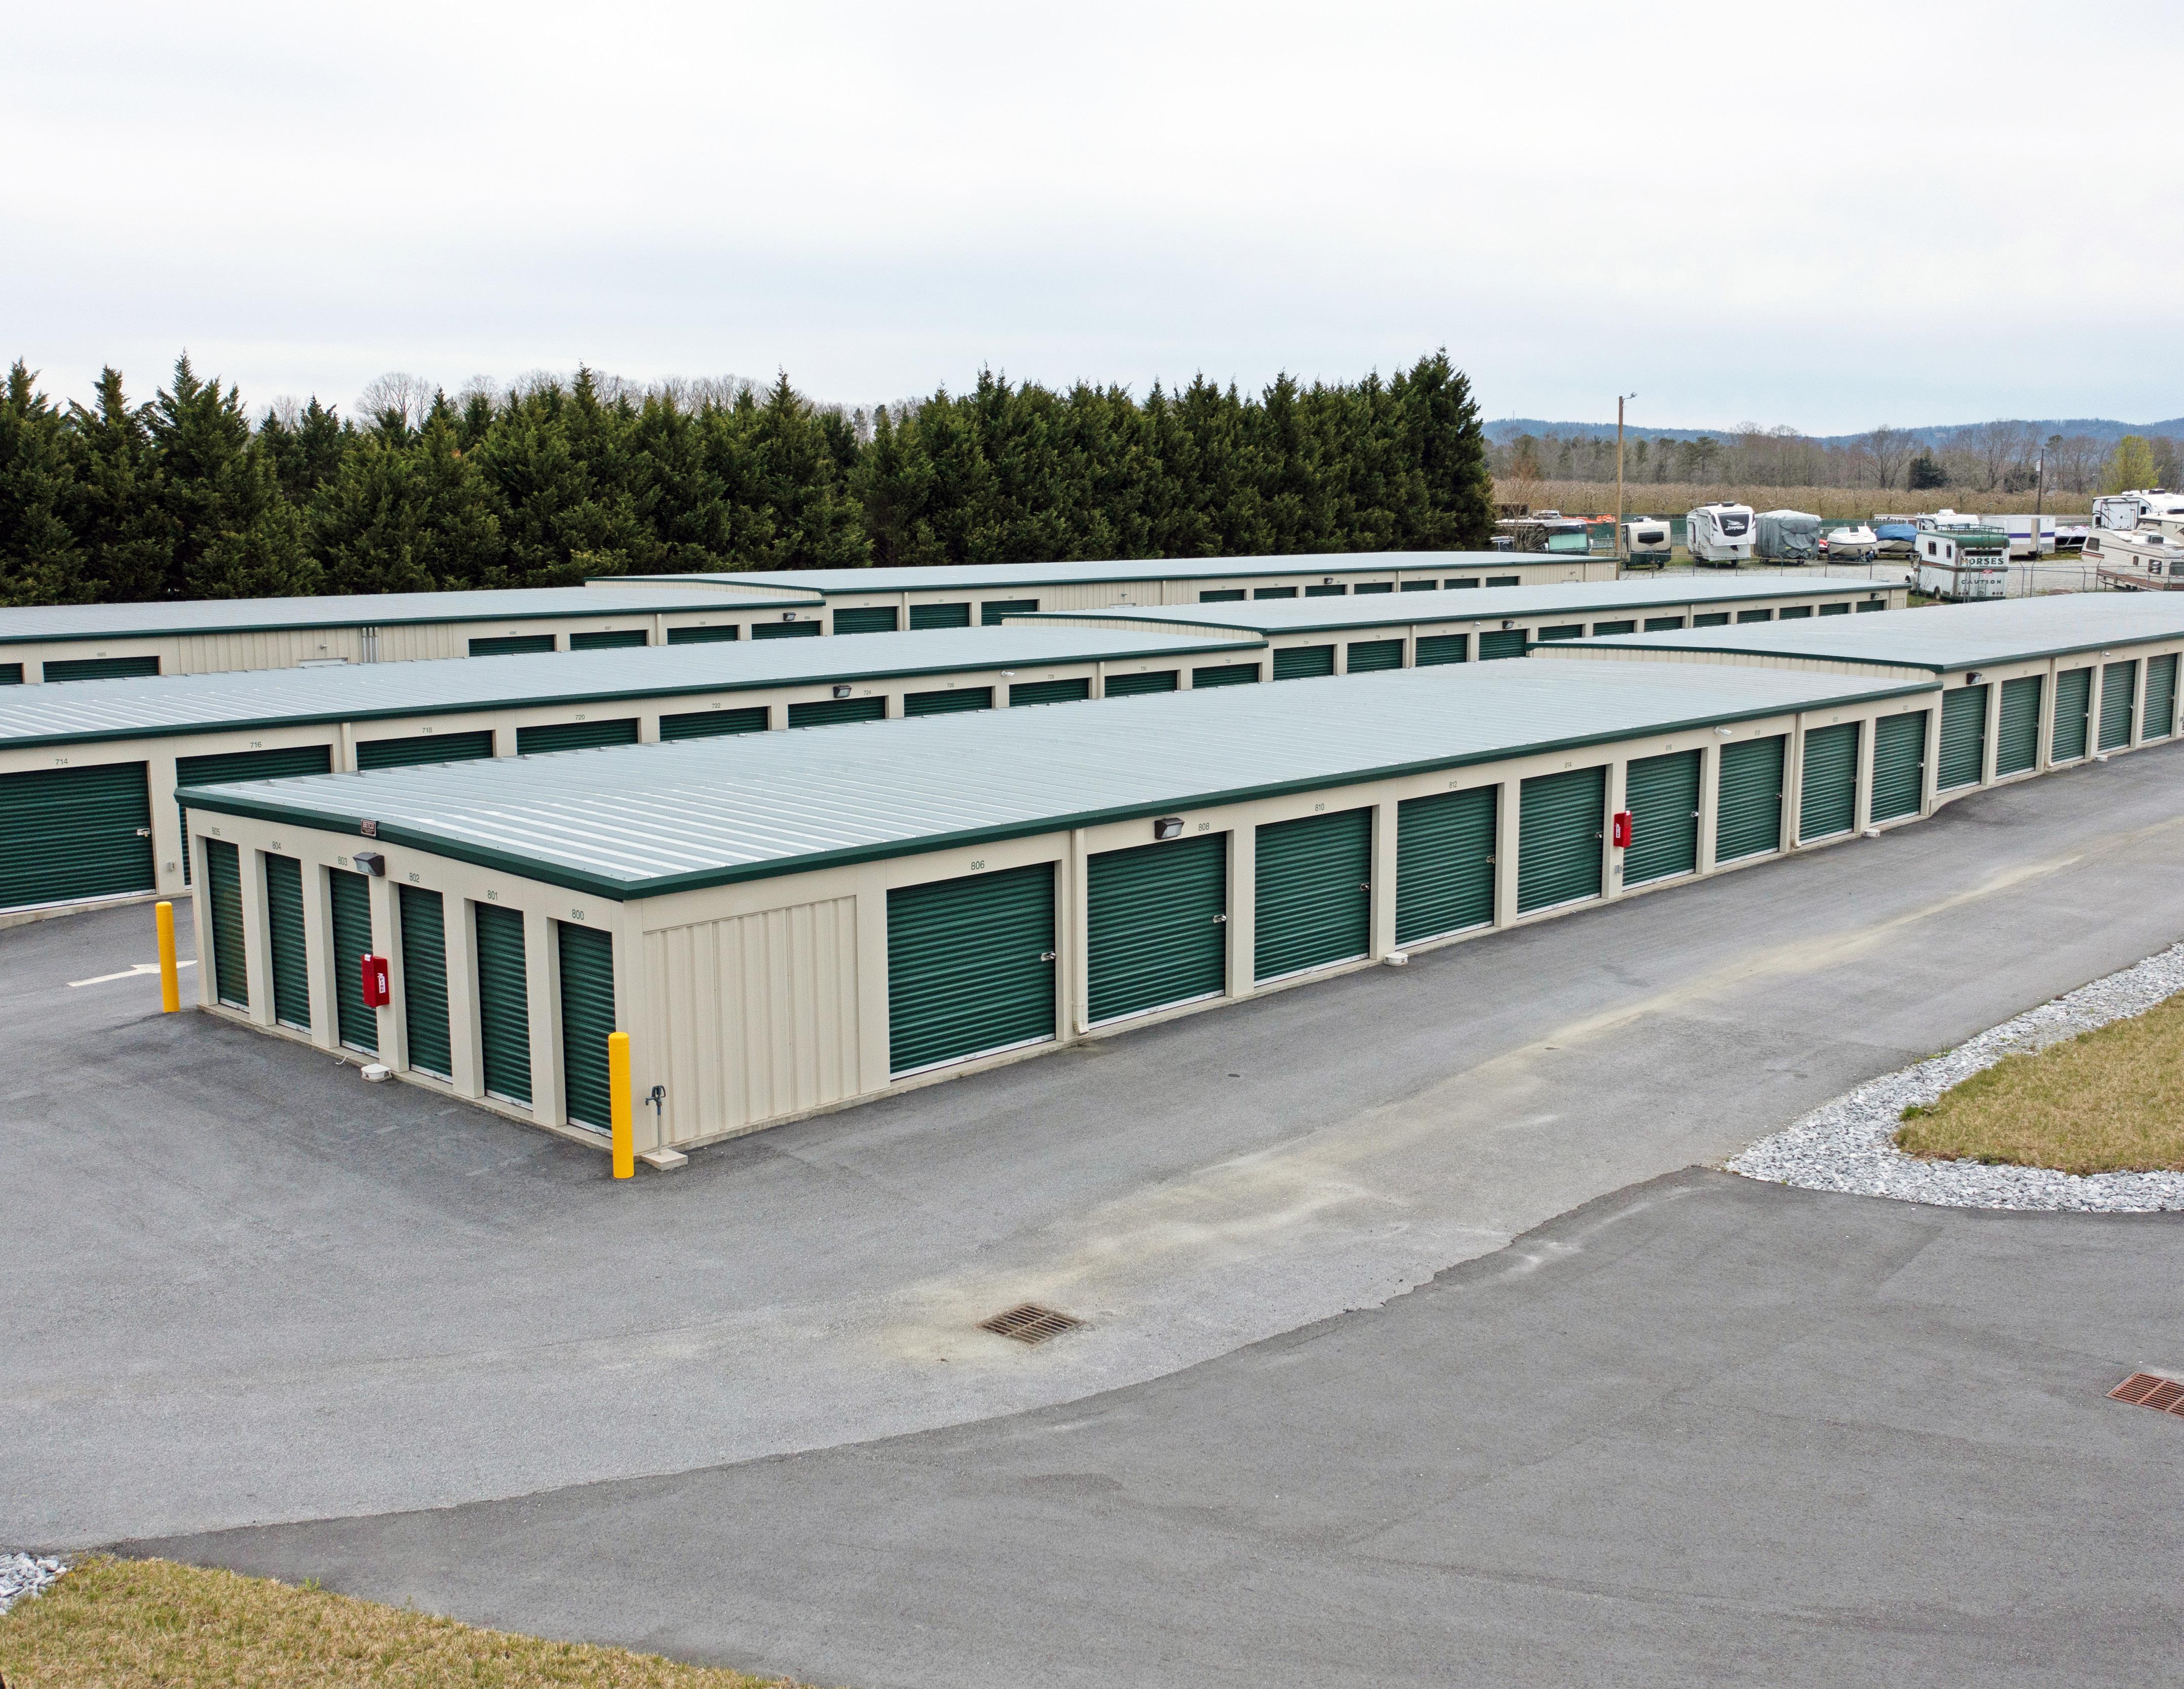


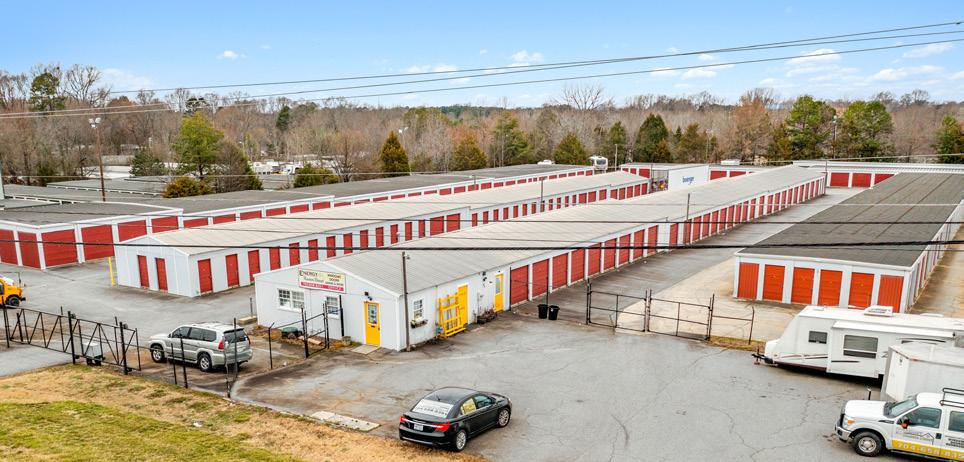
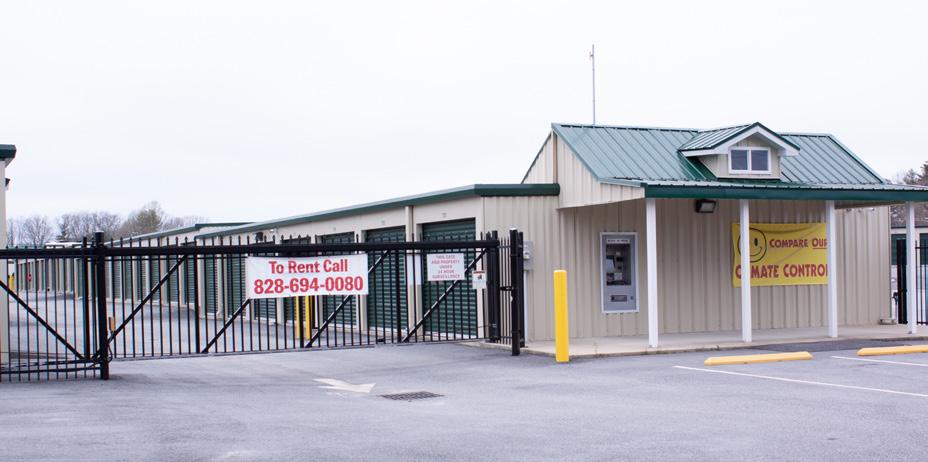
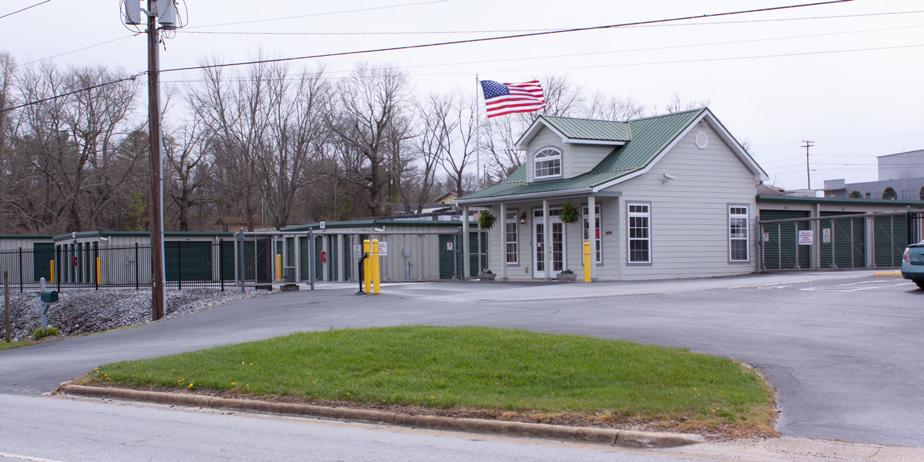


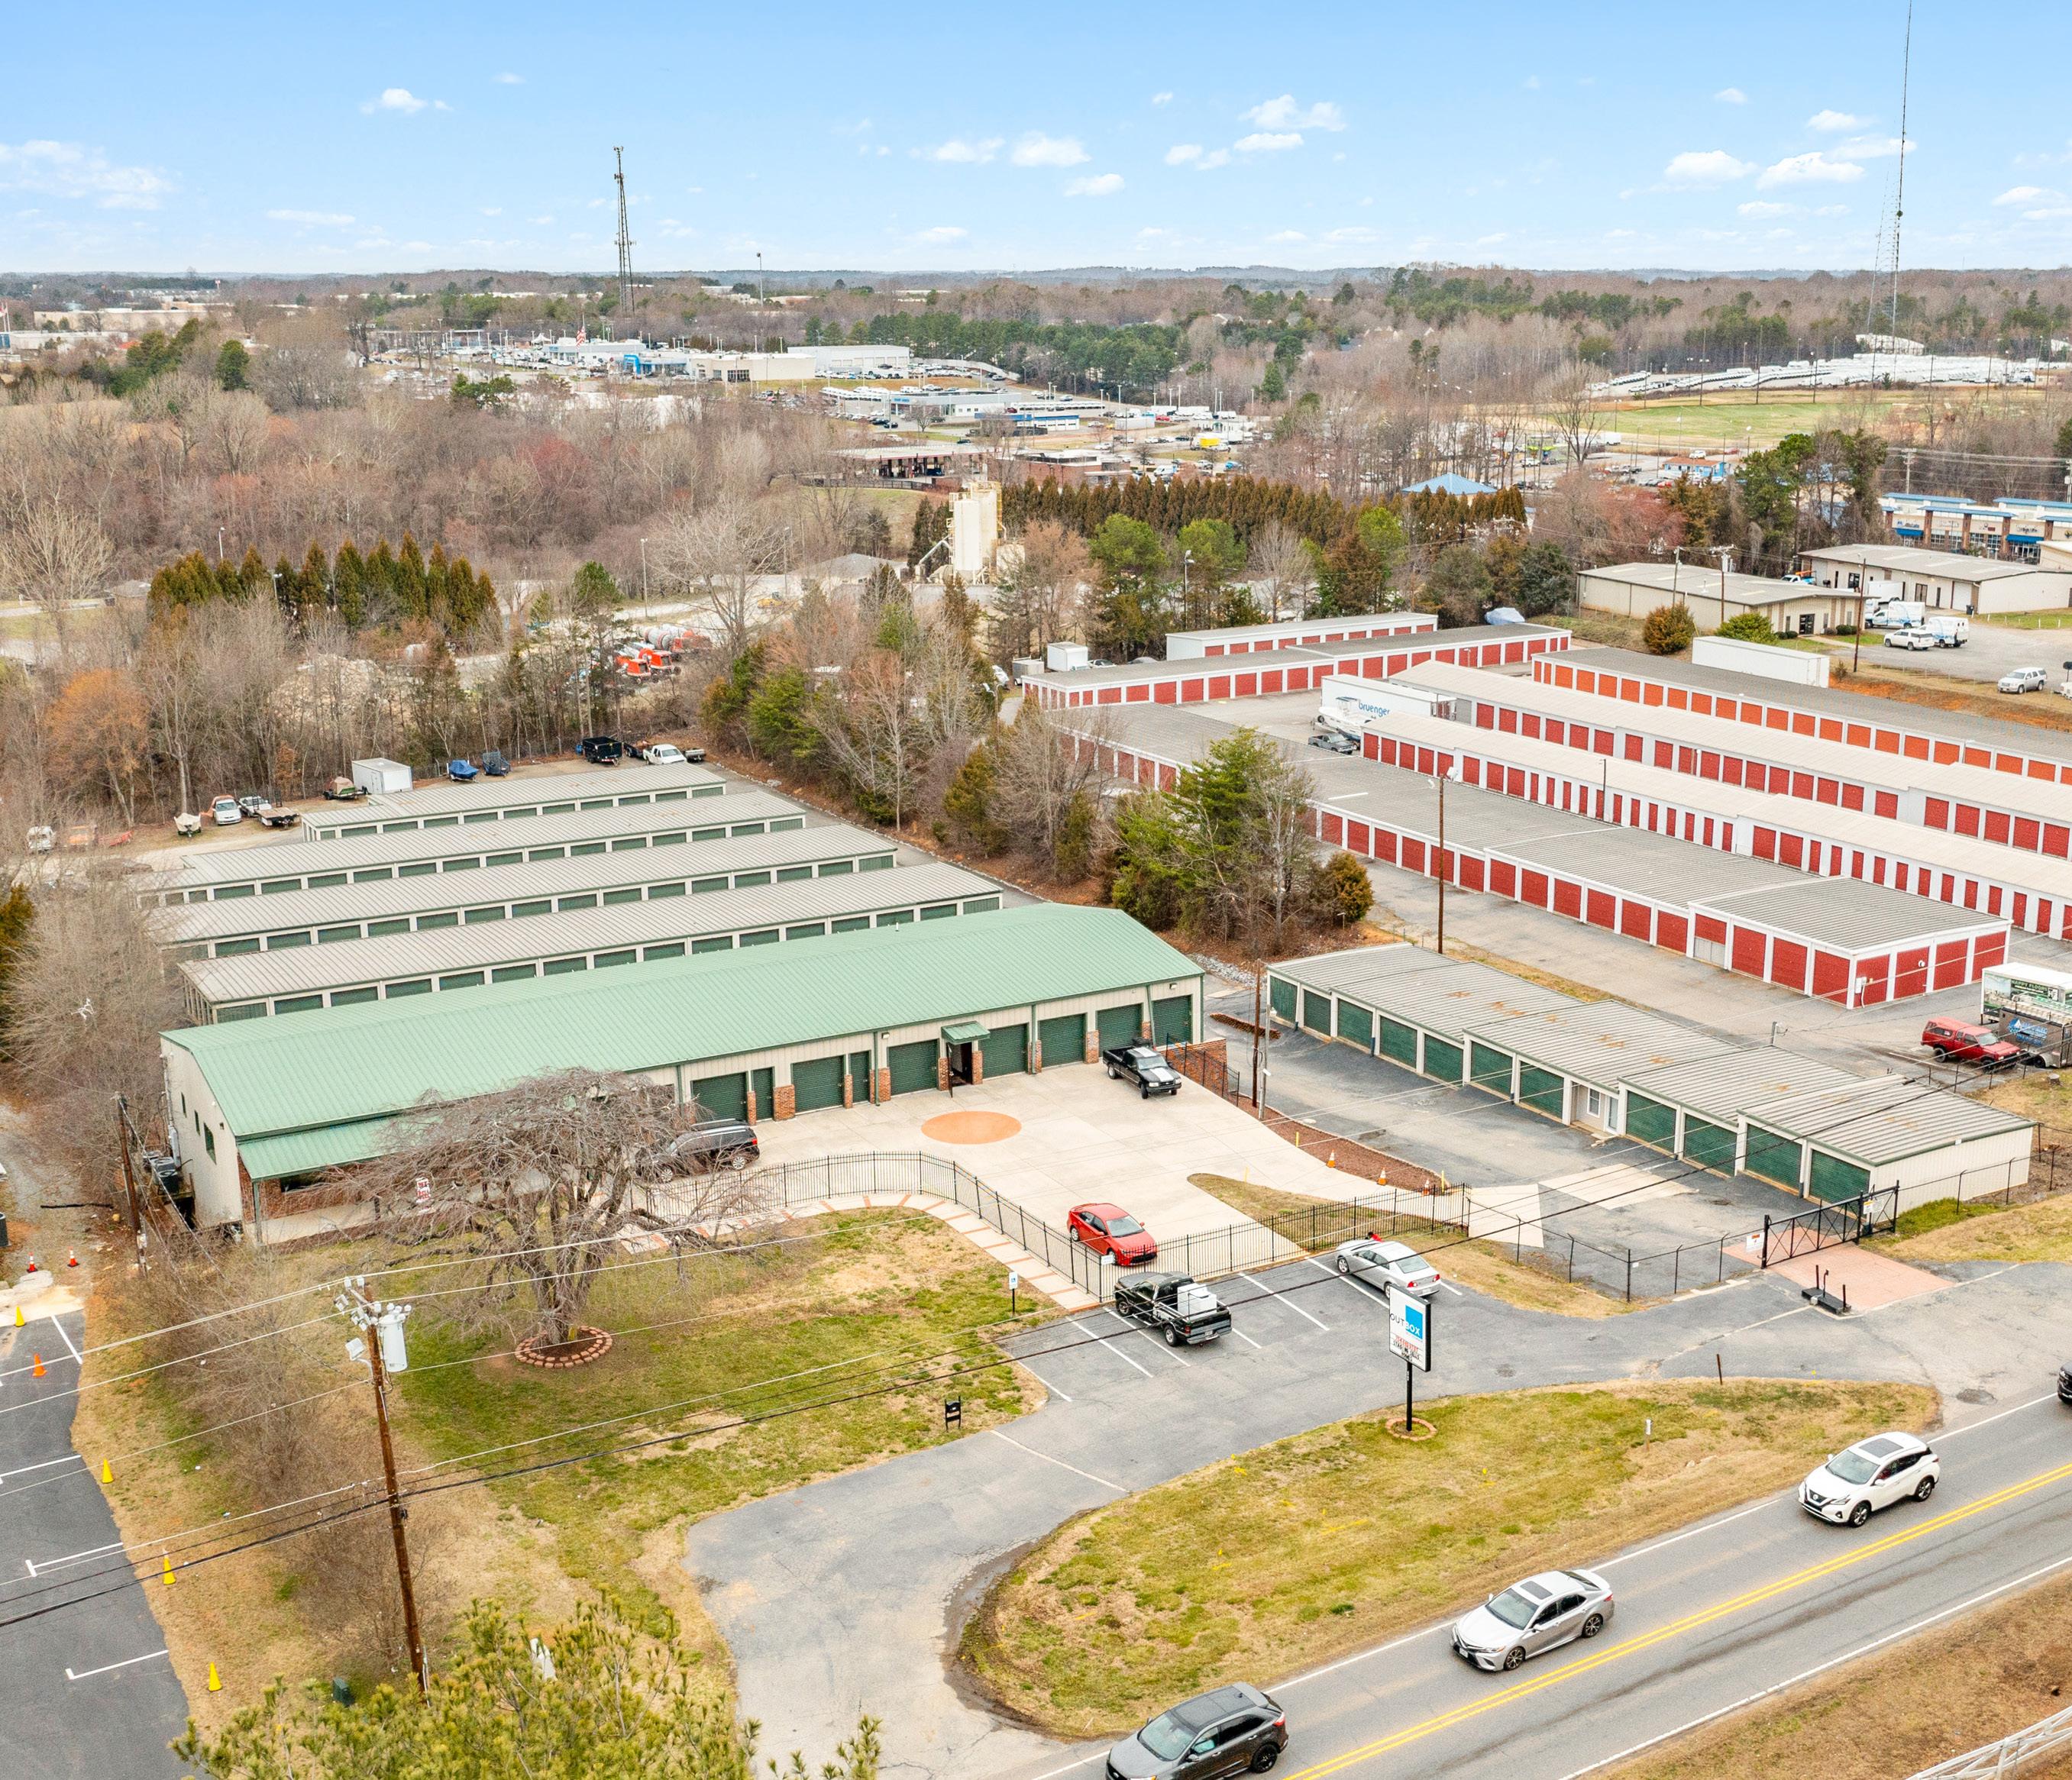
The PassiveInvesting.com Self-Storage team has identified the 729-Unit single-story self-storage facility at 2702 Charlotte Highway in Mooresville, NC, a suburb of Charlotte, NC for acquisition.

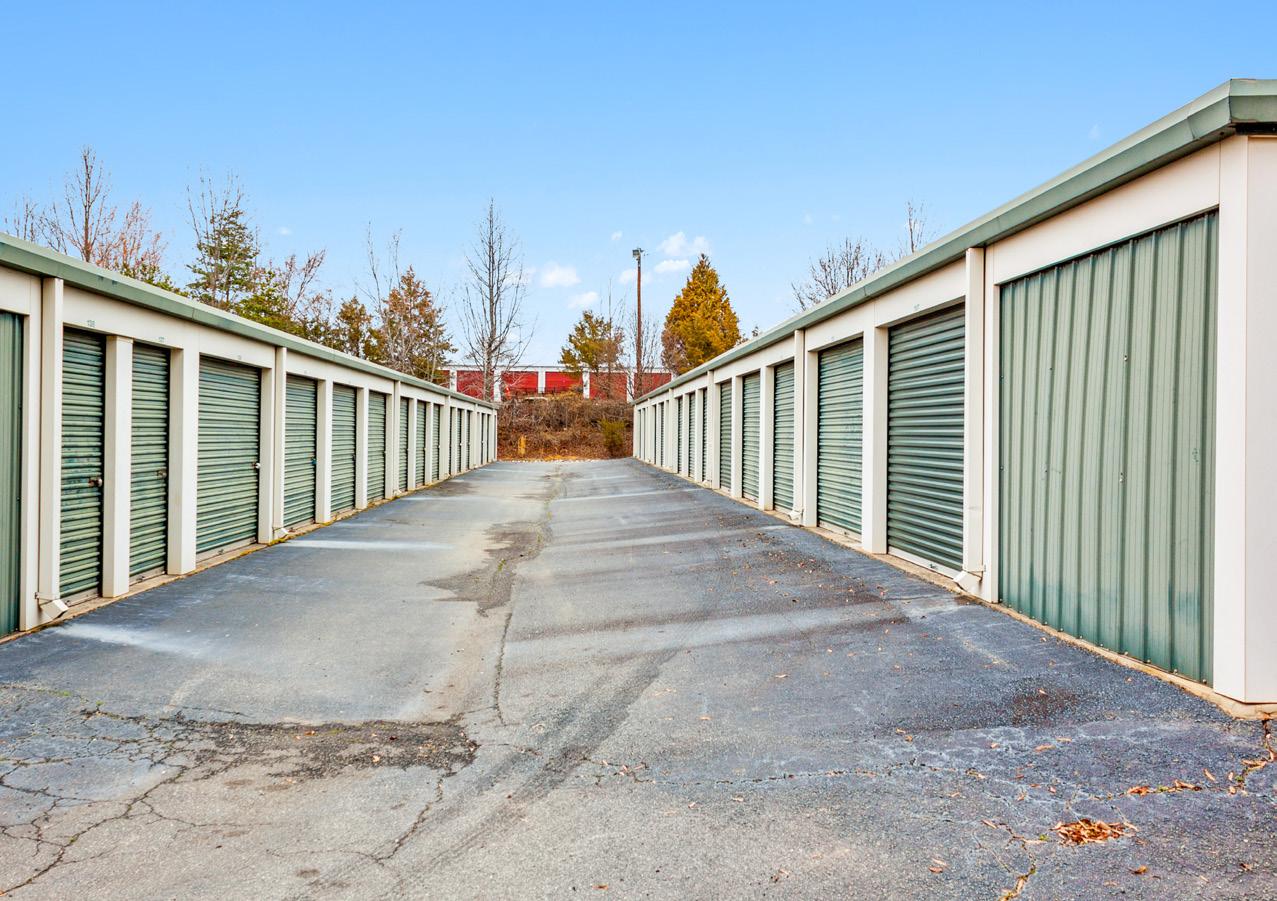


Outbox Storage is an institutional size self-storage facility strategically positioned along Charlotte Highway (20,500 VPD) in Mooresville, NC with easy access to I-77 and other local highways. This is a well diversified asset featuring a mix of climate controlled, drive-up and outdoor parking. The surrounding community (within 3 miles of the asset) has a population of 39,796 with an average household income of $94,097.
Charlotte is the second largest city in the southeast and is one of the fastest growing cities in the United States.


Mooresville is a large town located in southwestern section of Iredell County, North Carolina, and is a part of the fast- growing Charlotte Metro area. The Town of Mooresville had a population of 48,329 as of July 1, 2021. Mooresville is best known as the home of many NASCAR racing teams and drivers, along with an Indy Car team and its drivers, as well as racing technology suppliers, which has earned the town the nickname “Race City USA”. Also located in Mooresville is the corporate headquarters of Lowe’s Corporation and Universal Technical Institute’s NASCAR Technical Institute. It is located approximately 25 miles to Charlotte.
Due to the city’s close proximity, Charlotte’s economy also affects Mooresville’s. Charlotte is home to the corporate headquarters of Bank of America and the east coast operations of Wells Fargo, which among other financial operations makes it the second largest banking center in the United States. The Charlotte MSA is headquartered to 8 Fortune 500 and 7 Fortune 1000 companies including Bank of America, Duke Energy, Sealed Air Corporation, Nucor Steel, and Lowe’ s Home Improvement Stores. Additional headquarters include Harris Teeter, Food Lion, Cheerwine and Sundrop. It is home to one of the worlds’ s busiest airports, Charlotte Douglas International Airport, and is also the Carolinas’ largest manufacturing region. Charlotte was voted” Top 20 Cities to Live In” and since then more people have moved into the Queen city helping its economy increase.
Mooresville is branded as “Race City USA”. The town is home to more than 60 NASCAR teams and racing- related businesses, as well as an Indy Car team. Mooresville features two automotive museums: the Memory Lane Motorsports and Historical Automotive Museum, and the North Carolina Auto Racing Hall of Fame. The Mooresville Convention & Visitors Bureau is the official resource for travelers. Culture is rich in Charlotte area, with places like the Blumenthal Performing Arts Center, the Mint Museum and the Levine Museum of the New South offering plenty of opportunities to learn. Among Charlotte’ s many notable attractions, some of the most popular include the Carolina Panthers of the NFL, the Charlotte Hornets of the NBA, two NASCAR Sprint Cup races and the NASCAR All- Star Race, the Wells Fargo Championship, the NASCAR Hall of Fame, Carowinds park, and the U. S. National Whitewater Center.


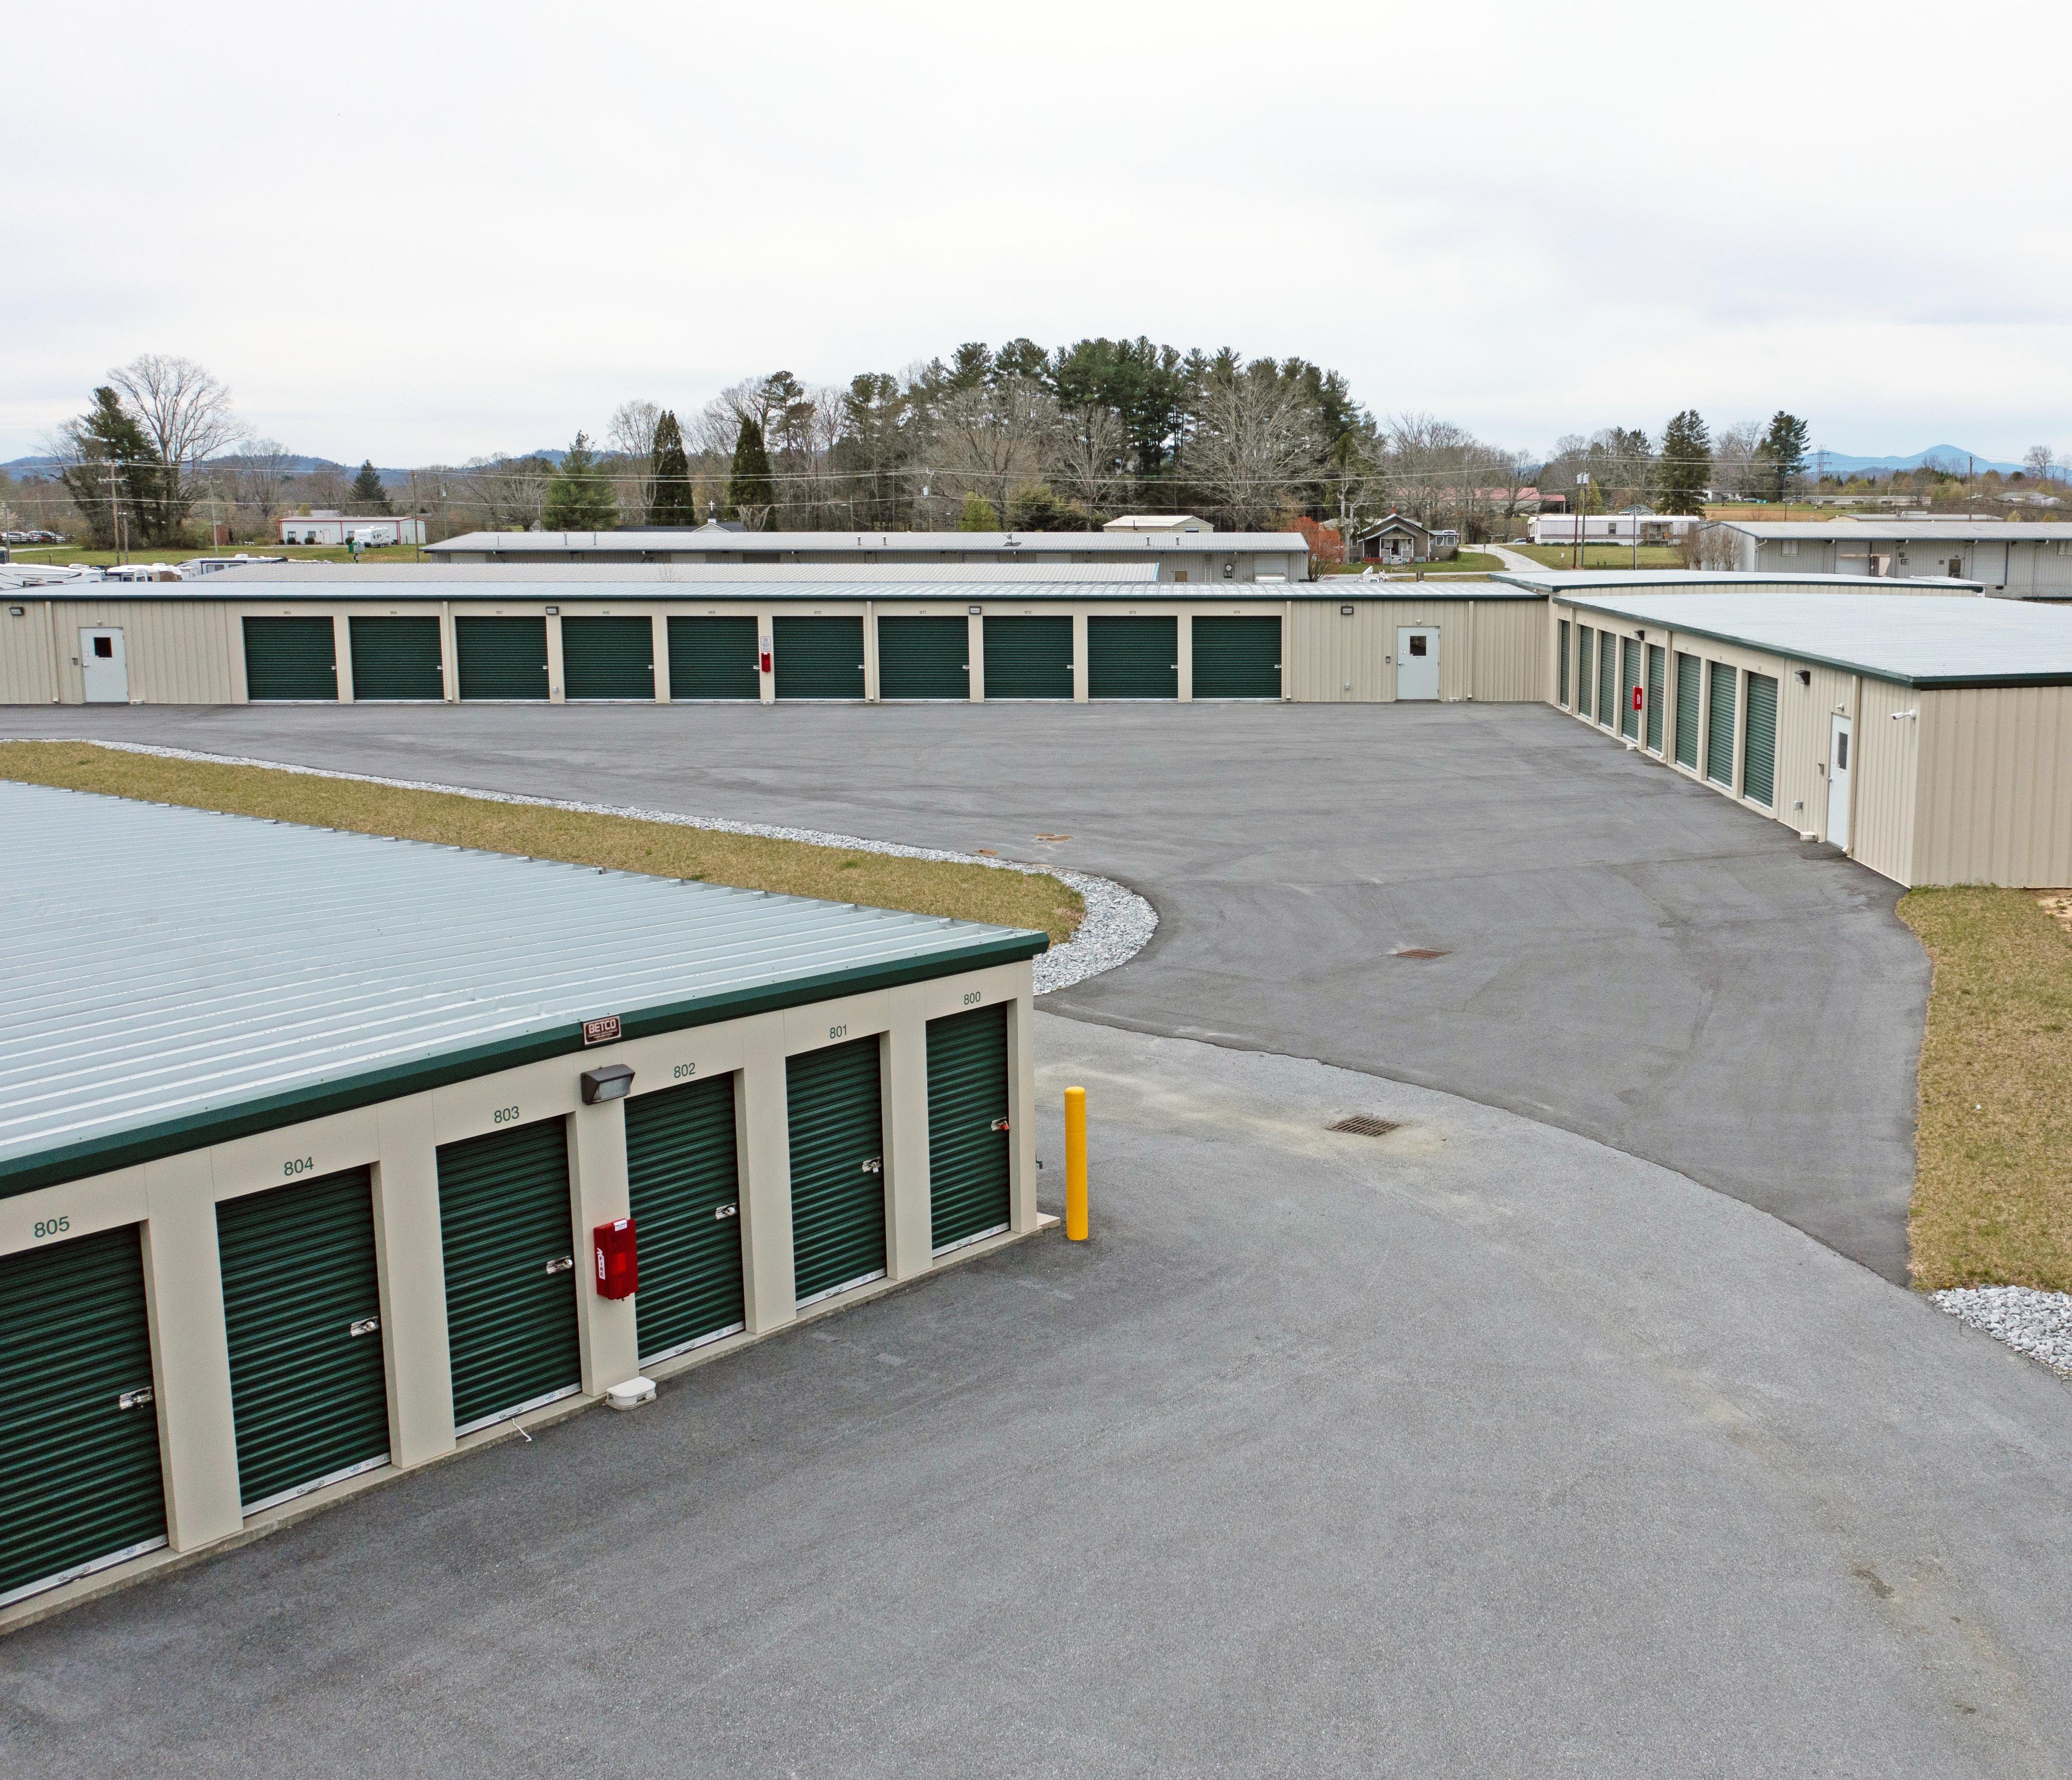
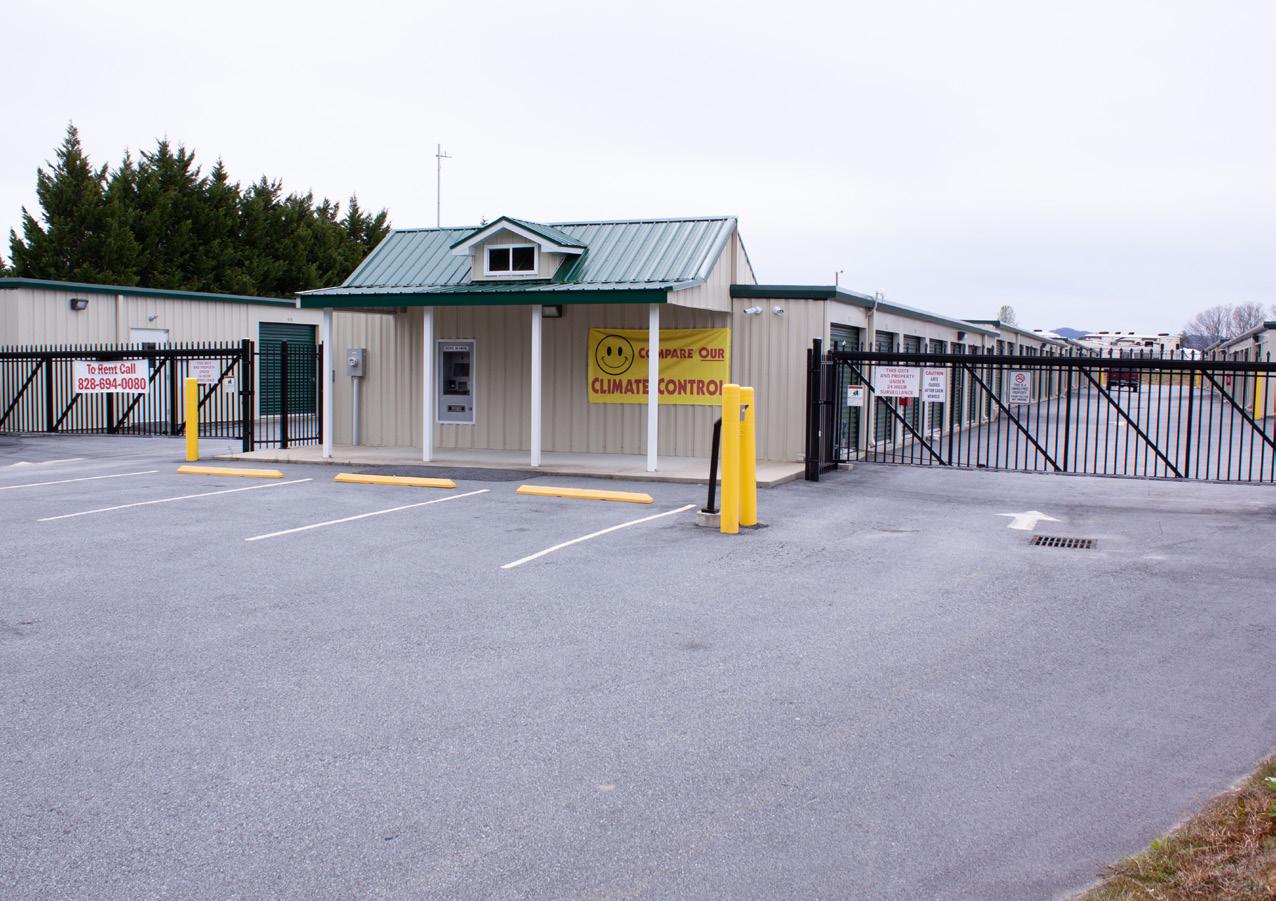
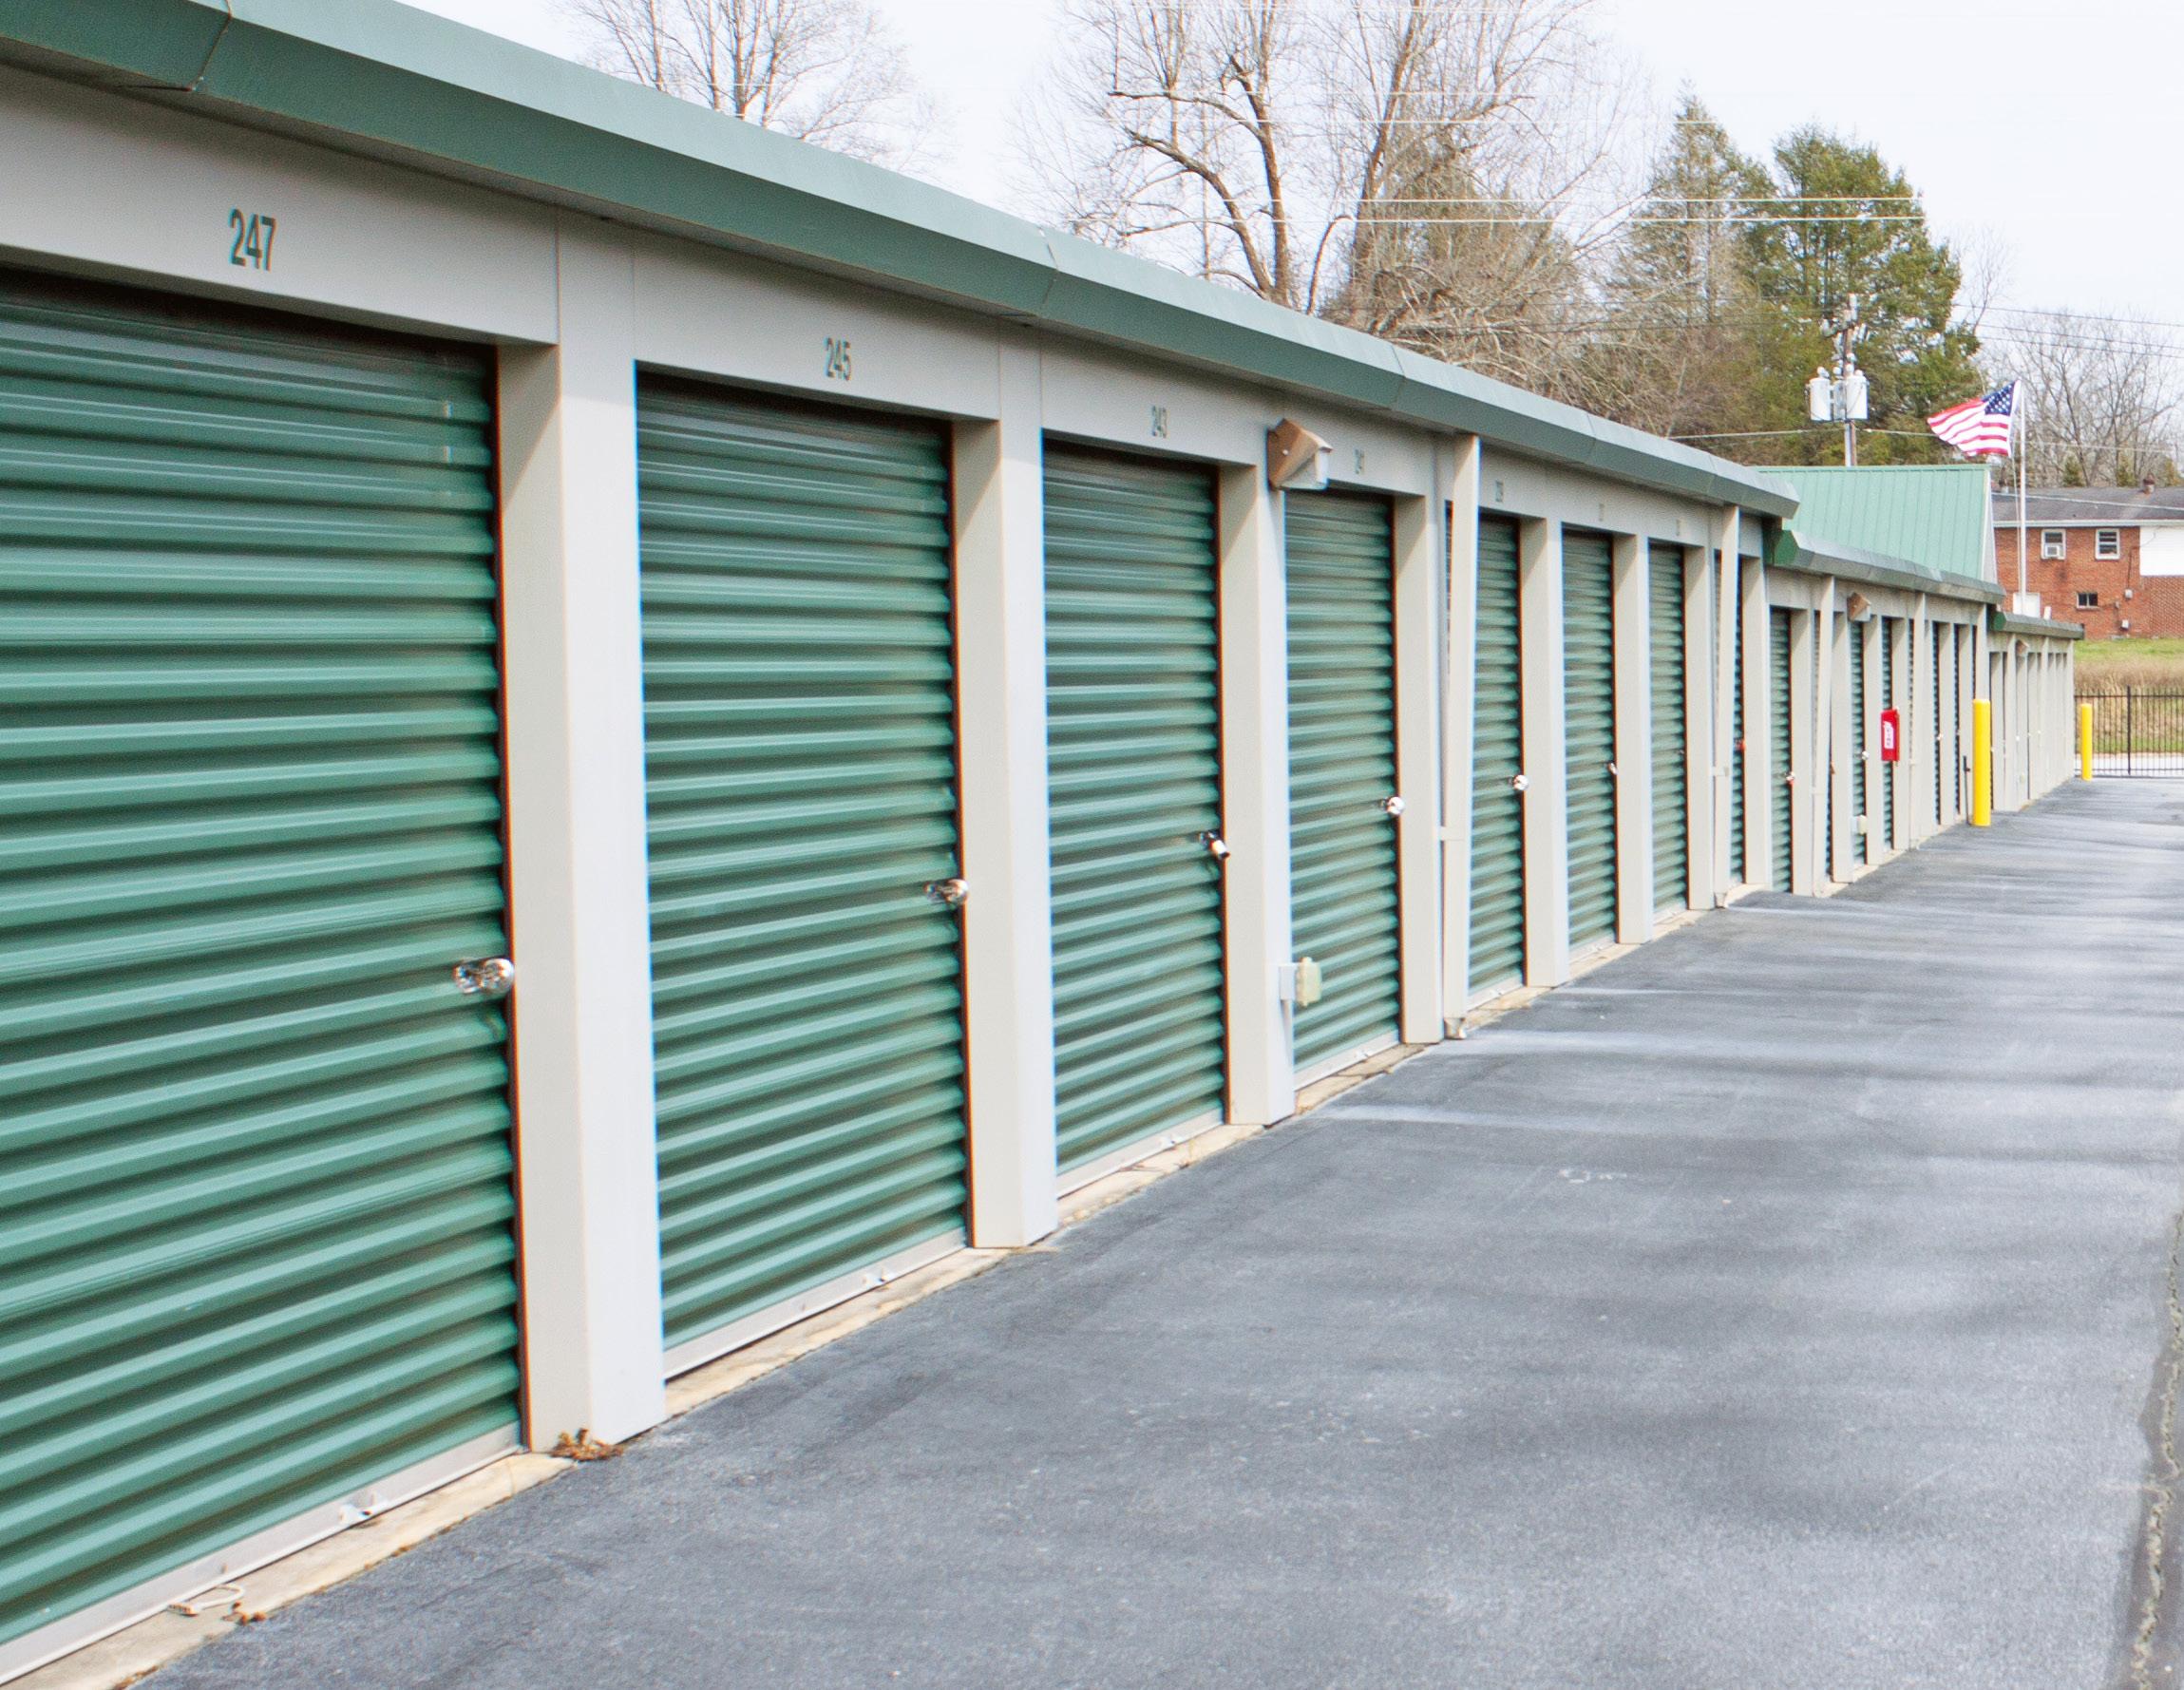
The PassiveInvesting.com Self-Storage team has identified the 743-Unit single-story Eagle self-storage facilities at 783 S. Allen Road in Flat Rock, NC and 2121 Spartanburg Hwy in East Flat Rock, NC, a suburb of Asheville, NC for acquisition.


The Eagle Self-Storage portfolio consists of two facilities located 1.88 miles from each other in a thriving suburb of Asheville, NC. The 5-mile trade area has grown 1% annually since 2010, and is projected to grow another 0.90% annually in the next 5 years.
Asheville, NC is home to a growing business community. With a $20 billion economy, the key industries driving Asheville’s economic growth include healthcare, science, technology, arts & culture, tourism, and many more.

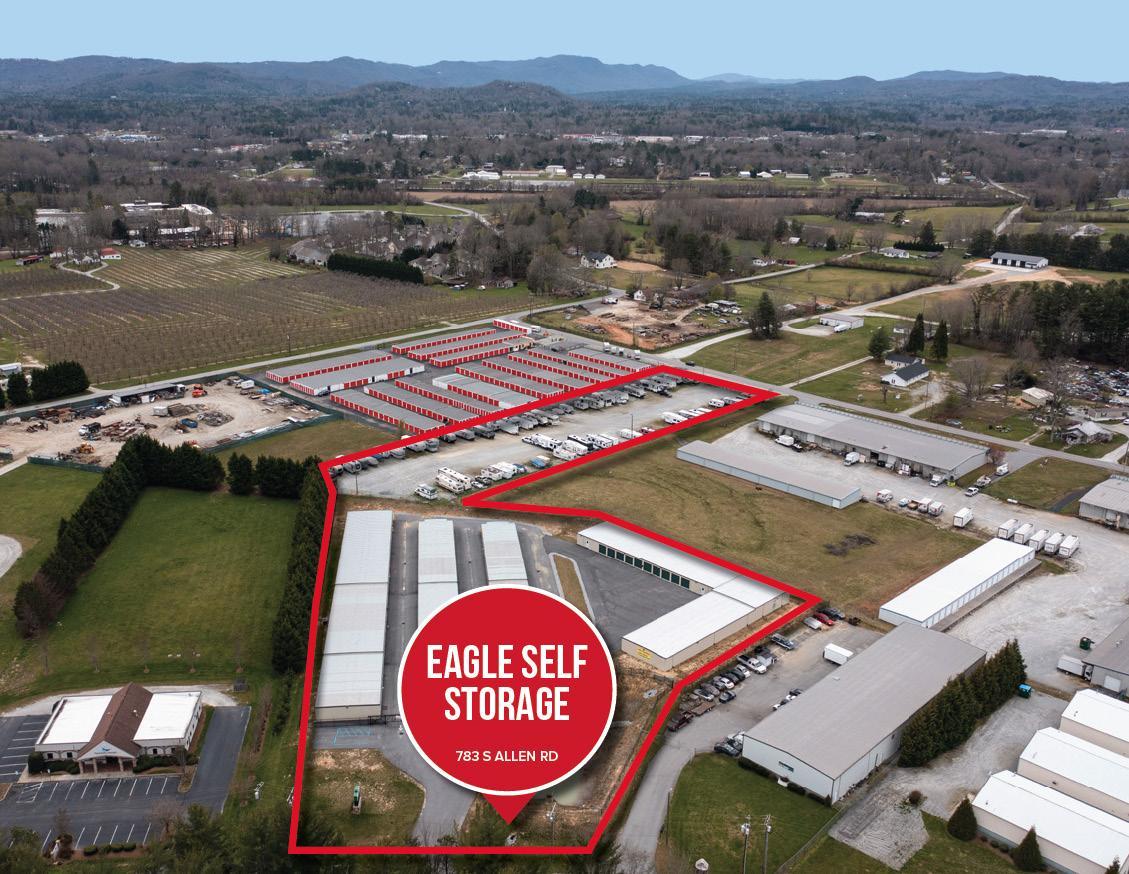


Flat Rock is a small town located in south-central Henderson County. It is bordered to the north by Hendersonville, and to the east by unincorporated East Flat Rock. North Carolina Highway 225 is the main road through the city, leading north 4 miles to the center of Hendersonville. Asheville is 25 miles to the north and the South Carolina border is 8 miles to the south.
Flat Rock is a historic residential community with forested landscapes and scenic vistas along winding byways. Rich with history, tradition, and beauty, the Village of Flat Rock is a place where people come to visit and many choose to stay.


Home to the Carl Sandburg Home National Historic Site, a National Park service property, and the Flat Rock Playhouse, the State Theatre of North Carolina, much of the village is in the National Register of Historic Places.


With a population of over 91,500 residents, Asheville is the county seat of Buncombe County, North Carolina. Asheville has a thriving economy with major employers serving the healthcare, science, and technology industries. Asheville’s economy continues to grow as several developments are currently in progress and are sure to add more job opportunities in the area. The city also offers lots of attractions including an estate with a castle, stunning views of mountain ranges, and shopping and dining destinations. Asheville is famously known for being the prime location for shooting cinematic masterpieces such as The Hunger Games, Hannibal, and Forrest Gump. The city is also home to several institutions of higher education including the University of North Carolina, Asheville, where over 3,600 students attend classes. The city of Asheville offers a remarkable quality of life due to its prospering economy, variety of attractions, and southern hospitality.
Asheville is home to a growing business community. With a $20 billion economy, the key industries driving Asheville’s economic growth include healthcare, science, technology, arts & culture, tourism, and many more. Due to its ideal location, which is midway between Washington D.C. and Miami, businesses can easily access all major East coast markets including Canada from Asheville. Asheville is home to UNC Asheville which produces welleducated and highly-skilled professionals that are ready to make a difference in the workforce. With its diverse workforce, accessibility, and a variety of urban amenities, Asheville is the ideal place for any business to thrive.







$20,394


$21,042 $21,467
$20,864 $21,285 $21,715
$10,313 $10,521 $10,734
$25,783 $26,303 $26,834
$2,630


$14,007






Modbox Storage - Evans Denver, CO 22-June $6,525,500 43,185 421
Modbox Storage -Piedmont Greenville, SC 22-Mar $11,500,000 110,883 702
Modbox Storage -High Point Greensboro/ Winston Salem, NC 22-Mar $10,200,000 62,911 649
Modbox Storage -Brighton Denver, CO 22-Jan $9,300,000 76,350 696
Modbox Storage -Mint Hill Charlotte, NC 21-Dec $16,900,000 98,050 625
Modbox Storage -Arvada Denver, CO 21-Nov $13,600,000 80,010 672
Modbox StorageMebane Compass Pointe Raleigh/ Chapel Hill, NC 21-Oct $10,200,000 62,667 592

Modbox StorageMebane Arrowhead Raleigh/ Chapel Hill, NC 21-Aug $8,600,000 60,975 530
Modbox Storage - Gastonia Charlotte, NC 21-Mar $3,600,000 14,900 95
TOTAL $90,425,500 609,931
Property Market
Braxton Cary Weston Cary, NC 27% 14 Months 34.49% 34.47% 1.40x
Orchard Park Greenville, SC 74% 27 Months 29.10% 26.40% 1.65x Willowbrook Greenville, SC 56% 31 Months 22.90% 19.20% 1.59x

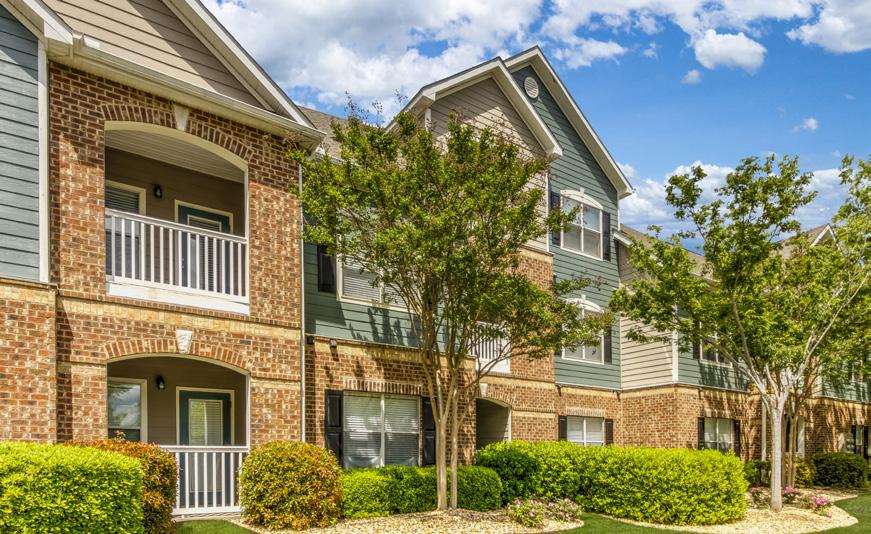
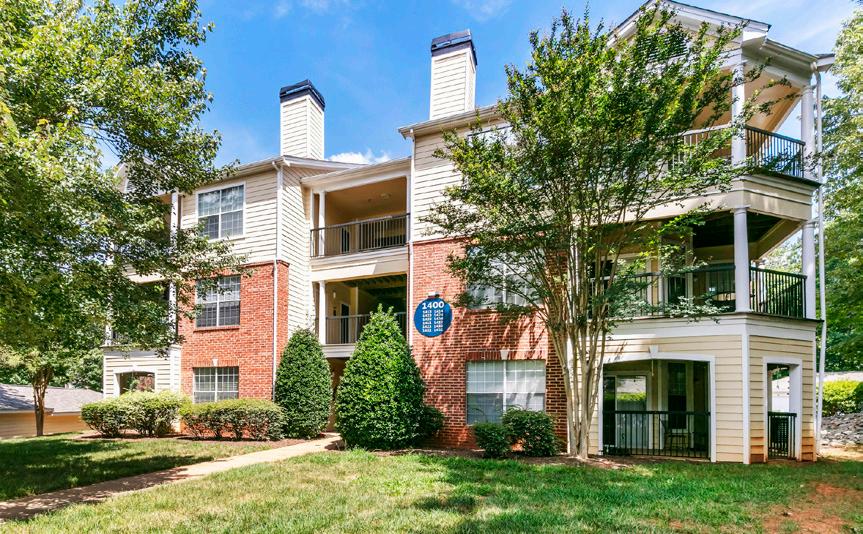

Braxton at Brier Creek Raleigh, NC 55% 25 Months 42.5% 33.3% 1.89x
Pines on Wendover Charlotte, NC 66% 26 Months 19.5% 18.66% 1.42x 2207 North Greenville, SC 53% 30 Months 22.7% 21% 1.57x

Copper Storage Solutions is a third party management solution for owners and operators of fully-automated, unattended self storage facilities. Our ability to manage the facility remotely allows us to provide these services for a fraction of the cost of staffing your facility.


Copper manages call center set-up and management, revenue management, lien auction process, maintenance consulting services, marketing services and basic bookkeeping services.

» Capitalization Rate (Cap Rate) – A rate of return on a real estate investment property based on the expected income that the property will generate. Capitalization rate is used to estimate the investor’s potential return on his or her investment. This is done by dividing the income the property will generate (after fixed costs and variable costs) by the total value of the property.
◊
When acquiring income property, the higher the capitalization rate (“Cap Rate”), the better.

When selling income property, the lower the Cap Rate the better.
◊ A higher cap rate implies a lower price, a lower cap rate implies a higher price.
» Cash Flow – Cash generated from the operations of a company, generally defined as revenues less all operating expenses.
» Cash-on-Cash – A rate of return often used in real estate transactions. The calculation determines the cash income on the cash invested.
◊ Calculated: Annual Dollar Income Return / Total Equity Invested = Cash-on-Cash
» Debt Service Coverage Ratio (DSCR) – It is the multiples of cash flow available to meet annual interest and principal payments on debt. This ratio should ideally be over 1. That would mean the property is generating enough income to pay its debt obligations.
» Investor Average Annual Return, excluding disposition – The average return per year during the investment hold. This calculation does not include the return of invested capital.
» Investor Average Annual Return, including disposition – The average return per year including profits from disposition.
» Internal Rate of Return (IRR) – The rate of return that would make the present value of future cash flows plus the final market value of an investment opportunity equal the current market price of the investment or opportunity. The higher a project’s internal rate of return, the more desirable it is to undertake the project.

» Return on Equity (ROE) – The amount of net income returned as a percentage of shareholders equity.
◊ ROE is expressed as a percentage and calculated as: Return on Equity = Net Income/Shareholder’s Equity
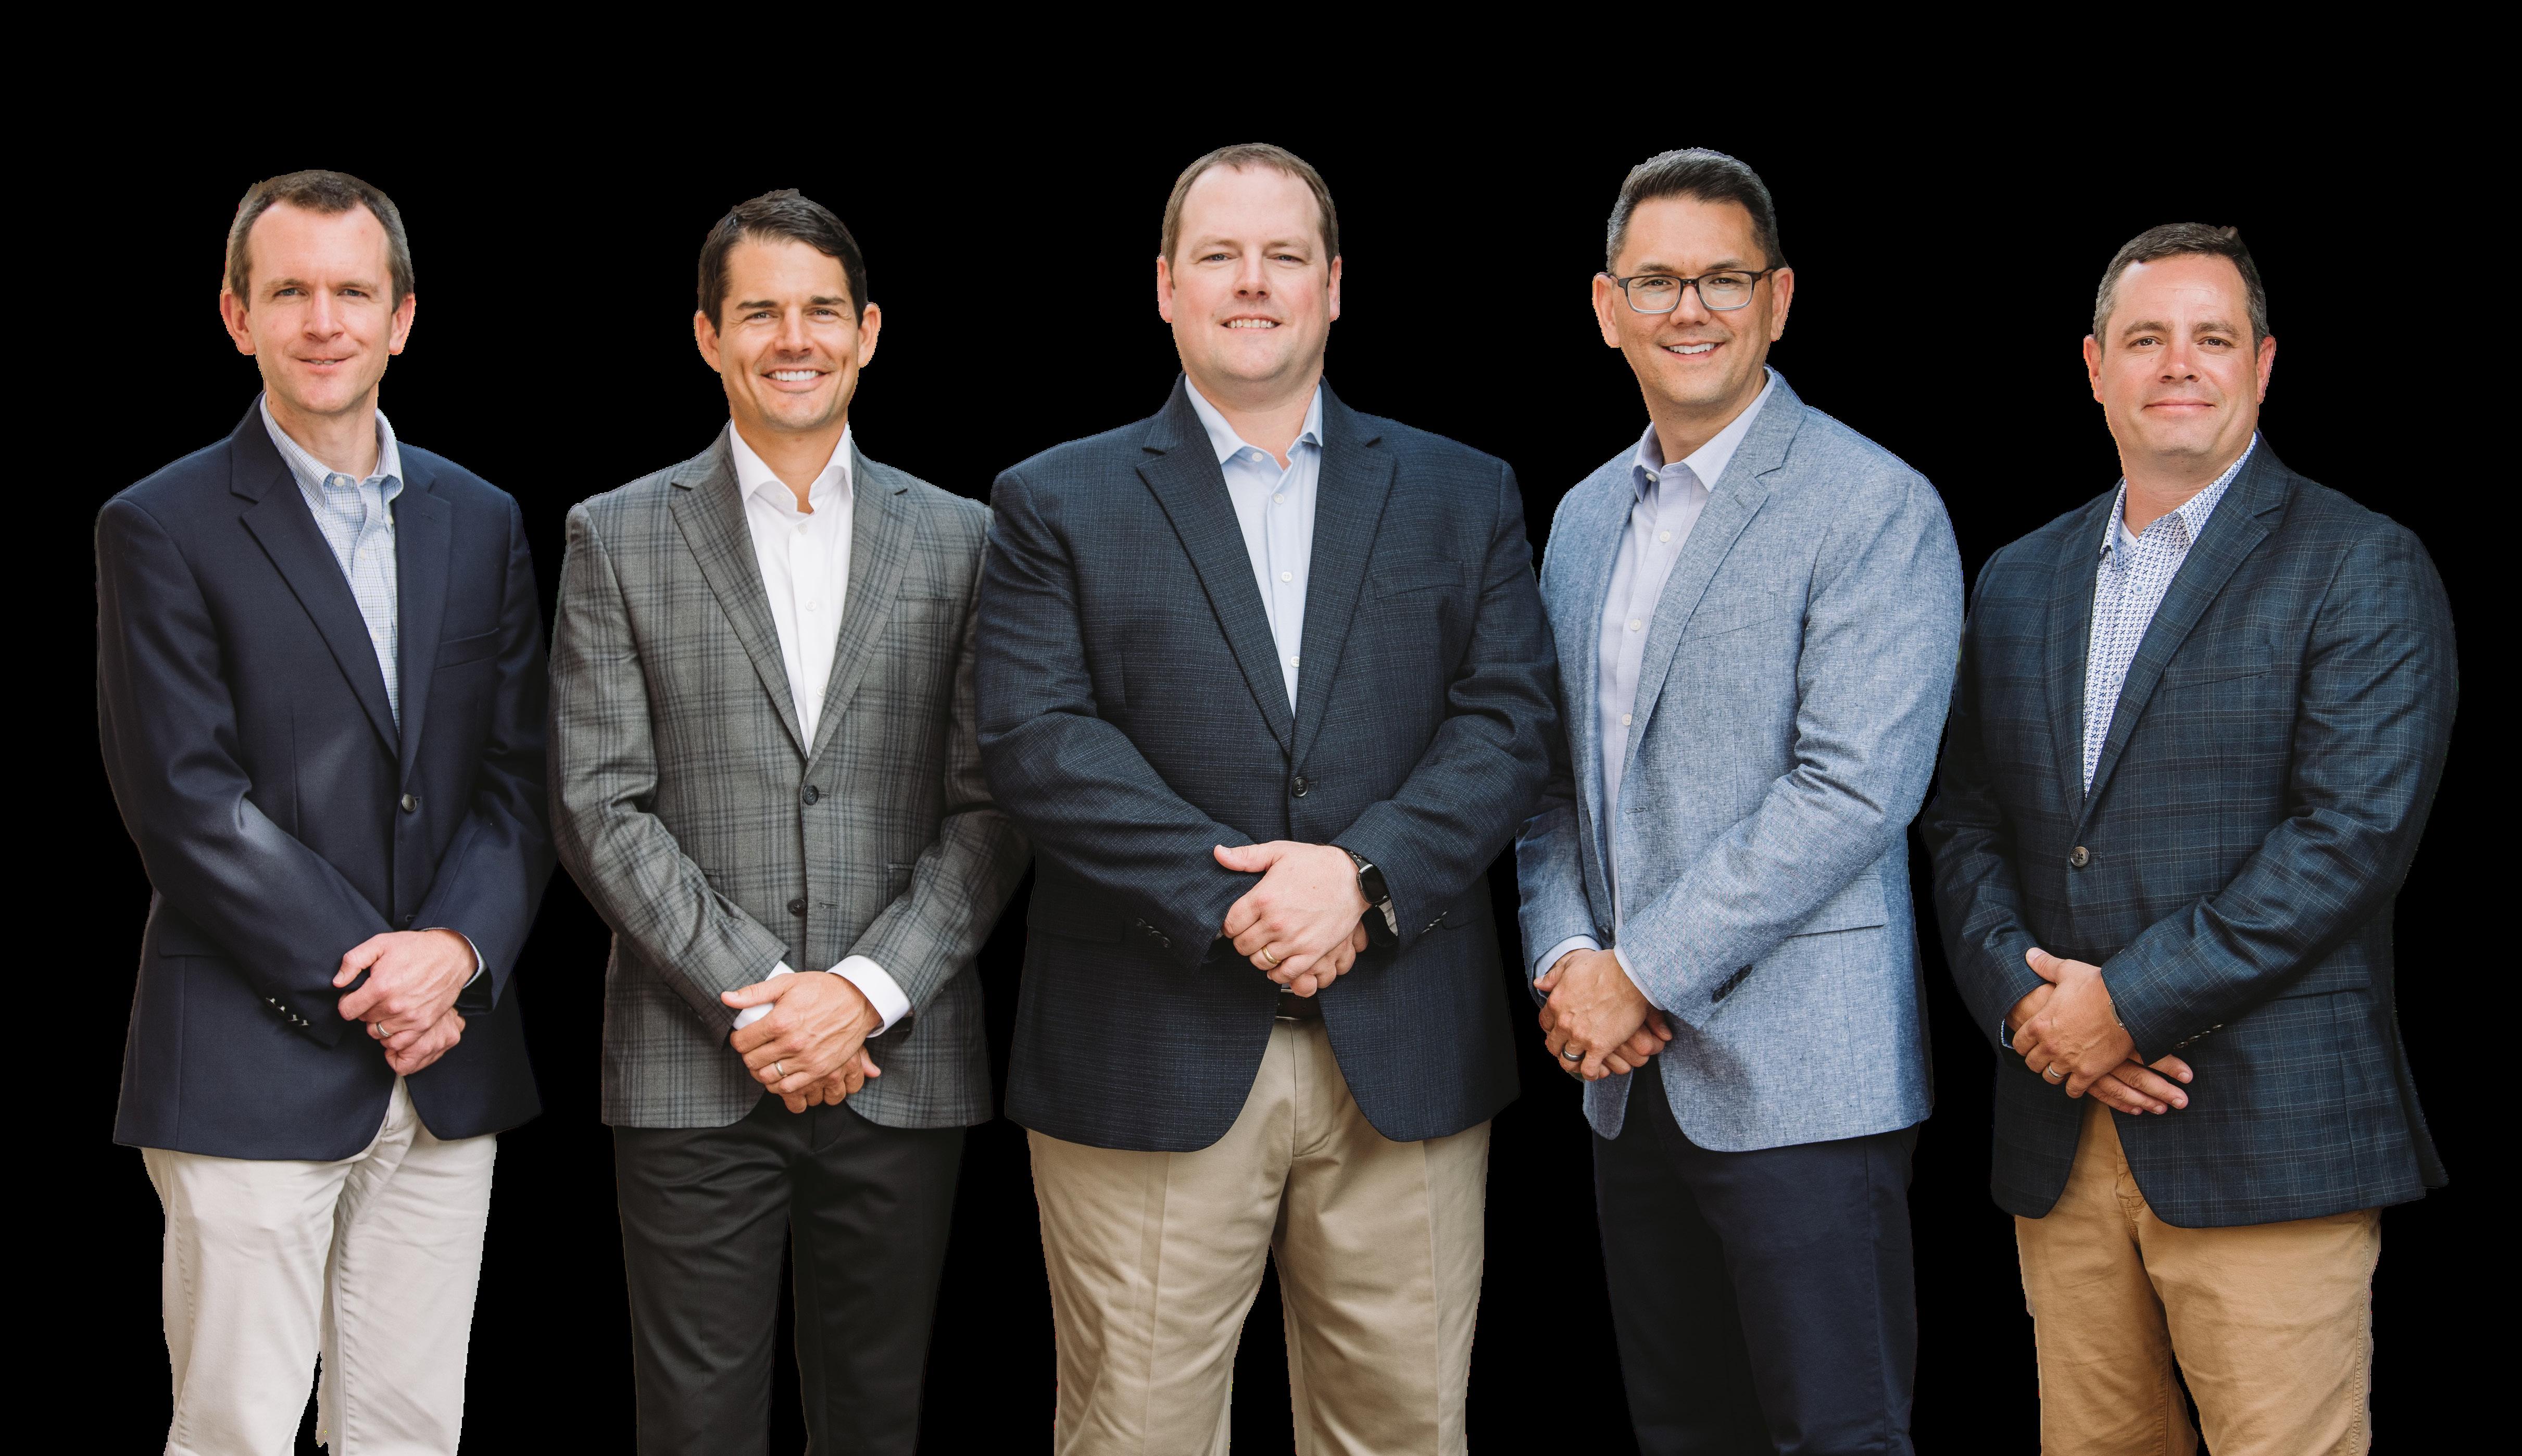
 DAN HANDFORD KRIS BENNETT BRANDON ABBOTTDANNY RANDAZZO
The PassiveInvesting.com Team has been investing in commercial real estate assets since 2013 with a portfolio of over $1.2 Billion in acquisitions.








 BRIAN BORNHORST DIRECTOR, ASSET MANAGEMENT
ANDREW DAVIS DIRECTOR, INVESTOR RELATIONS
MELISSA BROOM DIRECTOR, MARKETING & PR
ERIC FITZGERALD DIRECTOR, ACQUISITIONS
TAO BRODY DIRECTOR, FINANCE
WHITNEY HUTTEN DIRECTOR, INVESTOR EDUCATION
ED GILMER DIRECTOR, CAPITAL MARKETS
TAYLOR CU INVESTOR RELATIONS ASSOCIATE
MARCO TRIPALO INVESTOR RELATIONS ASSOCIATE
CHRIS NEARY SENIOR ACQUISITIONS
VIC VERNER SELF-STORAGE ANALYST
HANNAH ALLISON
Craig is a Certified Public Accountant with 25 years experience as a senior finance executive in the financial industry. He founded Groundbreaking Real Estate in 2014 to support investors with growing their real estate portfolios. Craig is passionate about helping others grow their financial wealth and gave a Ted Talk on that topic.
Craig has personally owned and operated ten rental properties with a market value of $6 million. He has also passively invested in $260m worth of multi-family and retail center projects. Craig acquired his NJ Real Estate Salesperson license. He holds a dual MBA from Columbia and London Business School.
