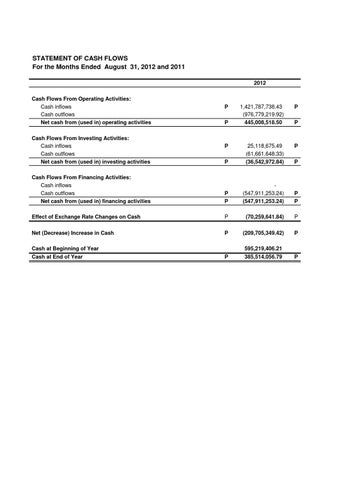
STATEMENT OF CASH FLOWS For the Months Ended August 31, 2012 and 2011 2012 Cash Flows From Operating Activities: Cash inflows Cash outflows Net cash from (used in) operating activities
1,421,787,738.43 (976,779,219.92) 445,008,518.50
P
P
P
25,118,675.49 (61,661,648.33) (36,542,972.84)
Cash Flows From Financing Activities: Cash inflows Cash outflows Net cash from (used in) financing activities
P P
(547,911,253.24) (547,911,253.24)
P P
Effect of Exchange Rate Changes on Cash
P
(70,259,641.84)
P
Net (Decrease) Increase in Cash
P
(209,705,349.42)
P
Cash Flows From Investing Activities: Cash inflows Cash outflows Net cash from (used in) investing activities
P P
P
Cash at Beginning of Year Cash at End of Year
P
P
595,219,406.21 P
385,514,056.79
P
2011
1,253,033,894.77 (922,708,734.70) 330,325,160.06
136,258,801.96 (88,019,514.22) 48,239,287.74
(558,292,416.64) (558,292,416.64) (63,615,349.50) (243,343,318.34) 584,881,002.96 341,537,684.62