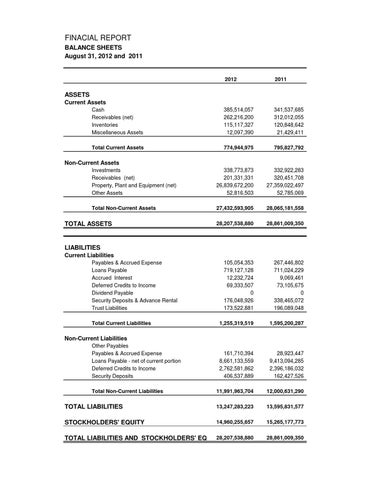
FINACIAL REPORT BALANCE SHEETS August 31, 2012 and 2011
2012
2011
Cash Receivables (net) Inventories Miscellaneous Assets
385,514,057 262,216,200 115,117,327 12,097,390
341,537,685 312,012,055 120,848,642 21,429,411
Total Current Assets
774,944,975
795,827,792
Investments Receivables (net) Property, Plant and Equipment (net) Other Assets
338,773,873 201,331,331 26,839,672,200 52,816,503
332,922,283 320,451,708 27,359,022,497 52,785,069
Total Non-Current Assets
27,432,593,905
28,065,181,558
28,207,538,880
28,861,009,350
0
0
105,054,353 719,127,128 12,232,724 69,333,507 0 176,048,926 173,522,881
267,446,802 711,024,229 9,069,461 73,105,675 0 338,465,072 196,089,048
1,255,319,519
1,595,200,287
161,710,394 8,661,133,559 2,762,581,862 406,537,889
28,923,447 9,413,094,285 2,396,186,032 162,427,526
11,991,963,704
12,000,631,290
TOTAL LIABILITIES
13,247,283,223
13,595,831,577
STOCKHOLDERS' EQUITY
14,960,255,657
15,265,177,773
28,207,538,880 TOTAL LIABILITIES AND STOCKHOLDERS' EQUITY
28,861,009,350
ASSETS Current Assets
Non-Current Assets
TOTAL ASSETS
LIABILITIES Current Liabilities Payables & Accrued Expense Loans Payable Accrued Interest Deferred Credits to Income Dividend Payable Security Deposits & Advance Rental Trust Liabilities Total Current Liabilities
Non-Current Liabilities Other Payables Payables & Accrued Expense Loans Payable - net of current portion Deferred Credits to Income Security Deposits Total Non-Current Liabilities