5 minute read
Adult Prevalence of Mental Illness
Adults With Any Mental Illness (AMI)

Advertisement

19.86% of adults are experiencing a mental illness.
Equivalent to nearly 50 million Americans.
4.91% are experiencing a severe mental illness.
The states with the largest increases in Adults With Any Mental Illness (AMI) were Ohio (2.24%), Nebraska (2.22%), Wyoming (2.22%), and Oklahoma (2.11%).
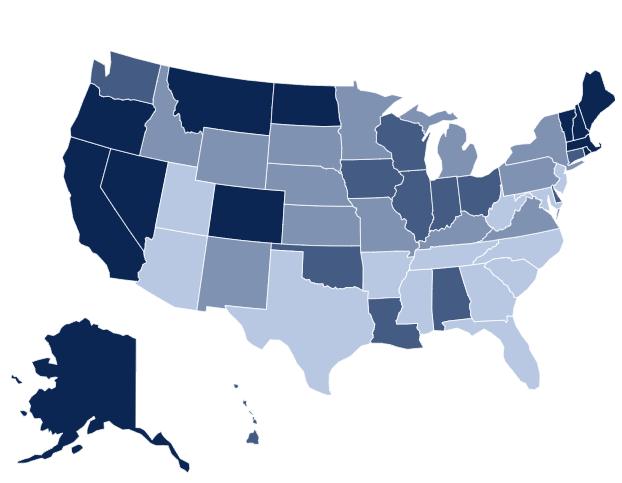
The state prevalence of adult mental illness ranges from: 16.37% (NJ) 26.86 % (UT) Ranked 1-13 Ranked 39-51
Rank State % #

1 New Jersey 2 Texas 3 Florida 16.37 1,122,000 17.17 3,602,000 17.23 2,903,000
4 Hawaii 17.45 185,000
5 Maryland
17.57 810,000 6 Georgia 17.88 1,406,000 7 South Dakota 18.26 118,000 8 Iowa 18.50 441,000 9 Virginia 18.58 1,199,000 10 Connecticut 18.85 526,000 11 Illinois 19.18 1,858,000 12 North Carolina 19.31 1,532,000 13 Tennessee 19.40 1,006,000 14 South Carolina 19.43 760,000 15 California 19.49 5,864,000 16 New York 19.52 2,972,000 17 Pennsylvania 19.70 1,963,000 18 Arizona 20.06 1,099,000 19 Mississippi 20.16 446,000 20 Wisconsin 20.19 904,000 21 Nebraska 20.30 290,000 22 Michigan 20.32 1,571,000 23 Arkansas 20.34 460,000 24 North Dakota 20.50 116,000 25 Minnesota 20.53 876,000 26 Kansas 20.56 442,000 Rank State % #
27 Montana
20.81 171,000 28 Delaware 20.92 157,000 29 Massachusetts 21.15 1,157,000 30 Louisiana 21.21 734,000 31 Alabama 21.29 794,000 32 New Mexico 21.39 338,000 33 Alaska 21.47 113,000 34 Nevada 21.97 512,000 35 Maine 22.10 238,000 36 Vermont 22.25 112,000 37 Indiana 22.29 1,125,000 38 New Hampshire 22.37 243,000 39 Rhode Island 22.38 187,000 40 Idaho 22.48 293,000 41 Oklahoma 22.54 657,000 42 Kentucky 22.54 762,000 43 Wyoming 22.56 98,000 44 Missouri 22.71 1,056,000 45 District of Columbia 22.83 129,000 46 Colorado 23.20 1,014,000 47 Washington 23.43 1,360,000 48 Ohio 23.64 2,112,000 49 Oregon 23.75 783,000 50 West Virginia 24.62 347,000 51 Utah 26.86 599,000 National 19.86 49,564,000
According to SAMHSA, “Any Mental Illness (AMI) is defined as having a diagnosable mental, behavioral, or emotional disorder, other than a developmental or substance use disorder, assessed by the Mental Health Surveillance Study (MHSS) Structured Clinical Interview for the Diagnostic and Statistical Manual of Mental Disorders—Fourth Edition—Research Version—Axis I Disorders (MHSS-SCID), which is based on the 4th edition of the Diagnostic and Statistical Manual of Mental Disorders (DSM-IV).”

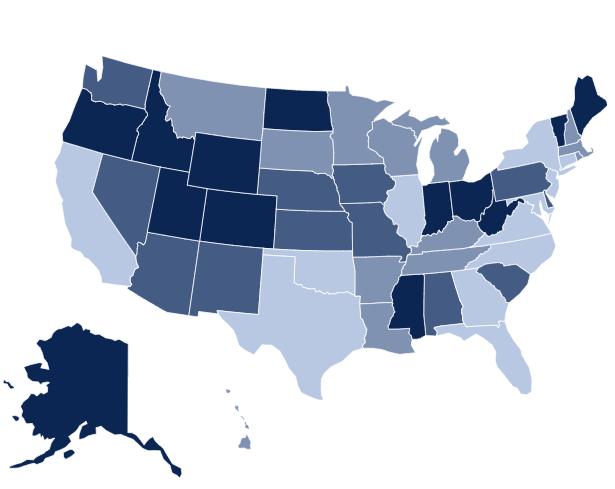
The state prevalence of adults with substance use disorder ranges from: 5.98% (FL) Ranked 1-13 12.30% (D.C.) Ranked 39-51 7.74% of adults in America reported having a substance use disorder in the past year.


2.97% of adults in America had an illicit drug use disorder in the past year.
5.71% of adults in America had an alcohol use disorder in the past year.
The largest increases in the prevalence of adults with substance use disorder were in Hawaii (1.32%) and California (1.11%). The largest decreases were in South Dakota (1.48%) and Iowa (1.08%).
Rank State % #

1 Florida 5.98 1,007,000 2 West Virginia 6.29 89,000 3 Texas 6.48 1,360,000 4 Utah 6.56 146,000 5 Georgia 6.60 519,000 6 New Jersey 6.71 459,000 7 South Carolina 6.73 263,000 8 Maryland 7.01 323,000 9 Arizona 7.11 390,000 10 Mississippi 7.15 158,000 11 Arkansas 7.16 162,000 12 Tennessee 7.22 375,000 13 North Carolina 7.26 576,000 14 Kansas 7.29 157,000 15 Pennsylvania 7.31 728,000 16 Virginia 7.33 473,000 17 New York 7.43 1,131,000 18 Michigan 7.56 585,000 19 Minnesota 7.62 325,000 20 Idaho 7.67 100,000 21 South Dakota 7.69 50,000 22 New Mexico 7.70 122,000 23 Missouri 7.71 358,000 24 Nebraska 7.71 110,000 25 Wyoming 7.84 34,000 26 Kentucky 7.87 266,000 Rank State % #
27 Alabama 28 Ohio 29 Wisconsin 30 Oklahoma 31 Illinois 32 Iowa 33 Louisiana 34 Indiana 35 Connecticut 36 Hawaii 37 Washington 38 Delaware 39 Massachusetts 40 New Hampshire 41 North Dakota 42 Maine 43 Rhode Island 44 California 7.89 294,000 7.94 709,000 7.98 358,000 8.01 234,000 8.02 777,000 8.05 192,000 8.06 279,000 8.42 425,000 8.43 235,000 8.45 90,000 8.62 500,000 8.79 66,000 8.83 483,000 8.84 96,000 8.88 50,000 8.89 96,000 8.95 75,000 9.23 2,778,000
45 Nevada 9.32 217,000
46 Oregon 47 Montana 48 Vermont 9.78 322,000 10.04 83,000 10.10 51,000
49 Alaska
10.23 54,000 50 Colorado 11.75 514,000 51 District of Columbia 12.30 70,000 National 7.74 19,314,000

The state prevalence of adults with serious thoughts of suicide ranges from: 3.79% (NJ) Ranked 1-13 6.19% (UT) Ranked 39-51 The percentage of adults reporting serious thoughts of suicide is 4.58%. The estimated number of adults with serious suicidal thoughts is over 11.4 million—an increase of 664,000
people from last year’s data set.


The national rate of adults experiencing suicidal ideation has increased every year since 2011-2012.
States with the highest increases in suicidal ideation were Ohio (0.92%), Wyoming (0.70%), and Pennsylvania (0.66%).
Utah has had the highest rate of suicidal ideation among adults every year since 2012-2013.
Rank State % #

1 New Jersey 2 Georgia
3.79 260,000 3.85 303,000 3 Texas 3.86 812,000 4 North Carolina 3.87 307,000 5 Illinois 4.00 388,000 6 Florida 4.04 682,000 7 New York 4.21 642,000 8 Virginia 4.22 272,000 9 Maryland 4.34 200,000 10 District of Columbia 4.43 25,000 11 Connecticut 4.46 125,000 12 California 4.55 1,370,000 13 Oklahoma 4.58 134,000 14 Rhode Island 4.59 38,000 15 Michigan 4.61 357,000 16 South Dakota 4.62 30,000 17 Montana 4.63 38,000 18 Wisconsin 4.66 209,000 19 Tennessee 4.68 243,000 20 Kentucky 4.68 158,000 21 New Hampshire 4.68 51,000 22 Arkansas 4.71 107,000 23 Louisiana 4.72 163,000 24 Minnesota 4.74 202,000 25 Hawaii 4.74 50,000 26 Massachusetts 4.77 261,000 Rank State % #
27 New Mexico 28 Pennsylvania 29 Alabama
4.81 76,000 4.83 482,000 4.83 180,000 30 Nebraska 4.88 70,000 31 South Carolina 4.89 191,000 32 Washington 4.92 286,000 33 Iowa 4.94 118,000 34 Nevada 4.94 115,000 35 Kansas 4.96 107,000 36 Arizona 5.01 275,000 37 Missouri 5.05 235,000 38 Delaware 5.18 39,000 39 North Dakota 5.28 30,000 40 Idaho 5.30 69,000 41 Mississippi 5.31 118,000 42 West Virginia 5.44 77,000 43 Maine 5.44 59,000 44 Colorado 5.54 242,000 45 Indiana 5.62 284,000 46 Oregon 5.65 187,000 47 Vermont 5.66 29,000 48 Wyoming 5.74 25,000 49 Ohio 6.09 545,000 50 Alaska 6.11 32,000 51 Utah 6.19 138,000 National 4.58 11,434,000


