

Dairy Data Highlights
2022 Edition
TheNationalMilkProducersFederation(NMPF)developsandcarriesoutpoliciesthatadvancethewell-beingofdairyproducersand thecooperativestheyown. Forthepast100years,NMPFhasbeen oneofthemostrecognizableandinfluentialmembershiporganizationsinAmerica.
NMPF’scooperativemembersproducethemajorityoftheU.S.milk supply,makingNMPFthevoiceofmorethan20,000dairyfarmers. Lastyear,NMPFmembercooperativesmarketedabout154 billionpoundsofmilk,representing69%ofthetotalmilkmarketed intheUnitedStates. Inaddition,manyofNMPF’smembercooperativesareleadingprocessorsoffluidmilk,cheese,butter,milkpowder,andspecialtydairyproducts.
NMPFistheprincipalvoiceonnationalissuesforcooperativesand theirdairyfarmermembers.

TABLE OF CONTENTS
U.S. MILK PRODUCTION & OTHER INDUSTRY STATISTICS Table 1: U.S. Production of Milk, Milkfat, & Solids-Not-Fat..........................................1 Table 2: U.S. Milk Cow Numbers, Dairy Farms, & Herd Size 2 Table 3: Dairy Farms & Milk Production by Herd Size...................................................3 Table 4: U.S. Production Per Cow of Milk, Milkfat, & Solids-Not-Fat 4 STRUCTURE OF THE DAIRY INDUSTRY BY STATE Table 5: Annual Milk & Milkfat Production Per Cow by State ......................................5 Table 6: Cow Numbers, Licensed Dairy Herds & Herd Size by State ............................6 Table 7: Milk Production by State 7 Table 8: Importance of the Dairy Sector by State............................................................9 PRODUCER, WHOLESALE, & RETAIL PRICES OF MILK & DAIRY PRODUCTS Table 9: Farm Level Milk Prices by State......................................................................10 Table 10: Selected Farm Level Annual Average Milk Prices........................................11 Table 11: Monthly Seasonality of U.S. All-Milk Price & Milk Production...................12 Table 12: Annual Wholesale Prices of Dairy Products 13 Table 13: Monthly Prices of Dairy Products on the Chicago Mercantile Exchange......13 Table 14: Annual Retail Prices for Selected Dairy Products 14 COSTS OF PRODUCTION INDICATORS Table 15: Milk Production Costs & Returns by Herd Size 15 Table 16: U.S. Milk Production Costs & Returns..........................................................17 Table 17: Monthly Milk-Feed Price Ratio 18 Table 18: Monthly DMC/MPP Calculated Feed Cost....................................................18 Table 19: Monthly DMC/MPP Margin 19 Table 20: Average Prices Received for Livestock 20 Table 21: Average Prices Received for Crops................................................................21 Table 22: Crop Production 21 SCOPE OF FEDERAL MILK MARKETING ORDERS Table 23: Federal Market Order Statistics by Market....................................................22 Table 24: Measures of Growth in Federal Milk Marketing Orders................................23 Table 25: Sales & Butterfat Content of Fluid Milk Products in Federal Milk Marketing Orders................................................................24 DAIRY PRODUCT CONSUMPTION & PRODUCTION Table 26: Annual Commercial Disappearance of Dairy Products, Milk Equivalent, Total Milk Solids Basis ....................................................25 Table 27: Per Capita Commercial Disappearance of Dairy Products, Milk Equivalent, Total Milk Solids Basis 25 Table 28: Share of Commercial Disappearance by Product...........................................26 Table 29: Fluid Milk Sales for Beverage Products 27 Table 30: Per Capita Fluid Milk Sales: Selected Products.............................................27 Table 31: Fluid Milk Sales for Cream/Other Products 28
Table 32: Cheese Production, Selected Varieties 29 Table 33: Per Capita Cheese Consumption, Selected Varieties......................................29 Table 34: Production of Butter, NFDM, & Other Products............................................30 Table 35: Per Capita Consumption of Butter, Cottage Cheese, NFDM, & Other Products ............................................................................30 Table 36: Production of Frozen Dairy Products 31 Table 37: Per Capita Consumption of Frozen Dairy Products........................................31 Table 38: Cheese, Butter, & NFDM Production, by State 32 Table 39: Plants Processing Dairy Products & Volume Per Plant..................................33 GOVERNMENT COST OF FARM COMMODITY PROGRAMS Table 40: CCC Net Outlays by Commodity...................................................................34 U.S. DAIRY TRADE Table 41: U.S. Fresh Milk & Cream Exports 35 Table 42: U.S. Butter and Cheese Exports.....................................................................36 Table 43: U.S. Milk Powder Exports.............................................................................37 Table 44: U.S. Ice Cream & Yogurt Exports 38 Table 45: U.S. Whey & Lactose Exports.......................................................................39 Table 46: Commercial Exports & Domestic Disappearance, Milk Equivalent, Total Milk Solids Basis ....................................................40 Table 47: Dairy Imports, Quota & Non-Quota...............................................................41 U.S. ECONOMIC INDICATORS & OTHER STATISTICS Table 48: Price Indices: Annual Average, Not Seasonally Adjusted 42 Table 49: Minutes of Work Required to Purchase Selected Dairy Products..................42 Table 50: Commodity Receipts from Marketings 43 Table 51: Nation’s Top Dairy Cooperatives...................................................................43 Table 52: Number and Net Volume of Products, Supplies, & Services by Cooperatives 44 Table 53: International Milk Production Statistics.........................................................45 GLOSSARY ....................................................................................................................46 COMMON CONVERSION FACTORS 47
Table 1: U.S. Production of Milk, Milkfat, & Solids-Not-Fat
1 Per Capita Year Milk Production Milkfat Fat Test Solids-Not-Fat Production million lbs % Change million lbs ( % ) million lbs ( % ) (pounds) 1930 100,158 1.2% 3,929 3.92% 8,994 8.98% 814 1940 109,412 2.5% 4,343 3.97% 9,705 8.87% 829 1950 116,602 0.4% 4,618 3.96% 10,203 8.75% 768 1960 123,109 0.9% 4,628 3.76% 10,600 8.61% 684 1970 117,007 0.8% 4,284 3.66% 10,063 8.60% 574 1980 128,406 4.1% 4,692 3.65% 11,030 8.59% 565 1985 143,012 5.7% 5,244 3.67% 12,299 8.60% 600 1990 147,721 2.7% 5,390 3.65% 12,704 8.60% 591 1995 155,292 1.1% 5,681 3.66% 13,505 8.70% 583 2000 167,393 3.0% 6,164 3.68% 14,596 8.72% 593 2001 165,332 -1.2% 6,073 3.67% 14,427 8.73% 580 2002 170,063 2.9% 6,264 3.68% 14,853 8.73% 591 2003 170,348 0.2% 6,247 3.67% 14,868 8.73% 587 2004 170,832 0.3% 6,266 3.67% 14,942 8.75% 583 2005 176,931 3.6% 6,480 3.66% 15,481 8.75% 599 2006 181,782 2.7% 6,700 3.69% 15,944 8.77% 609 2007 185,654 2.1% 6,832 3.68% 16,292 8.78% 616 2008 189,978 2.3% 6,998 3.68% 16,676 8.78% 625 2009 189,202 -0.4% 6,944 3.67% 16,615 8.78% 617 2010 192,877 1.9% 7,054 3.66% 16,979 8.80% 624 2011 196,255 1.8% 7,284 3.71% 17,317 8.82% 630 2012 200,642 2.2% 7,463 3.72% 17,750 8.85% 639 2013 201,260 0.3% 7,558 3.76% 17,853 8.87% 637 2014 206,048 2.4% 7,698 3.74% 18,273 8.87% 647 2015 208,508 1.2% 7,810 3.75% 18,504 8.87% 650 2016 212,451 1.9% 8,054 3.79% 18,874 8.88% 658 2017 215,527 1.4% 8,272 3.84% 19,190 8.90% 663 2018 217,568 0.9% 8,466 3.89% 19,404 8.92% 666 2019 218,441 0.4% 8,560 3.92% 19,508 8.93% 665 2020 223,309 2.2% 8,818 3.95% 19,975 8.94% 674 2021 226,258 1.3% 9,068 4.01% 20,335 8.99% 682 Sources: USDA/NASS; USDA/ERS; U.S. Census Bureau
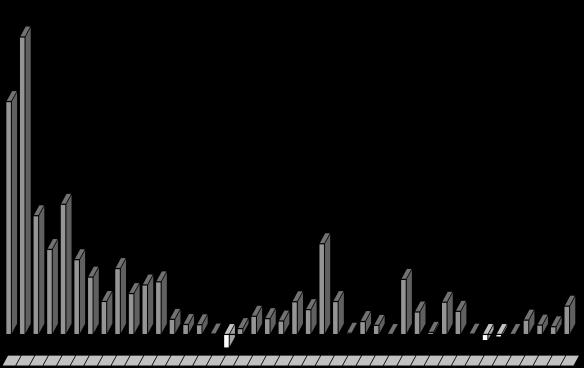
-4.0% -2.0% 0.0% 2.0% 4.0% 6.0% 8.0% 10.0% 12.0% 14.0% 16.0% 18.0% 20.0% 100,000 120,000 140,000 160,000 180,000 200,000 220,000 240,000 2000 2005 2010 2015 2020 Annual % Change in Production Milk Production (million lbs)
Figure 1: GrowthIn
U.S.
Milk Production
Table 2: U.S. Milk Cow Numbers, Dairy Farms, & Herd Size
Sources: USDA / NASS: Cattle; Milk Production; Farms and Land in Farms
in annual sales of agricultural products
2 Avg. Milk Heifers Kept Herd Year Cows for Replacement Total Lic'd All Size* (1,000 head) (Thousand) (Number) 1950 23,853 5,394 23 5,648 3,648 7 1955 23,462 5,786 25 4,654 2,936 8 1960 19,527 5,079 26 3,963 1,792 11 1965 16,981 4,149 24 3,356 1,108 15 1970 12,091 3,881 32 2,949 648 19 1975 11,220 4,087 36 2,521 444 25 1980 10,758 4,159 39 2,440 334 32 1985 10,777 4,770 44 2,293 269 40 1990 10,015 4,171 42 2,146 193 52 1995 9,482 4,121 43 2,196 112.0 140 85 2000 9,183 4,000 44 2,167 83.0 105 111 2005 9,004 4,117 46 2,099 64.5 78.3 140 2010 9,087 4,551 50 2,150 53.1 62.5 171 2015 9,312 4,710 51 2,064 43.5 n/a 214 2016 9,312 4,814 52 2,055 41.8 n/a 223 2017 9,369 4,754 51 2,042 40.2 n/a 233 2018 9,432 4,768 51 2,029 37.5 n/a 252 2019 9,353 4,702 50 2,023 34.2 n/a 273 2020 9,343 4,684 50 2,019 31.7 n/a 295 2021 9,442 4,609 49 2,012 29.9 n/a 316 2022 9,375 4,451 47 (#) (per 100 Cows)
Inventory Farm Numbers Dairy 50 75 100 125 150 175 200 225 250 275 300 325 25 50 75 100 125 1995 2000 2005 2010 2015 2020 Herd Size Dairy Farms ( 1,000 )
January 1
Dairy Herds Average Herd Size
Figure 2: U.S. Dairy Farms & Average Herd Size
*Licensed dairy herds beginning in 1995 Farm: Any establishmentwith at least $1,000
Dairy: Any farm having one or more milk cows on hand during the year. Discontinued by NASS after 2012
Table3:DairyFarmsandMilkProductionbyHerdSize
Number of Cows in Herd
Number of Farms 1 by Size Group %
Source:USDA/NASS; Milk Production.
1/Farmsaredefinedasoperationswithatleastonemilkcowthrough2012,andaslicenseddairyherdsin2017.
2/Includedin100-199;greaterdetailforherdsizesabove100cowsnotavailablepriorto1993.
3/Includedin200-499;greaterdetailforherdsizesabove200cowsnotavailablepriorto1998.
4/DiscontinuedbyNASSbetweenquinquennialcensusyearsafter2012. 2017fromAgriculturalCensusandNMPF.


byHerdSize


3 Year 1 - 29 30 - 49 50 - 99 100 - 199 200 - 499 500 - 999 1000 - 1999 2000+ 1980 203,181 63,160 49,793 18,046 2/ 2/ 2/ 2/ 1985 135,870 57,846 55,155 20,179 2/ 2/ 2/ 2/ 1990 81,430 44,592 47,113 20,745 2/ 2/ 2/ 2/ 1995 48,150 31,030 39,280 14,290 6,920 3/ 3/ 3/ 2000 30,820 22,210 31,190 12,835 5,340 1,700 690 270 2005 22,490 14,835 23,185 10,055 4,662 1,700 850 523 2010 20,000 10,800 15,800 8,600 3,950 1,670 920 760 2012 18,800 9,700 14,500 7,900 3,800 1,570 950 780 20174 9,330 4,700 12,130 6,750 3,830 1,510 960 990 1980 13.5 22.9 30.4 33.2 2/ 2/ 2/ 2/ 1985 10.1 20.5 33.1 36.3 2/ 2/ 2/ 2/ 1990 6.9 17.3 31.5 44.3 2/ 2/ 2/ 2/ 1995 3.1 11.3 26.1 19.8 39.7 3/ 3/ 3/ 2000 1.8 7.7 19.4 17.2 18.0 13.8 11.6 10.5 2005 1.3 5.1 15.2 13.5 15.3 14.3 13.4 21.9 2010 1.1 3.5 10.6 11.3 12.6 12.7 15.5 32.7 2012 1.0 3.2 9.5 10.7 12.6 12.4 15.9 34.7 20174 0.8 2.8 7.3 8.9 12.6 12.2 14.5 41.0
of U.S. Milk Production by Size Group
1
Figure3A:PercentofU.S.DairyFarms
U.S.
1-29 61% 30-49 19% 50-99 15% 100+ 4% 1980 1-29 23% 30-49 12% 50-99 30% 100-199 17% 200-499 5% 500-999 4% 1000-1999 2.4% 2000+ 2.5% 2017 1-29 14% 30-49 23% 50-99 30% 100+ 33% 1980 1-29 0.8% 30-49 2.8% 50-99 7.3% 100-199 8.9% 200-499 12.6% 500-999 12.2% 1000-1999 14.5% 2000+ 41.0% 2017
Figure3B:Percent
of
MilkProductionbyHerdSize
4 Year Pounds % Change Pounds % Change Pounds % Change 1925 4,218 1.2% 165 1.2% 385 1.2% 1930 4,508 -1.6% 177 -1.7% 404 1.0% 1940 4,622 0.7% 183 1.1% 411 2.0% 1950 5,314 0.8% 210 0.5% 467 2.2% 1960 7,029 3.1% 263 2.7% 607 3.9% 1970 9,751 3.4% 357 3.0% 838 3.3% 1980 11,891 3.5% 434 3.4% 1,021 3.4% 1985 13,024 3.9% 478 3.9% 1,120 3.9% 1990 14,782 3.2% 539 2.1% 1,271 3.2% 1995 16,405 1.4% 600 1.4% 1,427 2.5% 2000 18,197 2.4% 670 2.8% 1,587 2.4% 2001 18,162 -0.2% 667 -0.4% 1,585 -0.1% 2002 18,608 2.5% 685 2.7% 1,625 2.5% 2003 18,759 0.8% 688 0.4% 1,637 0.7% 2004 18,960 1.1% 696 1.2% 1,658 1.3% 2005 19,550 3.1% 716 2.9% 1,711 3.1% 2006 19,895 1.8% 734 2.5% 1,745 2.0% 2007 20,204 1.6% 744 1.4% 1,773 1.6% 2008 20,397 1.0% 751 0.9% 1,790 1.0% 2009 20,561 0.8% 755 0.5% 1,806 0.8% 2010 21,142 2.8% 774 2.5% 1,861 3.1% 2011 21,334 0.9% 791 2.2% 1,882 1.1% 2012 21,722 1.8% 808 2.1% 1,922 2.1% 2013 21,819 0.4% 820 1.5% 1,935 0.7% 2014 22,249 2.0% 832 1.5% 1,973 1.9% 2015 22,372 0.6% 839 0.8% 1,985 0.6% 2016 22,761 1.7% 863 2.9% 2,022 1.8% 2017 22,914 0.7% 880 2.0% 2,040 0.9% 2018 23,150 1.0% 901 2.4% 2,065 1.2% 2019 23,395 1.1% 917 1.8% 2,089 1.2% 2020 23,777 1.6% 939 2.4% 2,127 1.8% 2021 23,948 0.7% 960 2.2% 2,152 1.2%
Sources:
USDA/NASS
; USDA/ERS
Milk Production Per Cow Milkfat Production Per Cow Solids-Not-Fat Production Per Cow -4.0% -2.0% 0.0% 2.0% 4.0% 6.0% 8.0% 10.0% 12.0% 14.0% 16.0% 18.0% 20.0% 10,000 12,000 14,000 16,000 18,000 20,000 22,000 24,000 26,000 2000 2005 2010 2015 2020 Annual % Change in Production Milk Production (million lbs)
Table 4: U.S. Production Per Cow of Milk, Milkfat, & Solids-Not-Fat
Figure 4: GrowthIn U.S. Milk Production Per Cow
5 Milkfat Rank of Annual Milk Per Cow Per Cow 2021 Milk State 1990 2000 2010 2020 2021 2021 Per Cow Alabama 12,214 13,920 14,182 14,667 13,000 507 47 Alaska1 14,000 14,500 11,833 Arizona 17,500 21,820 23,452 24,445 24,333 917 13 Arkansas 11,841 12,436 12,750 12,800 12,000 470 48 California 18,456 21,130 23,025 23,990 24,354 960 12 Colorado 17,182 21,618 23,664 26,142 25,966 1,002 2 Connecticut 15,606 17,778 19,158 23,053 22,842 925 21 Delaware 13,667 14,747 16,981 18,553 17,333 700 42 Florida 14,033 15,688 18,711 20,230 20,093 733 36 Georgia 12,973 16,284 17,658 21,877 21,927 807 26 Hawaii1 13,604 14,358 13,316 Idaho 16,475 20,816 22,647 25,174 25,172 1,035 4 Illinois 14,707 17,450 18,400 21,530 21,634 863 27 Indiana 14,590 16,568 20,094 23,683 23,604 935 16 Iowa 15,118 18,298 20,676 24,651 24,504 1,017 11 Kansas 12,576 16,923 20,983 23,682 23,826 972 15 Kentucky 10,947 12,841 14,769 19,563 19,717 759 37 Louisiana 11,605 12,034 11,750 13,400 14,000 542 46 Maine 14,619 17,128 18,344 21,963 21,185 847 30 Maryland 13,461 16,083 18,537 20,976 20,833 831 32 Massachusetts 14,871 17,091 17,286 20,000 19,700 800 38 Michigan 15,394 19,017 23,277 27,174 27,102 1,057 1 Minnesota 14,127 17,777 19,366 22,694 22,881 961 20 Mississippi 12,081 15,028 13,118 16,375 15,143 595 43 Missouri 13,632 14,662 14,596 14,276 14,225 575 45 Montana 13,542 17,789 20,643 21,167 22,091 848 24 Nebraska 13,866 16,513 19,797 24,746 24,534 989 10 Nevada 16,400 19,000 23,714 23,879 24,545 974 8 NewHampshire 15,100 17,333 19,600 21,455 20,545 826 33 NewJersey 13,538 15,250 17,500 20,200 22,500 864 22 NewMexico 18,815 20,944 24,551 24,755 24,541 942 9 NewYork 14,658 17,378 20,807 24,435 24,785 989 7 North Carolina 15,220 16,746 19,682 21,829 22,925 878 19 North Dakota 12,624 14,292 18,286 21,867 22,333 945 23 Ohio 13,767 17,027 19,446 22,118 21,957 863 25 Oklahoma 12,327 14,440 17,125 17,452 17,744 713 40 Oregon 16,273 18,222 20,331 20,929 20,976 860 31 Other States1 5,333 6,111 241 49 Pennsylvania 14,726 18,081 19,847 21,326 21,338 847 29 Rhode Island 14,250 15,667 17,727 21,800 20,200 840 34 South Carolina 12,771 16,087 17,875 18,600 17,667 740 41 South Dakota 12,257 15,516 20,478 23,111 23,096 1,025 18 Tennessee 11,825 14,789 16,346 18,067 18,143 699 39 Texas 14,350 16,503 21,375 24,966 25,079 1,061 5 Utah 15,838 17,573 21,898 23,229 23,156 915 17 Vermont 14,528 17,199 18,537 21,336 21,383 862 28 Virginia 14,213 15,833 18,095 20,293 20,151 780 35 Washington 18,532 22,644 23,514 24,346 24,000 984 14 West Virginia 11,250 15,588 15,700 14,833 15,000 590 44 Wisconsin 13,973 17,306 20,630 24,423 24,884 998 6 Wyoming 12,337 13,571 20,067 25,173 25,918 1,003 3 United States 14,782 18,197 21,142 23,777 23,948 960 Source: USDA/NASS: Milk Production, Disposition, and Income . 1/ Alaska and Hawaii combined into "Other States" beginning in 2019.
(Pounds)
Table 5: Annual Milk & Milkfat Production Per Cow, byState
Table 6: Cow Numbers, Licensed DairyHerds & Herd Size, byState
6 Rank of Cows (1000 Head) Dairy Herds Average Herd Size 2021 Average State 2011 2021 2011 2021 2011 2021 Herd Size Alabama 10 3 55 15 182 200 29 Alaska1 0.5 4 1 125 Arizona 188 198 110 80 1,709 2,475 2 Arkansas 12 5 120 35 100 143 37 California 1,769 1,719 1,675 1,195 1,056 1,438 9 Colorado 128 203 130 110 985 1,845 3 Connecticut 19 19 140 85 136 224 25 Delaware 5 3 50 15 100 200 29 Florida 119 108 140 75 850 1,440 8 Georgia 79 82 260 110 304 745 13 Hawaii1 2 2 1 950 Idaho 578 652 575 430 1,005 1,516 7 Illinois 98 82 810 495 121 166 35 Indiana 172 192 1,650 770 104 249 24 Iowa 204 226 1,670 880 122 257 23 Kansas 123 172 370 230 332 748 12 Kentucky 76 46 900 420 84 110 45 Louisiana 18 9 140 70 129 129 42 Maine 32 27 310 190 103 142 39 Maryland 52 42 510 320 102 131 41 Massachusetts 13 10 160 110 81 91 48 Michigan 366 441 2,160 1,140 169 387 19 Minnesota 468 461 4,325 2,215 108 208 27 Mississippi 14 7 120 50 117 140 40 Missouri 95 71 1,530 650 62 109 46 Montana 14 11 70 50 200 220 26 Nebraska 57 58 245 120 233 483 16 Nevada 29 33 20 20 1,450 1,650 6 New Hampshire 14 11 120 95 117 116 43 New Jersey 8 4 85 35 94 114 44 New Mexico 329 318 140 120 2,350 2,650 1 New York 610 627 5,250 3,430 116 183 32 North Carolina 45 40 290 140 155 286 20 North Dakota 19 15 145 55 131 273 21 Ohio 268 257 3,170 1,620 85 159 36 Oklahoma 53 39 230 100 230 390 18 Oregon 121 125 270 190 448 658 15 Other States1 2 0.9 6 2 450 17 Pennsylvania 541 474 7,240 5,200 75 91 47 Rhode Island 1 1 15 10 73 50 49 South Carolina 16 9 80 35 200 257 22 South Dakota 91 156 350 165 260 945 10 Tennessee 50 28 450 160 111 175 33 Texas 431 622 590 340 731 1,829 4 Utah 93 96 240 140 388 686 14 Vermont 134 120 1,000 580 134 207 28 Virginia 96 73 690 421 139 173 34 Washington 260 271 470 330 553 821 11 West Virginia 10 5 95 35 105 143 37 Wisconsin 1,265 1,274 12,100 6,770 105 188 31 Wyoming 6 9 20 5 300 1,700 5 United States 9,199 9,448 51,291 29,858 179 316 in 2019.
Licensed
Milk Production
1/
Source: USDA/NASS:
.
Alaska and Hawaii combined into "Other States" beginning
Table 7: Milk Production byState
Sources: USDA/NASS: Milk Production Disposition and Income ; Bureau of Census. 1/ Alaska and Hawaii combined into "Other States" beginning in 2019.
7 2021 Production Share Per State 2000 2010 2020 2021 of U.S. Rank Capita (Percent) (Pounds) Alabama 348 156 44 39 0.02% 47 8 Alaska1 13 7 Arizona 3,033 4,151 4,889 4,818 2.1% 14 662 Arkansas 485 153 64 60 0.03% 45 20 California 32,245 40,385 41,311 41,864 18.5% 1 1,067 Colorado 1,924 2,816 5,150 5,271 2.3% 13 907 Connecticut 480 364 438 434 0.2% 34 120 Delaware 146 90 71 52 0.02% 46 52 Florida 2,463 2,133 2,286 2,170 1.0% 21 100 Georgia 1,433 1,395 1,772 1,798 0.8% 22 166 Hawaii1 116 25 Idaho 7,223 12,773 16,237 16,412 7.3% 3 8,634 Illinois 2,094 1,840 1,787 1,774 0.8% 23 140 Indiana 2,419 3,416 4,334 4,532 2.0% 15 666 Iowa 3,934 4,342 5,374 5,538 2.4% 12 1,734 Kansas 1,540 2,497 4,026 4,098 1.8% 16 1,396 Kentucky 1,695 1,152 939 907 0.4% 28 201 Louisiana 698 235 134 126 0.1% 41 27 Maine 668 587 593 572 0.3% 32 417 Maryland 1,351 1,001 881 875 0.4% 29 142 Massachusetts 376 242 200 197 0.1% 39 28 Michigan 5,705 8,333 11,685 11,952 5.3% 6 1,189 Minnesota 9,493 9,102 10,167 10,548 4.7% 7 1,848 Mississippi 541 223 131 106 0.0% 42 36 Missouri 2,258 1,445 1,085 1,010 0.4% 26 164 Montana 338 289 254 243 0.1% 36 220 Nebraska 1,255 1,168 1,460 1,423 0.6% 25 725 Nevada 476 664 788 810 0.4% 30 258 NewHampshire 312 294 236 226 0.1% 37 163 NewJersey 244 140 101 90 0.0% 43 10 NewMexico 5,236 7,881 8,169 7,804 3.4% 9 3,688 NewYork 11,921 12,713 15,296 15,540 6.9% 5 783 North Carolina 1,189 866 895 917 0.4% 27 87 North Dakota 686 384 328 335 0.1% 35 432 Ohio 4,461 5,270 5,618 5,643 2.5% 11 479 Oklahoma 1,314 959 733 692 0.3% 31 174 Oregon 1,640 2,399 2,637 2,622 1.2% 18 617 Other States1 129 32 5 6 0.002% 49 3 Pennsylvania 11,156 10,737 10,279 10,114 4.5% 8 780 Rhode Island 28 20 11 10 0.004% 48 9 South Carolina 370 286 186 159 0.1% 40 31 South Dakota 1,474 1,884 3,120 3,603 1.6% 17 4,024 Tennessee 1,405 850 542 508 0.2% 33 73 Texas 5,743 8,828 14,855 15,599 6.9% 4 528 Utah 1,687 1,927 2,230 2,223 1.0% 20 666 Vermont 2,683 2,521 2,603 2,566 1.1% 19 3,975 Virginia 1,900 1,719 1,522 1,471 0.7% 24 170 Washington 5,593 5,902 6,817 6,504 2.9% 10 840 West Virginia 265 157 89 75 0.0% 44 42 Wisconsin 23,259 26,035 30,749 31,702 14.0% 2 5,377 Wyoming 76 120 189 220 0.1% 38 381 United States 167,393 192,877 223,309 226,258 100.0% 683
(Million Pounds)
U.S.MilkProduction, 1980
U.S.MilkProduction,2021


8
Northeast 20% Southeast 10% California 11% West 7% Southwest 4% Wisconsin 18% Midwest 30% AK &HI 0.13%
Figure 5: Regional Milk Production
Northeast 14% Southeast 3% California 19% West 15% Southwest 12% Wisconsin 14% Midwest 23% AK &HI 0.002%
9 Dairy Farm Receipts Share of Rank of State Total Dairy Total Dairy First in income Receipts (Percent) (Thousand $) California $51,285,566 $7,571,954 14.8% 1 Dairy products $7,571,954 Wisconsin $12,853,127 $5,912,788 46.0% 1 Dairy products $5,912,788 Idaho $8,576,652 $3,062,312 35.7% 1 Dairy products $3,062,312 NewYork $5,903,803 $2,925,153 49.5% 1 Dairy products $2,925,153 Texas $24,697,453 $2,833,922 11.5% 2 Cattle and calves $10,053,767 Michigan $9,516,471 $2,097,216 22.0% 1 Dairy products $2,097,216 Minnesota $21,581,700 $1,985,310 9.2% 4 Corn $6,797,805 Pennsylvania $7,481,988 $1,916,494 25.6% 1 Dairy products $1,916,494 NewMexico $3,172,839 $1,260,805 39.7% 1 Dairy products $1,260,805 Washington $10,133,663 $1,206,024 11.9% 3 Apples $2,185,373 Ohio $11,006,585 $1,066,470 9.7% 3 Soybeans $3,065,909 Iowa $34,735,582 $1,037,572 3.0% 5 Corn $11,758,675 Colorado $8,301,818 $981,563 11.8% 2 Cattle and calves $4,219,877 Arizona $3,991,545 $845,856 21.2% 1 Dairy products $845,856 Indiana $14,228,137 $832,870 5.9% 4 Corn $5,049,639 South Dakota $11,886,633 $725,988 6.1% 5 Corn $3,497,145 Kansas $21,434,686 $694,280 3.2% 7 Cattle and calves $9,854,965 Oregon $5,539,537 $546,210 9.9% 3 Miscellaneous crops $1,867,462 Vermont $788,552 $494,506 62.7% 1 Dairy products $494,506 Florida $7,748,689 $469,805 6.1% 6 Miscellaneous crops $1,345,376 Utah $1,989,248 $408,480 20.5% 2 Cattle and calves $499,641 Georgia $9,554,739 $366,950 3.8% 8 Broilers $4,215,196 Illinois $21,523,225 $320,866 1.5% 6 Corn $10,443,269 Virginia $3,809,076 $297,840 7.8% 5 Broilers $956,536 Nebraska $26,542,962 $261,960 1.0% 5 Cattle and calves $11,354,400 Missouri $12,212,077 $186,308 1.5% 11 Soybeans $3,096,942 North Carolina $13,386,054 $175,823 1.3% 13 Broilers $4,289,303 Kentucky $6,853,469 $173,893 2.5% 9 Corn $1,219,174 Maryland $2,490,922 $156,927 6.3% 5 Broilers $912,540 Nevada $775,030 $147,936 19.1% 3 Cattle and calves $366,501 Oklahoma $7,676,476 $137,886 1.8% 10 Cattle and calves $3,409,676 Maine $786,997 $111,896 14.2% 3 Potatoes $166,672 Tennessee $4,314,972 $97,079 2.2% 10 Soybeans $781,936 Connecticut $589,513 $82,560 14.0% 3 Miscellaneous crops $249,745 North Dakota $8,884,580 $63,690 0.7% 14 Soybeans $2,123,116 Montana $4,173,474 $43,078 1.0% 12 Cattle and calves $1,566,396 NewHampshire $189,081 $42,560 22.5% 2 Miscellaneous crops $52,151 Wyoming $1,742,805 $41,153 2.4% 7 Cattle and calves $1,006,907 Massachusetts $494,963 $37,636 7.6% 5 Miscellaneous crops $232,771 South Carolina $2,721,765 $31,356 1.2% 15 Broilers $1,008,353 Louisiana $3,646,424 $23,001 0.6% 12 Sugarcane $677,378 Mississippi $6,124,476 $20,488 0.3% 16 Broilers $2,369,581 NewJersey $1,369,810 $15,996 1.2% 12 Miscellaneous crops $541,198 West Virginia $693,970 $13,213 1.9% 10 Cattle and calves $176,169 Arkansas $10,357,221 $10,846 0.1% 18 Broilers $3,970,954 Delaware $1,322,167 $9,129 0.7% 7 Broilers $911,050 Alabama $6,005,412 $7,334 0.1% 17 Broilers $3,490,452 Rhode Island $64,873 $1,900 2.9% 6 Miscellaneous crops $33,293 Hawaii $593,191 $1,173 0.2% 12 Miscellaneous crops $260,231 Alaska $43,838 $326 0.7% 8 Miscellaneous crops $16,312 United States $435,797,834 $41,756,381 9.6% 4 Cattle and calves $72,873,644 Source:
USDA/ERS: Farm Business Economics Report
(Thousand Dollars)
Table 8: Importance of the DairySector byState, 2021
Table 9: Farm Level Milk Prices ByState
10 % Change 2021 Cash State 1980 1990 2000 2010 2020 2021 From 2020 Receipts (Percent) $1,000 Alabama $14.40 $15.90 $14.20 $19.50 $18.30 $19.30 5% $7,334 Alaska1 $17.50 $20.30 $20.30 $24.40 Arizona $13.40 $14.10 $11.90 $15.90 $16.20 $17.60 9% $845,856 Arkansas $13.50 $15.00 $13.60 $17.10 $17.80 $18.70 5% $10,846 California $12.88 $12.02 $11.50 $14.69 $17.60 $18.10 3% $7,571,954 Colorado $14.00 $14.50 $11.80 $16.40 $17.40 $18.70 7% $981,563 Connecticut $13.60 $14.70 $14.10 $18.00 $18.00 $19.20 7% $82,560 Delaware $13.60 $14.90 $13.50 $18.40 $17.10 $17.90 5% $9,129 Florida $15.80 $16.70 $15.60 $20.70 $21.30 $21.70 2% $469,805 Georgia $14.00 $15.80 $12.90 $18.40 $19.80 $20.50 4% $366,950 Hawaii1 $18.12 $20.70 $24.50 $35.00 Idaho $12.20 $12.20 $10.60 $14.90 $18.40 $18.70 2% $3,062,312 Illinois $12.90 $12.90 $12.30 $17.10 $18.00 $18.20 1% $320,866 Indiana $13.00 $14.10 $12.90 $17.30 $17.40 $18.50 6% $832,870 Iowa $12.60 $13.30 $11.70 $16.50 $19.50 $18.80 -4% $1,037,572 Kansas $13.10 $13.30 $11.60 $17.30 $17.10 $17.00 -1% $694,280 Kentucky $12.80 $14.30 $13.80 $17.90 $18.70 $19.30 3% $173,893 Louisiana $14.10 $15.40 $13.90 $18.00 $18.70 $18.70 0% $23,001 Maine $13.90 $15.20 $14.10 $18.60 $19.40 $19.70 2% $111,896 Maryland $13.60 $14.90 $13.50 $18.40 $17.40 $18.10 4% $156,927 Massachusetts $13.70 $14.80 $14.10 $18.00 $18.30 $19.40 6% $37,636 Michigan $13.20 $14.10 $12.90 $17.00 $16.40 $17.60 7% $2,097,216 Minnesota $12.40 $13.22 $12.00 $16.10 $20.10 $19.00 -5% $1,985,310 Mississippi $13.80 $15.10 $13.90 $18.40 $19.00 $19.70 4% $20,488 Missouri $12.60 $13.60 $12.10 $16.60 $17.90 $18.80 5% $186,308 Montana $12.80 $13.70 $12.80 $16.90 $18.60 $18.10 -3% $43,078 Nebraska $12.70 $13.10 $11.70 $17.30 $18.20 $18.50 2% $261,960 Nevada $12.70 $13.20 $11.00 $16.90 $18.50 $18.40 -1% $147,936 NewHampshire $13.60 $14.80 $14.00 $17.80 $18.00 $19.00 6% $42,560 NewJersey $13.38 $15.30 $13.20 $16.80 $17.20 $18.60 8% $15,996 NewMexico $14.10 $13.40 $12.40 $15.80 $16.30 $16.30 0% $1,260,805 NewYork $13.00 $14.60 $13.10 $17.40 $17.70 $18.90 7% $2,925,153 North Carolina $14.00 $15.80 $14.90 $19.30 $18.80 $19.30 3% $175,823 North Dakota $11.80 $12.50 $11.30 $15.90 $19.90 $19.30 -3% $63,690 Ohio $13.00 $13.90 $12.60 $17.80 $18.30 $19.00 4% $1,066,470 Oklahoma $13.60 $14.30 $13.60 $18.00 $19.00 $20.10 6% $137,886 Oregon $13.10 $13.20 $12.80 $17.30 $21.20 $21.00 -1% $546,210 Other States1 $26.50 $30.00 13% $1,499 Pennsylvania $13.60 $15.00 $13.70 $18.30 $18.20 $19.10 5% $1,916,494 Rhode Island $13.70 $14.80 $14.20 $18.00 $17.50 $19.00 9% $1,900 South Carolina $14.50 $16.10 $14.10 $19.90 $19.30 $20.10 4% $31,356 South Dakota $12.40 $13.00 $12.80 $16.50 $20.60 $20.20 -2% $725,988 Tennessee $13.30 $14.70 $13.80 $17.90 $18.80 $19.30 3% $97,079 Texas $13.90 $14.70 $13.40 $17.10 $18.60 $18.20 -2% $2,833,922 Utah $12.50 $12.90 $11.20 $16.20 $18.20 $18.50 2% $408,480 Vermont $13.40 $14.40 $13.80 $17.70 $18.30 $19.40 6% $494,506 Virginia $13.30 $15.00 $14.80 $19.40 $19.70 $20.40 4% $297,840 Washington $12.70 $13.30 $12.80 $16.10 $17.50 $18.60 6% $1,206,024 West Virginia $13.00 $14.30 $13.30 $16.90 $17.50 $18.10 3% $13,213 Wisconsin $12.67 $13.47 $11.70 $16.10 $18.90 $18.80 -1% $5,912,788 Wyoming $12.70 $12.80 $11.00 $16.50 $16.90 $18.80 11% $41,153 United States $13.05 $13.74 $12.40 $16.35 $18.16 $18.54 2% $41,756,381
2019.
Source: USDA/NASS: Milk Production, Disposition, and Income . 1/ Alaska and Hawaii combined into "Other States" beginning in
Per Hundredweight)
(Dollars
Table 10: Selected Farm Level Annual Average Milk Prices
(Dollars Per Hundredweight)
Source: USDA/AMS; USDA/NASS: Milk Production, Disposition, and Income
Note: Class III and Class IV price at 3.5% milkfat; all others at test.
NASS discontinued reporting manufacturiing grade and fluid grade milk prices in 2011.
11 Class III Class IV Manufacturing All-Milk % Change In Year Price @ 3.5% Price @ 3.5% Grade Milk Wholesale All-Milk Price 1965 $3.27 n/a $3.34 $4.23 1.9% 1970 $4.66 n/a $4.70 $5.71 4.0% 1975 $7.62 n/a $7.63 $8.75 4.9% 1980 $11.88 n/a $12.01 $13.05 8.4% 1985 $11.50 n/a $11.72 $12.76 -2.2% 1990 $12.21 n/a $12.34 $13.74 1.3% 1995 $11.83 n/a $11.79 $12.78 -1.8% 2000 $9.74 $11.83 $10.52 $12.30 -14.6% 2005 $14.05 $12.88 $14.42 $15.10 -6.2% 2006 $11.89 $11.06 $12.19 $12.90 -14.6% 2007 $18.04 $18.36 $18.31 $19.10 48.1% 2008 $17.44 $14.65 $17.91 $18.30 -4.2% 2009 $11.36 $10.89 $12.03 $12.80 -30.1% 2010 $14.41 $15.09 $14.56 $16.30 27.3% 2011 $18.37 $19.04 n/a $20.10 23.3% 2012 $17.44 $16.01 n/a $18.50 -8.0% 2013 $17.99 $19.05 n/a $20.10 8.6% 2014 $22.34 $22.09 n/a $24.00 19.4% 2015 $15.80 $14.34 n/a $17.10 -28.8% 2016 $14.87 $13.77 n/a $16.30 -4.7% 2017 $16.17 $15.16 n/a $17.70 8.6% 2018 $14.62 $14.24 n/a $16.30 -7.9% 2019 $16.97 $16.30 n/a $18.70 14.7% 2020 $18.17 $13.48 n/a $18.10 -3.2% 2021 $17.18 $15.65 n/a $18.50 2.2%
$9.00 $10.00 $11.00 $12.00 $13.00 $14.00 $15.00 $16.00 $17.00 $18.00 $19.00 $20.00 $21.00 $22.00 $23.00 $24.00 $25.00 1995 2000 2005 2010 2015 2020 Dollars Per Hundredweight
All-Milk Price Class IIIPrice
Figure6:All-Milk PriceandClassIII Price
Table 11: Monthly Seasonalityof U.S. All-Milk Price
12 Month 2014 2015 2016 2017 2018 2019 2020 2021 Jan $23.50 $17.50 $16.10 $18.90 $16.20 $16.60 $19.50 $17.10 Feb $24.80 $16.90 $15.70 $18.40 $15.30 $16.80 $18.80 $16.70 Mar $25.10 $16.60 $15.30 $17.30 $15.60 $17.60 $17.80 $17.30 Apr $25.30 $16.60 $15.10 $16.50 $15.80 $17.70 $14.30 $18.30 May $24.20 $16.80 $14.50 $16.70 $16.20 $18.00 $13.60 $19.10 Jun $23.20 $16.90 $14.80 $17.30 $16.30 $18.10 $18.10 $18.20 Jul $23.30 $16.60 $16.10 $17.20 $15.50 $18.70 $20.50 $17.80 Aug $24.20 $16.80 $17.20 $18.10 $16.10 $18.90 $18.50 $17.60 Sep $25.70 $17.60 $17.40 $17.90 $16.90 $19.30 $17.60 $18.30 Oct $24.90 $17.70 $16.70 $18.10 $17.50 $20.20 $19.80 $19.60 Nov $23.00 $18.30 $17.80 $18.20 $17.20 $21.20 $21.00 $20.70 Dec $20.40 $17.30 $18.90 $17.20 $16.60 $20.70 $18.10 $21.70 Jan 17,276 17,682 17,671 18,140 18,431 18,612 18,875 19,365 Feb 15,897 16,169 16,900 16,698 16,976 16,966 17,900 17,685 Mar 17,832 18,077 18,404 18,758 18,988 18,847 19,395 19,797 Apr 17,484 17,795 17,956 18,357 18,425 18,435 18,665 19,350 May 18,104 18,434 18,614 18,958 19,122 19,062 18,980 19,855 Jun 17,329 17,510 17,774 18,073 18,280 18,228 18,400 18,942 Jul 17,434 17,659 17,903 18,270 18,331 18,379 18,740 19,097 Aug 17,223 17,391 17,693 18,037 18,247 18,275 18,630 18,721 Sep 16,511 16,595 16,985 17,131 17,396 17,600 18,030 18,018 Oct 17,066 17,106 17,554 17,765 17,872 18,138 18,609 18,623 Nov 16,555 16,667 17,139 17,265 17,330 17,499 18,115 18,015 Dec 17,337 17,423 17,858 18,075 18,170 18,400 18,970 18,790 Source: USDA/NASS: Prices Received and Milk Production
Milk Production U.S. All-Milk Price, Dollars Per Cwt @ Average Test U.S. Milk Production, Million Pounds $13.00 $14.00 $15.00 $16.00 $17.00 $18.00 $19.00 $20.00 $21.00 $22.00 $23.00 600 610 620 630 640 650 Jan Feb Mar Apr May Jun Jul Aug Sep Oct Nov Dec Dollars Per Cwt. Million Pounds Per Day
Average Daily Milk Production U.S. All-Milk Price
and
Figure 7: Seasonality of MilkSupply & Price, 2021
Table 12: Annual Wholesale Prices of Dairy Products
USDA / AMS: Dairy Market Statistics 1/ Grade A butter price is reported before 1998. Grade A butter trading ended July 1, 1998.
CME Grade A beginning 2004. 3/ Central (low/medium) June 1998 - 2001; Central/East (low/medium) 2002 - 2017; 2/ Cheese prices: National Cheese Exchange through April 1997, then CME.
Source: USDA / AMS: Dairy Market Statistics
Average, Cents per Pound)
13 CME NCE/CME 2/ Grade AA Cheddar Cheese West Central 3/ Year Butter 1/ Barrels 40# Blocks (Low/Med) (Low/Med) 1975 79.4 82.6 86.6 n/a 62.9 1980 139.3 127.0 133.0 n/a 88.6 1985 141.1 117.8 121.8 n/a 84.1 1990 102.1 127.9 131.5 n/a 100.6 1995 75.6 126.3 130.4 105.5 108.6 2000 117.7 111.1 114.7 100.6 101.5 2005 154.8 144.8 149.3 94.9 98.5 2006 123.6 121.9 123.9 89.2 100.1 2007 136.8 174.1 175.8 176.2 180.4 2008 146.3 183.6 185.6 124.6 130.0 2009 124.3 125.2 129.6 94.8 99.3 2010 172.8 147.5 149.6 119.1 125.0 2011 196.2 178.7 180.6 150.9 155.3 2012 160.3 166.0 169.8 134.2 137.9 2013 155.6 171.7 176.4 172.4 174.1 2014 216.4 207.5 210.9 171.9 174.1 2015 208.9 157.6 161.0 90.3 94.3 2016 208.2 155.6 158.0 84.2 85.4 2017 232.8 153.4 161.1 87.1 87.6 2018 225.0 142.0 154.6 80.5 80.9 2019 223.0 168.9 177.8 105.6 106.1 2020 157.8 171.9 199.8 105.6 105.4 2021 174.5 156.9 171.4 130.9 132.0
Nonfat Dry Milk (Annual Average, Cents Per Pound)
Diff. From Diff. From Month 2020 2021 Prev. Yr. 2020 2021 Prev. Yr. Jan 188.1 135.0 -28.3% 191.4 174.7 -8.7% Feb 179.1 138.6 -22.6% 183.4 158.2 -13.7% Mar 172.4 171.5 -0.5% 175.5 173.6 -1.1% Apr 120.0 182.7 52.2% 110.2 179.5 62.9% May 147.1 181.2 23.2% 167.0 167.8 0.4% Jun 182.9 177.6 -2.9% 256.2 149.8 -41.5% Jul 169.3 169.1 -0.1% 264.7 163.7 -38.1% Aug 150.4 168.2 11.8% 177.3 172.2 -2.9% Sep 151.6 177.6 17.1% 232.8 176.0 -24.4% Oct 145.5 180.0 23.7% 271.0 178.0 -34.3% Nov 139.4 197.1 41.4% 205.2 174.1 -15.2% Dec 148.1 215.4 45.5% 162.5 189.3 16.5%
Source:
Grade AA Butter 40-lb. Block Cheddar (Monthly
Table 13: MonthlyPrices of DairyProducts on Chicago Mercantile Exchange
Table 14: Annual Retail Prices for Selected Dairy Products
14 Farm Price Whole Cheddar Ice as pct. of Year Milk Cheese Butter 1/ Cream Retail 2/ ($ per gal.) ($ per pound) ($ per 1/2 gal.) (Percent) 1945 $0.36 $0.51 1950 $0.52 $0.73 1955 $0.58 $0.71 1960 $0.69 $0.75 $0.87 1965 $0.75 $0.75 $0.79 1970 $1.01 $0.87 $0.85 1975 $1.54 $1.03 $1.22 1980 $2.23 $1.88 $1.82 52% 1985 $3.09 $2.12 $2.30 44% 1990 n/a $1.99 $2.60 39% 1995 $3.39 $1.61 $2.65 33% 2000 $2.78 $3.83 $2.52 $3.45 30% 2005 $3.19 $4.38 $3.28 $3.74 31% 2010 $3.26 $4.71 $3.13 $4.47 32% 2015 $3.42 $5.38 n/a $4.74 28% 2016 $3.20 $5.23 n/a $4.76 27% 2017 $3.23 $4.89 n/a $4.69 30% 2018 $2.90 $5.14 $4.07 $4.74 28% 2019 $3.04 $5.31 $3.98 $4.81 31% 2020 $3.32 $5.50 $3.62 $4.92 29% 2021 $3.55 $5.44 $3.58 $4.89 29%
2/
2011, NMPF
25% 30% 35% 40% 2000 2005 2010 2015 2020 Percent Figure 8: Farm Value of Milk as Percent of Retail Value
Source: Bureau of Labor Statistics, Department of Labor. 1/ 2018: April - December
Source: USDA / ERS Agricultural Outlook; all dairy. Beginning
estimate.
Table15:MilkProductionCosts&ReturnsByHerdSize,20211/
1/Developedfromsurveybaseyear,2016.
2/Incomefromrentingorleasingdairystocktootheroperations;rentingspacetootherdairyoperations;co-oppatronage dividendsassociatedwiththedairy;assessmentrebates,refunds,andotherdairy-relatedresources;andthefertilizervalue ofmanureproduction.
3/Costsforthirdpartyorganiccertification
4/Machineryandequipment,housing,manurehandling,feedstoragestructures,andthedairybreedingherd.
15 1-99 cows 100-199 cows 200-499 cows 500-999 cows 1,0001,999 cows 2,000or more cows Gross value of production Milk sold $21.02 $19.72 $20.28 $19.81 $18.76 $18.54 Cattle $1.51 $1.27 $1.45 $1.50 $1.52 $1.27 Otherincome2 $0.72 $0.64 $0.58 $0.55 $0.58 $0.60 Total, gross value of production $23.26 $21.63 $22.31 $21.85 $20.86 $20.41 Operating costs Purchasedfeed $7.98 $8.02 $9.37 $10.40 $11.29 $11.88 Homegrownharvestedfeed $7.17 $6.30 $4.41 $2.97 $2.34 $2.13 Grazedfeed $0.31 $0.14 $0.11 $0.04 $0.01 $0.01 Total, feed costs $15.46 $14.47 $13.89 $13.41 $13.65 $14.02 Other Operating Costs VeterinaryandMedicine $0.87 $0.91 $0.93 $0.87 $0.76 $0.72 Beddingandlitter $0.34 $0.32 $0.29 $0.26 $0.19 $0.10 Marketing $0.29 $0.24 $0.16 $0.18 $0.16 $0.19 Custom services $0.81 $0.75 $0.80 $0.62 $0.69 $0.64 Fuel,lube,andelectricity $0.99 $0.89 $0.71 $0.58 $0.52 $0.38 Repairs $1.31 $1.06 $0.95 $0.75 $0.62 $0.48 Otheroperatingcosts3 $0.03 $0.01 $0.00 $0.00 $0.00 $0.00 Interestonoperatingcapital $0.01 $0.01 $0.01 $0.01 $0.00 $0.00 Total, operating costs $20.11 $18.65 $17.73 $16.68 $16.58 $16.54 Allocated overhead: Hiredlabor $0.79 $1.68 $2.66 $2.78 $2.90 $2.30 Opportunitycostofunpaidlabor $11.11 $4.52 $1.72 $0.78 $0.34 $0.12 Capitalrecoveryofmachineryandequipment4 $5.60 $5.19 $5.03 $4.66 $4.40 $4.13 Opportunitycostofland $0.10 $0.06 $0.03 $0.01 $0.00 $0.00 Taxesandinsurance $0.30 $0.29 $0.27 $0.17 $0.17 $0.12 Generalfarm overhead $1.17 $0.83 $0.75 $0.63 $0.58 $0.37 Total, allocated overhead $19.09 $12.57 $10.45 $9.04 $8.39 $7.05 Total, costs listed $39.20 $31.22 $28.19 $25.72 $24.97 $23.59 Value of production less total costs listed -$15.94 -$9.58 -$5.88 -$3.86 -$4.11 -$3.18 Value of production less operating costs $3.15 $2.98 $4.58 $5.17 $4.28 $3.87 Source:USDA/ERS. Supporting information: Milkcows(headperfarm) 57 136 303 686 1,339 3,673 Outputpercow(pounds) 17,296 19,441 21,808 23,660 22,747 22,747
Size of Operation (DollarsPerHundredweight)
Figure9:ShareofCashExpensesbySizeofOperation,2021


Source:USDA/ERS. Doesnotshowallocatedoverheadcosts,excepthiredlabor.

16
TotalFeed 73% Veterinary andMedicine 4% Fuel,Lube & Electricity 5% Repairs 6% OtherOperating Costs 8% Hired Labor 4% 1-99cows TotalFeed 70% Veterinary andMedicine 5% Fuel,Lube & Electricity 4% Repairs 5% Other Operating Costs 8% Hired Labor 8% 100-199cows TotalFeed 67% Veterinary andMedicine 5% Fuel,Lube & Electricity 3% Repairs 5% Other Operating Costs 7% Hired Labor 13% 200-499cows TotalFeed 68% Veterinaryand Medicine 5% Fuel,Lube & Electricity 3% Repairs 4% Other Operating Costs 6% Hired Labor 14% 500-999cows TotalFeed 69% Veterinaryand Medicine 4% Fuel,Lube& Electricity 3% Repairs 3% Other Operating Costs 6% HiredLabor 15% 1,000-1,999cows TotalFeed 74% Veterinary andMedicine 4% Fuel,Lube& Electricity 2% Repairs 2% OtherOperating Costs 6% Hired Labor 12% 2,000cowsormorecows
Table16:U.S.MilkProductionCosts&Returns
(DollarsPerHundredweight)
1/Incomefromrentingorleasingdairystocktootheroperations;rentingspacetootherdairyoperations;co-op patronagedividendsassociatedwiththedairy;assessmentrebates,refunds,andotherdairy-relatedresources;and thefertilizervalueofmanureproduction.
2/Costsforthirdpartyorganiccertification
3/Machineryandequipment,housing,manurehandling,feedstoragestructures,andthedairybreedingherd.
17 2016 2017 2018 2019 2020 2021 Gross value of production Milksold $16.83 $18.25 $16.82 $19.26 $18.87 $19.34 Cattle $1.47 $1.37 $1.26 $1.23 $1.27 $1.39 Otherincome1 $0.54 $0.50 $0.50 $0.53 $0.51 $0.60 Total, gross value of production $18.84 $20.11 $18.58 $21.02 $20.65 $21.33 Operating costs Purchasedfeed $6.68 $6.49 $6.76 $7.20 $6.93 $10.50 Homegrownharvestedfeed $2.63 $2.72 $3.12 $3.33 $3.11 $3.47 Grazedfeed $0.07 $0.07 $0.08 $0.07 $0.07 $0.07 Total, feed costs $9.38 $9.29 $9.96 $10.60 $10.10 $14.04 Other Operating Costs VeterinaryandMedicine $0.77 $0.75 $0.76 $0.78 $0.78 $0.80 Beddingandlitter $0.20 $0.19 $0.20 $0.20 $0.20 $0.21 Marketing $0.18 $0.18 $0.18 $0.19 $0.18 $0.19 Customservices $0.67 $0.65 $0.66 $0.67 $0.67 $0.69 Fuel,lube,andelectricity $0.52 $0.59 $0.67 $0.69 $0.58 $0.59 Repairs $0.61 $0.62 $0.64 $0.66 $0.67 $0.74 Otheroperatingcosts2 $0.00 $0.00 $0.00 $0.00 $0.00 $0.00 Interestonoperatingcapital $0.03 $0.06 $0.14 $0.14 $0.03 $0.01 Total, operating costs $12.36 $12.34 $13.21 $13.93 $13.21 $17.28 Allocated overhead: Hiredlabor $1.83 $1.87 $1.99 $2.10 $2.20 $2.31 Opportunitycostofunpaidlabor $1.71 $1.77 $1.82 $1.88 $1.92 $1.99 Capitalrecoveryofmachineryandequipment3 $3.77 $3.86 $4.00 $4.10 $4.13 $4.62 Opportunitycostofland $0.02 $0.02 $0.03 $0.02 $0.02 $0.02 Taxesandinsurance $0.18 $0.18 $0.18 $0.18 $0.18 $0.19 Generalfarm overhead $0.53 $0.54 $0.55 $0.57 $0.58 $0.62 Total, allocated overhead $8.04 $8.24 $8.57 $8.86 $9.02 $9.75 Total, costs listed $20.39 $20.58 $21.78 $22.79 $22.24 $27.02 Value of production less total costs listed -$1.55 -$0.46 -$3.20 -$1.77 -$1.59 -$5.69 Value of production less operating costs $6.49 $7.77 $5.37 $7.09 $7.44 $4.05 Source:USDA/ERS. Supporting information: Milkcows(headperfarm) 245 245 245 245 245 245 Outputpercow(pounds) 21,698 21,698 21,698 21,698 21,698 21,698
18 Year Jan Feb Mar Apr May Jun July Aug Sep Oct Nov Dec Average 2000 3.07 2.94 2.88 2.84 2.72 2.97 3.31 3.37 3.36 3.12 3.05 3.04 3.06 2005 3.49 3.48 3.33 3.18 2.96 2.94 2.98 3.08 3.27 3.39 3.46 3.29 3.24 2006 3.16 2.93 2.70 2.46 2.35 2.38 2.35 2.48 2.61 2.51 2.44 2.43 2.56 2007 2.45 2.33 2.39 2.50 2.56 2.88 3.17 3.19 3.19 3.10 3.05 2.85 2.81 2008 2.65 2.24 2.07 1.95 1.83 1.87 1.90 1.81 1.90 2.02 2.01 1.92 2.01 2009 1.60 1.51 1.55 1.58 1.49 1.47 1.59 1.80 2.00 2.11 2.26 2.42 1.78 2010 2.33 2.34 2.18 2.19 2.18 2.26 2.30 2.36 2.36 2.40 2.23 1.98 2.26 2011 2.00 2.00 2.10 1.80 1.70 1.90 1.90 1.80 1.80 1.80 1.90 1.80 1.87 2012 1.71 1.55 1.48 1.41 1.34 1.37 1.33 1.37 1.59 1.74 1.74 1.65 1.52 2013 1.58 1.52 1.48 1.54 1.54 1.52 1.53 1.69 1.88 2.12 2.27 2.30 1.75 2014 2.46 2.58 2.54 2.42 2.23 2.19 2.36 2.63 2.96 2.92 2.75 2.40 2.54 2015 2.10 2.06 2.01 2.00 1.99 2.06 2.00 2.11 2.25 2.30 2.46 2.29 2.14 2016 2.18 2.18 2.12 1.99 1.90 1.92 2.16 2.44 2.49 2.38 2.59 2.73 2.26 2017 2.71 2.61 2.40 2.22 2.20 2.31 2.27 2.50 2.46 2.48 2.54 2.38 2.42 2018 2.20 2.03 1.98 1.90 1.90 1.97 1.93 2.06 2.13 2.22 2.21 2.07 2.05 2019 2.06 2.07 2.14 2.11 2.12 2.09 2.16 2.26 2.34 2.44 2.66 2.57 2.25 2020 2.41 2.35 2.24 1.85 1.78 2.38 2.72 2.48 2.27 2.49 2.58 2.17 2.31 2021 1.95 1.75 1.76 1.75 1.65 1.56 1.52 1.49 1.66 1.84 1.92 1.96 1.73 Source: USDA/NASS, Agricultural Prices; 1/Poundsoffeedequalinvaluetoonepoundofwholemilk Year Jan Feb Mar Apr May Jun July Aug Sep Oct Nov Dec Average 2000 4.29 4.43 4.53 4.60 4.86 4.52 4.10 3.95 4.19 4.35 4.52 4.78 4.43 2001 4.72 4.60 4.55 4.63 4.66 4.58 4.79 4.79 4.79 4.64 4.63 4.70 4.67 2002 4.66 4.57 4.63 4.65 4.76 4.75 5.03 5.31 5.40 5.14 5.03 5.03 4.91 2003 5.08 5.13 5.11 5.17 5.37 5.30 4.99 4.96 5.20 5.15 5.33 5.37 5.18 2004 5.58 5.86 6.34 6.66 6.77 6.49 6.13 5.38 4.99 4.81 4.63 4.64 5.69 2005 4.80 4.61 4.90 5.00 5.15 5.24 5.29 5.03 4.78 4.61 4.49 4.80 4.89 2006 4.80 4.81 4.87 5.03 5.18 5.13 5.06 4.91 5.12 5.59 6.00 6.08 5.22 2007 6.21 6.80 6.85 6.77 7.15 7.35 7.06 6.95 7.24 7.31 7.62 8.21 7.13 2008 8.57 9.30 9.45 9.94 10.47 11.12 11.11 10.71 10.36 8.95 8.80 8.46 9.77 2009 8.96 8.27 8.17 8.32 8.87 9.05 8.19 8.04 7.77 7.76 7.82 7.81 8.25 2010 7.76 7.49 7.40 7.33 7.49 7.55 7.75 7.97 8.34 8.62 9.00 9.42 8.01 2011 9.67 10.46 10.42 11.50 11.91 11.93 12.05 12.64 12.03 11.16 11.05 11.03 11.32 2012 11.44 11.82 12.24 12.58 12.80 12.75 14.23 15.12 14.10 13.77 13.89 13.72 13.21 2013 13.61 13.78 13.86 13.50 13.90 14.12 14.11 12.81 12.13 10.87 10.58 10.94 12.85 2014 10.81 11.01 11.10 11.65 11.94 11.55 10.62 10.36 10.30 9.28 9.61 9.74 10.66 2015 9.26 9.14 9.07 9.02 8.87 8.74 9.15 8.76 8.55 8.48 8.19 8.10 8.78 2016 8.00 7.79 7.83 8.17 8.73 9.05 8.51 7.84 7.82 7.76 7.62 7.70 8.07 2017 7.84 7.92 7.95 7.95 8.09 7.97 8.22 7.73 7.81 7.90 7.71 7.84 7.91 2018 7.98 8.42 8.83 9.18 9.42 8.93 8.68 8.47 8.44 8.44 8.34 8.55 8.64 2019 8.89 8.89 8.84 8.88 9.00 9.47 9.43 9.05 8.89 9.02 8.79 8.75 8.99 2020 9.15 9.10 9.05 8.56 8.44 8.27 8.21 8.11 8.65 9.23 9.66 9.96 8.86 2021 10.60 11.13 11.14 11.63 12.53 12.37 12.43 12.67 11.71 11.16 11.66 12.27 11.78
Source: USDA/NASSandUSDA/AMS;2/Feedcostformulaasdefinedinthe2014and2018farmbills.
Table17:MonthlyMilk-FeedPriceRatio1
$3.00 $4.50 $6.00 $7.50 $9.00 $10.50 $12.00 $13.50 $15.00 2000 2002 2004 2006 2008 2010 2012 2014 2016 2018 2020
Table18:MonthlyDMC/MPPCalculatedFeedCost($percwt.)2
Figure10:Average Annual DMC/MPPCalculatedFeedCost
Table 19: MonthlyDMC/MPP Margin ($ per cwt.)1
19 Year Jan Feb Mar Apr May Jun July Aug Sep Oct Nov Dec Average 2000 7.71 7.37 7.27 7.30 7.14 7.78 8.50 8.55 8.71 8.15 7.98 8.22 7.89 2001 8.28 8.50 9.35 9.97 10.84 11.62 11.41 11.71 12.31 10.96 9.77 8.80 10.30 2002 8.94 8.53 7.97 7.85 7.34 6.75 6.07 5.99 6.20 6.96 6.87 6.87 7.19 2003 6.72 6.17 5.89 5.83 5.63 5.70 7.11 8.34 9.30 9.85 9.07 8.43 7.34 2004 7.62 7.74 9.16 11.44 12.53 11.71 9.97 9.52 10.51 10.79 11.57 11.76 10.37 2005 11.30 10.79 10.60 10.20 9.55 9.16 9.51 9.77 10.52 10.89 10.61 10.00 10.24 2006 9.60 8.69 7.73 6.97 6.72 6.77 6.64 7.09 7.88 7.91 7.90 8.12 7.66 2007 8.29 8.10 8.75 9.73 10.85 12.85 14.54 14.65 14.56 14.09 14.28 13.29 12.02 2008 11.93 9.80 8.65 8.16 7.93 8.18 8.29 7.69 7.84 8.85 8.30 7.04 8.55 2009 4.34 3.33 3.53 3.58 2.73 2.25 3.11 4.06 5.23 6.54 7.58 8.69 4.59 2010 8.34 8.31 7.40 7.27 7.51 7.85 8.15 8.73 9.36 9.88 8.90 7.28 8.25 2011 7.03 8.64 9.98 8.10 7.69 9.17 9.75 9.46 9.07 8.84 9.45 8.67 8.82 2012 7.46 5.78 4.96 4.22 3.40 3.45 2.67 3.08 5.60 7.83 8.21 7.08 5.31 2013 6.39 5.72 5.24 6.00 5.80 5.38 4.99 6.79 7.97 10.03 11.02 11.06 7.21 2014 12.69 13.79 14.10 13.65 12.26 11.65 12.68 13.74 15.40 15.62 13.39 10.66 13.30 2015 8.34 7.66 7.53 7.48 7.83 8.16 7.45 7.94 8.95 9.22 10.01 9.10 8.31 2016 8.10 7.91 7.47 6.83 5.77 5.75 7.59 9.26 9.48 8.84 9.98 11.10 8.18 2017 11.06 10.58 9.35 8.55 8.61 9.33 9.08 10.27 9.99 10.00 10.39 9.36 9.71 2018 8.12 6.88 6.77 6.62 6.78 7.37 6.72 7.43 8.26 8.96 8.66 7.85 7.54 2019 7.71 7.91 8.66 8.82 9.00 8.63 9.27 9.85 10.41 10.88 12.21 11.95 9.62 2020 10.35 9.80 8.85 5.84 5.26 9.93 12.39 10.49 9.05 10.77 11.44 8.34 9.38 2021 6.90 5.97 6.26 6.77 6.67 6.03 5.47 5.03 6.69 8.54 9.14 9.53 6.92 Source: USDA / NASS and USDA / AMS; 1/ Margin as defined in the 2014 and 2018 farm bills.
$4.00 $6.00 $8.00 $10.00 $12.00 $14.00 2000 2002 2004 2006 2008 2010 2012 2014 2016 2018 2020 Figure11: Average Annual DMC/MPPMargin $5.00 $6.00 $7.00 $8.00 $9.00 $10.00 $11.00 $12.00 $13.00 Jan Feb Mar Apr May Jun July Aug Sep Oct Nov Dec Figure
2021 2020 5-Year Average
12: MonthlyDMC/MPPCalculatedMargin
Table 20: Average Prices Received for Livestock
20
($ Per Head) 1975 $19.80 $36.30 $32.30 $27.20 $412 1980 $45.70 $66.90 $62.40 $76.80 $1,190 1985 $36.50 $57.70 $53.70 $62.10 $860 1990 $51.50 $78.80 $74.60 $95.60 $1,160 1995 $35.70 $65.10 $61.80 $73.10 $1,130 2000 $37.90 $72.30 $68.60 $104.00 $1,340 2001 $40.90 $75.10 $71.30 $106.00 $1,500 2002 $37.30 $70.10 $66.50 $96.40 $1,600 2003 $42.90 $84.20 $79.70 $102.00 $1,340 2004 $50.30 $90.20 $85.80 $119.00 $1,580 2005 $51.70 $94.30 $89.70 $135.00 $1,770 2006 $46.60 $92.30 $87.20 $133.00 $1,730 2007 $47.90 $95.40 $89.90 $119.00 $1,830 2008 $50.60 $94.50 $89.10 $110.00 $1,950 2009 $44.80 $85.40 $80.30 $105.00 $1,390 2010 $54.80 $97.70 $92.20 $117.00 $1,330 2011 $71.20 $117.00 $113.00 $142.00 $1,420 2012 $81.70 $123.00 $121.00 $172.00 $1,430 2013 $82.30 $126.00 $125.00 $181.00 $1,380 2014 $107.00 $153.00 $152.00 $261.00 $1,830 2015 $103.00 $148.00 $147.00 $247.00 $1,990 2016 $74.30 $121.00 $119.00 $158.00 $1,760 2017 $69.10 $122.00 $120.00 $168.00 $1,620 2018 $63.50 $117.00 $115.00 $170.00 $1,360 2019 $62.00 $118.00 $116.00 $159.00 $1,200 2020 $64.20 $111.00 $109.00 $161.00 $1,300 2021 $70.20 $124.00 $121.00 $171.00 $1,360
Marketing Year
Source: USDA / NASS, Agricultural Prices. 1/ At least 500 pounds
(Dollars
Beef & Dairy Cows Steers & Heifers 1/ All Calves All Cattle 1/ Replacement Milk Cows $0 $200 $400 $600 $800 $1,000 $1,200 $1,400 $1,600 $1,800 $2,000 2000 2005 2010 2015 2020 Dollars Per Head Figure 13: U.S.
Replacement
Per Cwt.)
Average Price Received for
Milk Cows
Table21: AveragePricesReceivedforCrops
(Dollars Per Unit)
Source:USDA/NASS:AgriculturalPrices.Pricesareseasonaveragesforcropyears.
1/Marketingyearsbeginning:June(barleyandoats);September(soybeans,corn,andMay(hay).
2/Priorto1990,allhay. 5-stateaveragepremium alfalfaprices: 2019:$213/ton;2020: $202/ton; 2021: $230/ton. Soybeanmealpricesarecalendaryearaveragesofhighproteinsoybeanmealat Decatur-CentralIllinoisasreportedbyUSDA/AMS. Unavailablepriorto2000.
Table22: CropProduction
Source:USDA/NASS:CropProductionAnnual.
21 Marketing Corn Oats Barley Soybeans Soybean Alfalfa Hay 2 Year 1 (bu) (bu) (bu) (bu) Meal (ton) (dry ton) 1975 $2.54 $1.45 $2.42 $4.92 n/a $52.10 1980 $3.11 $1.72 $2.79 $7.60 n/a $71.00 1985 $2.23 $1.23 $1.98 $5.05 n/a $67.60 1990 $2.28 $1.14 $2.14 $5.74 n/a $86.60 1995 $3.24 $1.67 $2.89 $6.72 n/a $87.20 2000 $1.85 $1.10 $2.11 $4.54 $174.62 $88.90 2005 $2.00 $1.63 $2.53 $5.66 $188.17 $104.00 2006 $3.04 $1.87 $2.85 $6.43 $175.60 $113.00 2007 $4.20 $2.63 $4.02 $10.10 $230.40 $137.00 2008 $4.06 $3.15 $5.37 $9.97 $331.09 $165.00 2009 $3.55 $2.02 $4.66 $9.59 $347.74 $113.00 2010 $5.18 $2.52 $3.86 $11.30 $313.47 $123.00 2011 $6.22 $3.49 $5.35 $12.50 $335.07 $196.00 2012 $6.89 $3.89 $6.43 $14.40 $439.77 $211.00 2013 $4.46 $3.75 $6.06 $13.00 $466.54 $199.00 2014 $3.70 $3.21 $5.30 $10.10 $478.26 $196.00 2015 $3.61 $2.12 $5.52 $8.95 $341.20 $158.00 2016 $3.36 $2.06 $4.96 $9.47 $328.64 $136.00 2017 $3.36 $2.59 $4.47 $9.33 $315.00 $154.00 2018 $3.61 $2.66 $4.62 $8.48 $344.71 $180.00 2019 $3.56 $2.82 $4.69 $8.57 $305.80 $179.00 2020 $4.53 $2.77 $4.75 $10.80 $318.35 $171.00 2021 $5.45 $4.55 $5.31 $13.00 $404.47 $216.00 Year Corn Soybeans All Wheat Oats Barley Sorghum 1975 5,841 1,548 2,127 639 379 754 1980 6,639 1,798 2,381 459 361 579 1985 8,875 2,099 2,424 518 590 1,120 1990 7,934 1,926 2,730 358 422 573 1995 7,400 2,174 2,183 161 359 459 2000 9,915 2,758 2,228 149 318 471 2005 11,112 3,068 2,103 115 212 393 2010 12,425 3,331 2,163 82 180 345 2011 12,314 3,097 1,993 50 155 213 2012 10,755 3,042 2,252 61 219 248 2013 13,831 3,357 2,135 65 217 392 2014 14,217 3,928 2,026 70 182 433 2015 13,602 3,927 2,062 89 218 597 2016 15,148 4,296 2,309 65 200 480 2017 14,609 4,412 1,741 50 143 362 2018 14,340 4,428 1,885 56 154 365 2019 13,620 3,552 1,932 53 172 341 2020 14,111 4,216 1,828 66 171 373 2021 15,115 4,435 1,646 40 118 448
(Million Bushels)
Table23:FederalMarketOrderStatisticsbyMarket,2021

22 Order Producer Utilization Uniform Price Federal Order Number Deliveries Class I Class II Class III Class IV at 3.5% bf (Million #) Northeast(Boston) 1 27,045 30% 25% 26% 19% $17.88 Appalachian(Charlotte) 5 5,289 71% 13% 5% 11% $19.31 Florida(Tampa) 6 2,444 82% 15% 1% 3% $21.28 Southeast(Atlanta) 7 4,581 68% 20% 4% 8% $19.47 UpperMidwest(Chicago) 30 17,940 14% 10% 67% 9% $16.98 Central(KansasCity) 32 12,992 34% 13% 26% 28% $16.66 Mideast(Cleveland) 33 18,606 35% 21% 30% 15% $17.08 California(LosAngeles) 51 23,803 20% 6% 15% 59% $16.56 PacificNorthwest(Seattle) 124 7,387 22% 6% 32% 40% $16.67 Southwest(Dallas) 126 12,286 32% 12% 19% 37% $17.22 Arizona(Phoenix) 131 4,461 31% 11% 18% 41% $17.24 AllMarketsAverageorTotal 136,836 31% 15% 27% 27% $17.33 Source:USDA/AMS
(Percent)
Table 24: Measures of Growth in Federal
23
FMMO Deliveries (Billion Pounds) Price at 3.5% BF Number of Producer % of U.S. Used In % Class I ($ Per Cwt.) Year Markets Handlers Producers Deliveries Production Class I Utilization Class I Blend 1950 39 1,101 156,584 18.7 25.2% 11.0 58.9% $4.51 $3.93 1955 63 1,483 188,611 28.9 31.8% 18.0 62.3% $4.67 $4.08 1960 80 2,259 189,816 44.8 43.1% 28.8 64.2% $4.88 $4.47 1965 73 1,891 158,077 54.4 48.3% 34.6 63.5% $4.93 $4.31 1970 62 1,588 143,411 65.1 59.2% 40.1 61.5% $6.74 $5.95 1975 56 1,315 123,855 69.2 62.8% 40.1 57.9% $9.36 $8.64 1980 47 1,091 117,490 84.0 67.4% 41.0 48.9% $13.77 $12.86 1985 44 884 116,765 97.8 70.2% 42.2 43.2% $13.88 $12.61 1990 42 753 100,397 102.4 70.5% 43.8 42.8% $15.55 $13.78 1995 33 571 88,717 108.5 71.1% 45.0 41.5% $14.19 $12.79 2000 11 346 69,585 116.9 69.8% 46.0 39.3% $14.24 $12.11 2005 10 302 53,032 114.7 64.8% 44.6 38.9% $17.13 $15.07 2006 10 314 52,721 120.6 66.4% 45.3 37.6% $14.59 $12.86 2007 10 312 49,777 114.4 61.6% 45.2 39.5% $20.81 $19.19 2008 10 333 47,854 115.9 61.0% 45.0 38.8% $20.78 $18.24 2009 10 251 46,671 123.4 65.2% 45.3 36.7% $14.40 $12.44 2010 10 251 45,918 126.9 65.8% 45.0 35.4% $18.25 $16.07 2011 10 241 43,650 126.9 64.7% 44.4 35.0% $21.97 $19.87 2012 10 237 40,745 122.4 61.0% 43.5 35.5% $20.39 $18.05 2013 10 225 40,043 132.1 65.6% 42.7 32.4% $21.80 $19.44 2014 10 223 39,146 129.4 62.8% 41.4 32.0% $26.14 $23.54 2015 10 214 36,112 126.1 60.5% 41.2 32.7% $19.21 $16.70 2016 10 216 34,689 133.8 63.0% 41.1 30.7% $17.70 $15.38 2017 10 217 32,981 135.5 62.9% 40.6 30.0% $19.31 $16.96 2018 1 11 233 32,061 141.7 65.1% 40.9 28.9% $17.70 $15.51 2019 11 230 29,474 156.5 71.7% 43.9 28.0% $19.74 $17.35 2020 11 228 24,906 137.8 61.7% 43.8 31.8% $19.70 $16.12 2021 11 223 23,292 136.8 60.5% 42.1 30.8% $19.56 $17.33
Dairy
1/
1, 2018
Milk Marketing Orders
Source: USDA / AMS,
Market Statistics.
Includes California order, effective November
Table 25: Sales & Butterfat Content of Fluid Milk Products in Federal Milk Marketing Orders1
Skim, Low & Reduced
Source: USDA/AMS, Federal Milk Order Market Statistics, NMPF Calculations
1/ Fluid milk products: plain and flavored whole, lowfat and skim milk, buttermilk and drinkable yogurt, including organic products. Beginning 2015, estimated U.S. sales.
Figure 14: Average Butterfat Content of Fluid Milk Products
24
All Fluid Whole Milk Items Fat Items Beverage % of Total Average % of Total Average Average Year Fluid Sales bf test Fluid Sales bf test bf test (Percent) 1960 89.3% 3.57% 7.7% 1.12% 3.38% 1965 86.4% 3.52% 11.1% 1.36% 3.28% 1970 77.0% 3.46% 21.1% 1.54% 3.05% 1975 68.8% 3.37% 29.2% 1.46% 2.75% 1980 59.4% 3.32% 38.5% 1.49% 2.60% 1985 50.4% 3.31% 44.9% 1.53% 2.47% 1990 37.6% 3.27% 57.0% 1.44% 2.13% 1995 33.4% 3.27% 62.9% 1.33% 2.00% 2000 33.6% 3.27% 62.0% 1.32% 1.98% 2005 30.6% 3.27% 63.1% 1.33% 1.94% 2006 29.5% 3.30% 64.2% 1.30% 1.93% 2007 30.0% 3.27% 68.6% 1.29% 1.88% 2008 28.7% 3.27% 69.9% 1.29% 1.85% 2009 28.3% 3.27% 71.7% 1.29% 1.84% 2010 27.3% 3.27% 72.7% 1.31% 1.81% 2011 27.1% 3.28% 72.9% 1.33% 1.80% 2012 27.1% 3.28% 72.9% 1.34% 1.79% 2013 27.8% 3.29% 72.2% 1.35% 1.82% 2014 28.6% 3.29% 71.4% 1.37% 1.85% 2015 30.7% 3.25% 69.3% 1.37% 1.95% 2016 32.6% 3.25% 67.4% 1.39% 2.00% 2017 34.2% 3.25% 65.8% 1.40% 2.05% 2018 35.6% 3.25% 64.4% 1.42% 2.08% 2019 36.9% 3.25% 63.1% 1.44% 2.12% 2020 38.0% 3.25% 62.0% 1.49% 2.17% 2021 37.8% 3.25% 62.2% 1.48% 2.17%
0.0% 0.5% 1.0% 1.5% 2.0% 2.5% 3.0% 3.5% 4.0% 1960 1970 1980 1990 2000 2010 2020
1
Table26:AnnualCommercialDisappearanceofDairyProducts,MilkEquivalent, TotalMilkSolidsBasis
Source:NMPFandUSDA/ERS: Livestock, Dairy, and Poultry Situation and Outlook
Excludescommercialexportsbeginning1995;1/Excludeswheyvalues;2/Includesskimmilkpowder
Source:NMPFandUSDA/ERS: Livestock, Dairy, and Poultry Situation and Outlook Excludes
25 Fluid Frozen Non-Fat Other Total Year Milk Butter Cheese 1/ Products Dry Milk 2/ Products Milk 1970 48,329 7,944 11,816 12,433 6,686 25,863 108,481 1975 47,870 8,409 15,416 13,227 4,741 22,209 111,872 1980 46,908 7,772 19,353 12,983 3,666 27,415 118,097 1985 47,149 8,121 23,980 14,387 2,959 31,489 128,084 1990 46,378 8,092 30,366 14,440 4,748 38,175 142,199 1995 47,507 7,849 32,072 15,621 7,282 43,642 153,972 2000 45,859 8,347 37,559 16,506 6,038 51,842 166,152 2005 44,680 8,951 41,893 15,900 12,483 59,503 183,410 2006 44,236 9,327 43,401 16,247 11,565 62,246 187,023 2007 43,961 9,894 44,637 16,059 11,005 64,531 190,087 2008 43,737 11,136 44,894 15,806 13,619 64,831 194,022 2009 44,059 10,211 45,273 15,589 12,608 64,592 192,332 2010 43,849 10,648 46,814 15,800 14,386 65,009 196,506 2011 43,243 11,741 47,801 15,346 14,896 67,022 200,049 2012 42,463 11,937 48,713 15,726 16,451 68,662 203,951 2013 41,381 12,436 49,527 15,264 16,572 70,556 205,736 2014 40,470 12,273 51,348 15,011 16,995 72,901 208,998 2015 40,003 11,961 52,500 15,634 17,712 75,304 213,115 2016 39,767 12,171 54,229 15,561 17,524 78,466 217,719 2017 38,835 12,245 55,740 15,297 17,302 79,349 218,768 2018 37,981 13,041 57,182 14,508 17,959 82,286 222,958 2019 37,329 13,191 57,692 14,877 18,552 82,146 223,787 2020 37,303 13,590 57,476 14,977 19,674 83,930 226,951 2021 35,823 14,223 59,675 14,388 20,712 86,670 231,491
(Million Pounds)
Fluid Milk Cheese 1/ Total Products Year (ME Lbs.) % Change (ME Lbs.) % Change (ME Lbs.) % Change 1970 236.9 0.8% 58.2 -6.9% 531.8 8.8% 1975 222.2 0.1% 72.2 -1.5% 519.2 -0.4% 1980 206.4 -2.3% 88.0 1.8% 519.7 -1.7% 1985 197.7 0.7% 100.6 4.7% 537.1 1.4% 1990 185.4 -2.1% 121.4 3.1% 568.5 0.0% 1995 178.2 2.8% 120.3 -0.7% 560.6 -2.1% 2000 162.5 -0.8% 133.1 2.0% 565.7 1.0% 2005 151.2 -1.2% 141.8 1.2% 575.3 2.1% 2010 141.8 -1.3% 151.3 1.3% 558.1 -2.8% 2011 138.8 -2.1% 153.4 0.4% 559.8 0.3% 2012 135.3 -2.5% 155.2 0.6% 567.0 1.3% 2013 131.0 -3.2% 156.7 -0.1% 553.8 -2.3% 2014 127.1 -2.9% 161.3 2.1% 558.8 0.9% 2015 124.8 -1.9% 163.7 2.7% 574.8 2.9% 2016 123.1 -1.3% 167.9 3.4% 581.5 1.2% 2017 119.5 -3.0% 171.5 1.3% 576.9 -0.8% 2018 116.3 -2.7% 175.0 2.1% 577.7 0.1% 2019 113.7 -2.2% 175.8 0.4% 585.4 1.3% 2020 112.5 -1.1% 173.4 -1.4% 577.2 -1.4% 2021 107.9 -4.1% 179.8 3.7% 581.0 0.6%
1995.
commercialexportsbeginning
1/Excludeswheyvalues
Table27:PerCapitaCommercialDisappearanceofDairyProducts
Table 28: Share of Commercial Disappearance byProduct
Source: NMPF; Shares are based on a milk equivalent, total solids basis. Includes commercial exports; 1/ Excludes whey values; 2/ Includes skim milk powder
Figure 15: Share of Commercial Disappearance byProduct


26 Fluid Frozen Nonfat Other Year Milk Butter Cheese 1/ Products Dry Milk 2/ Products 1970 44.6% 7.3% 10.9% 11.5% 6.2% 23.8% 1975 42.8% 7.5% 13.8% 11.8% 4.2% 24.2% 1980 39.7% 6.6% 16.4% 11.0% 3.1% 23.2% 1985 36.8% 6.3% 18.7% 11.2% 2.3% 24.6% 1990 32.6% 5.7% 21.4% 10.2% 3.3% 26.8% 1995 31.8% 5.3% 21.5% 10.5% 4.9% 28.3% 2000 28.7% 5.2% 23.5% 10.3% 3.8% 31.2% 2005 26.3% 5.3% 24.6% 9.4% 7.3% 32.4% 2010 25.4% 6.2% 27.1% 9.2% 8.3% 33.1% 2011 24.8% 6.7% 27.4% 8.8% 8.5% 33.5% 2012 23.9% 6.7% 27.4% 8.8% 9.2% 33.7% 2013 23.6% 7.1% 28.3% 8.7% 9.5% 34.3% 2014 22.8% 6.9% 28.9% 8.4% 9.6% 34.9% 2015 21.7% 6.5% 28.5% 8.5% 9.6% 35.3% 2016 21.2% 6.5% 28.9% 8.3% 9.3% 36.0% 2017 20.7% 6.5% 29.7% 8.2% 9.2% 36.3% 2018 20.1% 6.9% 30.3% 7.7% 9.5% 36.9% 2019 19.4% 6.9% 30.0% 7.7% 9.7% 36.7% 2020 19.5% 7.1% 30.0% 7.8% 10.3% 37.0% 2021 18.6% 7.4% 30.9% 7.5% 10.7% 37.4%
Fluid Milk 19% Butter 7% Cheese 31% Frozen Products 7% Nonfat Dry Milk 11% Other Products 37% 2021 Fluid Milk 40% Butter 7% Cheese 16% Frozen Products 11% Nonfat Dry Milk 3% Other Products 23% 1980
Table 29: Fluid Milk Sales for Beverage Products
Source: USDA / ERS: Livestock, Dairy, and Poultry Situation & Outlook
Table 30: Per Capita Fluid Milk Sales: Selected Products
27 Plain Flavored Plain Plain Flavored Total Beverage Year Whole Whole Lowfat Skim Lowfat/Skim Buttermilk Milk Million Pounds 1970 41,363 1,144 6,082 2,368 611 1,130 52,698 1975 36,188 1,366 11,468 2,480 719 1,011 53,308 1980 31,253 1,075 15,918 2,636 1,197 927 53,101 1985 27,760 882 19,812 3,009 1,430 1,046 54,060 1990 21,333 691 24,509 5,702 1,657 879 54,894 1995 18,662 704 24,202 8,359 1,914 739 54,692 2000 18,696 925 23,697 8,348 2,736 623 55,240 2005 16,919 743 24,286 8,028 3,655 522 54,544 2010 14,412 551 26,598 8,385 3,981 454 54,870 2011 14,042 520 26,612 8,216 3,898 471 53,938 2012 13,854 519 26,460 7,740 3,853 477 53,083 2013 13,784 567 25,982 7,093 3,825 496 51,923 2014 13,848 534 25,218 6,318 3,781 486 50,368 2015 14,450 572 24,478 5,635 3,827 514 49,648 2016 15,241 613 23,862 5,014 3,915 512 49,349 2017 15,621 656 22,907 4,410 3,978 501 48,269 2018 15,901 708 22,110 3,966 3,830 478 47,235 2019 16,123 780 21,352 3,543 3,746 445 46,417 2020 16,651 766 21,648 3,068 2,876 421 46,365 2021 15,812 810 20,063 2,692 3,361 454 44,512
Total includes miscellaneous fluid milk products, beginning 2003.
Whole Milk Lowfat/Skim Milk Total Beverage Milk Year (Pounds) (Gallons) (Pounds) (Gallons) (Pounds) (Gallons) 1970 207.3 24.0 44.2 5.1 257.0 29.8 1975 173.9 20.2 67.9 7.9 246.8 28.6 1980 142.0 16.5 86.7 10.0 233.2 27.0 1985 120.1 13.9 101.7 11.8 226.7 26.3 1990 88.0 10.2 127.4 14.7 219.5 25.4 1995 72.7 8.4 129.3 15.0 205.2 23.8 2000 69.5 8.1 123.2 14.3 195.6 22.7 2005 59.6 6.9 121.4 14.1 184.2 21.3 2010 48.4 5.6 126.0 14.6 177.4 20.6 2011 46.7 5.4 124.3 14.4 173.1 20.1 2012 45.8 5.3 121.3 14.0 169.1 19.6 2013 45.4 5.3 116.8 13.5 164.3 19.0 2014 45.2 5.2 111.0 12.8 158.2 18.3 2015 46.9 5.4 105.9 12.3 154.8 17.9 2016 49.1 5.7 101.5 11.8 152.8 17.7 2017 50.1 5.8 96.3 11.2 148.5 17.2 2018 50.8 5.9 91.5 10.6 144.6 16.8 2019 51.5 6.0 87.3 10.1 141.4 16.4 2020 52.5 6.1 83.2 9.6 139.9 16.2 2021 50.1 5.8 78.7 9.1 134.1 15.5
Table 31: Fluid Milk Sales for Cream/Other Products
Source: USDA / ERS: Livestock, Dairy, and Poultry Situation and Outlook and NMPF
Note: Light and heavycream no longer separated, beginning 2000. Cream and half and half no longer separated, beginning 2002. Total includes miscellaneous fluid milk products, beginning 2003.
28 Half & Light Heavy Sour Total Cream Per Capita Year Half Cream Cream Cream/Dip Eggnog Yogurt & Beverage (Pounds) 1970 591 76 111 222 61 169 53,928 264.4 1975 514 87 119 350 76 425 54,803 254.3 1980 551 55 159 408 95 570 54,844 241.4 1985 714 85 243 544 121 940 56,586 237.8 1990 739 88 324 625 123 974 57,644 230.9 1995 831 95 402 767 112 1,646 58,423 219.4 2000 1,008 743 914 127 1,837 60,031 212.8 2001 1,146 797 990 125 2,003 59,994 210.5 2002 1,860 1,031 150 2,311 60,433 210.1 2003 2,151 935 153 2,507 60,592 208.9 2004 2,313 987 147 2,707 60,702 207.3 2005 2,352 1,034 147 3,058 61,476 208.0 2006 2,459 1,121 151 3,301 62,010 207.8 2007 2,475 1,135 141 3,476 62,020 205.9 2008 2,530 1,151 143 3,570 61,973 203.8 2009 2,660 1,195 142 3,839 62,677 204.3 2010 2,755 1,228 141 4,181 63,175 204.2 2011 2,835 1,255 141 4,271 62,440 200.4 2012 2,910 1,281 134 4,417 61,826 197.0 2013 2,900 1,281 133 4,715 60,953 192.9 2014 2,965 1,303 132 4,757 59,524 187.0 2015 3,025 1,326 126 4,646 58,769 183.3 2016 3,155 1,374 134 4,458 58,470 181.1 2017 3,190 1,387 146 4,478 57,470 176.8 2018 3,175 1,401 124 4,453 56,387 172.6 2019 NA 1,424 121 4,378 NA NA 2020 NA 1,461 132 4,510 NA NA 2021 NA 1,494 141 4,743 NA NA
(Million Pounds)
0 5 10 15 20 25 30 1970 1975 1980 1985 1990 1995 2000 2005 2010 2015 2020 Gallons of Milk
Figure16:PerCapitaSalesofFluidMilk
TotalBeverage Milk Lowfat/Skim Milk Whole Milk
Figure16:PerCapitaSales ofFluidMilk
Table32:CheeseProduction,SelectedVarieties
Table33:PerCapitaCheeseConsumption,SelectedVarieties
29 American Italian Total Year Cheddar Other Total Mozzarella Other Total Swiss All Other Cheese (Million Pounds) 1970 1,182 241 1,423 n/a n/a 394 144 240 2,201 1975 1,205 450 1,655 458 214 672 174 311 2,811 1980 1,751 625 2,376 689 294 983 219 407 3,984 1985 2,292 564 2,855 1,104 387 1,491 223 512 5,081 1990 2,380 514 2,894 1,730 477 2,207 261 697 6,059 1995 2,415 716 3,131 2,125 550 2,674 222 889 6,917 2000 2,819 823 3,642 2,635 654 3,289 220 1,107 8,258 2005 3,046 762 3,808 3,019 784 3,803 300 1,238 9,149 2006 3,124 789 3,913 3,144 828 3,973 314 1,325 9,525 2007 3,057 821 3,877 3,330 869 4,199 314 1,387 9,777 2008 3,186 922 4,109 3,223 898 4,121 294 1,389 9,913 2009 3,205 997 4,203 3,268 913 4,181 322 1,369 10,074 2010 3,235 1,054 4,289 3,479 936 4,416 336 1,402 10,443 2011 3,096 1,130 4,227 3,574 1,011 4,585 329 1,454 10,595 2012 3,143 1,212 4,355 3,615 1,018 4,633 321 1,578 10,886 2013 3,190 1,230 4,420 3,700 1,035 4,735 294 1,652 11,102 2014 3,317 1,271 4,588 3,925 1,025 4,950 298 1,676 11,512 2015 3,393 1,301 4,694 3,989 1,093 5,082 312 1,743 11,831 2016 3,434 1,334 4,769 4,118 1,187 5,304 312 1,796 12,182 2017 3,721 1,351 5,072 4,167 1,228 5,395 317 1,856 12,640 2018 3,802 1,452 5,254 4,366 1,203 5,570 332 1,882 13,037 2019 3,737 1,495 5,232 4,495 1,176 5,671 338 1,896 13,137 2020 3,829 1,510 5,338 4,444 1,168 5,612 325 1,964 13,240 2021 3,933 1,634 5,568 4,488 1,265 5,752 330 2,057 13,707 Source:
/
Dairy Products American Italian All Total Consumed As: Year Cheddar Total Mozzarella Total Swiss Others Cheese Processed Natural (Pounds) 1970 5.79 7.00 1.19 2.05 0.88 1.44 11.37 4.42 6.95 1975 6.04 8.15 2.11 3.23 1.09 1.80 14.27 5.18 9.10 1980 6.84 9.62 3.01 4.42 1.32 2.16 17.52 5.52 12.01 1985 9.77 12.19 4.60 6.41 1.28 2.66 22.54 6.06 16.48 1990 9.05 11.13 6.88 8.92 1.35 3.21 24.61 6.81 17.80 1995 9.04 11.69 7.89 10.03 1.09 4.13 26.94 7.01 19.93 2000 9.88 12.70 9.06 11.42 1.02 4.68 29.82 6.47 23.35 2005 10.16 12.66 9.93 12.66 1.24 5.02 31.58 5.97 25.62 2006 10.43 13.07 10.11 12.93 1.23 5.20 32.43 6.06 26.37 2007 10.11 12.79 10.66 13.58 1.24 5.33 32.94 5.88 27.07 2008 10.22 13.13 10.10 13.06 1.10 5.10 32.39 5.62 26.77 2009 10.24 13.36 10.08 13.03 1.16 4.93 32.48 5.49 26.99 2010 10.06 13.30 10.58 13.54 1.18 4.90 32.92 5.20 27.72 2011 9.59 13.04 10.83 13.98 1.14 5.08 33.24 5.29 27.95 2012 9.59 13.26 10.69 13.80 1.09 5.37 33.52 5.23 28.29 2013 9.65 13.35 10.74 13.83 1.00 5.50 33.68 5.06 28.62 2014 9.86 13.66 11.17 14.20 1.02 5.55 34.43 5.91 28.52 2015 10.18 14.04 11.28 14.48 1.05 5.82 35.39 5.86 29.53 2016 10.40 14.36 11.74 15.23 1.06 6.05 36.70 5.61 31.10 2017 11.09 15.09 11.61 15.12 1.05 5.99 37.25 5.73 31.51 2018 11.21 15.40 12.21 15.70 1.08 6.05 38.24 5.73 32.51 2019 11.16 15.54 12.48 15.87 1.12 6.07 38.59 5.75 32.84 2020 11.13 15.55 12.20 15.51 1.04 6.11 38.22 5.51 32.71 2021 11.41 16.06 12.28 15.83 1.04 6.47 39.40 5.55 33.85
USDA
NASS:
Source:USDA/ERS: Livestock, Dairy, and Poultry Situation and Outlook Tables andNMPF
USDA/ERS: Dairy Products. 1/Cottagecheesecurdproduction.
30 Dry Milk Whey NFDM Whole Dry Protein Dry Protein Cottage Year Butter & SMP Milk Buttermilk Concentrate Whey Concentrate Cheese 1/ 1970 1,137 1,444 69 60 n/a 621 n/a 726 1975 984 1,001 63 43 n/a 596 n/a 701 1980 1,145 1,161 83 44 n/a 690 n/a 667 1985 1,248 1,390 119 52 n/a 987 105 599 1990 1,302 879 175 56 n/a 1,143 168 493 1995 1,264 1,233 171 55 n/a 1,147 294 459 2000 1,256 1,452 111 56 n/a 1,188 334 461 2005 1,347 1,533 32 66 n/a 1,041 384 469 2010 1,564 1,816 71 82 89 1,013 428 433 2011 1,810 1,945 66 100 94 1,010 431 424 2012 1,860 2,145 58 109 102 999 459 424 2013 1,863 2,109 72 119 102 953 498 389 2014 1,855 2,308 103 111 126 870 540 381 2015 1,850 2,269 109 98 157 978 493 401 2016 1,839 2,312 98 110 126 955 468 406 2017 1,847 2,365 122 113 139 1,035 489 390 2018 1,968 2,338 144 118 147 999 514 402 2019 1,994 2,424 141 118 162 978 491 391 2020 2,146 2,647 138 127 206 959 478 379 2021 2,072 2,722 148 132 197 934 509 358
Dry Dry NFDM Whole Dry Whey Cottage Year Butter & SMP Milk Buttermilk & WPC Cheese 1970 5.3 5.3 0.2 0.2 0.9 5.2 1975 4.7 3.3 0.1 0.2 2.2 4.6 1980 4.5 3.0 0.3 0.2 2.7 4.4 1985 4.9 2.3 0.4 0.2 3.5 4.0 1990 4.3 2.9 0.6 0.2 3.7 3.3 1995 4.6 3.4 0.4 0.2 4.2 2.7 2000 4.5 2.7 0.3 0.2 3.8 2.6 2005 4.5 4.2 0.2 0.2 2.9 2.7 2010 4.9 3.2 0.2 0.2 1.9 2.3 2011 5.4 3.0 0.2 0.2 1.5 2.3 2012 5.5 3.6 0.2 0.2 1.8 2.3 2013 5.5 2.9 0.2 0.3 1.9 2.1 2014 5.5 3.1 0.2 0.2 2.0 2.1 2015 5.6 3.2 0.3 0.2 2.4 2.1 2016 5.7 2.9 0.3 0.2 2.0 2.2 2017 5.7 2.8 0.3 0.2 2.0 2.1 2018 6.0 2.3 0.4 0.2 2.2 2.1 2019 6.2 2.7 0.3 0.2 2.2 2.1 2020 6.3 2.4 0.3 0.2 1.6 2.0 2021 6.5 2.3 0.2 0.2 1.7 1.9
Source:
Source: USDA/ERS: Livestock, Dairy, and Poultry Situation and Outlook andNMPF.
(Million
(Pounds)
Table34: ProductionofButter,NFDM,andOtherProducts
Pounds)
Table35: PerCapitaConsumptionofButter,Cottage Cheese,NFDM,andOtherProducts
Source: USDA / NASS: Dairy Products . 1/ Excludes mellorine-based frozen desserts. Includes frozen yogurt prior to 1989 and nonfat ice cream prior to 1995.
31 Ice Cream Lowfat Nonfat Frozen Total Frozen Year (Regular) Ice Cream Ice Cream Sherbet Yogurt Other 1 Dairy Million Gallons 1970 762 287 n/a 48.9 n/a 6.7 1,104 1975 837 299 n/a 48.5 n/a 11.1 1,195 1980 830 293 n/a 45.2 n/a 10.3 1,179 1985 901 301 n/a 48.2 n/a 51.4 1,302 1990 824 352 n/a 50.3 117.6 32.4 1,376 1995 862 357 43.9 53.5 152.1 19.1 1,488 2000 980 373 30.7 51.9 94.5 11.6 1,542 2005 960 360 20.8 56.4 66.1 7.8 1,471 2006 982 377 16.2 59.2 66.0 11.4 1,511 2007 956 382 14.4 62.7 74.7 12.3 1,502 2008 931 384 15.4 57.7 78.6 14.3 1,481 2009 918 400 16.8 53.3 46.0 15.2 1,449 2010 929 415 16.0 49.3 50.1 12.2 1,472 2011 888 415 17.2 45.4 62.7 12.3 1,441 2012 894 457 17.2 43.6 57.6 12.3 1,482 2013 897 401 14.2 46.1 74.5 12.2 1,445 2014 866 412 18.3 48.4 66.5 12.9 1,423 2015 897 439 13.6 44.7 74.2 14.2 1,482 2016 907 436 12.4 44.3 66.8 14.6 1,481 2017 871 461 11.4 43.0 62.9 22.6 1,472 2018 852 460 11.4 38.3 55.1 22.7 1,440 2019 879 474 9.9 44.4 56.9 19.6 1,484 2020 916 463 9.1 36.8 35.1 14.8 1,474 2021 872 461 8.6 40.6 46.4 11.5 1,439
Regular Ice Cream Reduced Fat Ice Cream Sherbet Other Year Lbs. Change Lbs. Change Lbs. Change Lbs. 1970 17.6 -0.6% 7.8 0.0% 1.6 0.0% 1.4 1975 18.2 4.6% 7.7 0.0% 1.3 -10.1% 1.8 1980 17.1 1.1% 7.1 -2.7% 1.2 -1.0% 1.3 1985 17.8 -0.1% 6.9 -1.4% 1.2 0.6% 2.7 1990 15.5 -2.0% 6.3 -24.6% 1.2 -5.6% 5.0 1995 15.0 -2.8% 7.0 10.4% 1.2 -1.9% 5.7 2000 16.1 -0.5% 6.6 -5.2% 1.1 -5.8% 3.7 2005 15.1 3.3% 6.0 -7.9% 1.1 1.6% 2.9 2006 15.3 1.4% 6.1 2.1% 1.2 4.4% 3.0 2007 14.8 -3.6% 6.1 -0.1% 1.2 4.8% 3.1 2008 14.2 -3.6% 6.1 -0.2% 1.1 -8.9% 3.1 2009 13.9 -2.2% 6.3 3.4% 1.0 -8.4% 2.5 2010 14.0 0.2% 6.5 2.6% 1.0 -8.2% 2.6 2011 13.2 -5.3% 6.4 -0.7% 0.9 -7.8% 2.8 2012 13.2 -0.3% 7.0 8.6% 0.8 -4.5% 2.8 2013 13.0 -0.9% 6.0 -13.6% 0.9 4.7% 3.0 2014 12.5 -4.4% 6.2 2.7% 0.9 3.7% 2.9 2015 12.9 3.1% 6.5 4.8% 0.8 -9.2% 3.1 2016 12.9 0.5% 6.4 -1.6% 0.8 -0.9% 2.8 2017 12.3 -4.7% 6.7 4.6% 0.8 -3.3% 2.9 2018 12.0 -2.9% 6.6 -1.0% 0.7 -11.4% 2.8 2019 12.3 2.8% 6.8 2.2% 0.8 15.7% 2.8 2020 12.7 3.2% 6.5 -3.3% 0.7 -16.7% 2.3 2021 12.0 -5.0% 6.4 -2.7% 0.8 14.0% 2.7
Livestock,
Source: USDA / ERS:
Dairy, and Poultry Situation and Outlook and NMPF Table 36: Production of Frozen DairyProducts Table 37: Per Capita Consumption of Frozen DairyProducts,
Table38:Cheese,Butter,&NFDMProduction,byState,2021
Source:USDA/NASS: Dairy Products
Note:Somestateswithlargeproductionarenotreportedtoavoidviolatingconfidentiality.
1/Doesnotinclude698millionlbs.ofprotein-standardizedskimmilkpowdersor8millionlb.of dryskimmilkproducedforanimalfeeduses.


Figure17:ProductionShareofManufacturedProductsbyRegion,2021

32 Cheese Butter Nonfat Dry Milk (food) 1/ State Mil. lbs. Share State Mil. lbs. Share State Mil. lbs. Share WI 3,474 25.3% CA 672 32.5% CA 873 43.1% CA 2,439 17.8% PA 89 4.3% PA 174 8.6% ID 1,003 7.3% NM 958 7.0% NY 833 6.1% MN 765 5.6% PA 435 3.2% IA 338 2.5% OH 249 1.8% VT 143 1.0% IL 65 0.5% NJ 61 0.4% Reported Reported Reported States 10,764 78.5% States 762 36.8% States 1,047 51.7% Other Other Other States 2,943 21.5% States 1,310 63.2% States 977 48.3% Total 13,707 100.0% Total 2,072 100.0% Total 2,024 100.0%
Atlantic 16.4% Central 19.8% West 63.8% NFDM Atlantic 11.8% Central 48.2% West 40.0% Cheese Atlantic 8.1% Central 38.7% West 53.1% Butter
Table 39: Plants Processing DairyProducts & Volume Per Plant, Selected Years
Source: USDA/NASS, Dairy Products Annual Summary; USDA/ERS.
/1 Cottage cheese, curd.
/2 Yogurt, plain and flavored (non-frozen).
/3 Canned evaporated and condensed whole milk.
/4 Thousand Gallons, Hard regular ice cream.
/5 Thousand Gallons, Hard regular and lowfat frozen yogurt.
/6 Thousand Gallons, Hard sherbet.
/7 Nonfat dry milk for food use, excludes protein-standardized skim milk powders.
/8 Dry skim powders.
/9 Dry whole milk.
/10 40% or more protein by weight.
/11 Dry whey for human consumption.
/12 Whey protein concentrate for human consumption.
/13 90% or more protein by weight.
33 Processing Plants Product 2000 2010 2020 2021 2000 2010 2020 2021 (Number of Plants) Butter 77 76 102 97 16,312 20,579 21,038 21,358 Total Cheese 402 515 533 511 20,542 20,278 24,840 26,823 American Cheese 197 211 250 242 18,485 20,329 21,353 23,006 Cheddar 174 197 234 227 16,201 16,421 16,361 17,327 Italian Cheese 153 176 196 201 21,496 25,089 28,634 28,618 Mozzarella 121 121 122 128 21,777 28,756 36,427 35,060 Swiss Cheese 37 54 63 61 5,958 6,231 5,157 5,410 Cottage Cheese /1 95 67 54 48 4,852 6,461 7,022 7,465 Cream/Neufchatel Cheese 35 32 31 29 19,641 23,277 32,651 35,719 Processed Cheese 30 26 28 27 46,276 44,101 59,894 74,478 Sour Cream n/a 116 102 99 n/a 10,586 14,322 15,092 Yogurt /2 80 120 157 159 22,957 34,839 28,725 29,832 Evap/Condensed Milk /3 7 6 7 6 63,141 83,778 77,886 88,948 Ice Cream /4 413 393 401 390 2,136 2,083 1,912 1,853 Frozen Yogurt /5 145 85 76 74 190 229 203 170 Sherbet /6 246 177 130 125 201 263 256 224 Nonfat Dry Milk /7 46 49 54 47 31,560 31,888 36,146 43,064 Skim Milk Powder /8 n/a 10 18 20 n/a 25,380 38,624 34,900 Whole Milk Powder /9 16 13 13 14 6,961 5,466 10,624 10,593 Milk protein concentrate /10 n/a 9 13 13 n/a 9,846 15,870 15,116 Dry Buttermilk 21 26 22 21 2,678 3,155 5,764 6,271 Dry Whey /11 46 31 27 26 24,023 30,990 34,824 35,058 Whey protein conc. /12 28 41 49 45 10,374 9,591 9,554 11,025 Whey protein isolate /13 n/a 13 17 20 n/a 4,717 6,616 6,517 Lactose 27 31 30 29 18,150 29,304 37,348 39,712 Fluid Milk 405 404 368 370 143,170 135,818 125,590 119,843
Average Output Per Plant (Thousand Pounds)
Table40:CCCNetOutlaysbyCommodity,FiscalYear
Source: USDA/ERS, Agricultural Outlook Tables;USDABudgetSummaryannualpublications. 1/Doesnotinclude8,500milliondollarsinCoronavirusFoodAssistanceProgram(CFAP)paymentsduringFiscalYear2020. CFAPpaymentswere notCCCoutlaysbutsupplementalfundingundertheOfficeoftheSecretaryofAgriculture. Dairy'sshareofthe30,561milliondollarsoftotalCFAP paymentsduringfiscalyears2020and2021was3,027milliondollars,or9.9percentofthetotal.
Figure18:Dairy'sShareOfTotalCCCOutlays
34
Commodity Program 1985 1990 1995 2000 2005 2010 2015 2017 2018 2019 2020 1/ 2021 Million Dollars Corn 4,403 2,435 2,090 10,136 6,243 1,965 n/a n/a n/a n/a n/a n/a GrainSorghum 463 349 153 979 376 182 n/a n/a n/a n/a n/a n/a Barley 336 (94) 129 397 189 79 n/a n/a n/a n/a n/a n/a Oats 2 (5) 19 61 3 2 n/a n/a n/a n/a n/a n/a Corn/Oats 7 8 1 6 2 (2) n/a n/a n/a n/a n/a n/a TotalFeedGrains 5,211 2,693 2,392 11,579 6,813 2,226 247 4,593 3,460 970 736 3,125 Wheat 4,691 796 803 5,321 1,232 1,280 143 1,106 1,957 1,049 470 1,848 Rice 990 667 814 1,774 473 535 18 542 828 495 635 686 UplandCotton 1,553 (79) 99 3,809 4,245 1,668 1,013 (1) 295 70 118 2,179 Tobacco 455 (307) (298) 657 (411) 21 (225) 0 0 0 0 0 Dairy 2,085 505 4 684 40 355 (66) 0 245 319 209 781 Soybeans 711 5 77 2,840 1,140 550 30 1,125 225 270 184 1,192 Peanuts 12 1 120 35 408 103 74 545 676 300 297 1,293 Sugar 184 15 (3) 465 (86) 0 0 83 0 0 0 1,050 Honey 81 47 (9) 7 8 0 0 (4) 1 0 2 4 Wool&Mohair 109 104 108 (2) 7 8 n/a 0 0 0 0 0 ExportPrograms 134 (34) 1,361 216 (1,443) 405 230 243 231 236 196 563 ConservationPrograms 0 0 0 1,774 1,851 1,919 1,741 1,886 1,955 1,902 1,854 2,090 Other (314) 808 557 2,310 5,829 960 3,764 522 863 16,036 12,452 2,685 Grand Total: 17,683 6,471 6,030 32,265 20,187 10,015 6,969 10,854 10,858 21,647 17,153 17,496
-5% 0% 5% 10% 15% 20% 25% 30% 35% 40% 45% 50% 1980 1982 1984 1986 1988 1990 1992 1994 1996 1998 2000 2002 2004 2006 2008 2010 2012 2014 2016 2018 2020
Figure 19: Share ofU.S. DairyExports byDestination,2021
Table 41: U.S. FreshMilk &CreamExports

35
Importing Share Value Region/Country 2017 2018 2019 2020 2021 2021 2021 (Percent) $1,000 FRESHMILK&CREAM (HTS0401) North America 63,749 63,110 73,158 69,631 81,625 54.4% $71,122 Canada 24,107 23,583 33,691 40,399 53,132 35.4% $52,647 Mexico 39,479 39,381 39,287 29,070 28,358 18.9% $17,805 Caribbean 5,334 9,664 6,863 4,454 5,248 3.5% $7,902 DominicanRepublic 2,423 6,590 3,363 1,447 3,153 2.1% $4,791 Bahamas 1,241 1,427 1,348 1,487 1,352 0.9% $1,705 Central America 445 273 221 297 246 0.2% $507 South America 4,068 321 1,078 237 135 0.1% $375 European Union-27 62 69 35 70 110 0.1% $302 Other Europe 0 0 3 0 0 0.0% $0 Russia/Central Asia 0 0 0 0 0 0.0% $0 Middle East 475 1,003 126 11 172 0.1% $189 North Africa 189 0 0 78 0 0.0% $0 Subsaharan Africa 33 1 33 13 174 0.1% $346 South Asia 162 86 31 7 6 0.0% $11 Southeast Asia 2,024 2,366 2,142 2,294 1,562 1.0% $2,013 East Asia 32,125 41,645 51,001 56,070 60,707 40.4% $59,154 Taiwan 29,680 38,851 48,252 54,432 58,864 39.2% $55,986 China 114 199 373 446 654 0.4% $1,252 HongKong 1,977 1,928 1,778 857 1,035 0.7% $1,189 Oceania 296 262 270 203 157 0.1% $335 Other 0 0 0 0 0 0.0% $0 World Total 108,962 118,802 134,961 133,364 150,142 100.0% $142,254 Source: USDA/FAS
Source: USDA/FAS, NMPF
Volume (Metric Tons) Mexico, 22% China, 18% Philippines, 7% Vietnam, 6% Indonesia, 5% Canada, 4% Japan, 4% South Korea, 4% New Zealand, 3% Malaysia, 2% Thailand, 2% Taiwan, 2% Colombia, 2% All Other,19%
all products MilkEquivalent, totalsolids basis
Share,
Table42:U.S.Butter&CheeseExports
36 Importing Share Value Region/Country 2017 2018 2019 2020 2021 2021 2021 (Percent) $1,000 BUTTERANDOTHERFATS(HTS0405) North America 15,510 30,143 13,391 12,891 20,275 35.5% $82,368 Canada 11,109 13,877 9,352 9,210 16,903 29.6% $69,721 Mexico 4,266 16,126 3,977 3,643 3,320 5.8% $12,449 Caribbean 1,362 2,463 1,310 1,051 2,925 5.1% $9,380 DominicanRepublic 380 1,431 398 242 1,987 3.5% $5,601 Central America 840 2,560 1,063 738 1,888 3.3% $7,380 South America 1,521 594 1,747 484 453 0.8% $1,263 European Union-27 1,286 2,139 87 299 2,159 3.8% $7,577 Other Europe 10 18 10 1 7 0.0% $24 Russia/Central Asia 9 0 0 0 230 0.4% $955 Middle East 2,894 3,372 2,214 6,282 12,039 21.1% $44,448 Bahrain 416 459 259 1,714 6,489 11.4% $21,727 SaudiArabia 1,821 2,343 1,588 3,930 4,901 8.6% $20,203 North Africa 2,062 477 0 87 4,030 7.1% $15,532 Egypt 1,317 0 0 25 2,816 4.9% $10,710 Subsaharan Africa 9 3 10 10 395 0.7% $1,867 South Asia 46 100 25 33 28 0.0% $73 Southeast Asia 261 361 186 253 2,050 3.6% $6,142 East Asia 3,037 2,835 4,437 4,004 9,026 15.8% $29,622 China 396 47 254 560 3,915 6.9% $10,237 SouthKorea 1,710 1,088 2,229 1,824 3,441 6.0% $13,710 Oceania 156 95 252 38 1,593 2.8% $6,523 Australia 144 41 244 0 1,587 2.8% $6,506 Other 0 0 0 0 10 0.0% $25 World Total 29,002 45,157 24,731 26,170 57,107 100.0% $213,178 Importing Share Value Region/Country 2017 2018 2019 2020 2021 2021 2021 (Percent) $1,000 CHEESE(HTS0406) North America 108,782 105,252 105,015 104,271 119,254 29.6% $545,617 Mexico 96,420 96,857 95,648 92,896 104,539 26.0% $457,391 Canada 11,789 7,757 8,760 10,764 13,994 3.5% $83,865 Caribbean 15,046 16,606 18,660 15,381 17,453 4.3% $89,108 Central America 20,645 24,105 27,013 23,109 34,985 8.7% $157,560 Panama 5,893 7,248 7,584 6,754 10,589 2.6% $48,923 Guatemala 6,262 7,947 8,708 6,998 9,900 2.5% $44,035 South America 15,836 18,239 19,541 17,529 23,151 5.8% $102,888 Chile 9,092 10,855 11,018 11,022 14,501 3.6% $58,633 European Union-27 758 1,126 791 1,142 1,452 0.4% $7,237 Other Europe 257 253 240 141 37 0.0% $165 Russia/Central Asia 48 15 20 8 5 0.0% $36 Middle East 19,199 21,282 23,489 15,521 21,000 5.2% $85,509 North Africa 1,758 2,758 1,565 599 1,122 0.3% $4,880 Subsaharan Africa 171 256 165 72 107 0.0% $373 South Asia 137 107 96 31 64 0.0% $270 Southeast Asia 16,545 18,726 21,923 24,714 23,577 5.9% $102,198 East Asia 108,671 111,517 113,790 125,331 131,674 32.7% $576,274 SouthKorea 52,097 55,809 60,622 70,185 69,570 17.3% $282,825 Japan 32,384 33,081 35,189 37,001 41,315 10.3% $187,819 China 14,048 12,349 7,770 7,654 9,129 2.3% $45,192 Taiwan 8,023 8,469 8,189 8,521 9,116 2.3% $45,493 Oceania 32,601 27,226 24,189 27,639 28,524 7.1% $113,955 Australia 30,196 24,612 21,054 24,140 25,008 6.2% $98,483 Other 0 0 0 2 1 0.0% $3 World Total 340,489 347,505 356,515 355,508 402,457 100.0% $1,786,279 Source: USDA/FAS
Volume (Metric Tons) Volume (Metric Tons)
Table43:U.S.MilkPowderExports
37 Importing Share Value Region/Country 2017 2018 2019 2020 2021 2021 2021 (Metric Tons) (Percent) $1,000 NONFATDRYMILK/SKIMMILKPOWDER,lessthan1.5%fat(HTS0402.10) North America 280,001 351,148 332,802 289,895 340,691 38.7% $968,979 Mexico 276,309 346,686 329,298 287,099 337,687 38.3% $961,199 Caribbean 6,892 6,462 7,217 9,637 13,456 1.5% $36,852 Central America 9,534 16,009 12,528 16,733 19,964 2.3% $55,932 South America 39,372 37,337 52,421 57,608 51,453 5.8% $144,639 Colombia 8,854 10,716 24,488 28,828 24,313 2.8% $70,434 Peru 15,676 14,068 14,211 15,780 15,261 1.7% $41,975 European Union-27 297 972 1,122 948 7,332 0.8% $19,755 Other Europe 842 29 47 286 231 0.0% $762 Russia/Central Asia 1,742 1,010 3,212 2,763 265 0.0% $779 Middle East 4,835 5,060 5,653 8,950 14,845 1.7% $43,498 North Africa 8,236 4,802 6,603 27,053 38,622 4.4% $106,245 Egypt 4,632 2,278 5,575 19,824 23,600 2.7% $66,010 Algeria 2,114 1,829 0 4,565 12,214 1.4% $33,177 Subsaharan Africa 3,048 3,366 4,149 5,320 2,115 0.2% $5,697 South Asia 28,244 24,196 18,827 14,555 9,768 1.1% $26,669 Southeast Asia 163,629 215,389 227,513 325,121 320,193 36.3% $880,620 Philippines 73,328 85,353 70,649 115,670 114,490 13.0% $312,542 Indonesia 31,977 55,684 67,283 97,383 76,641 8.7% $212,554 Vietnam 21,800 35,506 54,209 52,453 72,600 8.2% $199,997 Malaysia 27,717 31,252 25,292 41,081 36,341 4.1% $99,912 East Asia 56,453 37,942 22,094 43,015 59,103 6.7% $162,799 China 34,774 21,131 9,050 26,681 52,727 6.0% $145,122 Oceania 2,878 8,287 6,722 8,306 3,411 0.4% $9,894 Other 0 0 0 0 0 0.0% $0 World Total 606,002 712,007 700,910 810,190 881,449 100.0% $2,463,115 Importing Share Value Region/Country 2017 2018 2019 2020 2021 2021 2021 (Percent) $1,000 WHOLEMILKPOWDER,morethan1.5%fat(HTS0402.21&0402.29) North America 8,150 8,960 5,514 4,801 7,811 20.0% $23,926 Mexico 5,787 7,236 3,588 2,871 5,432 13.9% $17,478 Canada 2,356 1,707 1,903 1,898 2,238 5.7% $6,028 Caribbean 561 951 524 2,246 979 2.5% $2,859 DominicanRepublic 248 755 132 1,976 800 2.0% $2,578 Central America 439 1,199 1,284 1,731 2,168 5.5% $5,741 ElSalvador 116 688 748 578 937 2.4% $3,118 Panama 264 325 372 1,046 850 2.2% $1,924 South America 2,075 3,991 14,750 15,192 15,500 39.6% $52,342 Peru 117 433 5,198 11,416 12,285 31.4% $41,966 Colombia 1,733 2,837 8,708 2,968 2,586 6.6% $7,919 European Union-27 82 67 6 11 140 0.4% $482 Other Europe 37 32 7 78 10 0.0% $31 Russia/Central Asia 0 58 0 0 2 0.0% $10 Middle East 72 510 3,932 3,209 1,795 4.6% $5,734 North Africa 234 365 4,382 2,490 2,934 7.5% $9,723 Algeria 98 325 4,382 2,273 2,934 7.5% $9,723 Subsaharan Africa 14 0 875 463 187 0.5% $540 South Asia 11 73 1,422 1 0 0.0% $0 Southeast Asia 5,239 19,741 3,148 3,131 2,274 5.8% $7,022 Thailand 28 36 24 811 1,287 3.3% $4,086 East Asia 9,873 10,811 2,714 4,589 5,127 13.1% $13,837 China 9,281 10,321 1,765 4,184 4,393 11.2% $11,174 Oceania 453 1,286 677 575 195 0.5% $629 Other 0 0 0 0 0 0.0% $0 World Total 27,239 48,045 39,235 38,517 39,122 100.0% $122,878 Source: USDA/FAS
Volume Volume (Metric Tons)
Table44:U.S.IceCream&YogurtExports
38 Importing Share Value Region/Country 2017 2018 2019 2020 2021 2021 2021 (Metric Tons) (Percent) $1,000 ICECREAM(HTS2105) NorthAmerica 24,614 25,325 28,719 28,244 29,363 39.8% $84,131 Mexico 19,804 18,073 22,690 22,536 23,125 31.3% $58,863 Canada 4,109 6,621 5,480 5,104 5,557 7.5% $23,111 Caribbean 6,762 7,102 5,928 4,958 4,919 6.7% $18,187 Central America 1,299 1,043 1,271 1,225 2,098 2.8% $6,970 Panama 636 430 386 422 1,184 1.6% $3,871 SouthAmerica 3,067 3,471 3,294 3,004 3,549 4.8% $12,158 Chile 1,444 1,298 1,442 1,705 1,736 2.4% $5,578 EuropeanUnion-27 2,121 1,938 2,538 717 1,364 1.8% $5,026 Other Europe 877 4,996 1,638 2,049 564 0.8% $2,354 Russia/Central Asia 113 164 117 164 120 0.2% $462 MiddleEast 13,296 12,847 12,260 11,877 13,002 17.6% $51,865 SaudiArabia 6,114 6,267 5,736 5,732 5,909 8.0% $22,998 UnitedArabEmirates 3,917 3,449 3,017 2,833 3,567 4.8% $14,321 Kuwait 1,061 974 1,148 813 1,183 1.6% $4,867 NorthAfrica 146 158 93 47 76 0.1% $434 SubsaharanAfrica 416 992 701 832 1,123 1.5% $2,878 SouthAsia 60 292 259 266 469 0.6% $1,942 SoutheastAsia 4,732 4,726 4,510 4,878 4,603 6.2% $18,676 Malaysia 1,781 1,627 1,940 1,729 2,171 2.9% $8,738 Singapore 801 894 826 1,463 1,113 1.5% $4,297 EastAsia 4,561 3,909 4,453 4,950 7,827 10.6% $35,933 SouthKorea 1,482 1,389 2,205 3,251 3,956 5.4% $17,367 China 1,032 1,312 1,437 430 2,103 2.8% $11,152 Taiwan 541 372 325 1,056 1,432 1.9% $6,056 Oceania 5,936 7,774 6,522 8,983 4,755 6.4% $17,239 Australia 5,248 7,041 5,726 7,869 3,962 5.4% $14,714 Other 0 0 0 0 0 0.0% $0 WorldTotal 67,997 74,735 72,303 72,195 73,833 100.0% $258,255 Importing Share Value Region/Country 2017 2018 2019 2020 2021 2021 2021 (Percent) $1,000 YOGURT(HTS0403.10) NorthAmerica 6,120 5,669 6,395 4,885 6,701 33.9% $19,958 Mexico 4,968 4,519 4,883 3,458 4,901 24.8% $14,527 Canada 796 711 1,061 894 1,220 6.2% $4,062 Caribbean 4,715 4,705 4,938 4,424 4,248 21.5% $12,571 TrinidadandTobago 1,220 1,164 1,204 1,180 1,112 5.6% $3,335 WindwardandLeewardIslands 709 682 884 774 688 3.5% $1,885 Bahamas 442 427 417 581 647 3.3% $2,071 Central America 1,227 987 825 693 1,305 6.6% $4,986 Panama 705 529 437 407 912 4.6% $3,462 SouthAmerica 477 504 382 156 340 1.7% $933 EuropeanUnion-27 131 136 211 178 197 1.0% $535 Other Europe 59 71 0 0 0 0.0% $0 Russia/Central Asia 0 0 0 0 0 0.0% $0 MiddleEast 643 420 376 158 222 1.1% $678 NorthAfrica 0 1 6 0 2 0.0% $14 SubsaharanAfrica 7 21 13 6 39 0.2% $97 SouthAsia 41 141 54 0 17 0.1% $36 SoutheastAsia 334 334 480 210 250 1.3% $806 EastAsia 1,442 1,921 1,752 2,579 5,526 28.0% $9,452 SouthKorea 390 271 272 846 3,845 19.5% $5,053 Taiwan 555 954 1,133 1,199 1,228 6.2% $3,278 Oceania 1,156 1,046 1,010 1,043 901 4.6% $1,910 Australia 1,154 1,045 1,000 1,040 899 4.6% $1,901 Other 0 0 0 0 0 0.0% $0 WorldTotal 16,353 15,955 16,441 14,334 19,747 100.0% $51,975 Source: USDA/FAS
Volume Volume (Metric Tons)
Table45:U.S.Whey&LactoseExports
39 Importing Share Value Region/Country 2017 2018 2019 2020 2021 2021 2021 (Percent) $1,000 WHEY(HTS0404.10&3502.20) North America 92,471 87,590 89,442 74,434 82,642 13.5% $208,178 Mexico 49,204 53,680 59,029 38,877 43,322 7.1% $80,068 Canada 43,227 33,894 30,380 35,517 39,300 6.4% $127,982 Caribbean 1,766 2,334 2,359 2,147 1,517 0.2% $4,121 Central America 9,290 11,270 10,091 10,492 12,966 2.1% $18,146 South America 14,139 15,067 15,629 16,222 15,882 2.6% $53,110 European Union-27 7,367 8,516 8,423 8,903 6,056 1.0% $52,452 Other Europe 2,789 471 172 4,299 4,978 0.8% $23,645 Russia/Central Asia 206 261 351 42 228 0.0% $666 Middle East 991 889 1,109 1,354 1,311 0.2% $4,791 North Africa 2,122 7,341 3,077 3,050 3,839 0.6% $8,337 Subsaharan Africa 3,093 3,623 3,046 3,012 5,309 0.9% $12,315 South Asia 4,497 6,856 9,414 7,288 4,193 0.7% $21,539 Southeast Asia 86,018 110,050 113,793 121,697 124,941 20.3% $187,309 Vietnam 12,042 22,157 15,602 24,893 33,783 5.5% $38,658 Philippines 32,388 36,717 37,110 30,903 29,055 4.7% $37,389 Indonesia 14,460 18,201 24,460 30,368 28,112 4.6% $44,082 Thailand 10,611 11,529 13,243 13,232 15,138 2.5% $20,784 East Asia 294,408 267,363 154,779 270,468 326,002 53.1% $540,849 China 248,082 204,077 104,073 222,566 273,222 44.5% $349,880 Japan 26,394 33,612 25,611 26,816 26,927 4.4% $122,622 SouthKorea 11,290 15,888 16,339 14,644 19,836 3.2% $54,128 Oceania 28,534 24,040 35,977 33,066 24,143 3.9% $47,336 NewZealand 22,105 19,455 29,390 27,793 19,797 3.2% $24,606 Other 0 0 0 0 0 0.0% $0 World Total 547,785 546,711 447,754 556,490 614,005 100.0% $1,182,789 Importing Share Value Region/Country 2017 2018 2019 2020 2021 2021 2021 (Percent) $1,000 LACTOSE(HTS1702.11&1702.19) North America 47,747 52,963 60,936 43,895 41,182 10.6% $51,210 Mexico 42,708 43,346 51,126 36,733 35,871 9.2% $42,206 Caribbean 579 474 592 666 269 0.1% $348 Central America 749 793 529 994 491 0.1% $656 South America 17,725 15,078 18,146 18,513 19,898 5.1% $24,901 European Union-27 6,541 6,027 8,475 4,921 3,558 0.9% $9,278 Other Europe 243 193 122 136 92 0.0% $192 Russia/Central Asia 240 40 0 0 0 0.0% $0 Middle East 708 634 450 2,173 1,385 0.4% $2,736 North Africa 1,254 329 475 953 952 0.2% $1,550 Subsaharan Africa 6,423 5,315 6,541 4,147 7,225 1.9% $8,258 South Asia 25,820 22,542 23,041 22,716 13,317 3.4% $18,347 Southeast Asia 71,981 76,233 82,704 93,305 95,612 24.5% $116,494 Vietnam 15,382 17,745 14,073 17,901 24,726 6.3% $26,771 Indonesia 15,656 15,713 16,862 23,482 21,453 5.5% $27,977 Singapore 17,656 18,192 21,274 16,020 17,422 4.5% $21,210 Thailand 9,686 7,664 9,735 14,377 15,531 4.0% $19,631 Philippines 9,252 12,474 15,931 17,606 13,367 3.4% $17,106 East Asia 130,104 161,395 129,130 131,332 152,674 39.2% $177,384 China 67,869 95,412 66,674 68,044 86,992 22.3% $103,817 Japan 45,855 45,909 39,960 41,734 41,933 10.8% $46,357 SouthKorea 13,366 16,710 18,450 17,327 19,029 4.9% $21,104 Oceania 51,183 50,097 46,924 53,228 53,170 13.6% $64,834 NewZealand 31,644 40,033 41,421 45,963 45,845 11.8% $55,887 Other 0 0 0 0 0 0.0% $0 World Total 361,297 392,112 378,065 376,978 389,825 100.0% $476,187 Source: USDA/FAS
Volume (Metric Tons) Volume (Metric Tons)
Table46:CommercialExports&DomesticDisappearance, MilkEquivalent,TotalMilkSolidsBasis
Figure20:CommercialExports

40 Commercial Exports Domestic Disappearance Commercial Disappearance Year Total Per Capita /1 Total Per Capita /2 Total Per Capita /3 Export % (Million lbs) (Pounds) (Million lbs) (Pounds) (Million lbs) (Pounds) (Percent) 1985 571 2.4 127,100 533.0 127,671 535.4 0.4% 1986 648 2.7 130,205 541.1 130,854 543.7 0.5% 1987 2,520 10.4 131,601 542.0 134,121 552.4 1.9% 1988 3,910 16.0 135,379 552.5 139,289 568.5 2.8% 1989 3,870 15.6 137,654 556.5 141,524 572.2 2.7% 1990 1,290 5.2 141,579 566.0 142,869 571.2 0.9% 1991 2,010 7.9 141,634 558.7 143,644 566.7 1.4% 1992 2,370 9.2 144,283 561.6 146,653 570.9 1.6% 1993 3,090 11.9 143,898 552.9 146,988 564.8 2.1% 1994 2,780 10.6 148,234 562.7 151,014 573.2 1.8% 1995 4,545 17.1 149,427 560.6 153,972 577.6 3.0% 1996 4,910 18.2 150,544 558.3 155,454 576.5 3.2% 1997 4,898 17.9 150,569 551.7 155,467 569.7 3.2% 1998 4,768 17.3 153,452 555.8 158,219 573.0 3.0% 1999 4,904 17.6 156,467 560.2 161,371 577.8 3.0% 2000 6,545 23.2 159,607 565.7 166,152 588.9 3.9% 2001 7,569 26.6 158,965 557.8 166,534 584.4 4.5% 2002 6,782 23.6 160,950 559.6 167,732 583.2 4.0% 2003 6,946 23.9 163,859 564.8 170,805 588.8 4.1% 2004 10,905 37.2 164,944 563.3 175,849 600.6 6.2% 2005 13,388 45.3 170,022 575.3 183,410 620.6 7.3% 2006 16,638 55.8 170,384 571.0 187,023 626.8 8.9% 2007 17,753 58.9 172,334 572.1 190,087 631.0 9.3% 2008 20,225 66.5 173,797 571.5 194,022 638.0 10.4% 2009 16,219 52.9 176,113 574.1 192,332 627.0 8.4% 2010 23,872 77.2 172,634 558.1 196,506 635.3 12.1% 2011 25,640 82.3 174,408 559.8 200,049 642.1 12.8% 2012 26,006 82.9 177,945 567.0 203,951 649.9 12.8% 2013 30,726 97.2 175,010 553.8 205,736 651.1 14.9% 2014 31,130 97.8 177,869 558.8 208,998 656.6 14.9% 2015 28,827 89.9 184,288 574.8 213,115 664.7 13.5% 2016 29,917 92.6 187,802 581.5 217,719 674.2 13.7% 2017 31,276 96.2 187,492 576.9 218,768 673.2 14.3% 2018 34,236 104.8 188,722 577.7 222,958 682.5 15.4% 2019 31,634 96.4 192,153 585.4 223,787 681.8 14.1% 2020 35,598 107.4 191,353 577.2 226,951 684.6 15.7% 2021 38,669 116.5 192,822 581.0 231,491 697.5 16.7%
Source:USDA/EconomicResearchService,U.S.CensusBureau,andNMPF. 1/TotalexportsperU.S.resident. /2PercapitacomsumptionbyU.S.residentpopulation. 3/TotalcommercialdisappearanceperU.S.resident. 0 5,000 10,000 15,000 20,000 25,000 30,000 35,000 40,000 1985 1990 1995 2000 2005 2010 2015 2020 Million Pounds (me, tsb)
Table47:DairyImports,Quota&Non-Quota
Source:USDA/FAS;U.S.BureauoftheCensus;NMPF
1/TRQ: TariffRateQuota. "Outofquota"includesallcorrespondingquota-typeproductsenteringtheU.S.onanout-of-quotadutypaidbasis. 2/Includesnon-cow'smilkcheeses. 3/Allcheese,includingTRQandnon-TRQcheese. TotalswillnotaddbecauseinquotaTRQcheesevolumesaredeterminedbyCustomsandBorderProtectionusingdifferentdata. 4/Includesproductswhose compositionconsistsonlypartlyofdairycomponents.
41 Product TRQstatus1/ 2017 2018 2019 2020 2021 CheeseSubjecttoTRQ Cheddar Inquota 19,979 15,661 14,829 15,932 17,716 Out of quota 3,329 9,195 10,902 5,762 8,287 OtherAmerican-type Inquota 853 180 136 0 187 Out of quota 4 15 73 26 71 Italian In quota 22,362 20,875 21,156 20,822 13,601 Out of quota 4,813 17,279 20,784 17,934 26,103 Swiss/Emmentaler Inquota 51,810 48,851 47,085 39,465 41,519 Out of quota 49 394 1,262 2,523 698 Edam/Gouda Inquota 14,823 14,851 14,895 14,303 14,195 Out of quota 508 1,889 2,670 7,133 8,223 GruyereProcessed Inquota 6,058 6,646 6,991 5,683 7,212 Out of quota 49 325 613 435 716 Blue-Veined Inquota 6,358 6,202 6,155 3,748 5,569 Out of quota 335 1,611 1,565 2,567 1,142 Other Inquota 81,150 81,888 84,750 71,515 80,344 Out of quota 4,452 13,709 12,620 12,686 16,390 Total Inquota 203,393 195,155 195,997 169,794 180,342 Out of quota 13,539 44,416 50,490 49,067 61,631 Non-TRQCheese2/ Goya 13,682 3,337 21 344 37 Pecorino 21,748 21,017 20,678 10,225 13,752 Other 118,616 107,444 112,067 115,889 67,581 Total 154,046 131,798 132,766 126,459 81,370 AllCheese3/ 402,125 388,479 396,339 365,505 413,726 OtherDairy(TRQ) MilkandCream Inquota 2,241 2,241 5,887 2,237 2,241 Out of quota 13,458 16,085 16,827 18,798 17,470 EvapandCondMilk Inquota 11,791 11,878 12,058 11,704 12,231 Out of quota 61,238 67,678 49,192 44,239 31,588 Butter Inquota 15,075 15,230 15,148 14,867 15,028 Out of quota 17,465 59,723 63,505 66,028 84,663 ButterSubstitutes Inquota 13,117 12,364 13,365 12,555 8,780 Out of quota 266 835 1,578 2,810 685 NonfatDryMilk Inquota 811 794 294 203 175 Out of quota 714 630 214 2,455 304 IceCream Inquota 8,896 8,990 11,575 10,929 8,896 Out of quota 2,220 5,126 2,826 1,150 3,053 ChocolatePreparations4/ Inquota 35,621 32,655 38,226 37,373 37,797 Out of quota 41,038 3,393 8,852 5,245 33,976 OtherTRQProducts4/ Inquota 57,034 23,816 15,535 21,113 18,975 Out of quota 59,861 74,390 42,598 46,619 60,318 OtherDairy(Non-TRQ) CaseinandCaseinates 146,792 125,867 134,861 130,121 147,429 MilkProteinConcentrate 108,944 103,849 110,645 110,048 105,478 Whey 47,620 130,822 100,735 64,799 133,082 Lactose 8,569 5,961 7,605 7,060 7,382 ButterSubstitutes 695 664 870 705 331 ChocolatePreparations4/ 50,107 38,020 33,952 38,355 44,751 OtherFoodPreparations4/ 405,439 412,815 509,454 447,212 409,659
(ThousandPounds)
Table48:PriceIndices:AnnualAverage,NotSeasonallyAdjusted
Source: BureauofLaborStatistics. Averagehourlyearningsforprivateproduction and
42
Indices of
Prices Received Prices Paid Food & Dairy All Farm Livestock Dairy Production Wages, etc Year All Items Beverages Products Products & Products Products Items (PPITW) Feed 1950 24.1 25.4 29.0 258 340 249 246 256 210 1955 26.8 27.8 32.1 232 246 247 251 276 211 1960 29.6 30.0 35.4 239 296 259 265 300 194 1965 31.5 32.2 36.0 248 315 260 276 321 207 1970 38.8 40.1 44.7 280 405 350 314 390 216 1975 53.8 60.2 62.6 466 567 537 532 613 406 1980 82.4 86.7 90.9 624 878 798 822 978 479 1985 107.6 105.6 103.2 579 802 779 878 1,131 464 1990 130.7 132.1 126.5 660 1,088 837 958 1,310 501 1995 152.4 148.4 132.8 646 868 783 1,051 1,454 502 2000 172.2 167.8 160.7 611 955 757 1,117 1,588 497 2005 195.3 190.7 182.4 726 1,201 931 1,361 1,891 571 2010 218.1 219.6 199.2 850 1,256 1,000 1,825 2,434 879 2011 224.9 227.8 212.7 1,032 1,540 1,239 2,082 2,706 1,102 2012 229.6 233.7 217.2 1,083 1,633 1,140 2,193 2,824 1,270 2013 233.0 237.0 217.5 1,104 1,669 1,230 2,237 2,877 1,295 2014 236.7 242.5 225.3 1,113 2,049 1,475 2,376 3,031 1,266 2015 237.0 246.8 222.4 1,024 1,872 1,054 2,331 2,996 1,168 2016 240.0 247.6 217.3 931 1,530 1,003 2,179 2,863 1,118 2017 245.1 249.8 217.5 964 1,571 1,086 2,176 2,882 1,045 2018 251.1 253.4 216.5 934 1,497 1,001 2,215 2,966 1,113 2019 255.7 258.0 218.7 932 1,502 1,147 2,224 2,986 1,146 2020 258.8 266.6 228.3 928 1,407 1,116 2,201 2,983 1,170 2021 271.0 276.9 231.4 1,027 1,666 1,143 2,420 3,231 1,342
Consumer Price Indices
Prices Paid and Received by Farmers
Average Hourly Whole Year Earnings Milk Butter Cheese Ice Cream ($/hour) (1/2 Gal*) (1 Pound) (1/2 Gal) 1960 $2.09 14.1 21.5 19.7 24.9 1965 $2.63 10.8 17.1 17.1 18.1 1970 $3.40 10.1 15.3 17.8 14.9 1975 $4.73 10.1 13.0 19.4 15.5 1980 $6.84 9.3 16.5 19.6 16.3 1985 $8.73 7.8 14.5 17.4 15.8 1990 $10.19 8.3 11.7 n/a 15.3 1995 $11.65 7.5 8.2 17.3 13.6 2000 $14.02 11.9 10.8 16.4 14.8 2005 $16.12 11.9 12.2 16.3 13.9 2010 $19.06 10.3 9.9 14.8 14.1 2011 $19.44 11.0 11.1 16.7 15.2 2012 $19.73 10.6 9.8 17.1 15.3 2013 $20.14 10.3 9.7 16.6 14.9 2014 $20.60 10.7 10.9 16.1 14.2 2015 $21.03 9.8 11.0 15.3 13.5 2016 $21.55 8.9 10.9 14.6 13.3 2017 $22.05 8.8 11.0 13.3 12.8 2018 $22.70 7.7 10.8 13.6 12.5 2019 $23.51 7.7 10.2 13.5 12.3 2020 $24.68 8.1 8.8 13.4 12.0 2021 $25.90 8.2 8.3 12.6 11.3
Source:BureauofLaborStatisticsandUSDA/NASS, Agricultural Prices
nonsupervisoryworkers. *Pergallonbeginning1996.
(1982-1984
(1910-1914
100)
Minutes Worked to Earn Money to Purchase
= 100)
=
Table49:MinutesofWorkRequiredto PurchaseSelectedDairyProducts
Table50:CommodityReceiptsfromMarketings
Source: USDA/ERS:AgriculturalOutlook Tables,CashReceiptsdata
Table51:Nation'sTopDairyCooperatives,2021
43 Commodity 1990 2000 2010 2020 2021 Livestock Products Cattle&Calves 39.2 40.8 51.2 63.1 72.9 DairyProducts 20.2 20.6 31.4 40.4 41.8 Hogs 11.5 11.8 17.9 19.2 28.0 PoultryandEggs 15.3 21.9 34.7 35.1 46.1 Sheep/OtherLivestock 3.0 4.6 5.1 6.7 7.0 Total Livestock: 89.1 99.6 140.3 164.4 195.8 Crops FeedCrops 18.7 20.5 55.1 57.7 82.8 OilCrops 12.3 13.5 36.5 43.8 52.1 Vegetables 11.3 15.8 17.4 19.4 17.9 FoodGrains 7.5 6.5 14.3 11.8 15.3 FruitsandNuts 9.4 12.3 21.6 27.9 30.2 Cotton 5.5 2.9 7.5 6.8 7.7 Tobacco 2.7 2.3 1.2 0.8 0.9 OtherCrops 12.9 18.6 24.4 30.8 33.1 Total Crops: 80.2 92.5 178.2 199.1 240.0 Commodity Receipts: 169.3 192.1 318.4 363.5 435.8 Direct Government Payments: 9.3 23.2 12.4 45.6 25.9 TOTAL RECEIPTS 178.6 215.3 330.8 409.0 461.7
Milk Volume Member Rank Dairy Cooperative Headquarters (Billion lbs) farms 1 DairyFarmersofAmericaInc.* KansasCity,KS 57.1 6,336 2 CaliforniaDairiesInc.* Visalia,CA 17.1 332 3 EdgeDairyFarmerCooperative GreenBay,WI 14.6 875 4 LandO'LakesInc.* St.Paul,MN 12.8 1,565 5 SelectMilk ProducersInc. Artesia,NM 8.8 113 6 NorthwestDairyAssociation* Seattle,WA 8.6 322 7 FarmFirstDairyCooperative* Madison,WI 7.7 2,930 8 ForemostFarmsUSA* Baraboo,WI 6.5 980 9 AssociatedMilk ProducersInc.* NewUlm,MN 4.9 1,300 10 MichiganMilk ProducersAssociation* Novi,MI 4.7 714 11 UnitedDairymenofArizona* Tempe,AZ 4.1 38 12 Agri-Mark Inc.* Andover,MA 3.3 702 13 PrairieFarmsDairyInc.* Carlinville,IL 2.8 776 14 LoneStarMilk Producers* WichitaFalls,TX 2.6 118 15 FirstDistrictAssociation* Litchfield,MN 2.6 645 16 UpstateNiagaraCooperativeInc.* Buffalo,NY 2.5 280 17 Maryland&VirginiaMilk ProducersCoop.Assn.* Reston,VA 2.3 920 18 NationalFarmersOrganizationInc. Ames,IA 1.8 1,548 19 SoutheastMilk Inc.* Belleview,FL 1.6 114 20 OrganicValley/CROPP LaFarge,WI 1.6 1,796 21 Tillamook CountyCreameryAssociation* Tillamook,OR 1.4 75 22 CayugaMarketingLLC* Auburn,NY 1.4 32 23 Bongards’Creameries* Bongards,MN 1.3 195 24 LegacyMilk CooperativeInc. Turlock,Calif. 1.0 17 25 MagicValleyQualityMilk ProducersInc. Jerome,Idaho 1.0 26
Source:Usedbypermissionfrom Hoard's Dairyman. *NMPFmembercooperative.
(Billion Dollars)
Supplies,andServicesbyCooperatives,SelectedYears
Table52:Number&NetVolumeofProducts, 2019
Source: USDA/RuralBusiness-CooperativeService, Farmer Cooperative Statistics
"Other"includestotalcooperativeshandlingbeans&peas,nuts,tobacco,woolandothermisc. Numberofcooperativesmaynotaddduetooverlap. Mostrecentpublicationofthesestatisticsisfor2019.
44 1985 1995 2005 Coops Net Coops Net Coops Net Coops Net Item Handling Volume Handling Volume Handling Volume Handling Volume (Number) (Million$) (Number) (Million$) (Number) (Million$) (Number) (Million$) ProductsMarketed: Cotton 459 1,647 16 2,799 14 3,411 14 2,541 Dairy 394 15,365 241 21,784 193 28,163 95 42,396 Fruits&Vegetables 370 5,058 283 9,272 188 7,256 111 6,721 Grain&OilseedProducts 2,139 15,291 1,104 19,864 683 22,977 367 48,444 Livestock&Poultry 432 4,305 109 8,065 73 3,437 80 4,777 Rice 58 751 19 900 15 856 12 1,713 Sugar 44 1,505 51 1,869 47 3,357 18 4,875 Other 348 1,196 262 4,796 199 4,693 234 8,030 Total Farm Products 3,925 46,037 2,085 69,349 1,412 74,150 931 119,497 SuppliesSold: CropProtectants 3,204 1,451 n/a 2,628 n/a 2,952 n/a 5,599 Feed 3,099 3,121 n/a 5,017 n/a 5,381 n/a 9,932 Fertilizer 3,237 3,342 n/a 4,692 n/a 5,370 n/a 10,714 Petroleum 2,579 5,800 n/a 5,211 n/a 9,799 n/a 18,905 Seed 3,120 510 n/a 583 n/a 1,252 n/a 3,443 OtherSupplies 7,952 2,417 n/a 3,083 n/a 3,672 n/a 4,627 Total Farm Supplies 4,228 16,641 1,447 21,213 1,128 28,426 759 53,220 ServicesProvided: Trucking,CottonGinning Storage,Grinding,Locker Plants,Miscellaneous TotalFarmServices 3,883 1,613 474 3,284 356 3,929 89 7,090 Total Business 5,625 64,291 4,006 93,847 2,896 106,506 1,779 179,807
Table53: InternationalMilk ProductionStatistics,2021
45 Cow Production Cows Milk Other Milk Total Milk Share Country Numbers Per Cow Production Production 1/ Production of Total (1,000 Head) (Pounds) (Million lbs) (Million lbs) (Million lbs) (Percent) North America Canada 980 22,849 22,392 22,392 1.1% Mexico 6,600 4,292 28,329 379 28,709 1.4% UnitedStates 9,448 23,948 226,258 226,258 10.7% South America Argentina 1,562 16,796 26,235 26,235 1.2% Brazil 16,646 3,291 54,774 6,570 61,344 2.9% Europe EuropeanUnion 20,514 15,565 319,302 9,138 328,440 15.5% UnitedKingdom 1,856 18,326 34,013 Former Soviet Union Belarus 1,480 11,664 17,262 66 17,328 0.8% Russia 6,495 10,869 70,592 70,592 3.3% Ukraine 1,722 11,266 19,401 441 19,842 0.9% East Asia China 6,200 13,096 81,196 2,469 83,665 4.0% Japan 726 22,821 16,568 16,568 0.8% SouthKorea 204 21,938 4,475 4,475 0.2% Taiwan 65 15,263 992 26 1,019 0.0% South Asia India 58,000 3,649 211,644 227,076 438,720 20.7% Southeast Asia Philippines 11 3,207 35 22 57 0.0% Oceania Australia 1,365 14,644 19,989 19,989 0.9% NewZealand 4,904 9,888 48,491 48,491 2.3% Total of Above 138,778 8,661 1,201,949 246,188 1,414,124 66.8% Total, All Countries 289,369 5,968 1,726,954 389,197 2,116,151 100.0%
Source: USDA/FASandUN/FAO.
1/Othermilk productionincludes buffalo,camels,goats andsheeps milk.
GLOSSARY
American Cheese:
Principally cheddar cheese but includes other varieties such as Colby or Jack. The term does not include Swiss, Muenster, Blue, Italian cheese varieties, and other distinctive types.
Commercial Disappearance:
Commercial consumption calculated as production plus imports less the net change in stocks and non-commercial use. Domestic commercial disappearance is total commercial disappearance less commercial exports. May include farm use, waste, shrinkage, some inventory variation, and products used for other than human consumption.
Milk Equivalent:
The amount of farm milk represented by a quantity of dairy products. Most often used to aggregate stocks, trade, or removals of various dairy products on a common component basis, such as milkfat, skim solids, or total milk solids.
Milk Sold to Plants and Dealers:
A term long used by USDA to mean milk production less that portion utilized on the farm or marketed directly by farmers to consumers.
DMC (Dairy Margin Coverage program) Margin:
As defined in the 2018 Farm Bill, the income over feed cost margin is equal to the national monthly all-milk price (reported monthly by USDA NASS) minus average feed costs, computed from a formula using national benchmark prices of corn, soybean meal, and alfalfa hay. Formerly the MPP (Margin Protection Program for Dairy) Margin.
DMC (Dairy Margin Coverage program) Feed Cost:
As defined in the 2018 Farm Bill, the feed cost to be used in calculating premiums is the national average feed cost. It includes the U.S. average corn price/bushel, Central Illinois soybean meal price/ton, and price of alfalfa hay price/ton. Formerly the MPP (Margin Protection Program for Dairy) Feed Cost.
National Average Cost of Feed Calculation:
=1.0729 X U.S. average corn price/bushel
+0.00735 X Central Illinois soybean meal price/ton
+0.0137 X Average of U.S. average alfalfa hay price/ton and 5-state average of premium and supreme alfalfa hay (scheduled for recalculation, from January 2020, as 100% of the 5-state dairy quality alfalfa hay price).
46
COMMON CONVERSION FACTORS
Measures of Milk:
1 gallon = 8.62 pounds
1 quart = 2.15 pounds
1 pint = 1.08 pounds
1 liter = 2.28 pounds
Metric System:
1 kilogram = 2.2046 pounds
1 pound = 0.4536 kilogram
1 gram = 0.03527 ounce
1 ounce = 28.35 grams
1 metric ton = 2,204.6 lbs
Feed Grains:
100 lbs. = 11.6 gallons
100 lbs. = 46.4 quarts
100 lbs. = 92.8 pints
100 lbs. = 43.9 liters
1 liter = 1.057 quarts
1 quart = 0.9464 liter
1 liter = 2.113 pints
1 pint = 0.4732 liter
1 liter = 0.2642 gallons
1 gallon = 3.785 liters
Weight
Volume
Lbs./ Unit/ Commodity Unit unit MT__ Wheat bushel 60 36.744 Soybeans bushel 60 36.744 Corn bushel 56 39.368 Sorghum bushel 56 39.368 Flaxseed bushel 56 39.368 Rye bushel 56 39.368 Barley bushel 48 45.930 Oats bushel 32 68.894 Rice cwt. 100 22.046 47
