2 minute read
Aviation Class B/C Mishaps


Aviation Class B/C Mishaps Top 5 Discrepancies
MAINTENANCE TRENDS FROM FY12 CLASS B/C MISHAPS
Advertisement
There were 44 Class B/C mishaps where maintenance was an accepted causal factor. While this doesn’t go into the specifics of each event, some broad generalizations are included in areas with multiple occurrences.
MAINTAINER SLIPPING/FALLING (4)
1 Class B (Permanent Partial Disability) 3 Class C (1 confirmed injury & 2 pending)
LOW POWER/HIGH POWER TURN UPS (11)
2 Class B ($1.6 million with 1 pending) 9 Class C ($1.02 million with 2 pending)
Common factors: FOD, flight controls impacting engine doors, failing to follow turn checklist, lack of QA/FDC for turn operations, lack of a turn brief, complacency.
FAILURE TO FOLLOW PUBS/SUPERVISION (23)
4 Class B ($3.2 million and 2 Permanent Partial Disability) 19 Class C ($3.48 million with 2 pending)
Common factors: performing maintenance on loaded weapons, improper completion of special/ conditional inspections, lack of QA/CDI/SUP involvement/ supervision, not heeding NOTES / CAUTIONS / WARNINGS, lack of knowledge/experience, panels blown overboard, improper daily/pre-flight inspections, poor communication/pass down, complacency.
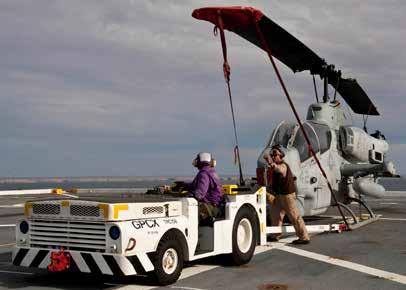
TOWING EVOLUTIONS (5)
1 Class B ($1.14 million) 4 Class C ($287,000 with 1 pending)
Common factors: lack of tow brief, towing without a full move crew, rushing to get the job done, failing to ensure proper clearance around obstacles.
TOOL CONTROL (1) 1 Class C ($240,000)
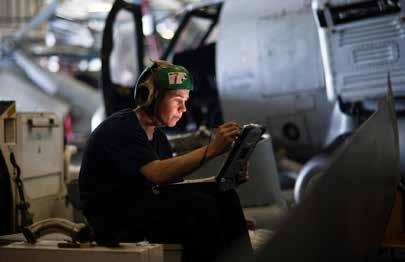
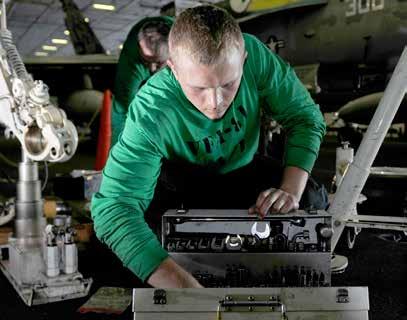
Navy photo by MC3 Ian Carver Navy photo by MC3 Will Tyndall
Navy photo by MCSA Andrew Haller
Navy photo by MC3 Carla Ocampo
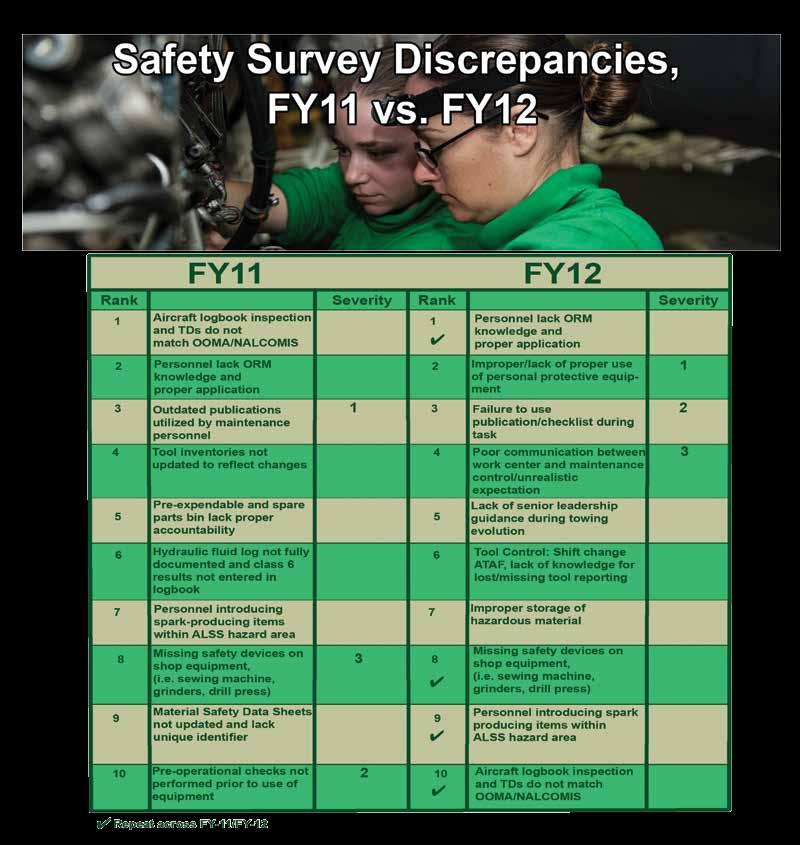
The chart above compares the top ten discrepancies in terms of how frequently they were found during maintenance safety surveys during the past two fiscal years.
The “Severity” 1-2-3 rank is based on the subjective analysis of our maintenance experts, identifying the items that pose the greatest risk (as opposed to the frequency of a particular discrepancy).
Six new items (#2-#7) appeared on the FY12 list because we revised the survey checklist to include identifiable safety risks as well as program-related procedures, and also added more ORM across all work centers. This improvement to our process helps explain why #1 in FY11 moved to #10 in FY12. Also, in FY11 most commands had short-term issues with loading their initial data in a new part of the aviation-maintenance database program.


