3 minute read
a. Selection of Schools


2. Panel Difference-in-Differences
a. Concept Difference-in-Differences
The difference-in-differences (DiD) model allows us to estimate the “Bridge effect” – the change in pupil EGRA/EGMA performance as a direct result of attending Bridge – without having conducted a randomised experiment.
A DiD model isolates treatment effects by comparing the difference in outcome measures at two points in time for the treatment and control groups against one another. In other words, a DiD model takes the outcome measure at the first point in time for each group and subtracts it from the outcome measure at the second point in time for the same group. It then compares the within-group difference across the two groups to parse out the effect of the treatment. Average treatment effects are calculated as follows:
treatment effect = (Tt2 – Tt1) – (Ct2 – Ct1)
Tt2 = treatment group outcome at second point in time; Tt1 = treatment group outcome at first point in time; Ct2 = control group outcome at second point in time; and Ct1 = control group outcome at first point in time.
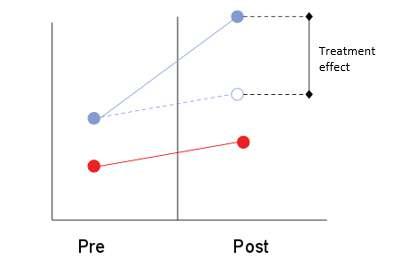
The estimation of treatment effects using a DiD model also can be depicted graphically, as shown in Figure 1 below. The red points are the control and the blue are the treatment:
Figure 1. Estimating Treatment Effects Using DiD Approach
DiD models ensure that any unobserved variables that remain constant over time and that are associated with the outcome will not bias our estimation of treatment effects. However, it is important to note that in doing so, the model assumes that these unobserved variables would affect both the treatment and control groups equally. In other words, it assumes that if the treatment group had not received the treatment at all, its outcome would be the same as the outcome for the control group.18 By construction, all DiD models require data for at least two points in time. Without it, we cannot calculate the within-group difference, which relies on data captured at the first and second points in time. There are two major types of data that can serve this function: (1) repeated cross-sectional data and (2) panel data. For the analyses presented in this report, we chose to implement the one which draws upon panel data. A description of each of our selected model variations is described below.
We can estimate treatment effects using a DiD model via either a simple difference of within-group differences or a regression framework. As compared to calculating the simple difference in within-group differences, a regression framework provides us with the added benefit of including extra explanatory (control) variables in our model. Without control variables added into the framework, the estimation of treatment effects using either method is the same.

Panel Difference-in-Differences
In a repeated cross-sectional DiD estimation, individuals do not need to be tested at both time periods. In a panel DiD model, however, we incorporate data at two time points from the exact same individuals. This type of model naturally excludes pupils who attrited from our sample as well as those who had not been tested previously. Therefore, the overall number of pupils included in our panel DiD model is smaller than the number of pupils originally tested in 2013.
There are multiple benefits to using a panel DiD approach for estimating treatment effects. A panel DiD model is both more straightforward to construct and more statistically powerful than a repeated crosssectional DiD model.19
18 Buckley, Jack & Yi Shang (2003). “Estimating policy and program effects with observational data: the ‘differences-in-differences’ estimator.” Practical Assessment, Research & Evaluation, 8(24). Retrieved from http://PAREonline.net/getvn.asp?v=8&n=24. 19 Buckley, J. & Shang, Y. (2003)

