13 minute read
2.2 Operations and Challenges in Year 1


5.2 Student Characteristics at Baselines
5.2.1 Demographics and Home Life
We compared student background data collected during baselines across school types in order to uncover any fundamental differences between the population of Bridge PSL public school students and the population of traditional public school students. See Appendix A3.2 Baseline Student Characteristics for a detailed description of each of the demographic variables.
Table 7 below shows the average values of each student background characteristic from the sample of students present at both baselines and endlines, 25 across grades. Differences between the student sample at Bridge PSL public schools and the traditional public schools are indicated through t-tests.26
25 This table is replicated for the full sample of baseline students (regardless of whether or not they were assessed during endlines), and the results are essentially the same. See Appendix A3.2 Baseline Student Characteristics. 26 Note that corrections for multiple hypothesis testing have been left out, as such corrections would only adjust to make statistical significance less likely.
Table 7. Student Characteristics at Baselines
Bridge PSL Public Schools
Count 275
Demographics
Mean Age 10.78 % Female 47%
Grade Level Breakdown
Kindergarten 19% Grade 1 25% Grade 2 29% Grade 3 27%
Education History
Attended School Last Year 92% % Attended Any ECE 98% Years of ECE 2.46 % Attended Beginner 84% % Attended Nursery 77% % Attended Kindergarten 87%
Meals
% With No Meals 1% Average # of Meals 2.24 % Who Had Breakfast 67% % Who Had Lunch 95% % Who Had Dinner 63%
Assets
% Has Radio 66% % Has Television 25% % Has Electricity 25% % Has Cellphone 85%
Language Exposure
% Speaks English at Home 65% % Listens to Radio 55% % Watches TV 46%
Parent Involvement
% Receive Homework Help 64% If Give Help, % by Parent 20% % Reads Out Loud with Parent 40% % Are Read To 49% If Read To, % by Parent 14% If Listens to Radio, % with Parent 40%
If Watches TV, % with Parent 19%
Traditional Public Schools
321
11.33 46%
28% 29% 21% 22%
93% 100% 2.73 88% 88% 96%
1% 2.20 59% 94% 67%
69% 29% 27% 87%
70% 58% 53%
76% 18% 45% 54% 17% 46% 25%
** p<0.01, * p<0.05, + p<0.1
Difference
-0.55* 1%
-9%* -4% 8%* 5%
-1% -2%+ -0.27** -4% -11%** -9%**
0% 0.04 8%+ 1% -4%
-3% -4% -2% -2%
-5% -3% -7%+
-12%** 2% -5% -5% -3% -6% -6%
Statistically significant differences occur for five demographic variables: Age, Years of ECE, Attendance of Nursery Class, Attendance of Kindergarten, and Homework Help.
The average Bridge PSL public school student is about 0.5 years younger than the average traditional public school student and has fewer years of ECE. This age difference likely stems from the Bridge approach to
student placement in Year 1, which encouraged a balance of both age-appropriateness and academic readiness, resulting in over-age students being placed into higher primary grade levels.
Homework help also differs between school types. The percentage of students receiving help on their homework is larger at traditional public schools than at Bridge PSL public schools.
Note that the smaller percentage of kindergarteners in Bridge PSL public schools than in traditional public schools results from the fact that two of the Bridge PSL public schools included in the study did not have Kindergarten classes at the beginning of the year.
27
5.2.2 Incoming Literacy & Numeracy
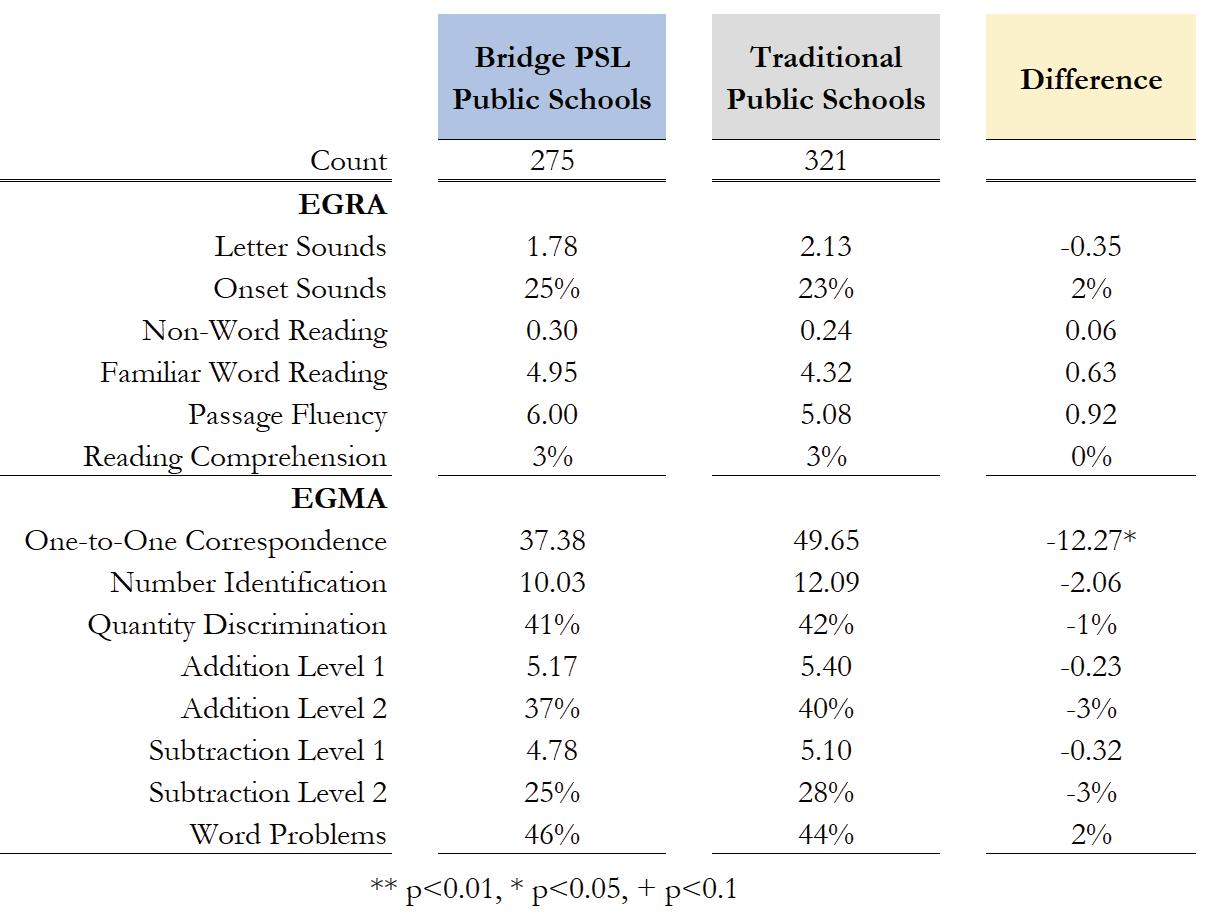
The baseline EGRA and EGMA scores themselves serve as the best indicators of comparability of the students attending Bridge PSL public schools versus traditional public schools. Table 8 below presents the average performance on each subtask by school type, and includes the statistical significance of the differences.28 This table includes all students with both baseline and endline scores.29
As the table shows, there are no statistically significant differences on EGRA subtasks. The only EGMA subtask with such a difference is One-to-One Correspondence, on which Bridge PSL public school students averaged 12 fewer correctly counted circles. In addition, this subtask was only administered to Kindergarteners.
Table 8. Baseline EGRA/EGMA Scores
27 Note that school selection for the study occurred prior to and independently of each school’s decision on which grades to offer. 28 Once again, we did not correct for multiple hypothesis testing, as this would only make statistical significance less likely. 29 See Appendix A13. Baseline EGRA/EGMA Results for a table including all students at baseline. The results are essentially the same.
6. Improvements in Academic Achievement
6.1 Overview of Literacy and Numeracy Measurements
The study team chose the EGRA/EGMA instrument as our tool to measure student learning. The subtasks used and the method of calculating a student’s score on each subtask are detailed below.
Table 9. Understanding EGRA Subtasks30
Subtask The subtask shows... ...which measures... ...which is an important building block towards literacy because...
Onset Sounds
Letter Sounds
Non-Word Reading
Familiar Word Reading
Passage Fluency
Reading Comprehension
Words arranged in random order (read out loud to the student by the assessor) A student’s ability to identify the initial sounds of each word It tests phonemic awareness, or “the understanding that speech is comprised of individual sounds.
”31 This is fundamental for later linking sounds to letters and then words.
Upper and lower case letters, arranged in random order A student’s knowledge of individual sounds associated with each letter It is a prerequisite for being able to combine the sounds of multiple letters into words.
A set of made-up words, which are words that follow the basic rules of the language of assessment but have no meaning A student’s ability to decode (“sound out”) unfamiliar words To be proficient readers, children must learn to both recognize sight words (common words that children are encouraged to memorize) and to decode unfamiliar words by linking sounds of the letters together. Reading from a list of non-words tests the latter without the possibility of sight word recognition.
A set of familiar, grade-level words selected from early grade reading texts A student’s ability to decode unfamiliar words as well as her/his recognition of sight words The ability to recognize and decode individual words is a prerequisite for linking the words together to read an entire passage of text fluently.
A short passage of grade-level text A student’s ability to read age appropriate text aloud accurately, at sufficient speed Reading with sufficient speed and accuracy is a necessary precursor for reading comprehension. Students must link words together fast enough for their working memories to be able to retain the information conveyed by the text. When students are not yet reading with automaticity, their brains must focus on decoding words, which takes more time and results in slower reading. Once students are able to read with sufficient speed and accuracy, their brains can focus on deriving meaning from the content of the reading.
Five questions about the text read in the Passage Fluency subtest A student's ability to understand and communicate the meaning of text Reading comprehension is a prerequisite for children to use reading as a tool to receive information. It is a necessary precursor for later academic and vocational success.
30 This table draws on material in Gove and Wetterberg (2011). 31 Yopp, H.K. (1992).
Table 10. Understanding EGMA Subtasks
Subtask The subtask shows... ...which measures... ...which is an important building block towards numeracy because...
One to One Correspondence
Number Identification
Quantity Discrimination
Ten rows of ten circles A student’s ability to 1) recognize the items they need to count and 2) recognize and mentally flag the items that have already been counted Counting strategies are an essential precursor to further and deeper mathematical knowledge and skills.
A set of numbers increasing in complexity from single digit to triple digit A student’s ability to identify the numberwords associated with each written number with sufficient speed Clear communication about numbers is essential for math learning. Understanding the number words contributes to place value awareness, which is a critical component of successful computation.
Ten pairs of numbers increasing in complexity from single to triple digit A student’s ability to judge which number is larger Quantity discrimination demonstrates a critical link to an effective and efficient counting strategy for problem solving.32
Addition 1 A set of 20 addition problems that increase in complexity to require carrying and involving two digit numbers
Subtraction 1 A set of 20 subtraction problems that increase in complexity to require borrowing and involving two digit numbers A student’s ability to solve simple addition problems with sufficient speed
A student’s ability to solve simple subtraction problems with sufficient speed Addition I and Subtraction I reveal a student's fact fluency - how quickly and accurately they can recall basic facts. Performing well on fact fluency shows that the student has the building blocks to tackle increasingly complex computations.
Addition 2 A set of five addition problems that increase in complexity from adding a single and a double digit number together to adding two double digit numbers together A student’s ability to solve more complex addition problems
Subtraction 2 A set of five subtraction problems that increase in complexity from subtracting a single digit number from a double digit number to subtracting a double digit number from another double digit number A student’s ability to solve more complex subtraction problems Addition II and Subtraction II reveal a student’s understanding of the computation algorithm - if they can align face values and carry or borrow correctly. The understanding of computation and integration of methods, and practice with both, leads to “computational fluency.”33
Word Problems Five word problems involving basic addition and subtraction (read out loud to the student by the assessor) A student’s ability to select operations, and their ability to accurately solve the problem using the operation they selected. The ability to correctly select an operation for a real world situation demonstrates a basic understanding of the meaning of the operation. This understanding is essential for more complicated applications as well as for basic algebraic thinking.
32 Clarke et al. (2008) 33 Fuson, K.C. (2004)
Table 11. Scoring Equations for Each Subtask Administered34

6.2 Differential Learning Gains for Year 1
6.2.1 Concept
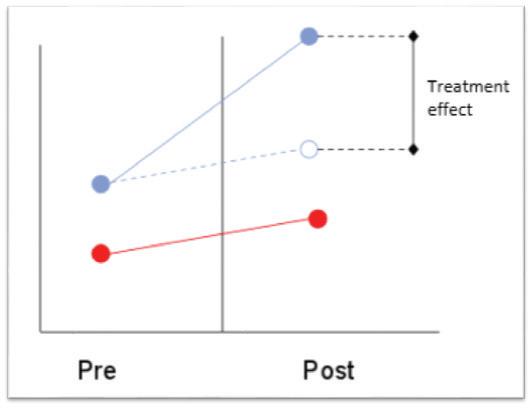
The difference-in-differences (DiD) methodology allows us to estimate the “Bridge PSL effect” – the change in student academic performance as a direct result of attending a PSL public school operated by Bridge – without requiring a randomized experiment.35
DiD isolates treatment effects by comparing the difference in outcome measures at two points in time for the treatment (Bridge PSL public schools) and control (traditional public schools) groups, as shown in Figure 1 below.
Figure 1. Difference in Difference Estimation
34 Timed subtasks allot 60 seconds each. 35 Again, note that when we say “Bridge PSL effect,” it is not intended to imply that this is an impact evaluation.
DiD essentially ensures that any unobserved variables that remain constant over time and that are associated with the outcome will not bias our estimation of the treatment effect. However, it is important to note a few assumptions we are making to employ this methodology. First, the model assumes that the unobserved constant variables would affect both the treatment and control groups equally. Second, it also assumes that there are no unobserved time-varying variables that differentially affect treatment and control schools.36 Third, it assumes that both groups are following the same growth trajectory across time. In other words, it assumes that if the treatment group had not received the treatment at all, its average change from baselines would be the same as the average change of the control group.37
6.2.2 Application of Concept
We can estimate treatment effects using a DiD model via either a simple difference of within-group differences or a regression framework. In its simplest form, the average Bridge PSL treatment effect can be calculated by taking the difference in gains achieved by the two groups of students, as shown in Figure 2 below.

We can take the DiD methodology a step further by applying a regression framework, which provides us with the added benefit of including extra explanatory (control) variables in our model.38 By taking into account other factors that may have an impact on learning outcomes, the analysis becomes more rigorous than the simplest application of DiD because it better isolates the treatment effect.39
As both applications of the model offer valuable insights, we adopt the following specifications to examine the Bridge PSL effect:
1. Simple DiD. This tells us the overall difference in gains between the two groups, without examining how or how much various factors contribute to this difference. 2. Regression DiD, controlling baseline scores. This tells us the contribution of Bridge to increases in endline test scores, by separating out the effect of the incoming skill level of the child. 3. Regression DiD, controlling for baseline assessment scores and student characteristics. This is the same as #2, but considers even more factors that may contribute to differences in endline test scores.
Each specification is executed using both raw and standardized scores. Standardizing scores allows us to interpret the results in terms of effect sizes and compare results across subtasks.40 We also pool the data
36 For instance, our model cannot control for circumstances such as neighborhoods with treatment schools gaining access to electricity more quickly than neighborhoods with control schools, which could potentially bias our results. However, because of our set of baseline, midline and endline demographic variables, we will be able to test whether observed characteristics differentially change in treatment and control neighborhoods, which should provide some indication about the size of any potential bias. 37 Buckley et al. (2003). 38 Without control variables added into the framework, the estimation of treatment effects using either method is the same. 39 Buckley et al. (2003). 40 Details of how we standardized each score can be found in Appendix A14. Standardization of Scores. for each subtask across grades, which allows us to estimate the overall effect of Bridge PSL while also increasing statistical power in our analyses.
6.2.3 Simple DiD Results
Bridge PSL Public Schools had positive differential gains in every subtask assessed. Table 12 and Table 13 show summary statistics for students in the baselines and endlines sample as well as the simple DiD results.

Bridge PSL Public School Traditional Public School
Baseline Endline
Baseline Endline Subtask Grades Mean Mean Diff Mean Mean Diff
Letter Sounds KG-G2 198 0.0 3.6 3.6 247 0.0 0.5 0.5 3.13 Onset Sounds KG-G2 198 0.1 1.0 0.9 247 0.0 0.6 0.7 0.23 Non-Word Reading KG-G3 275 0.0 2.1 2.1 319 0.0 0.7 0.7 1.42
Familiar Word Reading KG-G3 270 0.0 2.1 2.1 319 -0.1 0.7 0.8 1.34 Passage Fluency G1-G3 222 0.1 2.8 2.8 229 0.0 1.1 1.2 1.58
Reading Comprehension G1-G3 222 0.1 2.2 2.1 230 0.0 0.9 0.9 1.24 One to One Correspondence KG 53 -0.2 0.3 0.5 90 0.2 0.3 0.1 0.41 Number Identification KG-G1 122 0.0 0.6 0.6 183 0.1 0.4 0.3 0.27
Quantity Discrimination KG-G2 198 0.1 1.0 1.0 247 0.1 0.7 0.7 0.32 Addition 1 KG-G3 275 0.0 1.5 1.5 318 0.1 0.7 0.7 0.82 Addition 2 G2-G3 152 0.0 0.7 0.7 136 0.1 0.5 0.4 0.34 Subtraction 1 G1-G3 222 0.0 1.0 1.0 227 0.1 0.7 0.6 0.39 Subtraction 2 G2-G3 152 0.0 0.7 0.7 135 0.1 0.5 0.4 0.28 Word Problems G1-G3 222 0.0 0.5 0.5 228 0.0 0.3 0.3 0.17


