MONTHLY RESEARCH UPDATE
MAY 2024 REVIEW


• 950,740 passengers traveled through John Wayne Airport in May 2024, which was an 8.7% Year-over-Year (YoY) decrease compared to the same month last year.
• Total Year-To-Date (YTD) passenger traffic is pacing 3.8% below May 2023 YTD.
• However, Newport Beach hotels showed mostly positive results compared to the same month last year.
• ADR increased a healthy 4.6%, which helped lift RevPAR 2.1%.
• Strong growth in Demand (+7.7%) coupled with this ADR growth drove Revenue 12.7% higher than May 2023.
• However, Occupancy declined 2.4% YoY, primarily due to a 10.3% increase in Supply.
• Newport Beach’s short term rentals also saw positive results in May 2024 compared to the same time last year.
• Occupancy grew 5.3% to 39%.
• ADR rose 3.1% to $478.
• RevPAR increased 8.5% to $186.
Source: John Wayne Airport, STR, and


• “The Dow Jones Industrial Average (DJIA) increased in May, adding 870.4 points, or 2.3%, to finish the month at 38,686.32 points. Wall Street was a bit of a wild ride in May following the sharp declines in April, with gains on 14 trading days and losses on eight.”
• “One highlight in May was the setting of an all-time high, as the DJIA closed above 40,000 points for the first time ever on May 17th.”
• “Investors were feeling good about mid-month inflation data, which suggested the Federal Reserve Bank may start to back down on interest rates sooner than expected, but subsequent data and Fed commentary reversed that optimism quickly, and markets pulled back swiftly.”
• “But while Wall Street has looked volatile in the last 60 days, financial markets remain strong, and investors are seeing good growth in retirement and savings accounts, with the DJIA currently up a walloping 17.6% compared to this time last year.”
THE CONSUMER CONFIDENCE AND CONSUMER SENTIMENT
• “The Consumer Confidence Index (CCI) and the Consumer Sentiment Index (CSI) went in separate directions in May, with the CCI gaining and CSI declining. The Conference Board’s CCI increased 4.6%, or 4.5 points, from 97.5 in April to 102.0 points in May.”
• “It’s the first gain in the index since January, as lingering inflation has kept consumers concerned.”
• “Despite the gain, the CCI is still hovering within a very narrow band that it’s occupied for most of the past two years and is slightly down from its two-year average of 104.2.”
• “The University of Michigan’s CSI declined in May, losing a notable 8.1 points to settle at 69.1 points. This is the lowest the CSI has been since November last year and reflects concern about labor markets – specifically that unemployment rates are expected to go up and income growth to slow.”
• “Ironically, that’s actually very close to what the Fed is hoping to accomplish with higher interest rates, and this is a great example of the balancing act the Fed must juggle to ensure confidence and sentiment don’t falter too much while they work to control inflation.”
• “The National Unemployment Rate nudged upwards for the second consecutive month, climbing from 3.9 to 4.0 percent in May, its highest level since January 2022, as employers added a surprising 272,000 jobs to the marketplace.”
• “Somewhat alarmingly job creation far exceeded the consensus forecast of 180,000 and was considerably higher than the 232,000 average for the year.”
• “This suggests that the job market is still too hot for the Fed to start easing interest rates any time soon.”
• “But perhaps most alarming for the Fed is wages, which rose 4.1% from last year. And while that’s a good sign for consumers, it means the economy has room to keep prices higher, prolonging consumer pain at the register.”
• “On a more industry-specific note, the Leisure and Hospitality sector added a very strong 42,000 jobs last month, surpassing the 12-month average of 35,000, and 17,000 of those jobs were in the Accommodations sub-sector, helping lodging suppliers edge towards practical occupancy.”
• “Overall, this is a mixed report for the travel industry, with higher wages and strong job growth good for cash flow, but likely forcing the Fed to further delay interest rate cuts, which suppresses spending on credit.”
Source: DestiMetrics
• “The National Inflation Rate declined for the second consecutive month in May. In what is perhaps the most consequential CPI report this year, inflation dropped from 3.4% in April to 3.3% in May.”
• “And in the category of ‘better still’, prices were unchanged in May from April, the first time prices have remained stable since October 2023.”
• “Core inflation, which strips out volatile food and fuel prices, was also down, at 3.4% from 3.6% in April.”
• “And while inflation was down, wages increased in May to 4.1% when measured annually, the 13th month that wages have increased faster than inflation and easing consumer angst.”
• “The combination of these macro conditions (lower inflation and higher wages) and lower year-over-year room rates are strong catalysts for this month’s excellent lodging booking pace and demand pickup.”
• “The U.S. economy remains on solid footing. While recent economic data have come in weaker than expected, our leading indicators remain positive. We expect the economy to slow in the coming months but see no signals of a recession.”
• “A slowdown in inflation is back on track according to May readings. This is good news and could help reverse recent consumer sentiment declines driven by delayed interest rate cuts, slowing income growth and sustained higher prices. Still, the correlation between consumer sentiment and consumer spending has not been strong. Rather, spending largely depends on household balance sheets which remain solid for middle- and highincome homes.”
• “Strong travel intentions, growth in outbound and continued recovery of inbound international travel are driving increased U.S. airport traffic. More than 360 million travelers passed through security checkpoints in U.S. airports from January through May— including more than 10 million during Memorial Day weekend. June is pacing 7% ahead of 2019 air passenger volumes.”
• “U.S. outbound travel registered 120% of 2019 levels as of May 2024 YTD (28.2 million persons), compared to inbound travel at 86% of 2019 levels (13.2 million persons YTD). Year-over-year growth in US outbound travel increased to 11% in May from 8% in April.”
• “Overseas inbound arrivals to the U.S. through May registered 14% below the same period in 2019, despite a 20% gain over the same period last year. Recovery has varied by region —the strongest rebound being from Central America with a 16% gain over the first five months of 2019.”
• “While Asia lags in all major regions, visits to the U.S. from India present a bright spot. Visits from Asia rose 37% YTD through May but still registered 27% below the same period in 2019. Arrivals from India, however, surpassed 2019 levels last year and have risen 37% in 2024.”
• “The on-going recovery in international arrivals contributed to a $561 million surplus in the travel and tourism balance of trade for April 2024. Total travel and tourism-related exports were 12.5% higher than April 2023 versus an 8.7% increase in imports.”
• “Hotel demand has experienced a modest recovery, most recently posting back-to-back gains with a rise of 2.0% in May after a 1.8% rise in April—an encouraging sign as the industry heads into the summer season.”
• “On a trailing twelve months (TTM) basis, U.S. hotels experienced a 1.8% year-over-year decline in Net Operating Income (NOI) for the quarter ended March 2024.”
• “The declines were driven by a 150-bps contraction in margins year-over-year as the 2.7% growth in hotel revenue has failed to keep up with rising labor, food & beverage, property taxes, and insurance costs.”
• “Full year 2024 hotel NOI growth is expected to be just +0.7%, given our modest 2% RevPAR forecast and continued cost pressures.”
• “Cap rates expanded 8-bps on a TTM basis in Q1 2024 vs Q4 2023, and +28-bps vs. Q1 2023.”
• “CBRE forecasts continued hotel cap rate expansion in 2024, with cap rates not peaking until Q1 2025 due to delays in Federal Reserve interest rate cuts.”
• “May saw an 11.4% increase in Demand and a 3.1% rise in Occupancy, signaling strong recovery and growth in the short-term rental market.”
• “Coastal and rural locations are thriving with high demand, while urban areas face declines due to high interest rates and stricter regulations.”
• “Summer bookings, particularly beach reservations for July 4th, are seeing substantial growth.”
• Key U.S. Short Term Rental Performance Metrics for May 2024
• RevPAR increased 4.7% YOY to $167.27
• Available listings were 1.69 million, up 7.2% YOY
• Total demand (nights) rose 11.4% YOY
• Occupancy was 3.1% higher YOY at 56.0%
• Average Daily Rate (ADR) increased 1.6% YOY to $298.92
• Nights booked increased by 12.7% YOY

2022 2023 2024
Source: John Wayne Airport
5,000,000.0
4,500,000.0
4,000,000.0
3,500,000.0
3,000,000.0
2,500,000.0
2,000,000.0
Source: John Wayne Airport
TOTAL PASSENGERS PACING YTD (JAN - MAY)
4,226,977.0 4,751,107.0 4,572,914.0
14,000,000.0
12,000,000.0
TOTAL PASSENGERS BY YEAR (2019 – 2024 YTD)
10,656,986.0
10,000,000.0
8,000,000.0
6,000,000.0
4,000,000.0
3,794,850.0 7,700,489.0
2,000,000.0
4,572,914.0
(JanMay)
Source: John Wayne Airport


• Average Daily Rate (ADR) – A measure of the average rate paid for rooms sold, calculated by dividing room revenue by rooms sold.
• ADR = Room Revenue / Rooms Sold
• Demand (Rooms Sold) – The number of rooms sold in a specified period (excludes complimentary rooms).
• Supply (Rooms Available) – The number of rooms in a hotel or set of hotels multiplied by the number of days in a specified period.
• Occupancy – Percentage of available rooms sold during a specified period. Occupancy is calculated by dividing the number of rooms sold by rooms available.
• Occupancy = Rooms Sold / Rooms Available
• Room Revenue – Total room revenue generated from the guestroom rentals or sales.
• Revenue Per Available Room (RevPAR) – Total room revenue divided by the total number of available rooms.
Newport Beach Hotel Occupancy decreased 2.4%, ADR increased 4.6%, and RevPAR increased 2.1% vs. the same month last year
Newport Beach Hotel Demand increased 7.7%, Supply increased 10.3%, and Revenue increased 12.7% vs. the same month last year
$40,000,000.0
$35,000,000.0
$30,000,000.0
$25,000,000.0
$20,000,000.0
$17,731,061.5$17,890,544.9
$15,000,000.0
$10,000,000.0
$5,000,000.0

• Guest Nights – Total nights reserved by guests for a specified period. Also referred to as Properties Sold or Nights Sold.
• Occupancy – The percentage of guest nights booked out of the total nights in a specified period.
• Occupancy = Guest Nights Booked / Total Nights
• Unit Revenue – The rental revenue from Guest Nights. This does not include taxes or Other Revenue (e.g. resort fees, bike rentals, ski rentals, and concierge revenue).
• Average Daily Rate (ADR) – The average Unit Revenue paid by guests for the Guest Nights in a specified period.
• ADR = Unit Revenue / Guest Nights
• Revenue Per Available Rental Night (RevPAR) – Total Unit Revenue divided by Guest Nights in a specified period.
• RevPAR = Total Unit Revenue / Guest Nights or Occupancy x ADR
Newport Beach short term rental Occupancy increased 5.3%, ADR increased 3.1%, and RevPAR increased 8.5% vs. the same month last year

Source: Zartico (Visitor device count (n) =
CA
San Francisco-Oakland-San Jose CA
Phoenix AZ
Sacramento-Stockton-Modesto CA
Los Angeles CA
Denver CO
Las Vegas NV
Honolulu HI
Chicago IL
New York NY
San Diego CA
Source: Zartico (Visitor device count (n) = 40,393 Visitor Cardholder Count
(n) = 24,579)
(JAN 2023 - MAY 2024)
OBSERVED
Source: Zartico (Visitor device count (n) = 40,393)

CAMPAIGN ANALYSIS: SOJERN VISIT NEWPORT BEACH SUMMER 2023
Sojern: Visit Newport Beach Summer 2023 Campaign Analysis
Flight Dates: 7/1/2023 – 9/21/2023
Reporting Dates: 7/1/2023 – 9/21/2023
Total Events* Confirmed Travelers Hotel Night Stays
Bookings
*Total Events include flight, lodging, and car bookings Estimated Economic Impact = $6,467,378
(Confirmed Total Travelers x Avg Spend Per Traveler = Total Estimated Traveler Spend)
= 143:1
*Campaign analysis does not include the impact of any additional media channels (such as PR, social media, etc.)
(Total Estimated Traveler Spend / Media Spend = ROAS)
CAMPAIGN ANALYSIS: SOJERN VISIT NEWPORT BEACH FALL 2023
Sojern: Visit Newport Beach Fall 2023 Campaign Analysis
Flight Dates: 9/7/2023 – 11/15/2023
Reporting Dates: 9/7/2023 – 11/15/2023 Total Activities* Confirmed Travelers Hotel Night Stays
Bookings
*Total Activities include flight, lodging, and car bookings Estimated Economic Impact = $9,952,075 (Confirmed Total Travelers x Avg Spend Per Traveler = Total Estimated Traveler Spend)
= 109:1
*Campaign analysis does not include the impact of any additional media channels (such as PR, social media, etc.)
(Total Estimated Traveler Spend / Media Spend = ROAS)
CAMPAIGN ANALYSIS: SOJERN VISIT NEWPORT BEACH FY24 EVENTS – FORMULA 1
Sojern: Visit Newport Beach FY24 Events Formula 1 Campaign Analysis
Flight Dates: 11/2/2023 – 11/30/2023 Reporting Dates: 11/2/2023 – 11/30/2023 Total Events* Confirmed Travelers Hotel Night Stays
Bookings
*Total Events include flight, lodging, and car bookings Estimated Economic Impact = $700,077
(Confirmed Total Travelers x Avg Spend Per Traveler = Total Estimated Traveler Spend)
*Campaign analysis does not include the impact of any additional media channels (such as PR, social media, etc.)
ROAS (Return On Ad Spend) = 25:1
(Total Estimated Traveler Spend / Media Spend = ROAS)
CAMPAIGN ANALYSIS: SOJERN VISIT NEWPORT BEACH HOLIDAY 2023
Sojern: Visit Newport Beach Holiday 2023 Campaign Analysis
Flight Dates: 11/7/2023 – 1/5/2024
Reporting Dates: 11/7/2023 – 1/5/2024 Total Events* Confirmed Travelers Hotel Night Stays
Bookings
*Total Events include flight, lodging, and car bookings Estimated Economic Impact = $4,106,334
(Confirmed Total Travelers x Avg Spend Per Traveler = Total Estimated Traveler Spend)
= 79:1
*Campaign analysis does not include the impact of any additional media channels (such as PR, social media, etc.)
(Total Estimated Traveler Spend / Media Spend = ROAS)
CAMPAIGN ANALYSIS: SOJERN VISIT NEWPORT BEACH FY24 SUPER BOWL
Sojern: Visit Newport Beach FY24 Super Bowl Campaign Analysis
Flight Dates: 2/1/2024 – 2/20/2024
Reporting Dates: 2/1/2024 – 2/20/2024
*Total Events include flight, lodging, and car bookings
Estimated Economic Impact = $219,632
(Confirmed Total Travelers x Avg Spend Per Traveler = Total Estimated Traveler Spend)
*Campaign analysis does not include the impact of any additional media channels (such as PR, social media, etc.)
= 11:1
(Total Estimated Traveler Spend / Media Spend = ROAS)
CAMPAIGN ANALYSIS: SOJERN VISIT NEWPORT BEACH FY24 WINTER
Sojern: Visit Newport Beach FY24 Winter Campaign Analysis
Flight Dates: 1/5/2024 – 3/18/2024
Reporting Dates: 1/5/2024 – 3/18/2024
*Total Events include flight, lodging, and car bookings Estimated Economic Impact = $7,594,953 (Confirmed Total Travelers x Avg Spend Per Traveler = Total Estimated Traveler Spend)
= 86:1
*Campaign analysis does not include the impact of any additional media channels (such as PR, social media, etc.)
(Total Estimated Traveler Spend / Media Spend = ROAS)
CAMPAIGN ANALYSIS: SOJERN VISIT NEWPORT BEACH FY24 SPRING
Sojern: Visit Newport Beach FY24 Spring Campaign Analysis
Flight Dates: 3/19/2024 – 6/19/2024
Reporting Dates: 3/19/2024 – 6/19/2024
*Total Activities include flight, lodging, and car bookings Estimated Economic Impact = $4,645,609 (Confirmed Total Travelers x Avg Spend Per Traveler = Total Estimated Traveler Spend)
37:1
*Campaign analysis does not include the impact of any additional media channels (such as PR, social media, etc.)
(Total Estimated Traveler Spend / Media Spend = ROAS)

Beach/Anaheim,
Indexed to 2019 = 100
Leisure and Hospitality
Total Private
Source: STR, TSA, and BLS

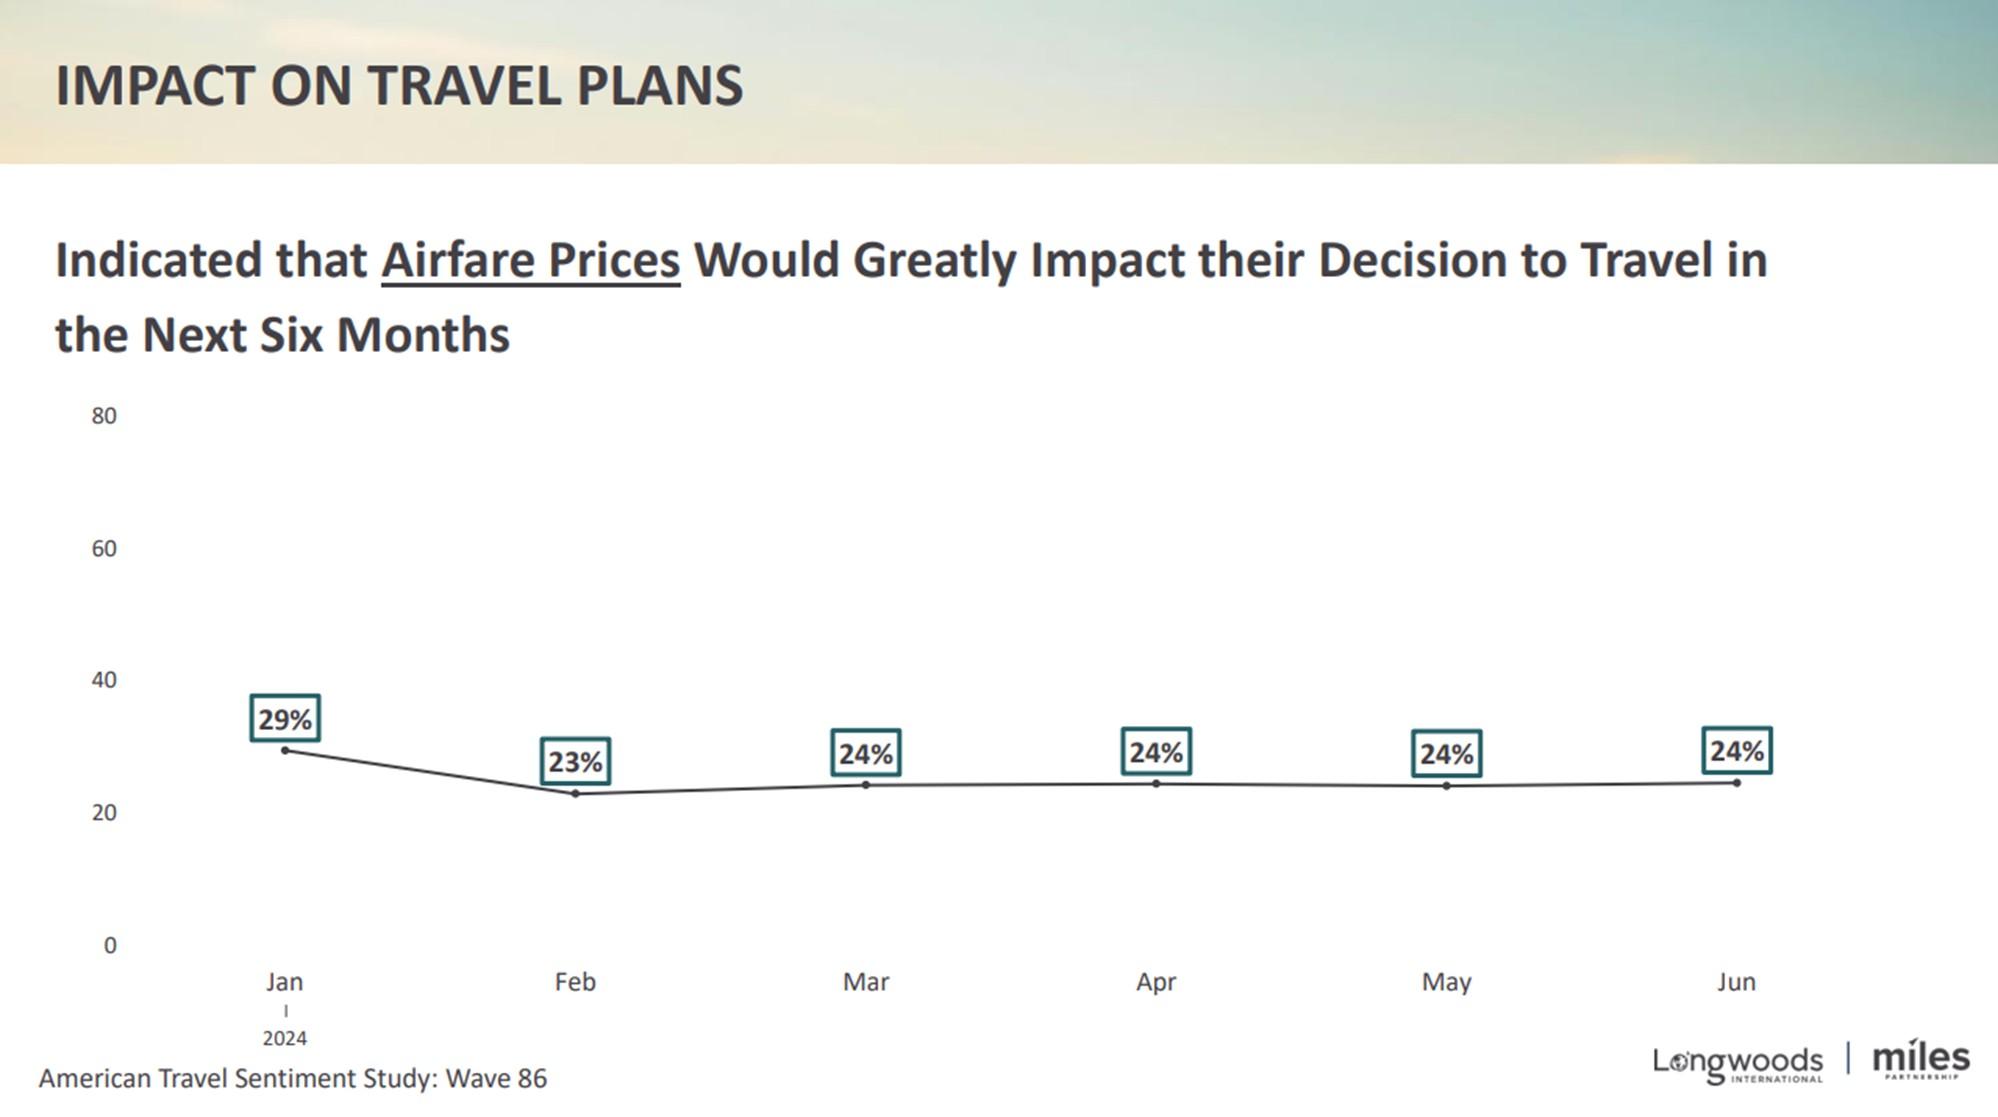
*Survey Fielded June 12, 2024; U.S. National Sample of 1,000 adults 18+

*Survey Fielded June 12, 2024; U.S. National Sample of 1,000 adults 18+
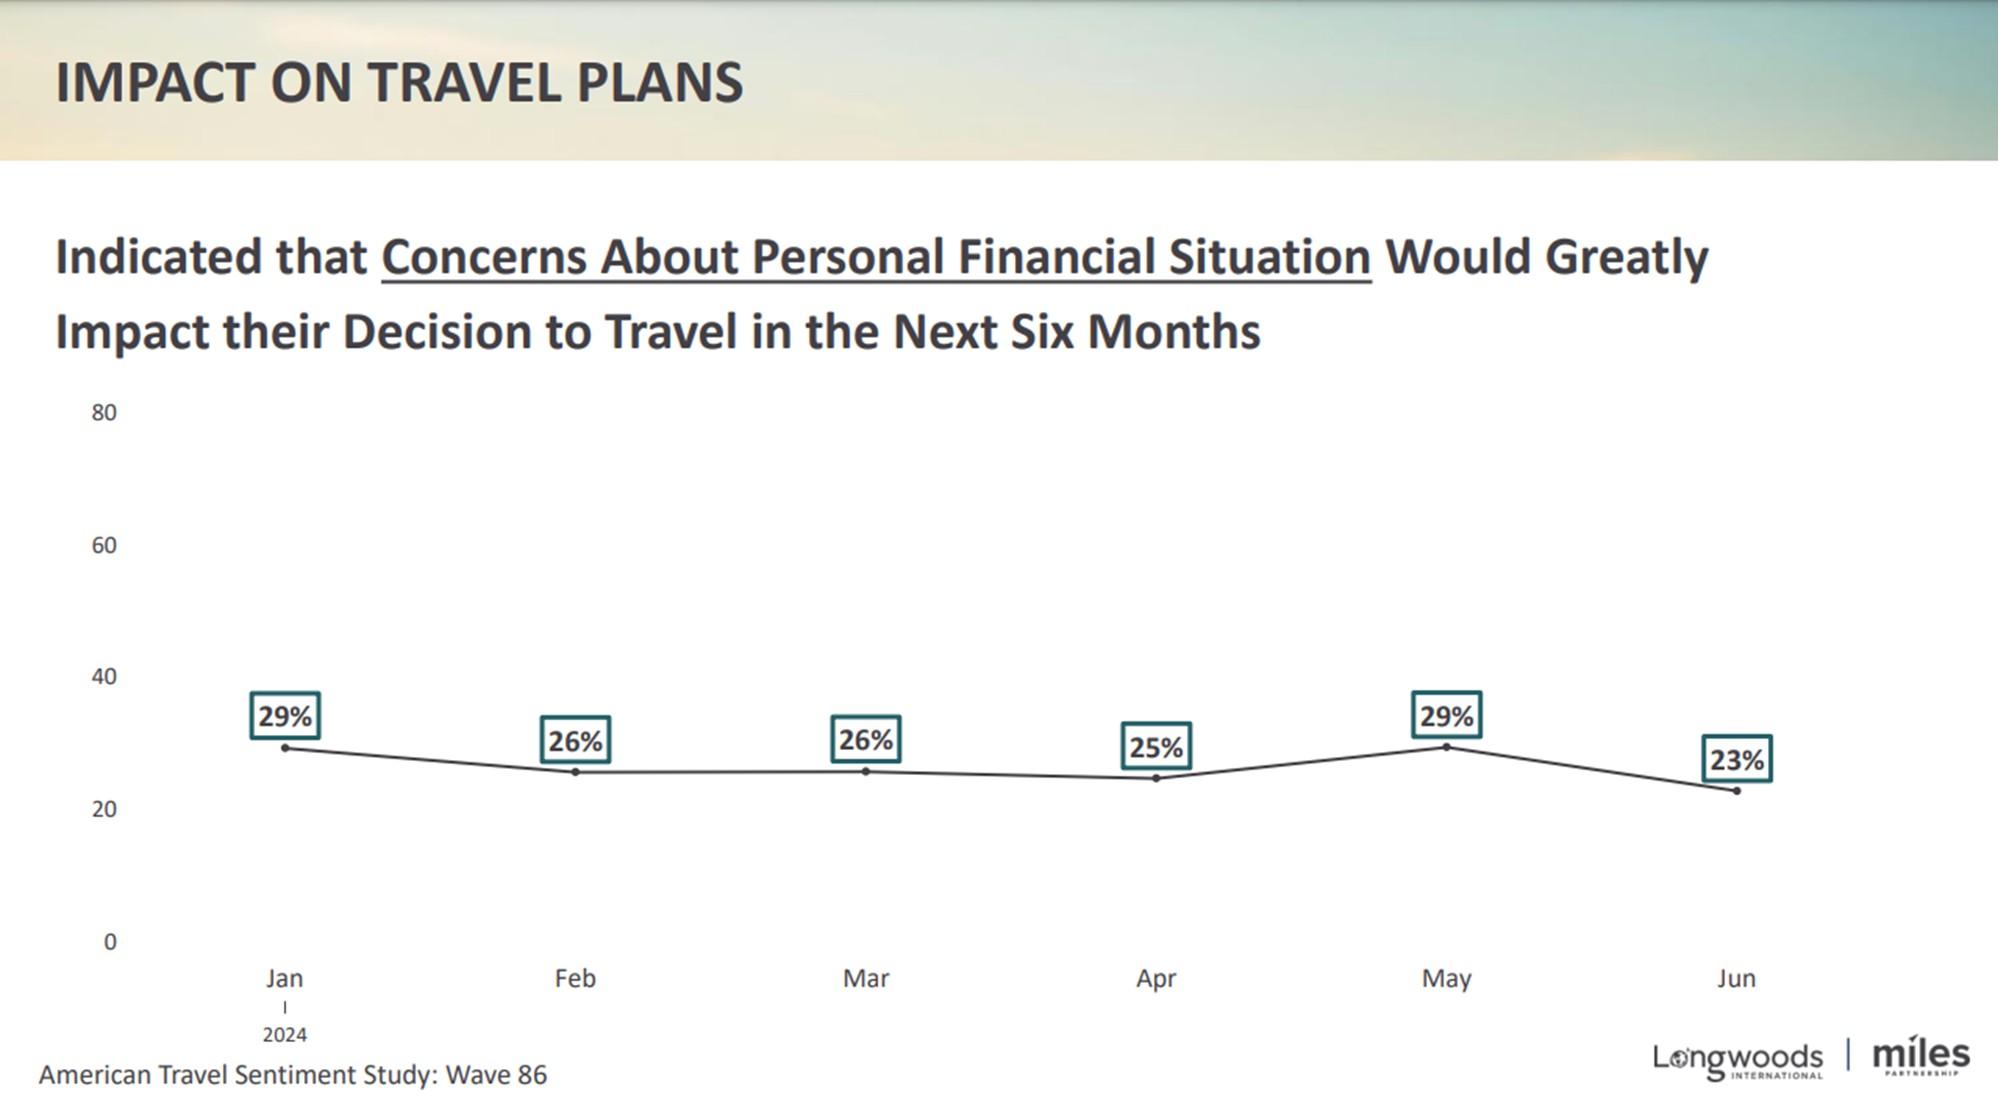
*Survey Fielded June 12, 2024; U.S. National Sample of 1,000 adults 18+
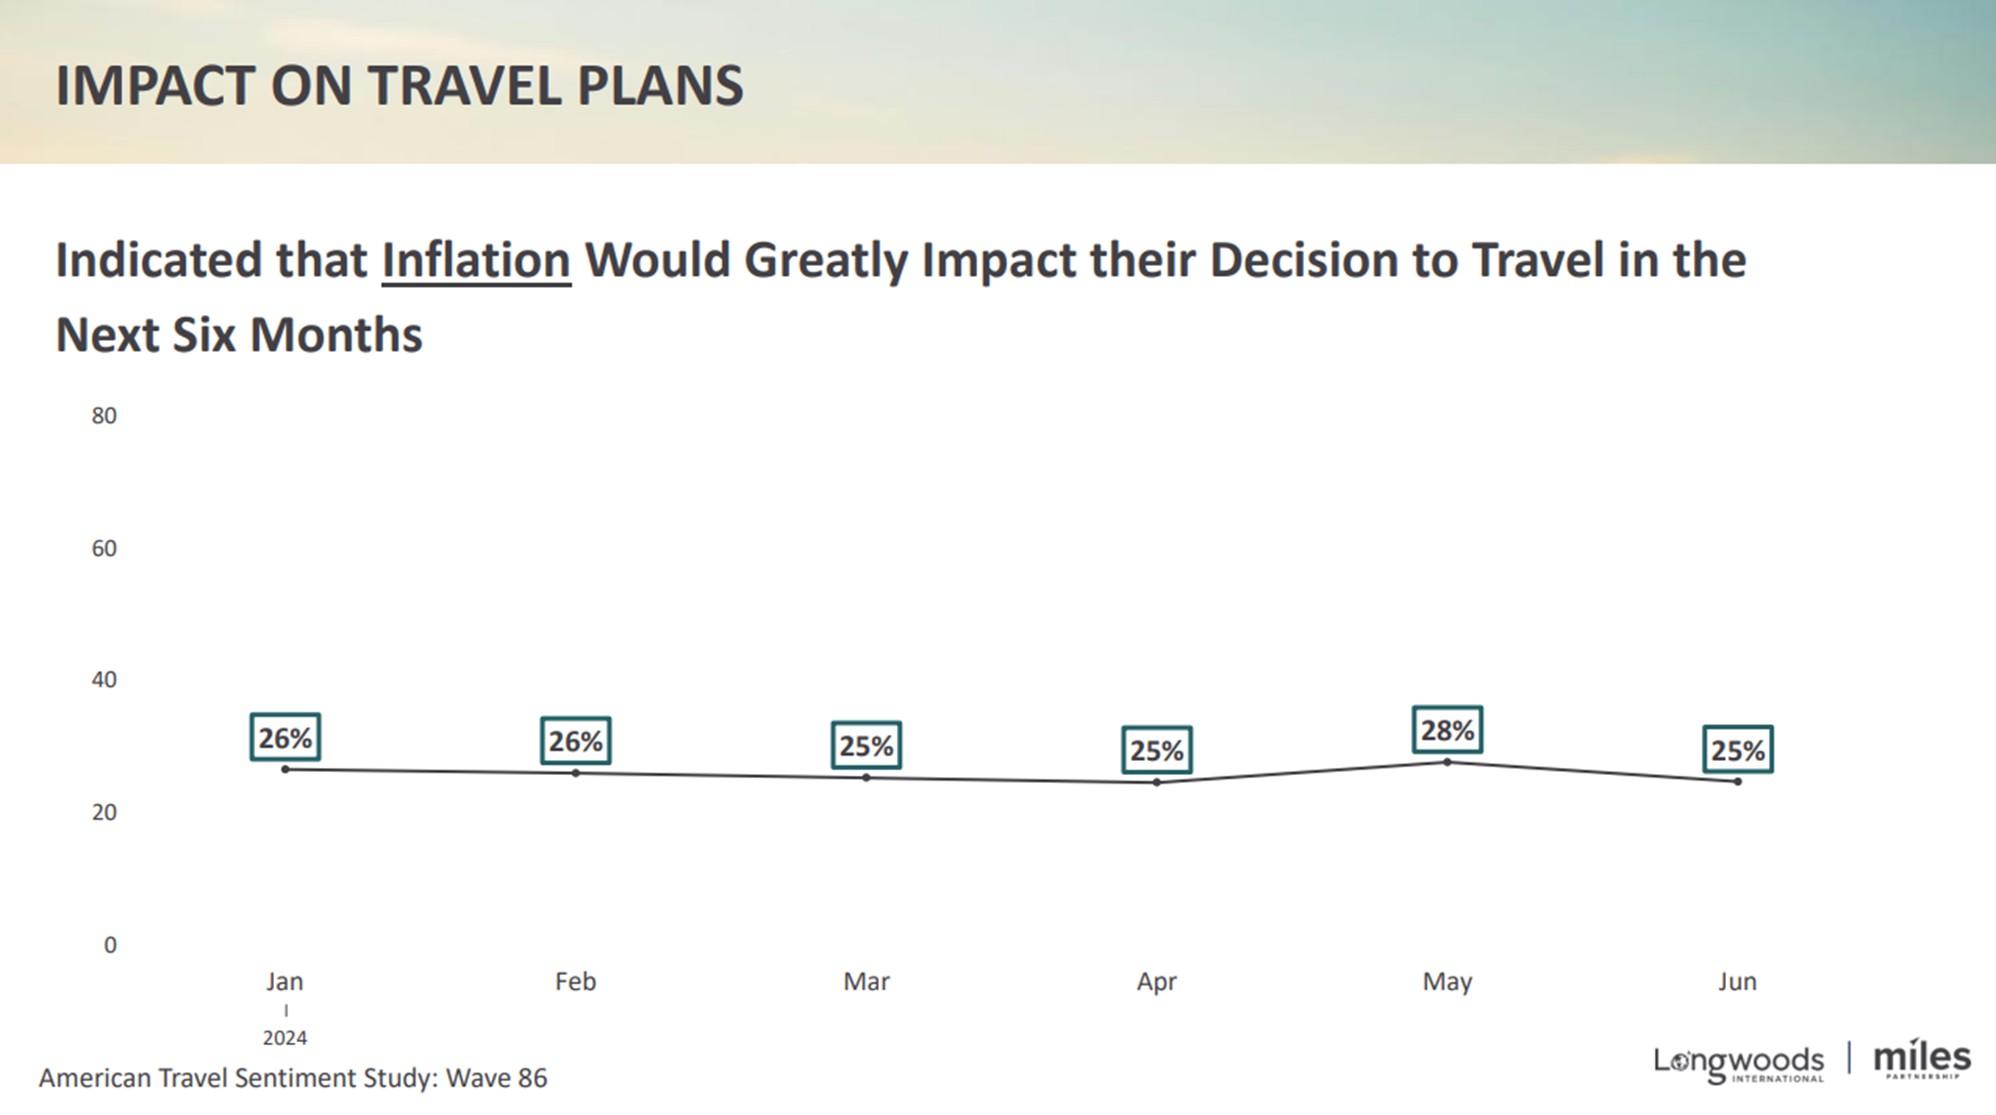
*Survey Fielded June 12, 2024; U.S. National Sample of 1,000 adults 18+

*Survey Fielded June 12, 2024; U.S. National Sample of 1,000 adults 18+
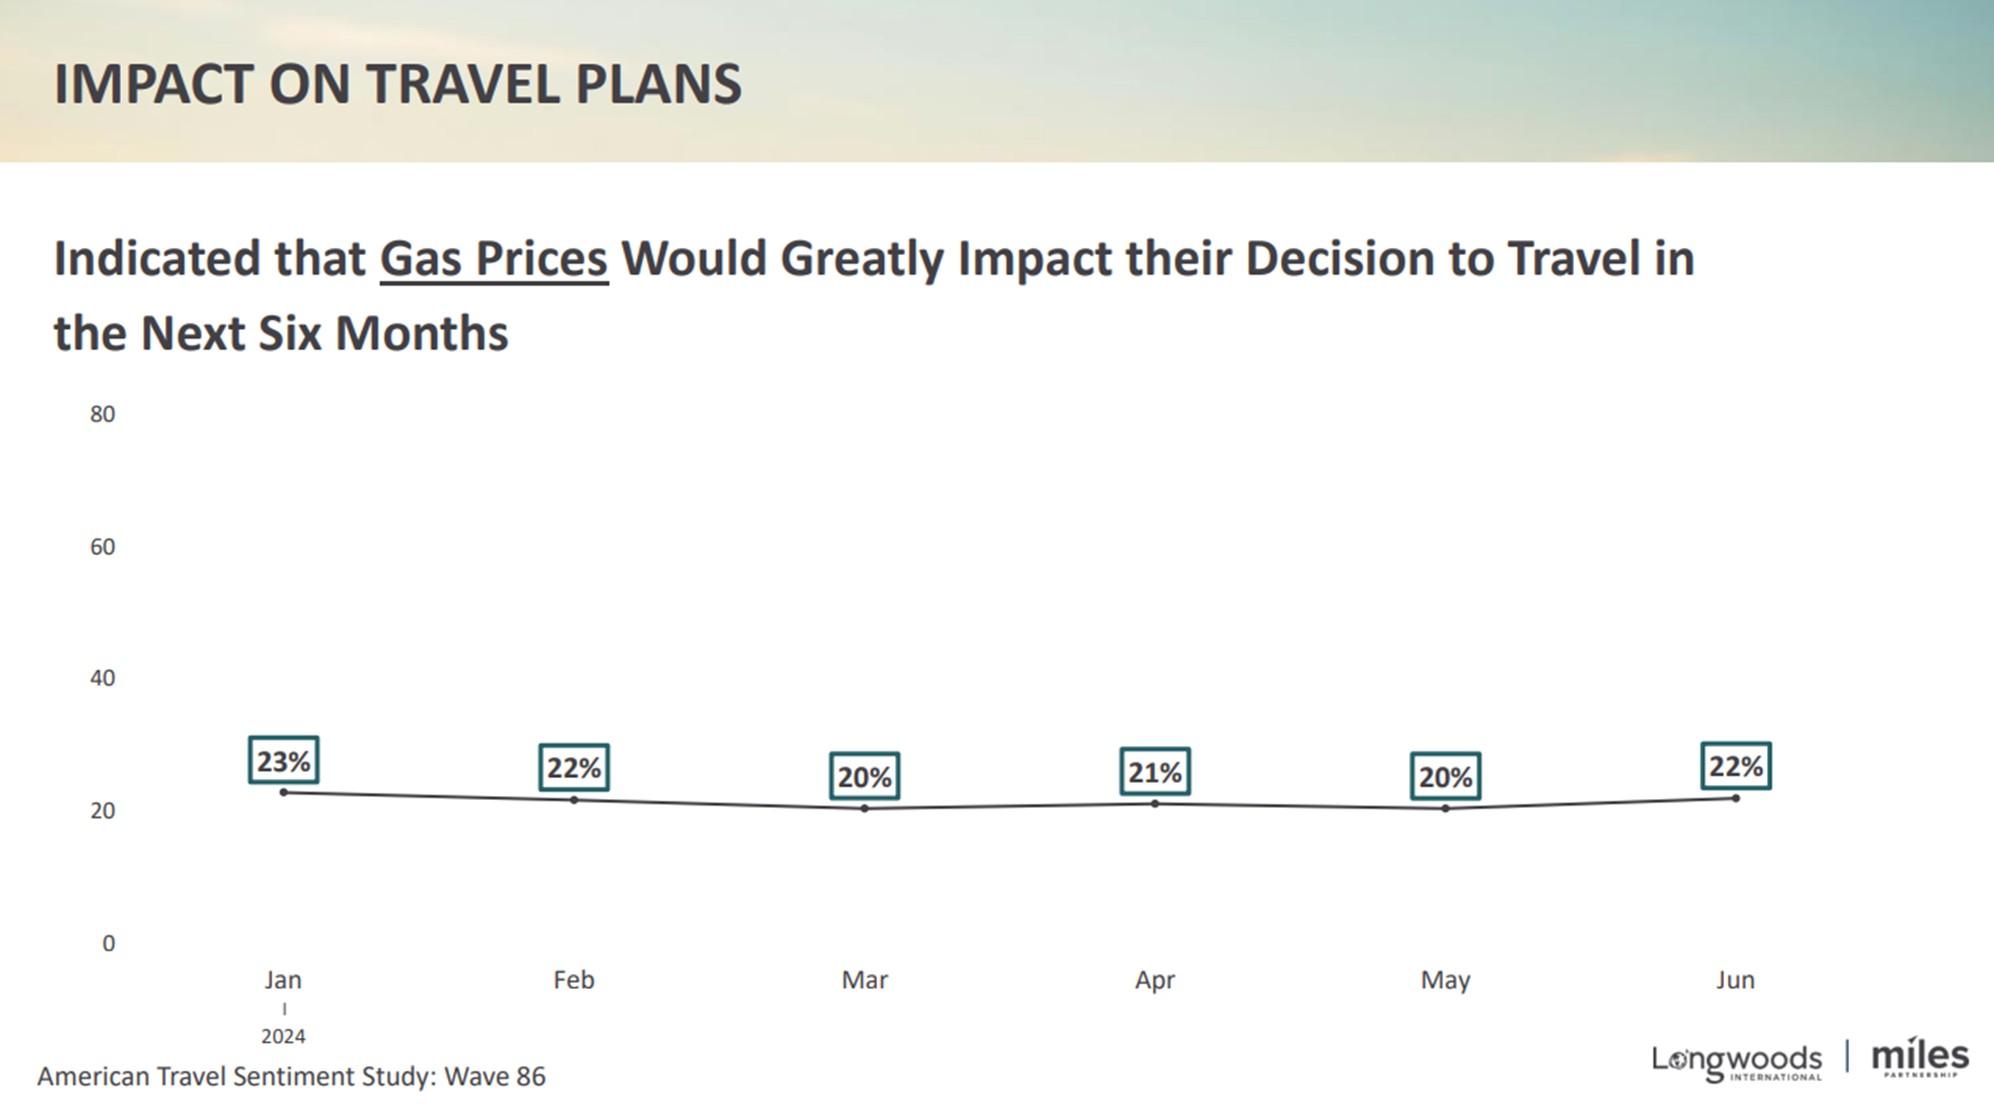
*Survey Fielded June 12, 2024; U.S. National Sample of 1,000 adults 18+
