APRIL 2024 REVIEW


• In April 2024, Newport Beach hotels showed mostly negative results compared to the same month last year.
• Occupancy declined 4.4% YoY, largely driven by a 10.3% increase in Supply.
• ADR decreased 2.0% and RevPAR dropped by 6.3%.
• Revenue and Demand were the only bright spots, which grew by 3.4% and 5.5% for the month, respectively.
• Short-term rentals in Newport Beach also saw weaker results in April 2024 compared to April 2023.
• Occupancy dropped 9.8% to 36%.
• ADR fell 0.6% to $455.
• RevPAR declined 10.3% to $164.


• “Economic news in April brought another round of stalling on the part of the Federal Reserve. According to the Bureau of Labor Statistics (BLS), 175,000 new jobs were added to the U.S. economy in April. While still a relatively solid number of jobs, it represented a notable decline from the 315,000 jobs added in the previous month. It’s low enough to increase the unemployment rate slightly to 3.9%, up from 3.8% in March.”
• “At the same time, inflation, as measured by the year-over-year (YOY) change in the consumer price index, came in at 3.4%. That’s down from 3.5% in March but still too high to signal that rates can be cut immediately without risking further price increases. This rate is particularly important to the short-term rental industry because it is considered to influence mortgage lending rates.”
• “According to an analysis of mortgage data from Recursion Co, mortgage loans fell to the lowest level of the current century in 2023. This is due in part to central bank rates reaching their highest in 23 years. The stagnant inflation figure has given economists some confidence that the rates could see cuts later in the year.”
• “The Dow Jones Industrial Average (DJIA) declined in April, down -5.0 percent or 1,991.45 points, to close the month at 37,815.92, due in part to Main Street’s reaction to economic conditions, with consumers pulling back.
(continued)
• The Consumer Confidence Index (CCI) declined last month, down -5.9 percent, and after an adjustment to March’s numbers, April ended the month at 97.0 points. The is the first time CCI is under 100 points since October 2023. To contextualize the survey responses, Dana M. Peterson, Chief Economist at The Conference Board said, “In the month, confidence declined among consumers of all age groups and almost all income groups.”
• “CBRE forecasts full-year 2024 revenue per available room (RevPAR) growth of 2%, down from 3% previously. The full-year forecast represents approximately a 2% decline in Q1 2024, followed by progressively stronger trends over the balance of the year fueled by a more favorable holiday calendar, special events like the eclipse, continued improvement in inbound international travel, and limited supply growth. Improvements in inbound international visitation should support outperformance in urban and airport locations.”
• “CBRE’s baseline forecast anticipates GDP growth of 2.3% and average inflation of 3.2% in 2024, which have been revised by +76 basis points and +71 basis points, respectively, since our forecast release in February. The positive GDP revision suggests that the balance of 2024 should be solid following Q1’s weaker-than-expected results. Over time, the relative strength of the economy directly impacts the performance of the lodging industry.”
• “In Q1 2024, the U.S. economy grew at an annualized rate of 1.6%, missing consensus expectations of 2.5% growth. The slowdown in the economy was evident in the 2.1% drop in RevPAR for the quarter, falling to $90.74. A 0.1% decline in average daily rate (ADR) coupled with a 1.2 p.p. decrease in occupancy contributed to the pullback in RevPAR. The greater-than-expected decrease in RevPAR was attributed to slower GDP growth coupled with more persistent inflation as well as the shift in the Easter holiday.”
• “Despite the reduced outlook for 2024 RevPAR growth, CBRE still expects record nominal RevPAR of $101.20, or 115% of 2019’s pre-pandemic level. This RevPAR outlook is predicated on 1.7% ADR growth and a 0.1 p.p. increase in occupancy.”
• “CBRE expects cyclically low supply growth of less than 1% in 2024, and muted supply growth in the medium term due to elevated financing and construction costs. The continued uptick in inbound international travel over the busy summer holiday season, coupled with improvement in group and corporate demand against the backdrop of limited supply should support overall RevPAR growth in 2024.”
• “The strong short-term rental (STR) market performance seen in March came with a catch: some of the demand was due strictly to the calendar shift that moved Easter, and many spring break vacations along with it, from April to March.”
• “This meant that March had the second-highest demand growth seen in the last year (after February) and that 2024’s April had fewer spring breaks scheduled than last year. As a result, demand growth swerved from a strong 10.5% in March to just 0.4% in April.”
• “A similar pattern emerged at the beginning of the year when a cold snap and poor snow-pack conditions in January led many to put off ski trips and winter vacations until February.”
• “So far, 2024 has seen a highly volatile pattern of demand growth. However, when you average the first four months of 2024 against the first four months of 2023, we see an upward trajectory.”
SHORT-TERM RENTALS (continued)
• Key U.S. Short Term Rental Performance Metrics for April 2024
• RevPAR decreased 6.1% year-over-year (YOY) to $153.25
• Available listings were 1.64 million, up 8.7% YOY
• Total demand (nights) rose 0.4% YOY
• Occupancy was 8.4% lower YOY at 50.0%
• ADR increased 2.4% YOY to $306.39
• Nights booked increased by 7.6% YOY

Source: John Wayne Airport
TOTAL PASSENGERS BY YEAR (2019 – 2024 YTD) MILLIONS
Source: John Wayne Airport
(Jan - Mar)


• Average Daily Rate (ADR) – A measure of the average rate paid for rooms sold, calculated by dividing room revenue by rooms sold.
• ADR = Room Revenue / Rooms Sold
• Demand (Rooms Sold) – The number of rooms sold in a specified period (excludes complimentary rooms).
• Supply (Rooms Available) – The number of rooms in a hotel or set of hotels multiplied by the number of days in a specified period.
• Occupancy – Percentage of available rooms sold during a specified period. Occupancy is calculated by dividing the number of rooms sold by rooms available.
• Occupancy = Rooms Sold / Rooms Available
• Room Revenue – Total room revenue generated from the guestroom rentals or sales.
• Revenue Per Available Room (RevPAR) – Total room revenue divided by the total number of available rooms.
• RevPAR = Room Revenue / Rooms Available
Newport Beach Hotel Occupancy decreased 4.4%, ADR decreased 2.0%, and RevPAR decreased 6.3% vs. the same month last year
Newport Beach Hotel Occupancy decreased 4.4%, ADR decreased 2.0%, and RevPAR decreased 6.3% vs. the same month last year
2022 2023 2024
Newport Beach Hotel Occupancy decreased 4.4%, ADR decreased 2.0%, and RevPAR decreased 6.3% vs. the same month last year
2022 2023 2024
Newport Beach Hotel Demand increased 5.5%,Supply increased 10.3%, and Revenue increased 3.4% vs. the same month last year
2022 2023 2024
Newport Beach Hotel Demand increased 5.5%,Supply increased 10.3%, and Revenue increased 3.4% vs. the same month last year
Newport Beach Hotel Demand increased 5.5%,Supply increased 10.3%, and Revenue increased 3.4% vs. the same month last year

• Guest Nights – Total nights reserved by guests for a specified period. Also referred to as Properties Sold or Nights Sold.
• Occupancy – The percentage of guest nights booked out of the total nights in a specified period.
• Occupancy = Guest Nights Booked / Total Nights
• Unit Revenue – The rental revenue from Guest Nights. This does not include taxes or Other Revenue (e.g. resort fees, bike rentals, ski rentals, and concierge revenue).
• Average Daily Rate (ADR) – The average Unit Revenue paid by guests for the Guest Nights in a specified period.
• ADR = Unit Revenue / Guest Nights
• Revenue Per Available Rental Night (RevPAR) – Total Unit Revenue divided by Guest Nights in a specified period.
• RevPAR = Total Unit Revenue / Guest Nights or Occupancy x ADR
Newport Beach short term rental Occupancy decreased 9.8%,ADR decreased 0.6%, and RevPAR decreased 10.3% vs. the same month last year Source:
Newport Beach short term rental Occupancy decreased 9.8%,ADR decreased 0.6%, and RevPAR decreased 10.3% vs. the same month last year
2022 2023 2024
Newport Beach short term rental Occupancy decreased 9.8%,ADR decreased 0.6%, and RevPAR decreased 10.3% vs. the same month last year
2022 2023 2024

2024 YTD (JAN –APR)
Los Angeles CA
Phoenix AZ
San Diego CA
San Francisco-Oakland-San Jose CA
Las Vegas NV
Sacramento-Stockton-Modesto CA
Salt Lake City UT
Denver CO
Palm Springs CA
New York NY
Source: Zartico (Visitor device count (n) = 31,874)
Source:
San Francisco-Oakland-San Jose CA
Phoenix AZ
Sacramento-Stockton-Modesto CA
Los Angeles CA
Denver CO
Honolulu HI
Las Vegas NV
Chicago IL
San Diego CA
New York NY
Universal Studios Disneyland
John Wayne Airport, Orange County
Sea World
San Diego Zoo
South Coast Plaza
Anaheim Convention Center
Legoland Resort
California Adventure Park
Mission Of San Juan Capistrano
Knott's Berry Farms
% OBSERVED
Source: Zartico (Visitor device count (n) = 31,874)

Hotel Night Stays by Campaign
Return On Ad Spend by Campaign
CAMPAIGN ANALYSIS: SOJERN VISIT NEWPORT BEACH SUMMER 2023
Sojern: Visit Newport Beach Summer 2023 Campaign Analysis
Flight Dates: 7/1/2023 – 9/21/2023
Reporting Dates: 7/1/2023 – 9/21/2023
Total Events* Confirmed Travelers Hotel Night Stays
Bookings
*Total Events include flight, lodging, and car bookings
Estimated Economic Impact = $6,467,378
(Confirmed Total Travelers x Avg Spend Per Traveler = Total Estimated Traveler Spend)
ROAS (Return On Ad Spend) = 143:1
(Total Estimated Traveler Spend / Media Spend = ROAS)
*Campaign analysis does not include the impact of any additional media channels (such as PR, social media, etc.)
CAMPAIGN ANALYSIS: SOJERN VISIT NEWPORT BEACH FALL 2023
Sojern: Visit Newport Beach Fall 2023 Campaign Analysis
Flight Dates: 9/7/2023 – 11/15/2023
Reporting Dates: 9/7/2023 – 11/15/2023
Total Activities* Confirmed Travelers Hotel Night Stays
Bookings
*Total Activities include flight, lodging, and car bookings
Estimated Economic Impact = $9,952,075
(Confirmed Total Travelers x Avg Spend Per Traveler = Total Estimated Traveler Spend)
ROAS (Return On Ad Spend) = 109:1
(Total Estimated Traveler Spend / Media Spend = ROAS)
*Campaign analysis does not include the impact of any additional media channels (such as PR, social media, etc.)
CAMPAIGN ANALYSIS: SOJERN VISIT NEWPORT BEACH FY24 EVENTS – FORMULA 1
Sojern: Visit Newport Beach FY24 Events Formula 1 Campaign Analysis
Flight Dates: 11/2/2023 – 11/30/2023
Reporting Dates: 11/2/2023 – 11/30/2023
Total Events* Confirmed Travelers Hotel Night Stays
*Total Events include flight, lodging, and car bookings
Estimated Economic Impact = $700,077
(Confirmed Total Travelers x Avg Spend Per Traveler = Total Estimated Traveler Spend) ROAS (Return On Ad Spend) = 25:1
(Total Estimated Traveler Spend / Media Spend = ROAS)
*Campaign analysis does not include the impact of any additional media channels (such as PR, social media, etc.)
CAMPAIGN ANALYSIS: SOJERN VISIT NEWPORT BEACH HOLIDAY 2023
Sojern: Visit Newport Beach Holiday 2023 Campaign Analysis
Flight Dates: 11/7/2023 – 1/5/2024
Reporting Dates: 11/7/2023 – 1/5/2024
Total Events* Confirmed Travelers Hotel Night Stays
Bookings
*Total Events include flight, lodging, and car bookings
Estimated Economic Impact = $4,106,334
(Confirmed Total Travelers x Avg Spend Per Traveler = Total Estimated Traveler Spend)
ROAS (Return On Ad Spend) = 79:1
(Total Estimated Traveler Spend / Media Spend = ROAS)
*Campaign analysis does not include the impact of any additional media channels (such as PR, social media, etc.)
CAMPAIGN ANALYSIS: SOJERN VISIT NEWPORT BEACH FY24 SUPER BOWL
Sojern: Visit Newport Beach FY24 Super Bowl Campaign Analysis
Flight Dates: 2/1/2024 – 2/20/2024
Reporting Dates: 2/1/2024 – 2/20/2024
*Total Events include flight, lodging, and car bookings
Estimated Economic Impact = $219,632
(Confirmed Total Travelers x Avg Spend Per Traveler = Total Estimated Traveler Spend)
ROAS (Return On Ad Spend) = 11:1
(Total Estimated Traveler Spend / Media Spend = ROAS)
*Campaign analysis does not include the impact of any additional media channels (such as PR, social media, etc.)
CAMPAIGN ANALYSIS: SOJERN VISIT NEWPORT BEACH FY24 WINTER
Sojern: Visit Newport Beach FY24 Winter Campaign Analysis
Flight Dates: 1/5/2024 – 3/18/2024
Reporting Dates: 1/5/2024 – 3/18/2024 Total Events* Total Travelers Hotel Night Stays
Bookings
*Total Events include flight, lodging, and car bookings
Estimated Economic Impact = $7,594,953
(Confirmed Total Travelers x Avg Spend Per Traveler = Total Estimated Traveler Spend)
ROAS (Return On Ad Spend) = 86:1
(Total Estimated Traveler Spend / Media Spend = ROAS)
*Campaign analysis does not include the impact of any additional media channels (such as PR, social media, etc.)
Los Angeles/Long Beach/Anaheim, CA Employment by Sector
March 2024 vs 2019
Indexed
Leisure and Hospitality
Total Private
Source: STR, TSA, and BLS
Leisure & Hospitality Jobs Hotel Demand Hotel Revenue Airport Throughput
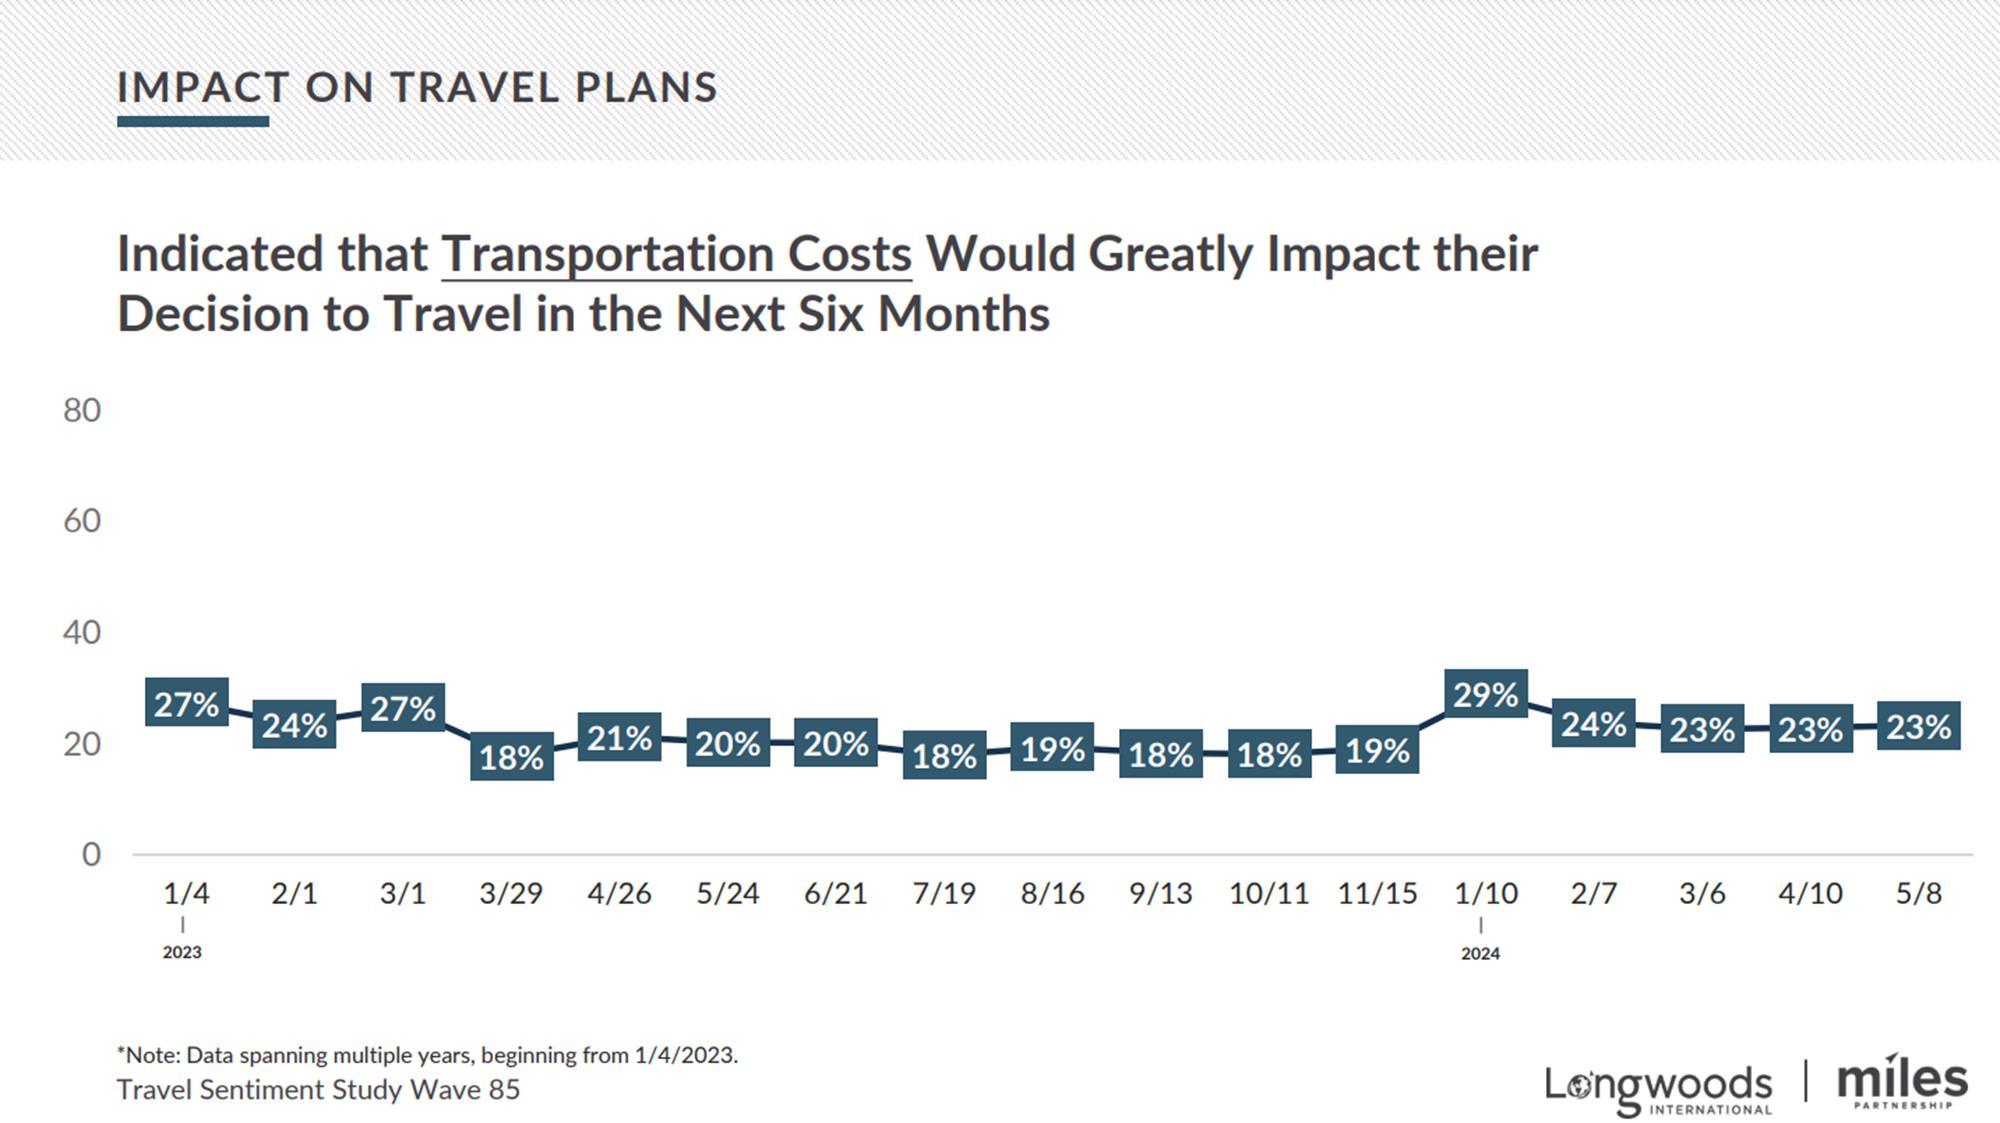
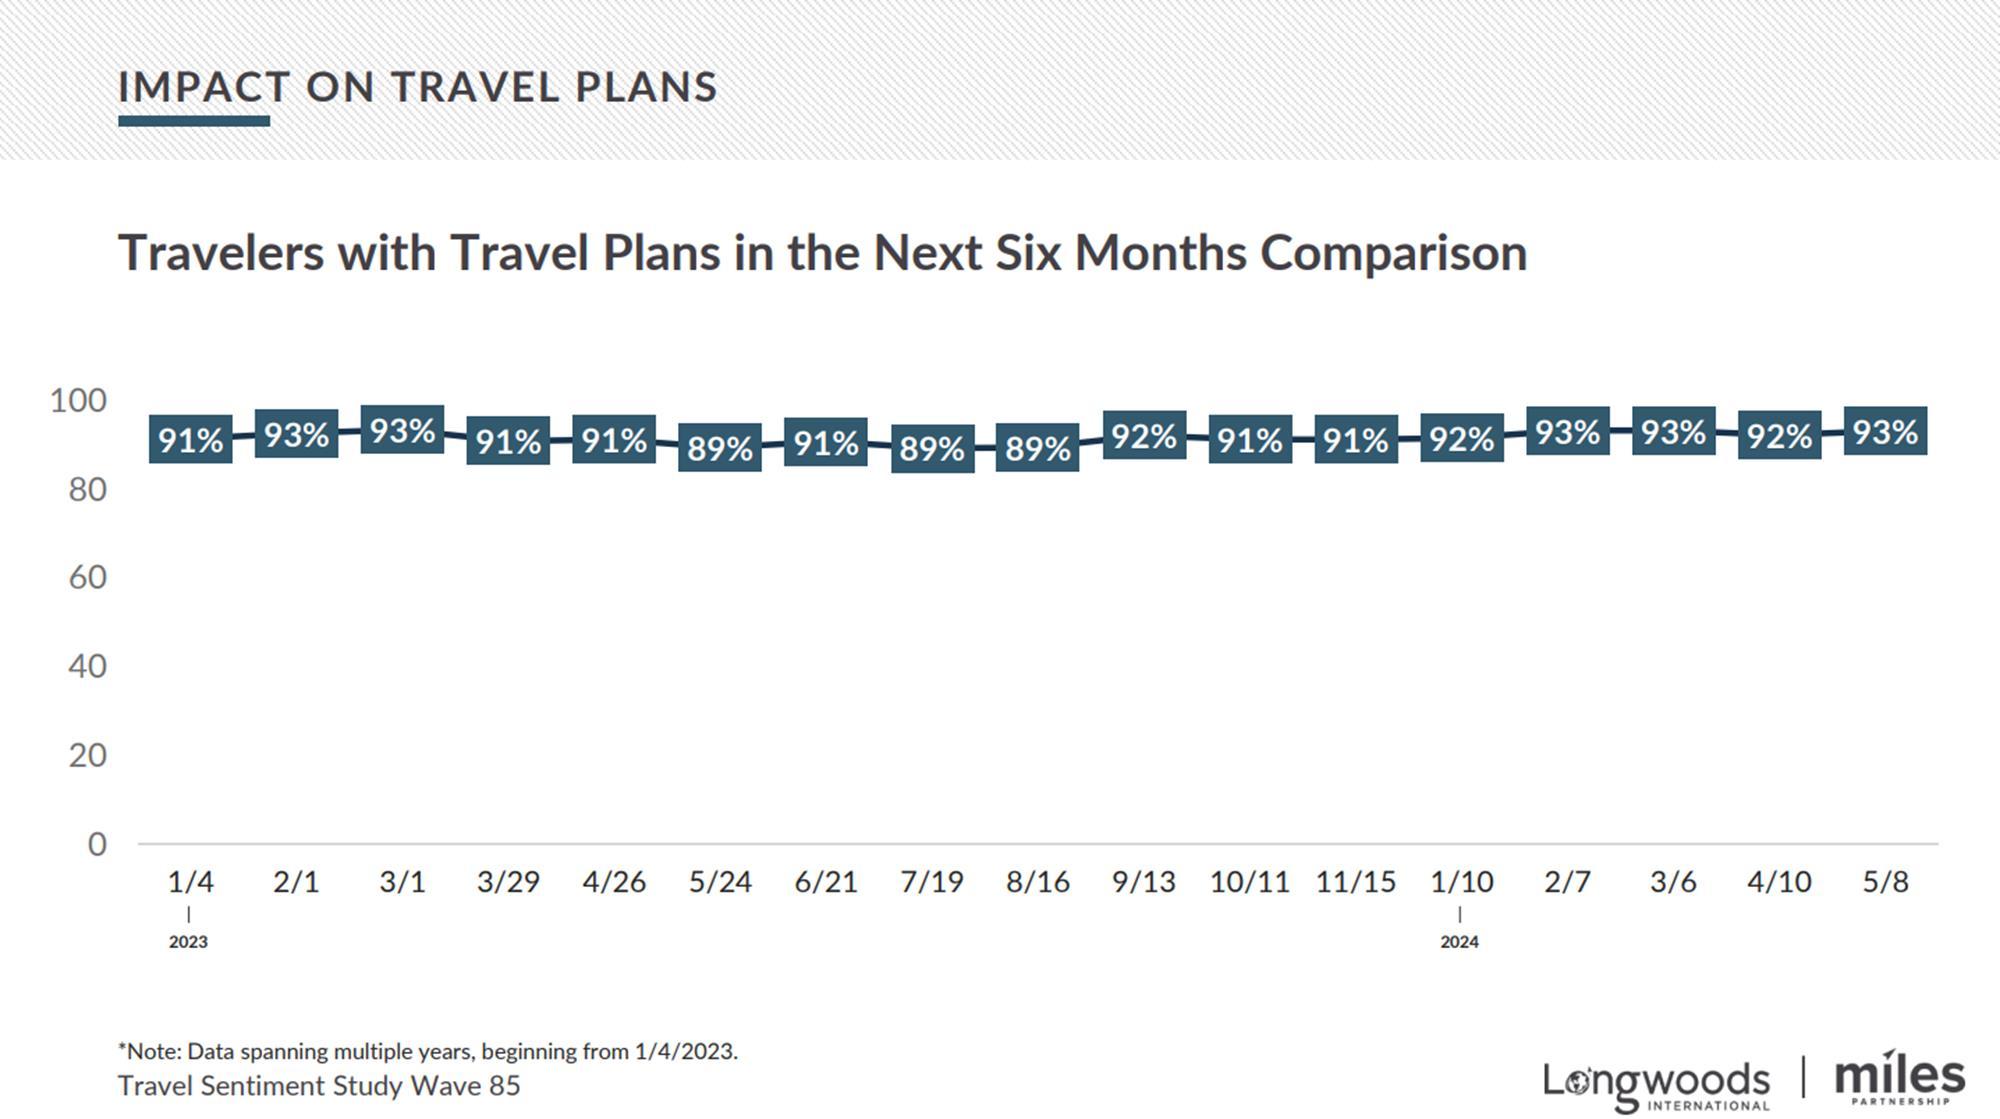 Source: Longwoods International
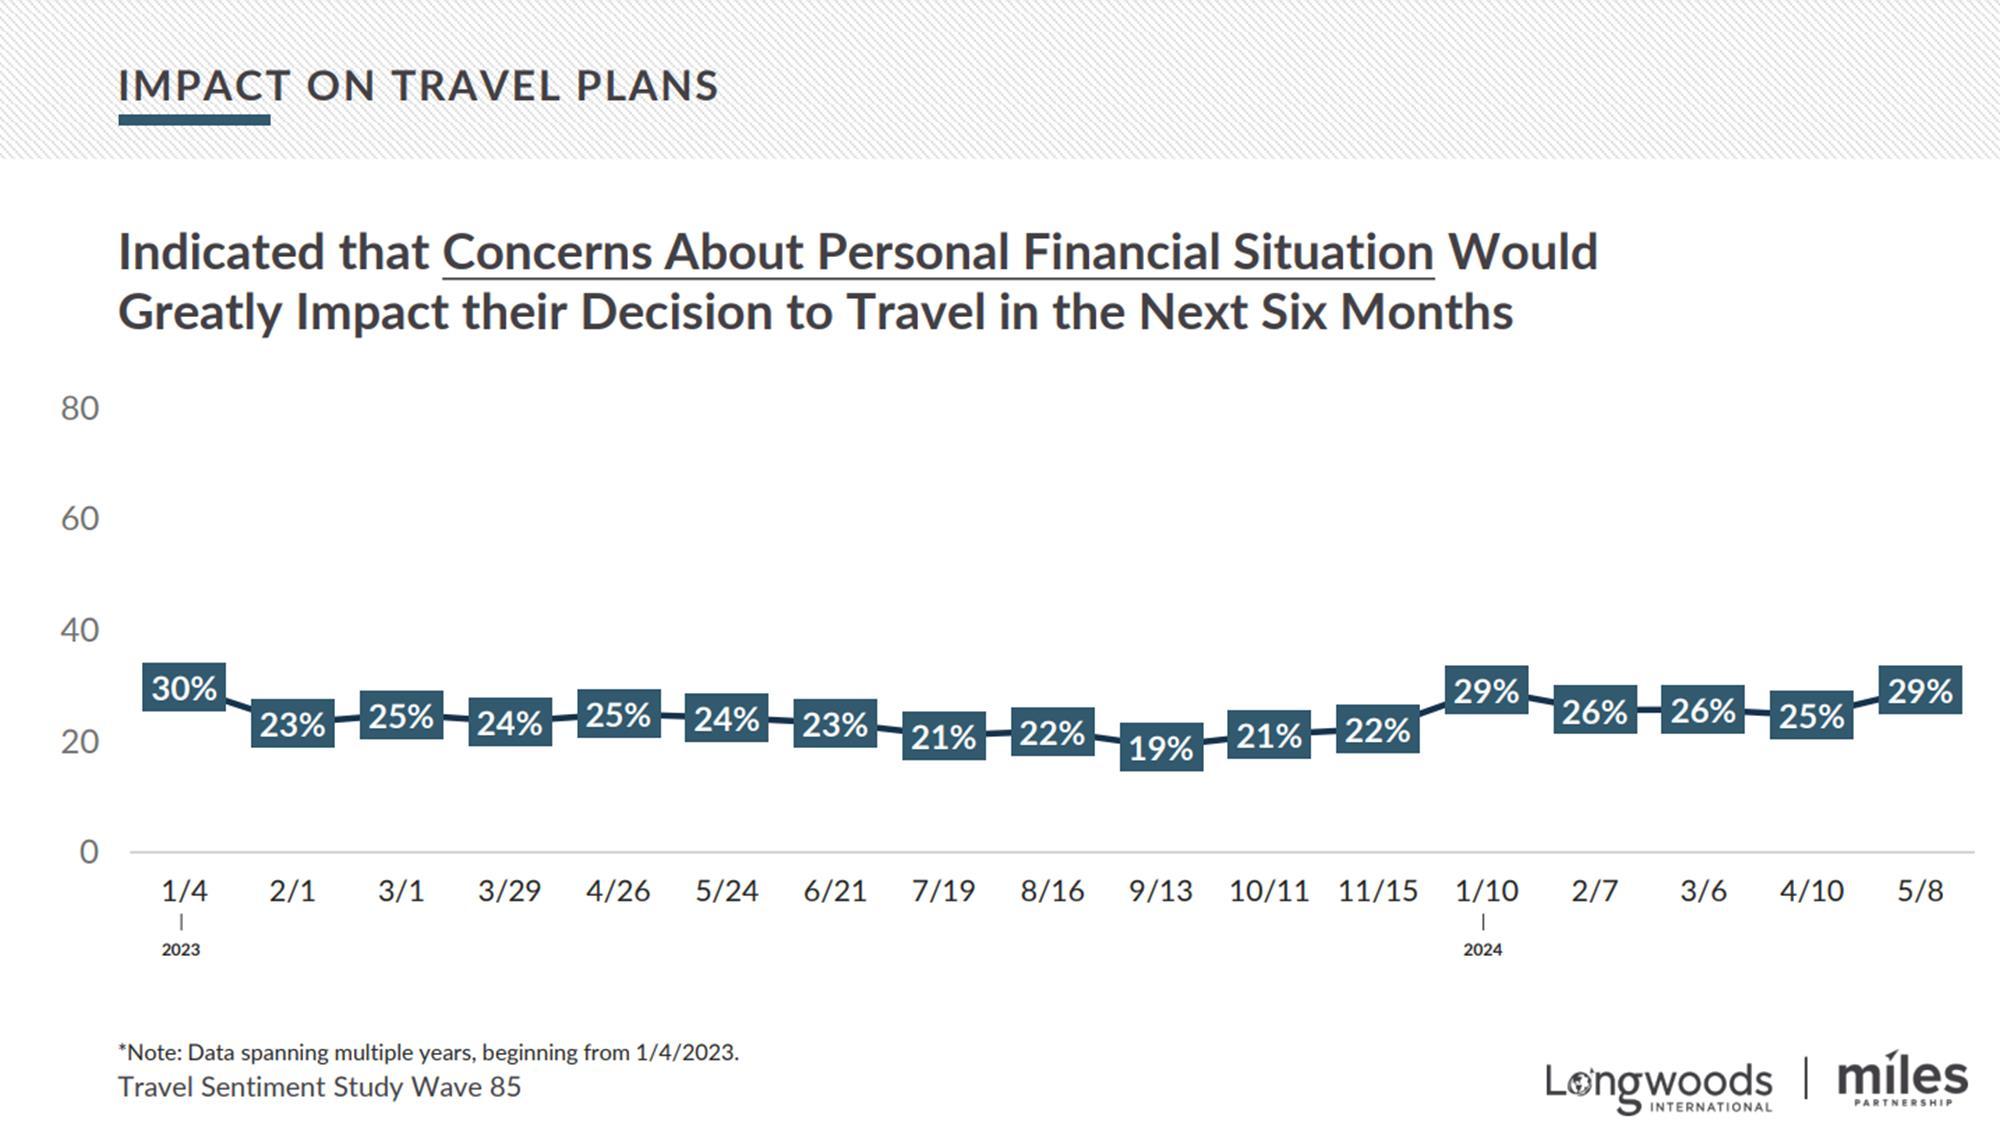
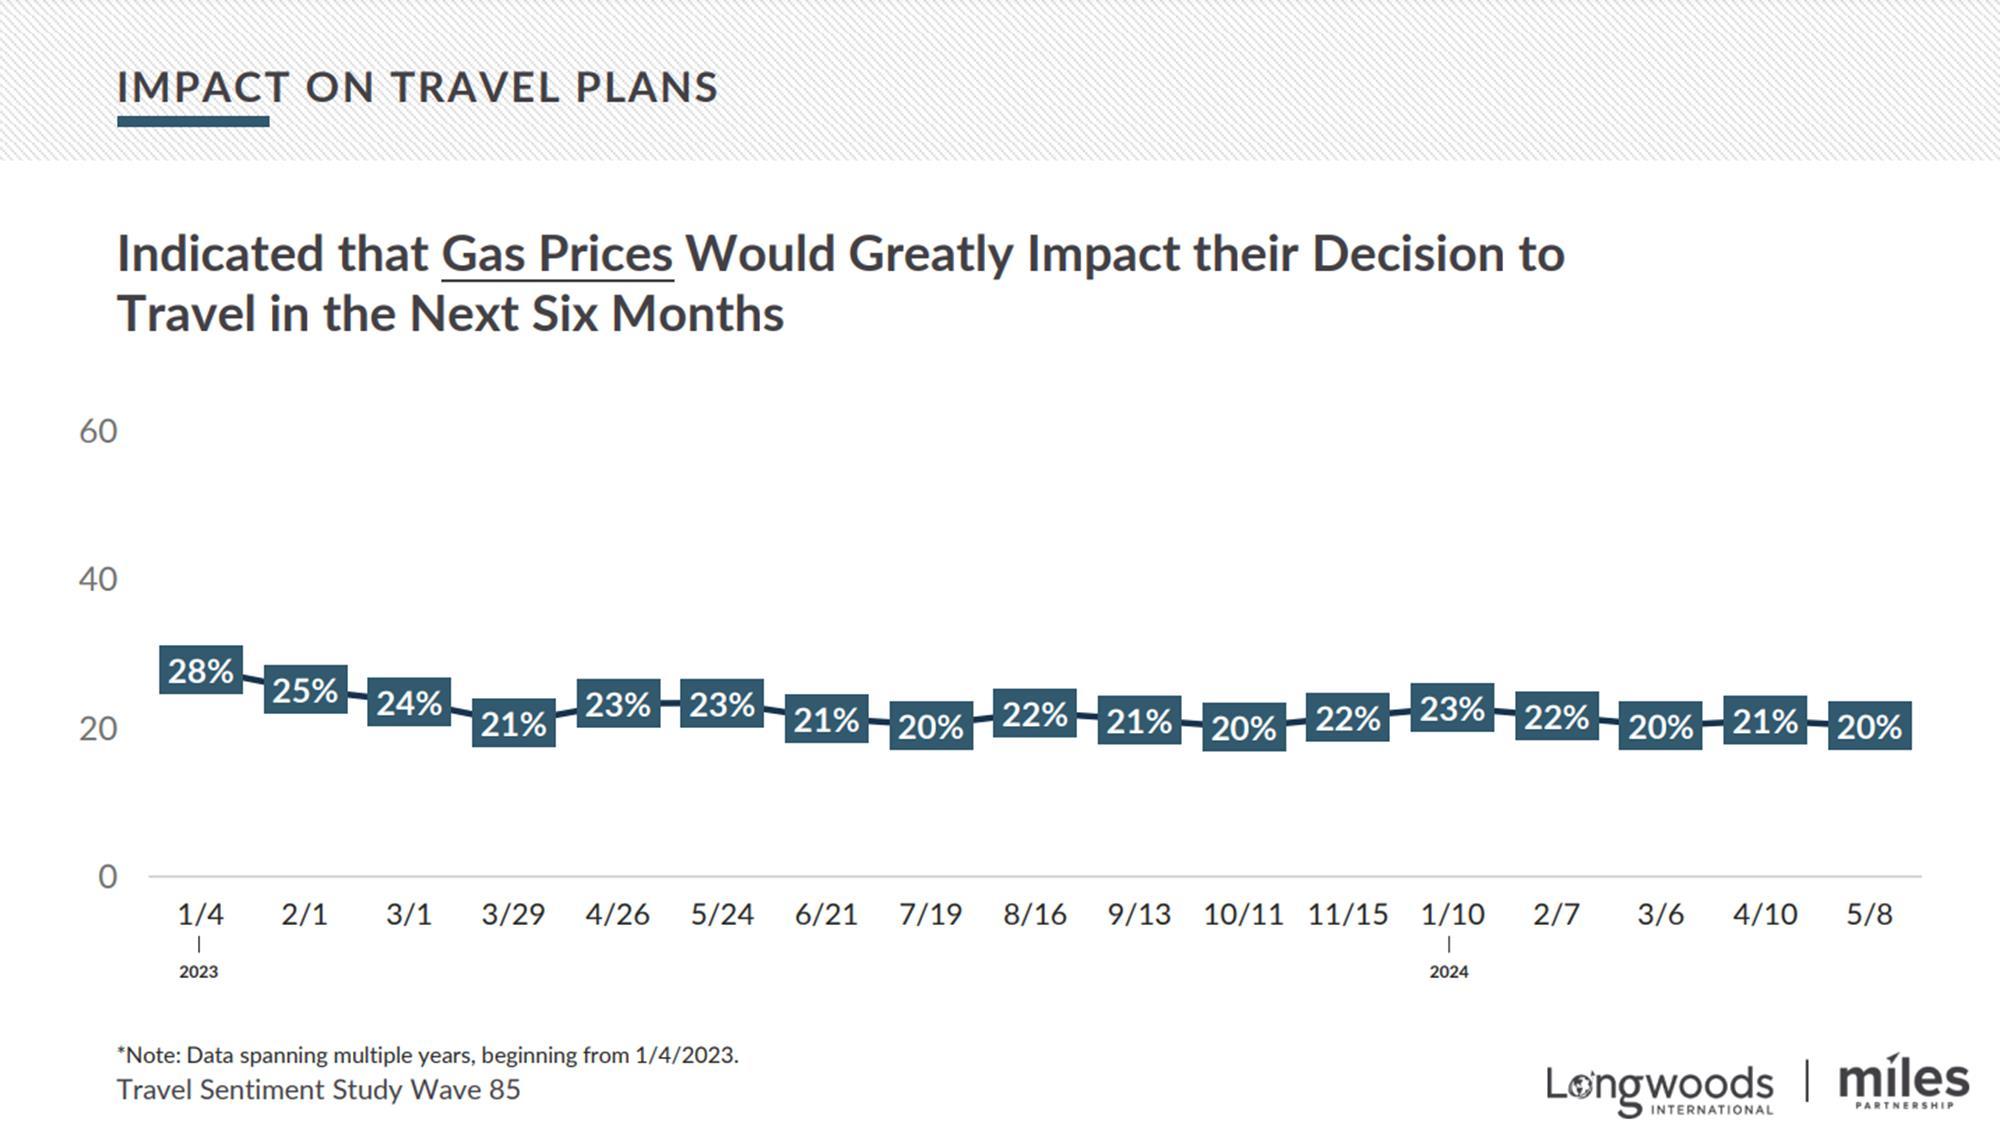
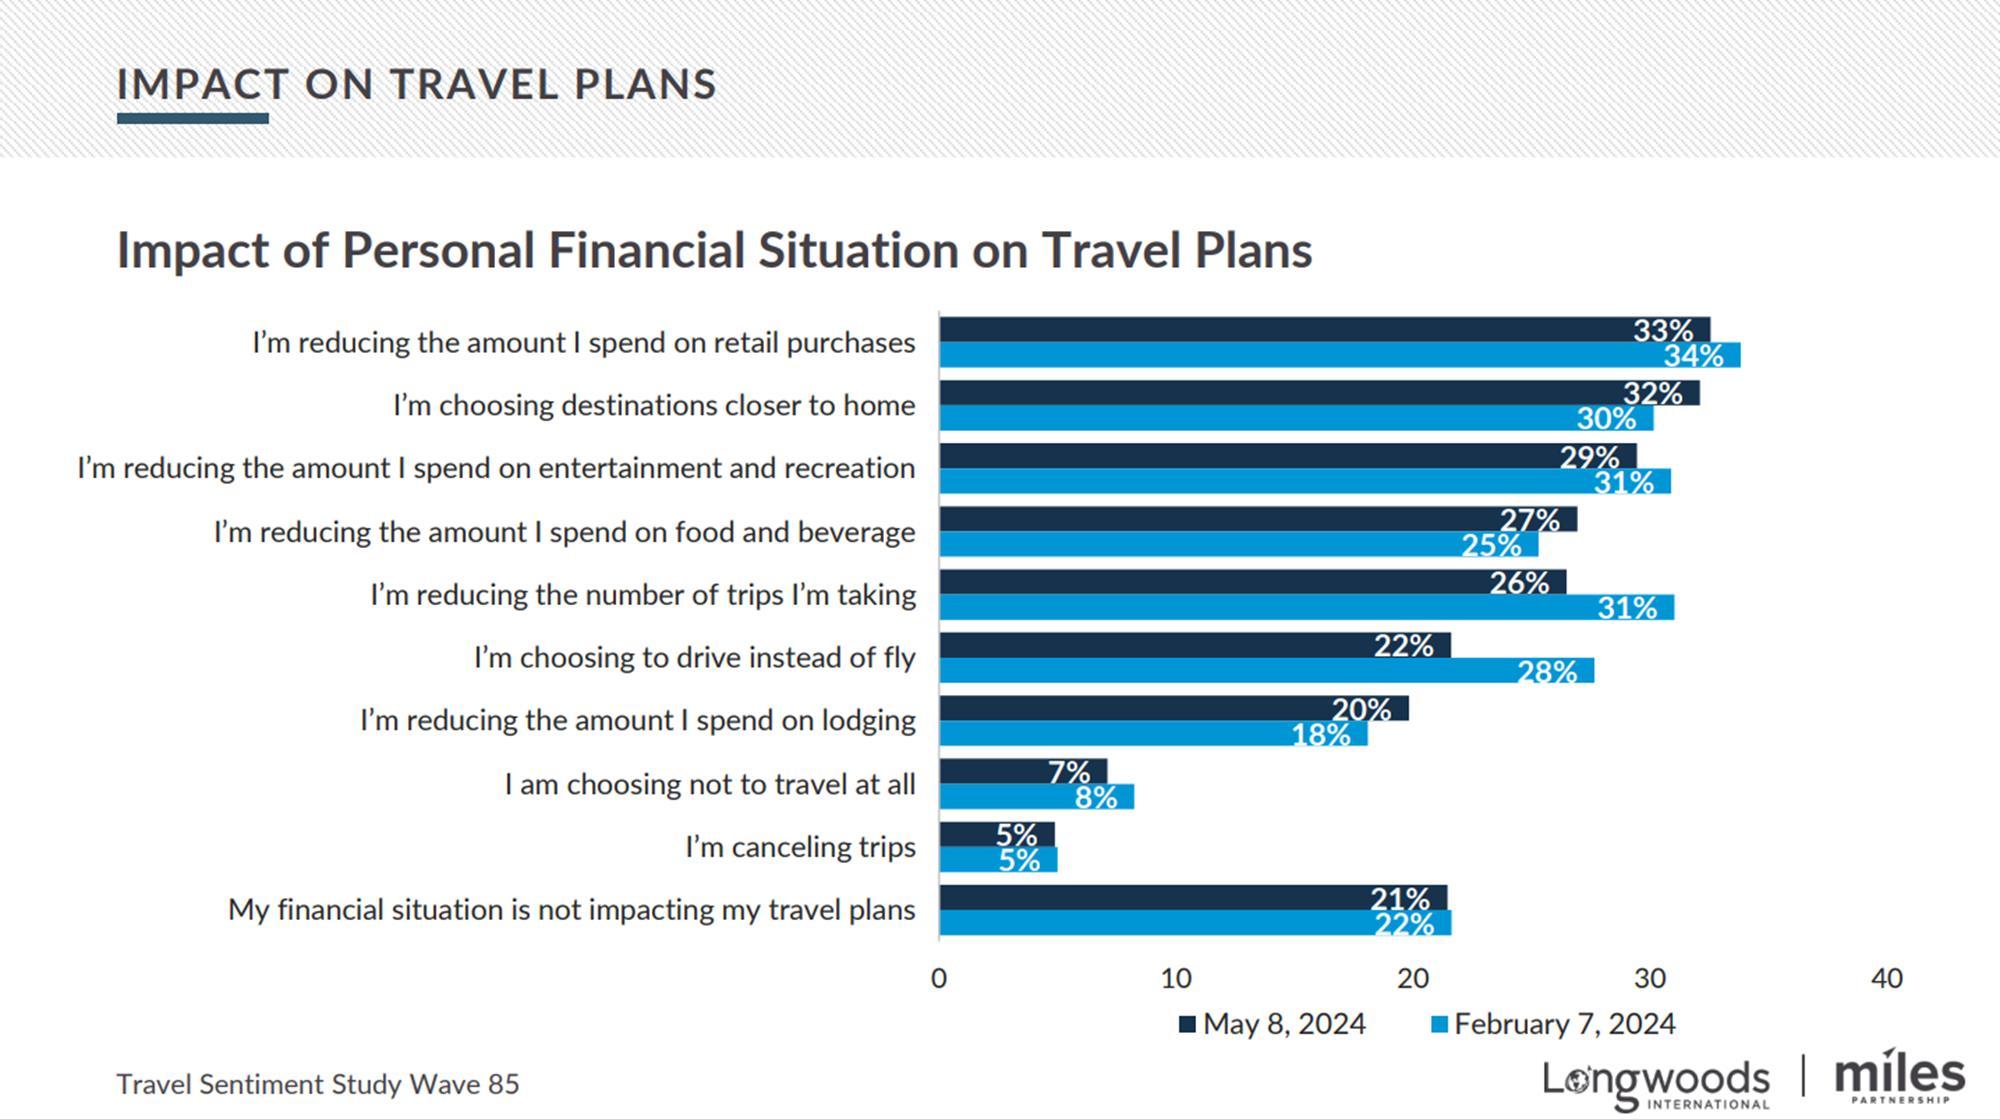
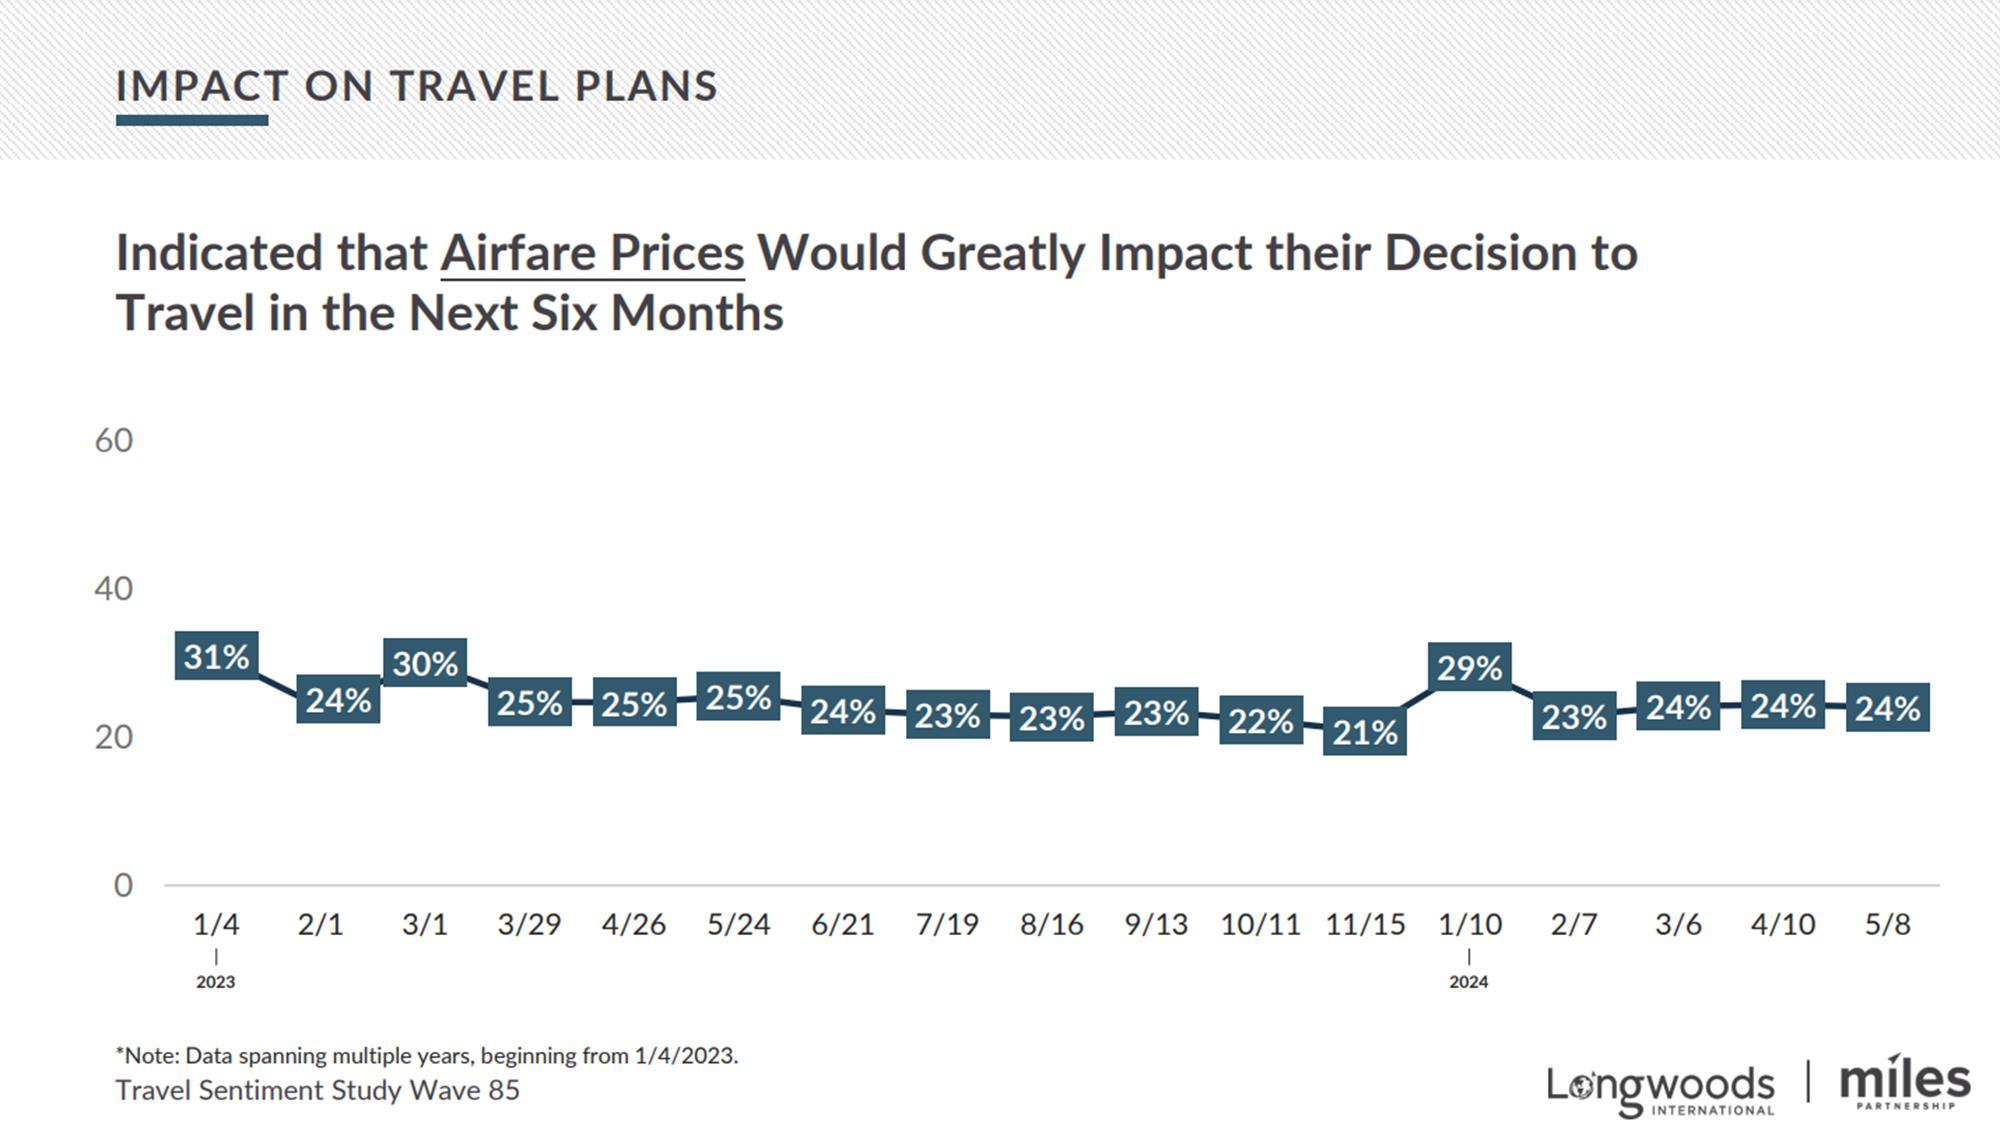
 Source: Longwoods International
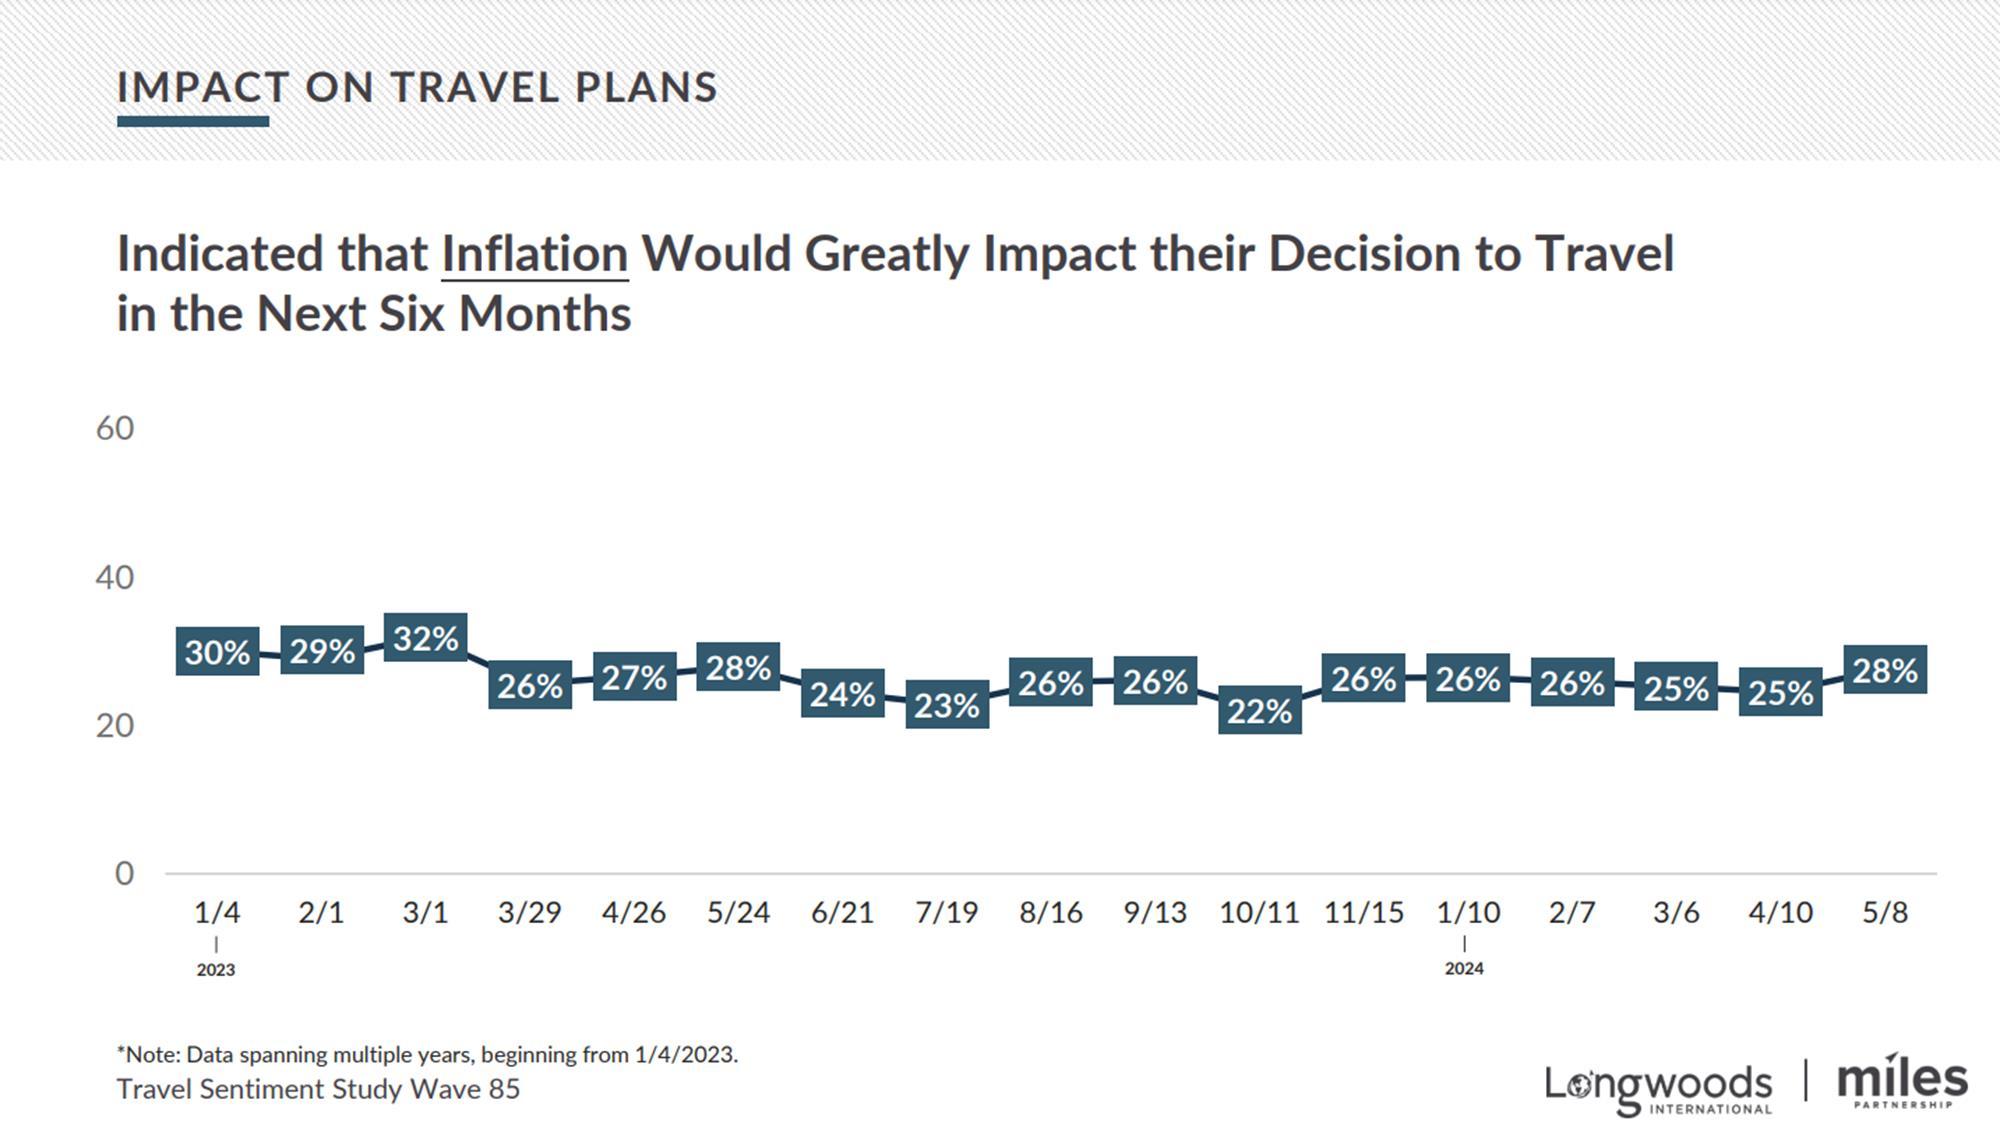
 Source: Longwoods International
 Source: Longwoods International
 Source: Longwoods International
 Source: Longwoods International
 Source: Longwoods International