
16 minute read
Choice-chains
ursula arens writer; nutrition & dietetics
Ursula has spent most of her career in industry as a company nutritionist for a food retailer and a pharmaceutical company. She was also a nutrition scientist at the British Nutrition Foundation for seven years. Ursula helps guide the NHD features agenda as well as contributing features and reviews
Advertisement
Information Sources: An R (2016). Beverage consumption in Relation to Discretionary Food intake and Diet Quality among US Adults, 2003 to 2012. Journal of the Academy of Nutrition and Dietetics 116, 28-37
does drinking more mean eating more? or do some drinks make you eat less? These questions of food and drink choice-chains need statistical uncoupling by measuring the gradients of population diet and drink intake patterns over time.
Thank goodness Professor Ruopeng An has both the brains and the stomach to unweave this messy tangle of dietary connections. His excellent analysis of drinks-links is presented in the January issue of The Journal of the Academy of Nutrition and Dietetics (An, 2016).
It seems that consumers of diet beverages and sugar-sweetened beverages (SSBs) are different not just in their drinks choices: they also make different food choices. And this is also the case for drinkers of coffee or alcohol. What you drink may couple with what you eat. Of course, coffee-and-cake or beer-andcrisps are matches: drinking coffee with crisps or beer with cake seem bizarre combinations. So would it be reasonable to predict that coffee drinkers consume more cake=sugars and beer-drinkers consume more crisps=salt?
Professor An examined beverage choices of more than 22,500 American adults from data collected from the National Health and Nutrition Examination Survey (NHANES), in the years 2003 to 2012. Two non-consecutive day intakes were assessed to give two-day average scores. What do American adults drink? Most (53%) had coffee, which was twice as likely a choice as tea (26%). SSBs were consumed by 43% of the sample, which was twice as likely a choice as diet beverages (21%). Which was very close to the number who had enjoyed one or more alcoholic drinks (22%). Not included within the score system were drink choices of water or milk in any form, or pure fruit juices. The five beverage types captured nearly all subjects - only 3% reported to be consuming none of these drinks over the two days captured. In contrast, less than 1% of thirsty respondents reported to be consuming all of these drinks categories.
The next issue was, if you consumed these beverage types, what were the daily kilocalorie contributions from these choices? Alcoholic drinks (beers, wines, liquors, etc) topped the ratings with more than 380kcals. SSBs also added nearly 300kcals to daily energy intakes. Then much lower down the scale, tea drinks provided nearly 70kcals, and coffee and diet beverages contributed tiny amounts of less than 20kcals. Although tea drinks would be expected to match coffee drinks in the UK diet (so, small amounts of energy contributed by additions of sugar and/ or milk), US tea drinking is often iced, sweetened and lemon flavoured, which makes it a more calorific choice than the classic cuppa.
Parallel to data on beverage intake, Professor An assessed intakes of discretionary foods. These are described as energy-dense, nutrientpoor food products that are not listed in the main food groups. They are not a necessary part of the diet, but can add diversity, and may be useful in small amounts by those who are physically active. Alphabetical examples include: cakes, chips, chocolates, cookies, fries, ice cream, muffins pies, popcorn and
waffles. There are more than 660 individual foods listed in this category in the NHANES survey form and, of course, most people reported consuming some of these foods over two days: on average, more than 480kcals worth daily.
Professor An also assessed overall diet quality scores using the Healthy Eating Index score (which matches diet intakes with the US national healthy eating guidelines). The average score was just under 50%, but interesting that weekday scores were 10 points better than weekend scores. This is another of many examples of food survey data showing differences in weekday versus weekend patterns, and the need to include weightings for this in the analysis of data.
There were some associations between beverage choices and total daily intakes of energy. Choosing to drink alcohol was again linked to the largest increase in energy intakes by more than 380kcals. SSBs boosted total energy intakes by more than 220kcals per day. Choices of coffee or of diet drinks or tea were linked to energy intakes of just over or 100kcals or less. The most interesting pattern was that choices of alcohol or tea resulted in energy intakes that matched beverage choice. So, for example, people who chose alcohol obtained about 380kcals from this source and total daily energy intakes increased by this amount. In contrast, diet drink or coffee consumers obtained less than 20kcals from their beverage choices and yet their energy intakes increased by 70 and 110kcals respectively. Coffee drinkers appear to consume on average 90kcals more of other linked foods. Only SSBs showed some substitution effect, so that total energy intakes were slightly lower that those provided directly by SBB consumption.
Looking only at energy intakes specifically from discretionary foods (aka ‘junk’ foods), coffeedrinking resulted in the largest increase daily of 60kcals. SSBs were linked to 30kcals daily and alcohol drinking had the lowest boost effect at about 20kcals. Intakes of energy from associated discretionary foods seem to be in almost perfect beautiful symmetry to the energy intakes from beverages. So, most kcals but least discretionary food intakes come with alcohol drinking, whereas least kcals but most discretionary food intakes are linked to coffee drinking, followed by diet beverages. The association between greater intakes of diet-beverage and greater kcal intakes from discretionary foods was highest in obese adults.
So, coffee-and-cake seems a stronger match than beer-and-crisps (to put picture to the data). Food and beverage intakes are not a zerosum game and there are compensation and substitution effects. Professor An concludes that healthy eating promotions need to consider the links between beverage choices and other food choices. But the psychology of choice, so that sacrifices demand the balance of reward and compensation, is often observed (“because my latte is skinny, my flapjack can be chocolatecovered”). These and many other aspects of food choice form the daily basis for the wise and supportive advice given by dietitians every day. And Professor An’s research is an excellent contribution to better understanding and supporting those we help.

From birth to discharge and beyond, the ESPGHAN-compliant1 Nutriprem range is designed to aid the development of preterm babies. For products that support feeding with breastmilk and contain ingredients to help babies thrive, choose Nutriprem.
maeve Hanan rd stroke specialist dietitian, city Hospitals sunderland, nHs
maeve works as a Stroke Specialist Dietitian in city Hospitals Sunderland. She also runs a blog called Dietetically Speaking.com which promotes evidencebased nutrition and dispels misleading nutrition claims and fad diets.
FooD lABellING: FoRTHcomING eU ReGUlATIoN AND UK GUIDelINeS
food labels are our main means of understanding what our food actually contains; which is really important in enabling us to make more informed and potentially healthier consumer choices. in order to improve the standard of food labelling consistently across europe, the eu Provision of food information for Consumers Regulation1 was adopted in 2011, with most of these legal requirements having become effective on 13th december 2014.
This article examines the implication of this Regulation and, in particular, the ‘nutritional declaration’ aspect which will become mandatory for the majority of food labels from 13th December 2016.
This Regulation sets out three fundamental requirements for food labelling:1 1. Food information shall not be misleading. 2. Food information shall be accurate, clear and easy to understand. 3. Food information shall not suggest that the food prevents, treats or cures a human disease.
mandatory inFormation For Food laBels: (see example, figure 1 overleaf) a. The name of the food b. The list of ingredients (generally listed in descending order of weight) c. Allergy information d. The quantity of certain ingredients or categories of ingredients e. The net quantity of the food f. The ‘best before’ or the ‘use by’ date g. Any special storage conditions and/ or conditions of use h. The name or business name and address of the food business operator i. The country of origin or ‘place of provenance’ (i.e. when production involves more than one country, this is the country where the primary ingredient comes from, or where the product underwent its last important stage of manufacturing) j. Instructions for use (where appropriate) k. The alcoholic strength documented as ‘alcohol’ or ‘alc’ followed by the
‘% vol’ (where beverages contain more than 1.2% by volume of alcohol) l. A nutrition declaration Note: Exemptions apply to specific types of glass bottles (only points (a), (c), (e), (f) and (l) are mandatory) and containers where the largest surface area is <10cm2 (only points (a), (c), (e) and (f) are mandatory); however the list of ingredients must be available via other means or upon request. Additional mandatory labelling requirements exist related to products such as: frozen meat or fish, products containing sweeteners, products with a high caffeine content, dried milk products, products in vending machines and alcoholic drinks.
allergen laBelling (see example, figure 2 overleaf) Since 13th December 2014, all products which contain any of the allergenic substances listed below are legally required to clearly specify these in the ingredients list and to highlight these through a typeset distinguished by font, style or colour.1 In cases where there is no ingredients list included, the label must state ‘contains’ followed by the allergens in question; unless the name of the product contains the allergen.
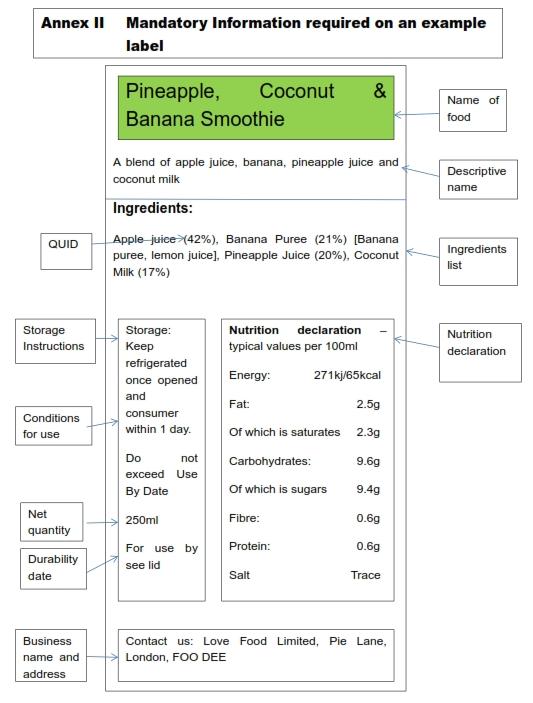
Quid: Quantitative ingredient declarations source: www.food.gov.uk/sites/default/files/fir-guidance2014.pdf
allergenic substances legally required to be clearly specified in the ingredients list
• Cereals containing gluten - wheat, oats, barley, rye, spelt, kamut or their hybridised strains • Crustaceans • Celery • Eggs • Mustard • Fish • Sesame seeds • Peanuts • Molluscs • Nuts - almonds, hazelnuts, walnuts, cashews, pecan nuts, Brazil nuts, pistachio nuts, macadamia nuts & Queensland nuts • Sulphur dioxide and sulphites at concentrations of more than 10mg/kg or 10mg/litre • Soybeans • Lupin • Milk
Figure 2: example allergy information

source: www.reading.ac.uk/foodlaw/label/allergens-guidance-brc-1.pdf
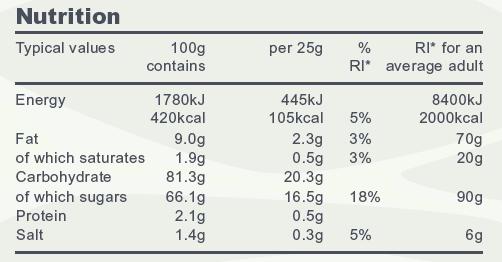
mandatory nutritional declaration1 From 13th December 2016 a ‘nutrition declaration’ (also referred to as ‘back of pack’ nutritional information) must be present on all food labels.1 Prior to this date (i.e. between 13th December 2011 and 12th December 2016) companies may include a voluntary nutritional declaration which must also comply with the regulation: a. The energy value declared in both kJ and kcal. b. The amounts of fat, saturated fat, carbohydrate, sugars, protein and salt declared in grams (although it may be stated if the salt content is due to naturally occurring sodium present in the product).
The nutritional content values are legally required to be given per 100g or 100ml; but in addition to this, the nutritional content may also be given: • Per portion or per consumption unit, or • As a percentage per 100g or 100ml (or per portion or consumption unit) in relation to the ‘reference intake of an average adult (8,400kJ/2,000kcal)’ if this is specifically stated. Note: the term ‘Reference Intake’ (RI) is to replace ‘Guideline Daily Amounts’ (GDAs).2 Figure 3: example: ‘toffee popcorn’
source: www.bhf.org.uk/publications/healthy-eating-and-drinking/thislabel-could-change-your-life
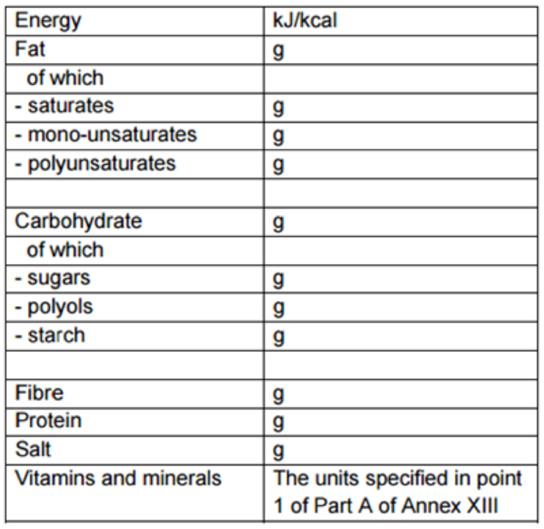
Food manufacturers may also decide to include some or all of these optional additions to the ‘back of pack’ nutritional declaration: a. monounsaturates b. polyunsaturates c. polyols d. starch e. fibre f. Specific vitamins or minerals when present in ‘significant amounts’ based on Nutrient
Reference Values (NRVs)
The set order of nutrients for the mandatory nutritional declaration; including the optional additional nutrients and the specified units of measurement is shown in figure 4.
Exemptions from the mandatory nutritional declaration:1 1. Alcoholic drinks containing >1.2% alcohol strength (where it is chosen to include a nutritional declaration it may be limited to the energy value or the energy value with the amounts of fat, saturates, sugars, and
salt. Alternatively, these values may be given on a ‘per portion/per consumption’ unit basis only, rather than per 100g or per 100ml 2. Unprocessed products made of a single ingredient; or where the only processing has been maturing that ingredient 3. Bottled water including those where the only added ingredients are flavourings and/ or carbon dioxide 4. Herbs/spices 5. Salt/salt substitutes 6. Table top sweeteners 7. Certain coffee and chicory extracts, whole or milled coffee beans (including decaffeinated coffee beans) 8. Herbal and fruit infusions, tea, decaffeinated tea 9. Fermented vinegars/vinegar substitutes 10. Flavourings, food additives, processing aids, food enzymes 11. Gelatine, jam setting compounds 12. Yeast 13. Chewing-gums 14. Food labels where the largest surface area is <25cm2 15. Food supplied in small quantities to local retailers directly from the manufacturer (e.g. handcrafted food)
‘PrinciPle Field oF vision’ or ‘Front oF Package’ laBelling This refers to all surfaces that can be read from one specific viewing point; but for ease, I will refer to this as ‘front of pack’ (FoP) labelling. Roughly 80% of processed foods contain some form of FoP labelling.3 As long as the food label contains the mandatory nutrition declaration (i.e. the ‘back of pack’ label), the following information can be repeated on the FoP on a voluntary basis:1 a. The energy value, or b. The energy value and the amounts of fat, saturates, sugars, and salt. In this case, the values given for the nutrients except for energy may be given per portion or per consumption unit only. However, the energy content must be provided per 100g or 100ml as well as per portion or per consumption unit. Figure 5: example ‘Front of Package’ labelling
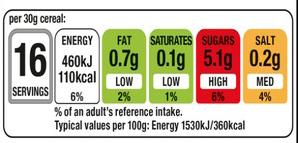

source: www.gov.uk/government/uploads/system/uploads/attachment_ data/file/300886/2902158_FoP_nutrition_2014.pdf
standardisation oF FoP laBelling Despite the finding from the Food Standard Authority in 2009 that ‘standardising to just one label format would enhance use and comprehension of front of package labels’,4 the new nutritional declaration guidelines don’t specify the exact format which should be used for voluntary FoP labelling. Therefore, in June 2013, as a result of a joint consultation held in January 2013 which included input from the main food production stakeholders in the UK,3 a guide was produced outlining the information which should be included on a FoP label:2 • The energy value in kJ and kcal per 100g/100ml and in a specified portion of the product. • The amounts of: fat, saturated fat, total sugars and salt provided in grams in relation to a specified portion of the product. • Portion size expressed in a way which is easily recognisable by, and useful to the consumer, e.g. ¼ of a pie or 1 burger. • % Reference Intake (RI) based on the amount of each nutrient and energy value in a portion of the food. • Colour coding of the nutrient content of the food (with an option to include the descriptors
‘High’, ‘Medium’ or ‘Low’ along with the respective colours red, amber or green).
Figure 6: example standard FoP labelling
source: http://heartresearch.org.uk/heart/green-light-food-labelling
How useFul do consumers Find FoP Food laBels? In 2009, the Food Standards Agency released a report on the ‘Comprehension and Use of UK Nutrition Signpost Labelling Schemes’.4 This included a combination of qualitative research (accompanied shops and shopping bag audits) and quantitative research (surveys and interviews, whereby the main survey consisted of 2,932 consumers), which found that a food label which combined text (i.e. ‘high’, ‘medium’ and ‘low’), traffic light colours and %RI was the most user-friendly and bestliked labelling scheme.
This study also indicated that older adults (i.e. those over 65), people with lower levels of education, those from a lower social demographic and certain minority ethnic groups were more likely to have difficulty interpreting FoP labels. Consumers who were shopping for children, those with a medical condition (or a family history of a medical condition), or those trying to lose weight, were found to be more likely to read FoP labels. The main medical conditions identified as having an effect on use of FoP labels were: diabetes, heart disease, hypertension, hypercholesterolemia and coeliac disease. It was found that each group tended to
look at the most relevant nutrients related to their condition; e.g. consumers with diabetes were most likely to check the sugar content.
HealtH claims Although the regulation states that ‘Food information shall not suggest that the food prevents, treats or cures a human disease’, there are some legal exemptions which exist related to foods with particular nutritional uses, such as infant formula. However, if a food supplement claims to have a medicinal effect, it must be licensed under medicines legislation (MHRA).5
Specific nutritional claims which are permitted for use with food products must comply with EU regulations No 1924/20066 and No 1047/2012.7
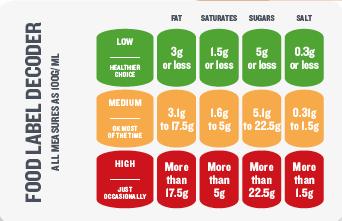
For example, a food can claim to be ‘low fat’ if it contains no more than 3.0g of fat per 100g for solids or 1.5g of fat per 100ml for liquid; or a food can be marketed as ‘high fibre’ if it contains at least 6.0g of fibre per 100g or at least 3.0g of fibre per 100kcal.6,7 These regulations also set the criteria for the reference ranges used for the traffic light labelling scheme (not including fibre).
Figure 7: example BHF Food label decoder
source: www.bhf.org.uk/publications/healthy-eating-and-drinking/thislabel-could-change-your-life. summary oF key Points The ‘EU Provision of Food Information for Consumers Regulation’ sets out the legal requirements which food manufacturers must abide by in relation to food labelling. This includes specific guidance on nutritional factors such as allergen information; and from 13th December 2016, it will be mandatory for the majority of food labels to include a specific ‘nutritional declaration’ which includes: the energy content declared in both kJ and kcal and the amounts of fat, saturated fat, carbohydrate, sugars, protein and salt declared per 100g or per 100ml.
As an addition to this mandatory nutritional declaration, food products may also contain a FoP label which includes: the energy value in kJ and kcal per 100g or 100ml and in a specified portion of the product; the amounts of fat, saturated fat, total sugars and salt in relation to a specific portion of the product, the % RI of each nutrient and energy value per portion of the product and traffic light colour coding.
The forthcoming nutritional declaration requirements will hopefully improve the quality, consistency and clarity of food labels to help our patients and the general public make more informed food choices.
References 1 Regulation (EU) 1169/2011 (http://eur-lex.europa.eu/legal-content/EN/ALL/?uri=CELEX%3A32011R1169) 2 Guide to creating a FoP nutrition label for pre-packed products sold through retail outlets (www.gov.uk/government/uploads/system/uploads/ attachment_data/file/300886/2902158_FoP_Nutrition_2014.pdf) 3 FoP Nutrition Labelling: Joint Response to Consultation (www.gov.uk/government/uploads/system/uploads/attachment_data/file/216997/responsenutrition-labelling-consultation.pdf) 4 Comprehension and use of UK nutrition signpost labelling schemes (http://webarchive.nationalarchives.gov.uk/20131104005023/http://www.food.gov. uk/multimedia/pdfs/pmpreport.pdf) 5 Summary information on legislation relating to the sale of food supplements (www.gov.uk/government/uploads/system/uploads/attachment_data/ file/204303/Supplements_Summary__Jan_2012__DH_FINAL.doc.pdf) 6 Regulation (EC) No 1924/2006 (http://eur-lex.europa.eu/legal-content/en/ALL/?uri=CELEX:32006R1924) 7 Regulation (EU) No 1047/2012 (http://eur-lex.europa.eu/legal-content/EN/TXT/?uri=CELEX:32012R1047) 8 Food Labelling in the UK: A Guide to the Legal Requirements (www.reading.ac.uk/foodlaw/label/index2.htm)


