RENIA


Renia Kagkou works at the intersection of geospatial analysis and GIS, design and urban planning, mapping, and visual narration.
She is currently a Senior Solution Engineer at Esri's AEC (Architecture, Engineering, Construction) team, where she consults Planning and Urban Design firms on workflows that integrate geospatial analysis in their design and planning processes. She supports firms with leveraging these workflows for tasks such as analysis and visualization of existing conditions and dynamics, scenario testing, and impact assessment. She also supports product development and creates visual material, blogs, presentations, and demos for knowledge transfer and outreach.
She holds a Master of Architecture in Urban Design (MAUD) and a Master of Design Studies in Urbanism, Landscape, and Ecology (MDes ULE) from Harvard GSD (2018), and a Bachelor of Architecture from Pratt Institute, New York (2014).
01
02
03
"Biomass Geographies" | Wood Urbanism "Planetary Bottlenecks" | DOMUS Magazine
RESEARCH & PROJECTS
Is Pacific Limitless[ed]? | Urban Theory Lab Water Stress | Graduate Project Agricultural Geographies | Graduate Research
SPATIAL ANALYSIS
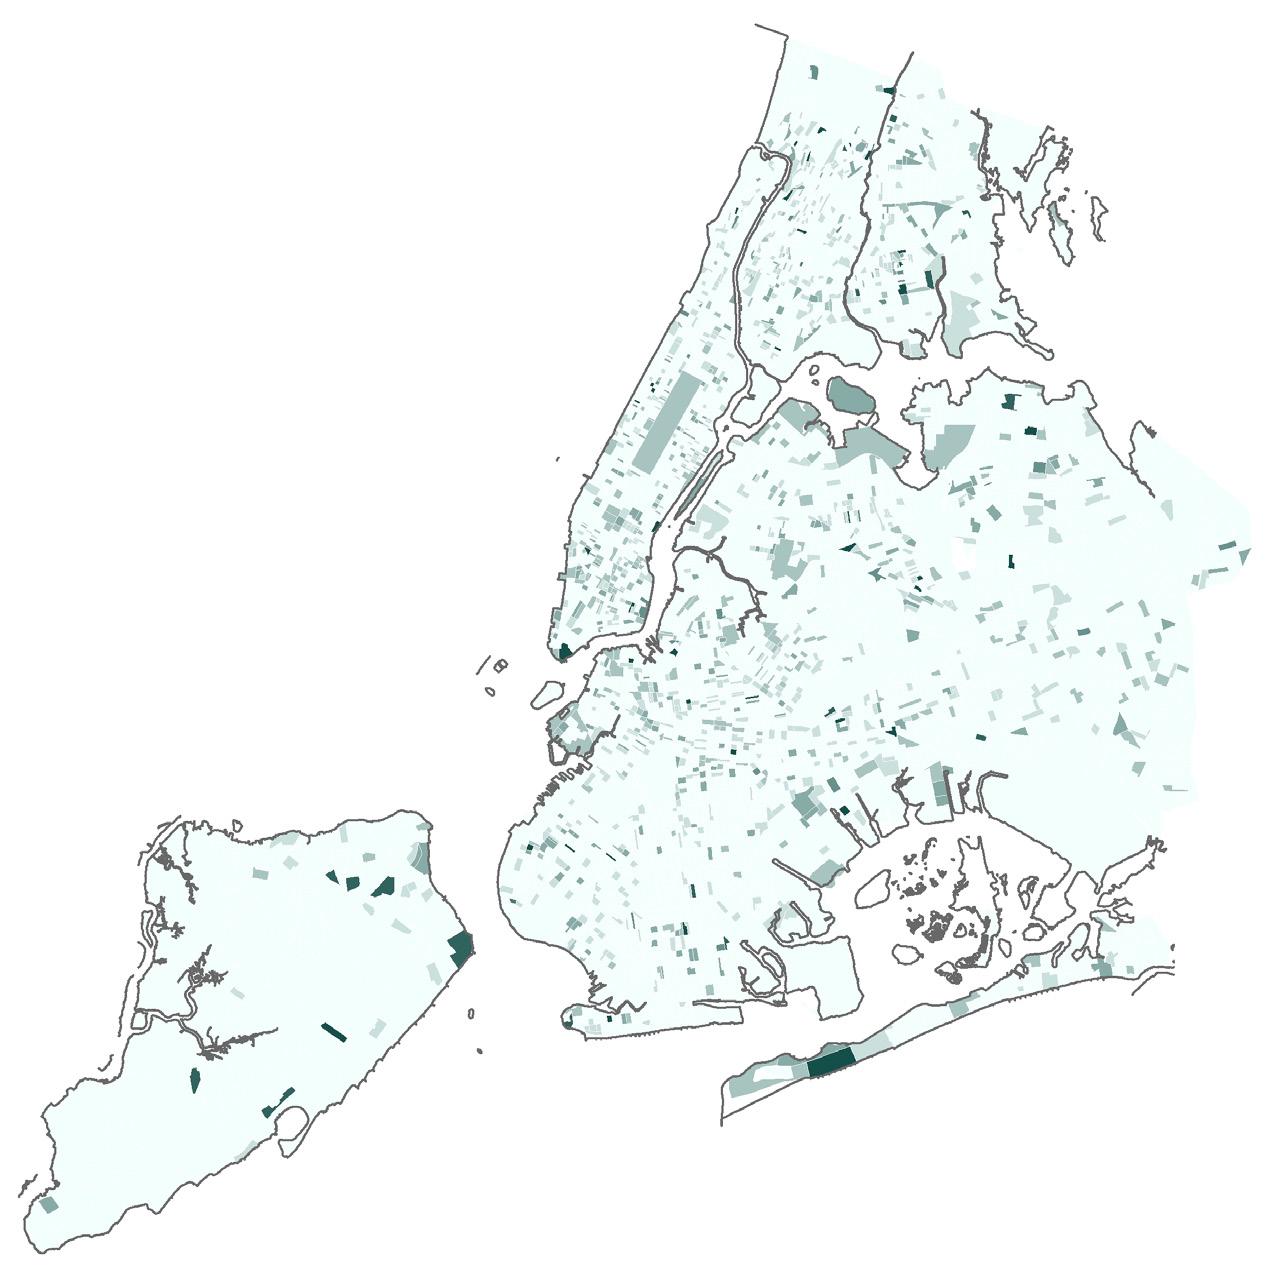
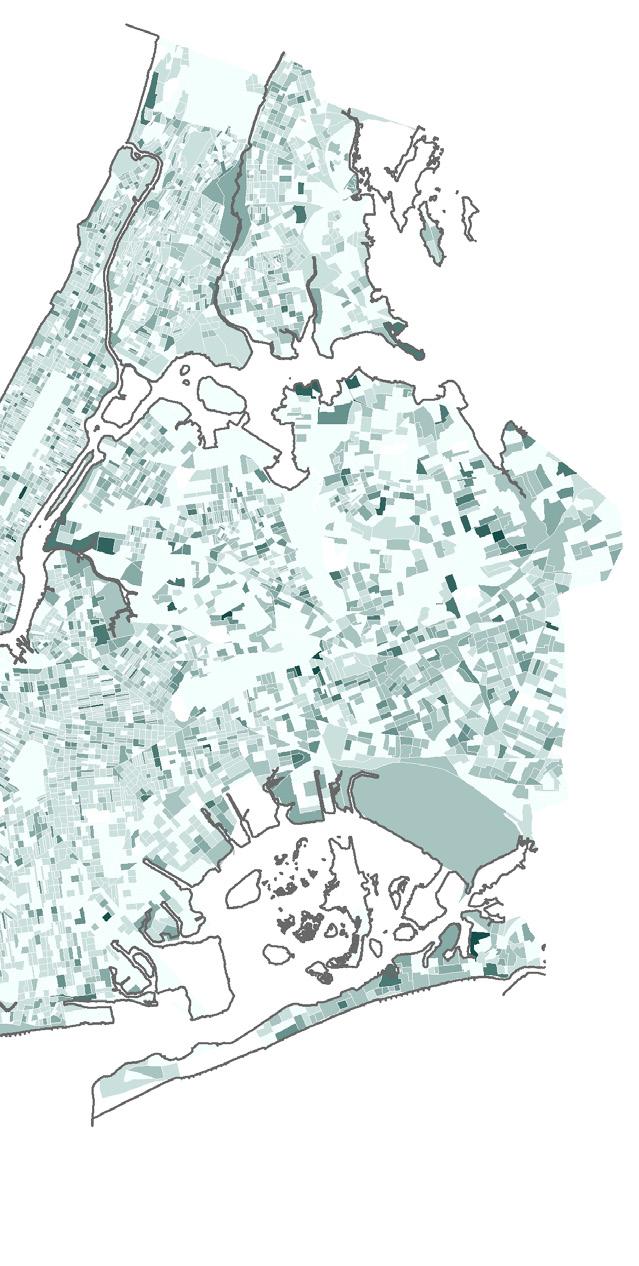
Inequality in NYC | Graduate Course
CARTOGRAPHY PUBLICATIONS p.4 - p.7 p.16 - p.19 p.30 - p.33
Metro-Boston Rent Analysis | Graduate Course Integrative Manhattan | Graduate Poject
p.8 - p.15 p.20 - p.23 p.34 - p.37
p.24 - p.29 p.38 - p.43
2019
In Daniel Ibañez, Jane Hutton and Kiel Moe (ed) Wood Urbanism: From the Molecular to the Territorial, (December 2019, Actar)
Renia Kagkou and Daniel Ibañez
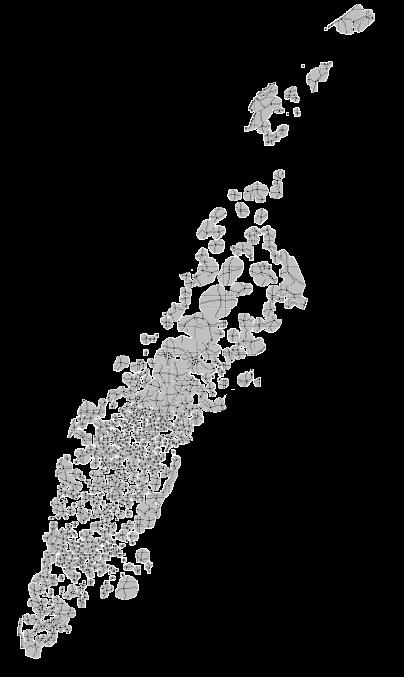
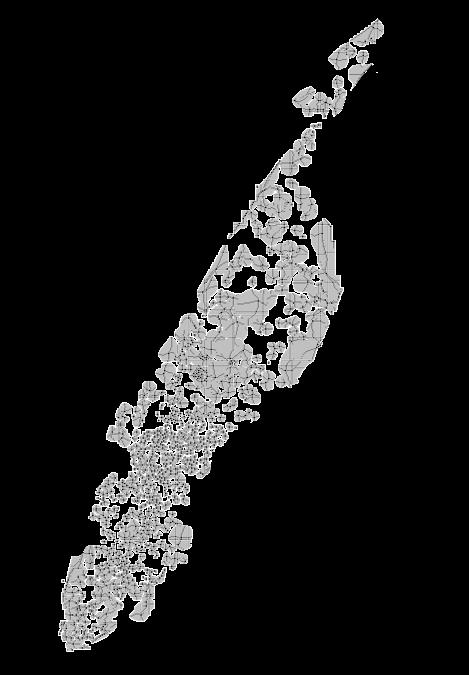
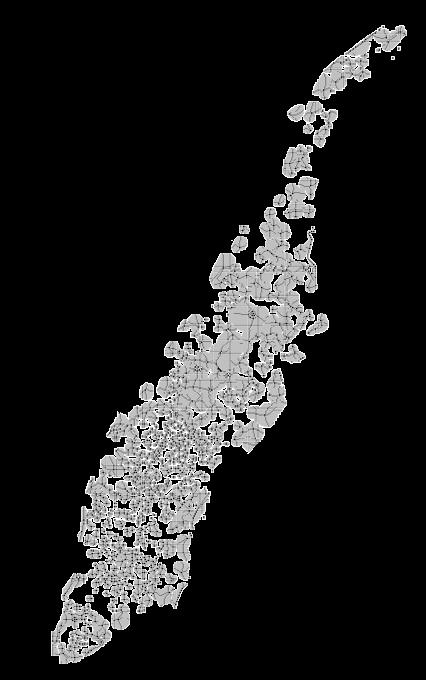
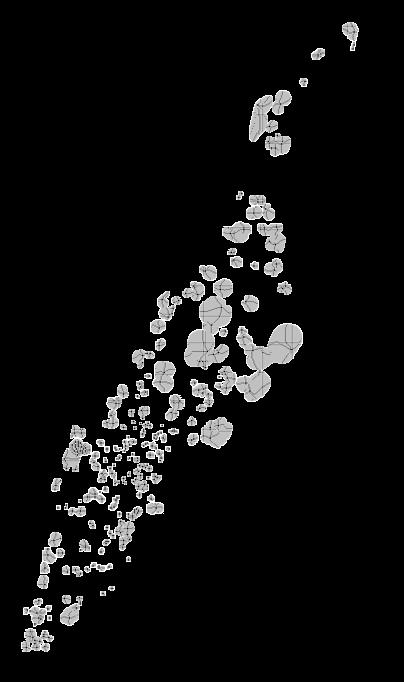
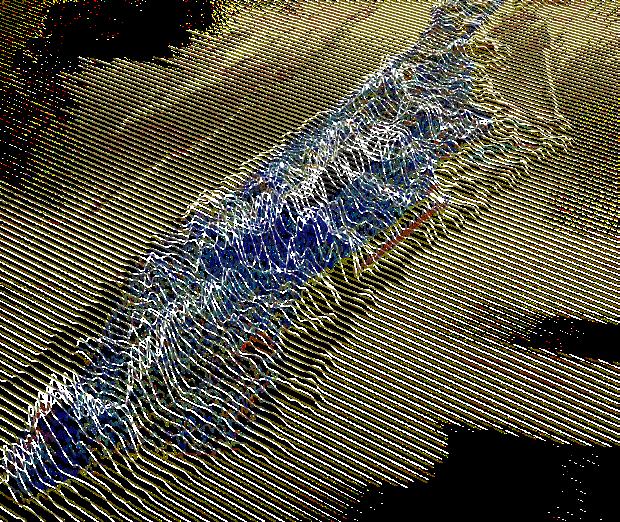
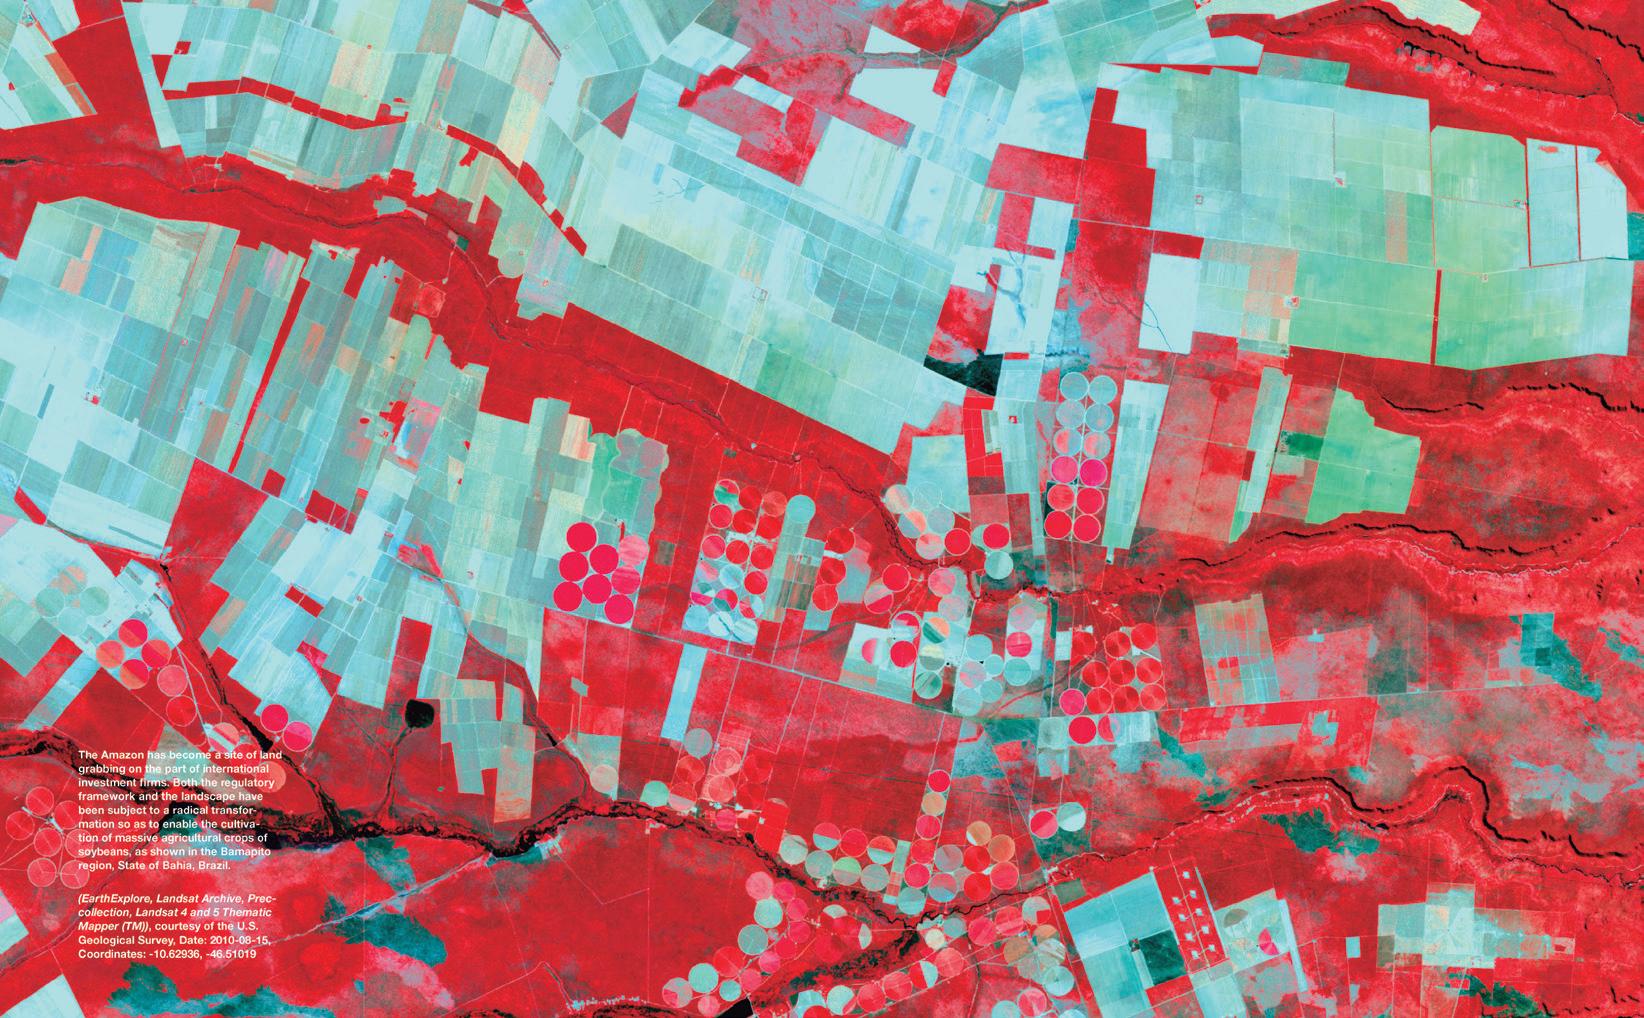
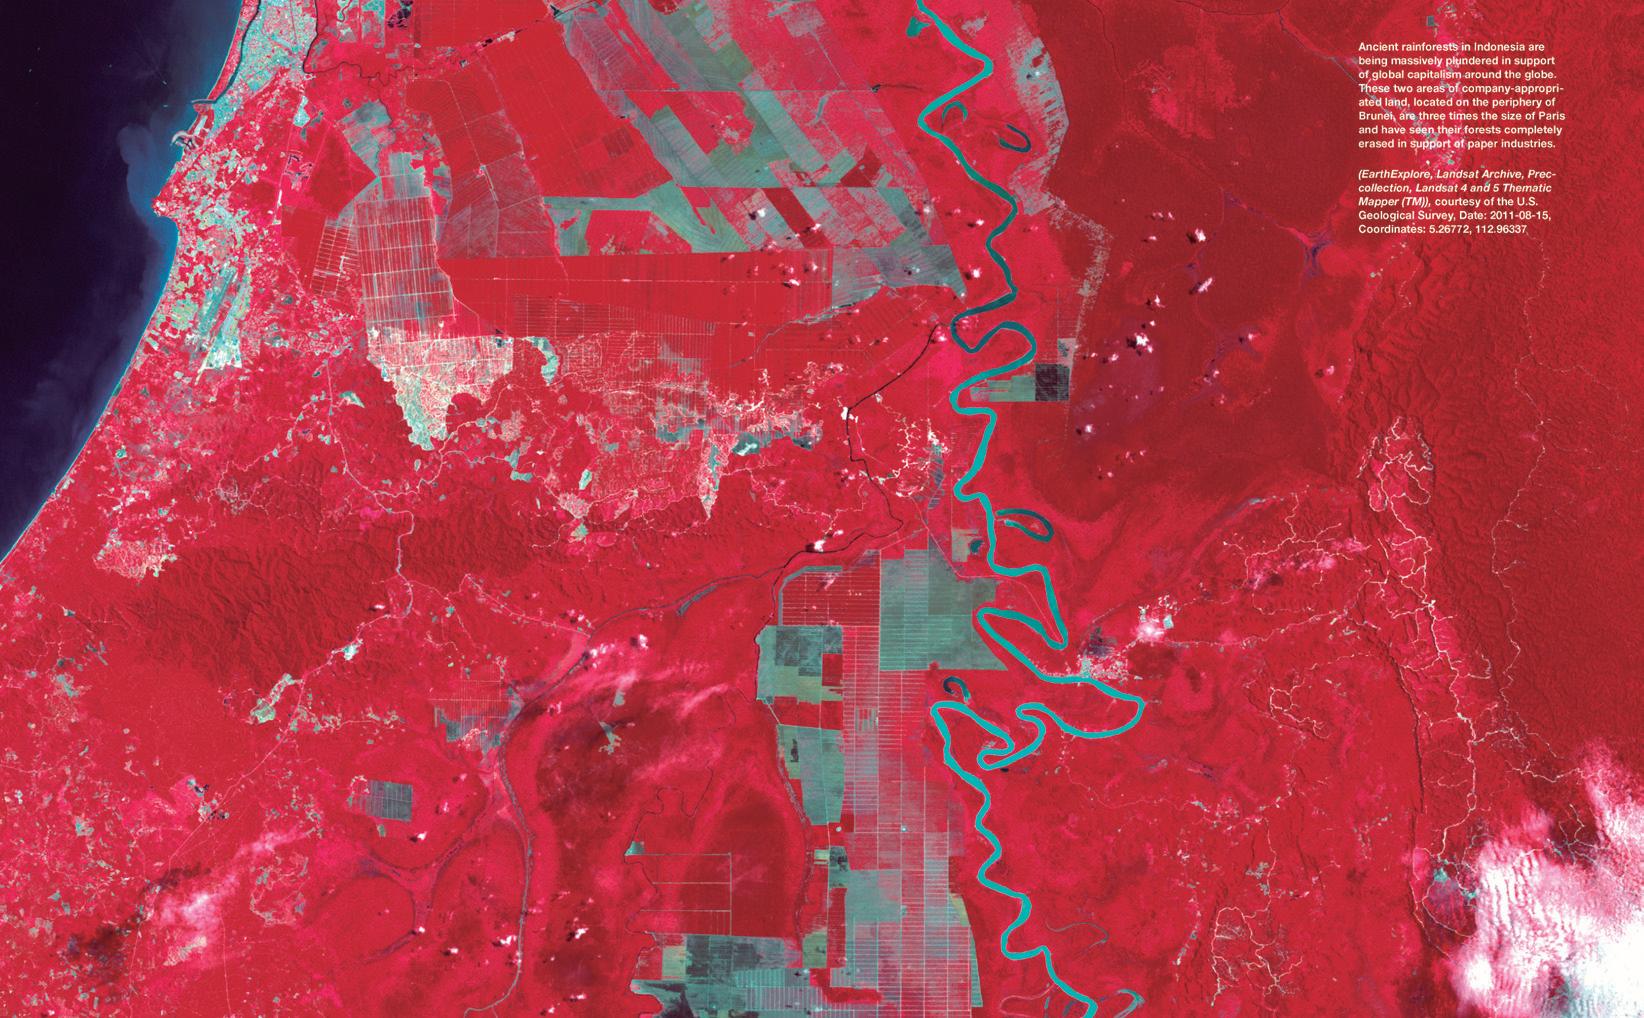
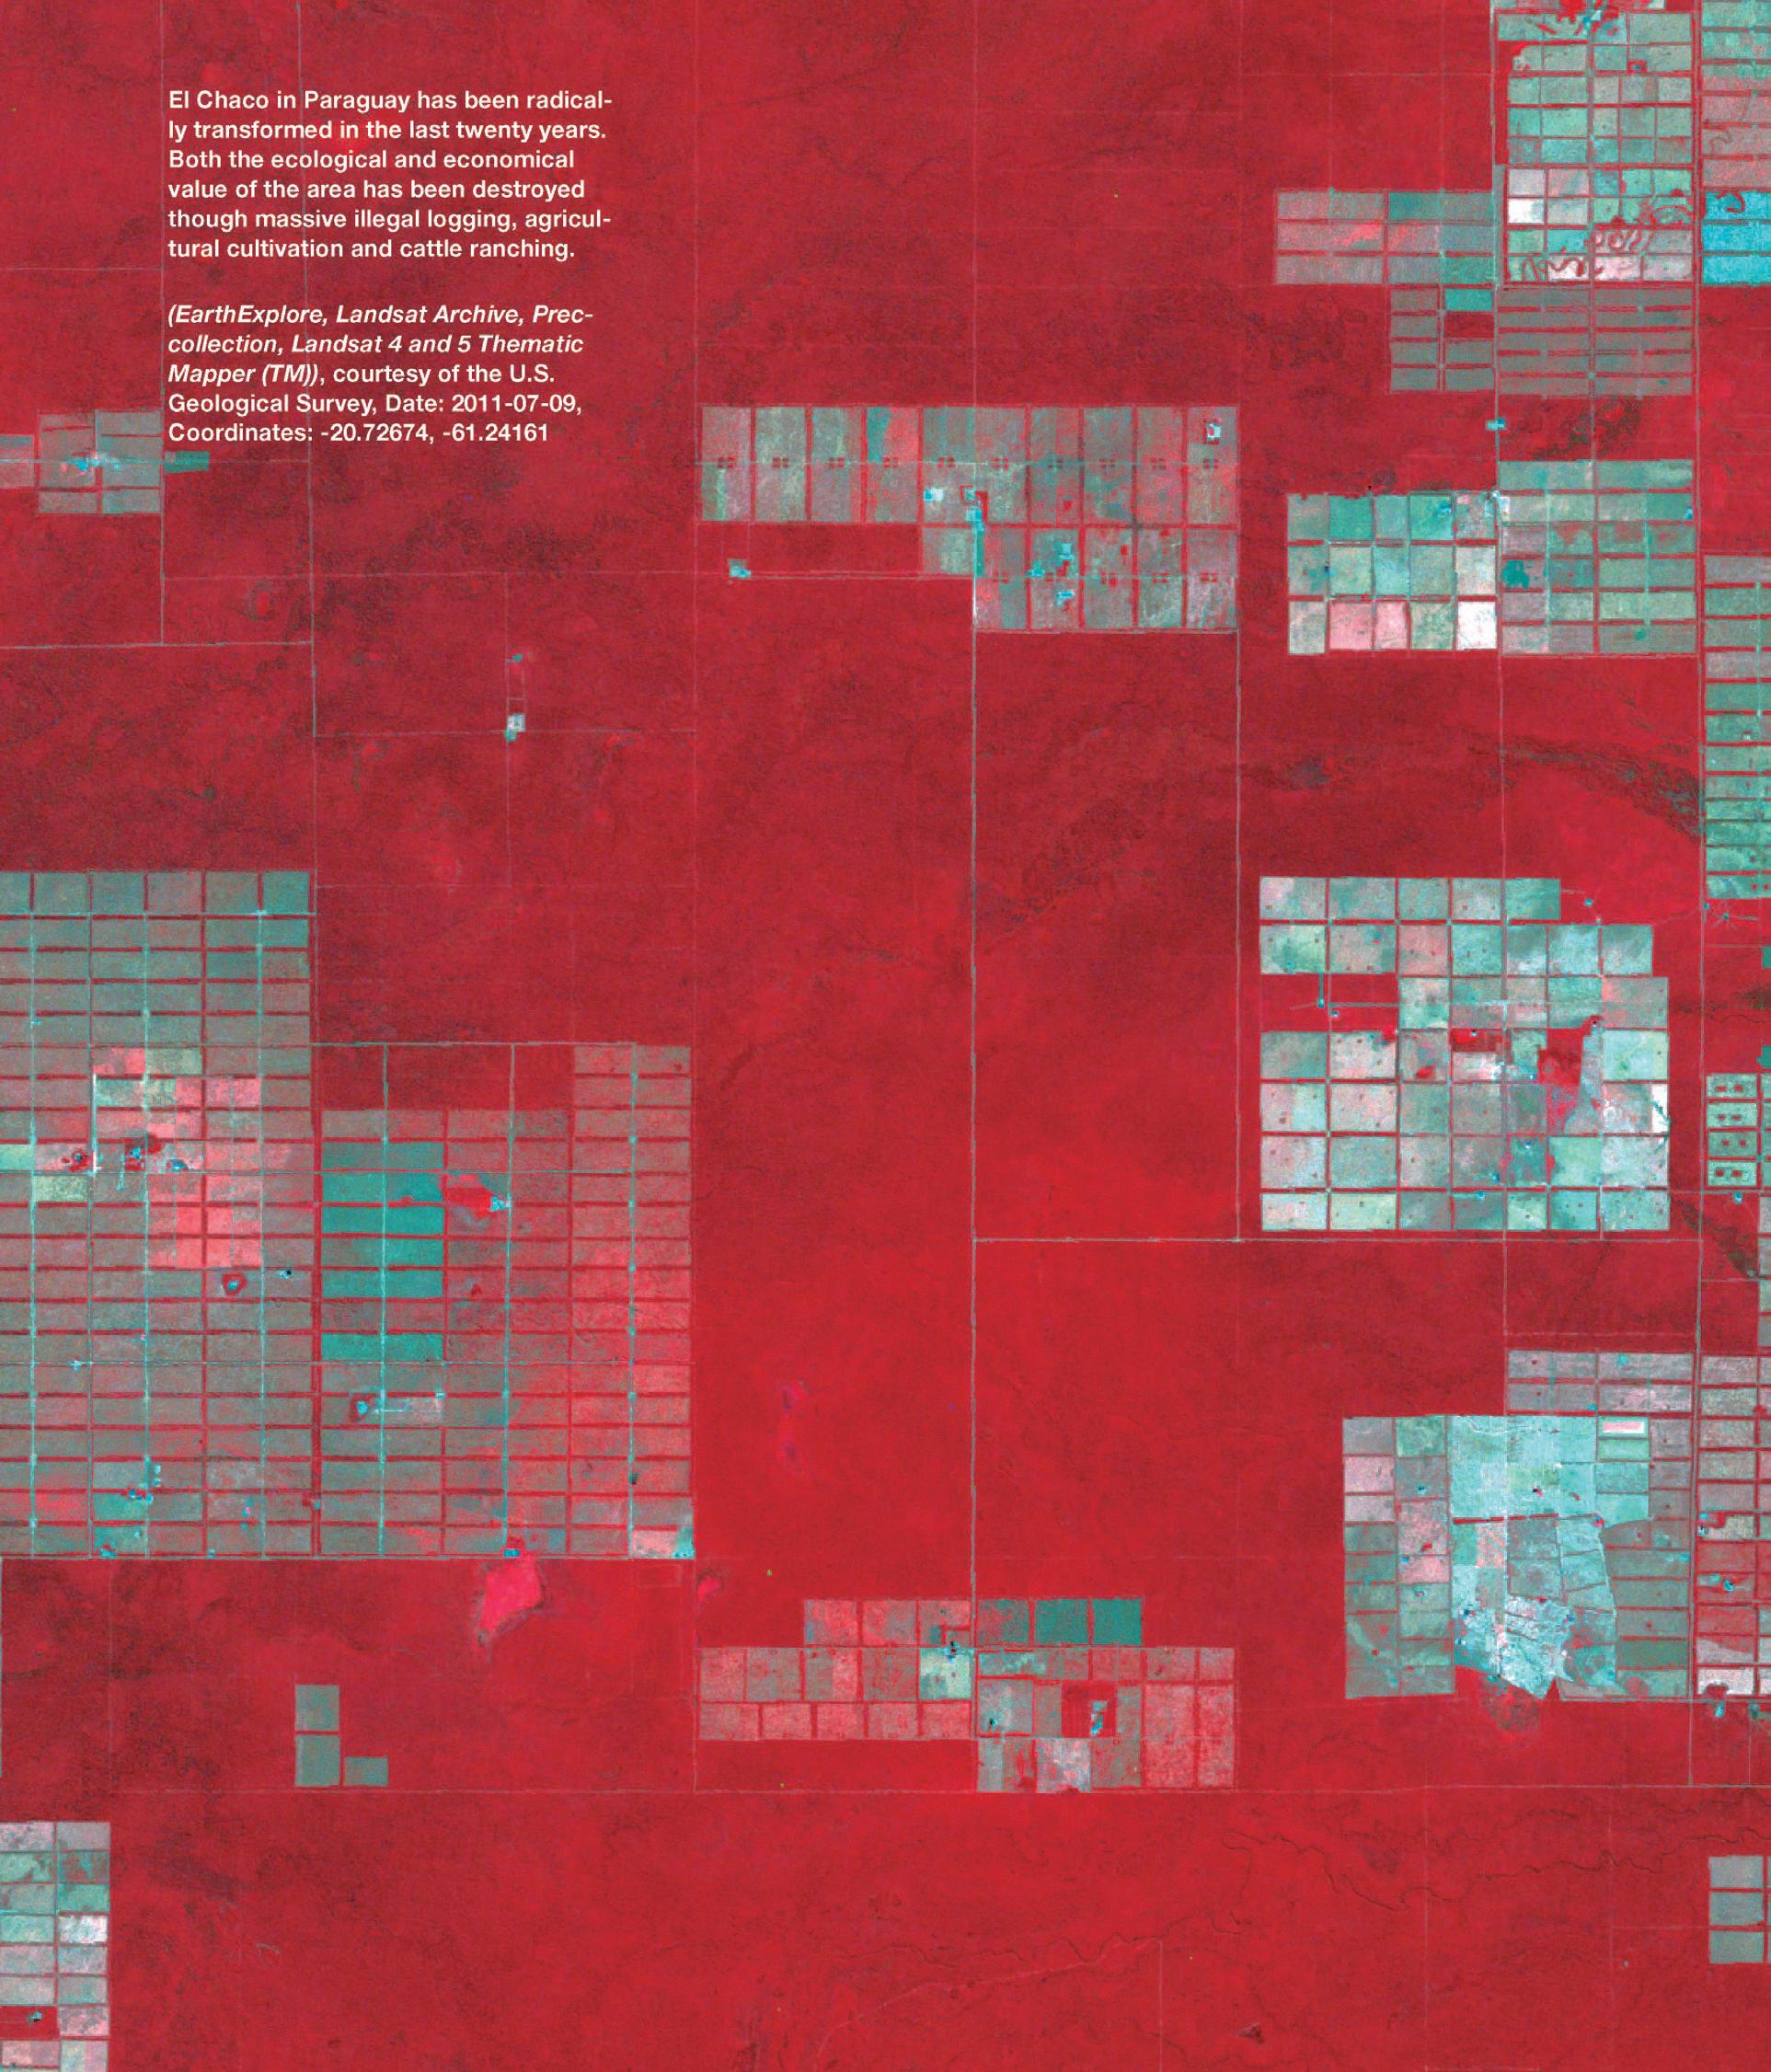
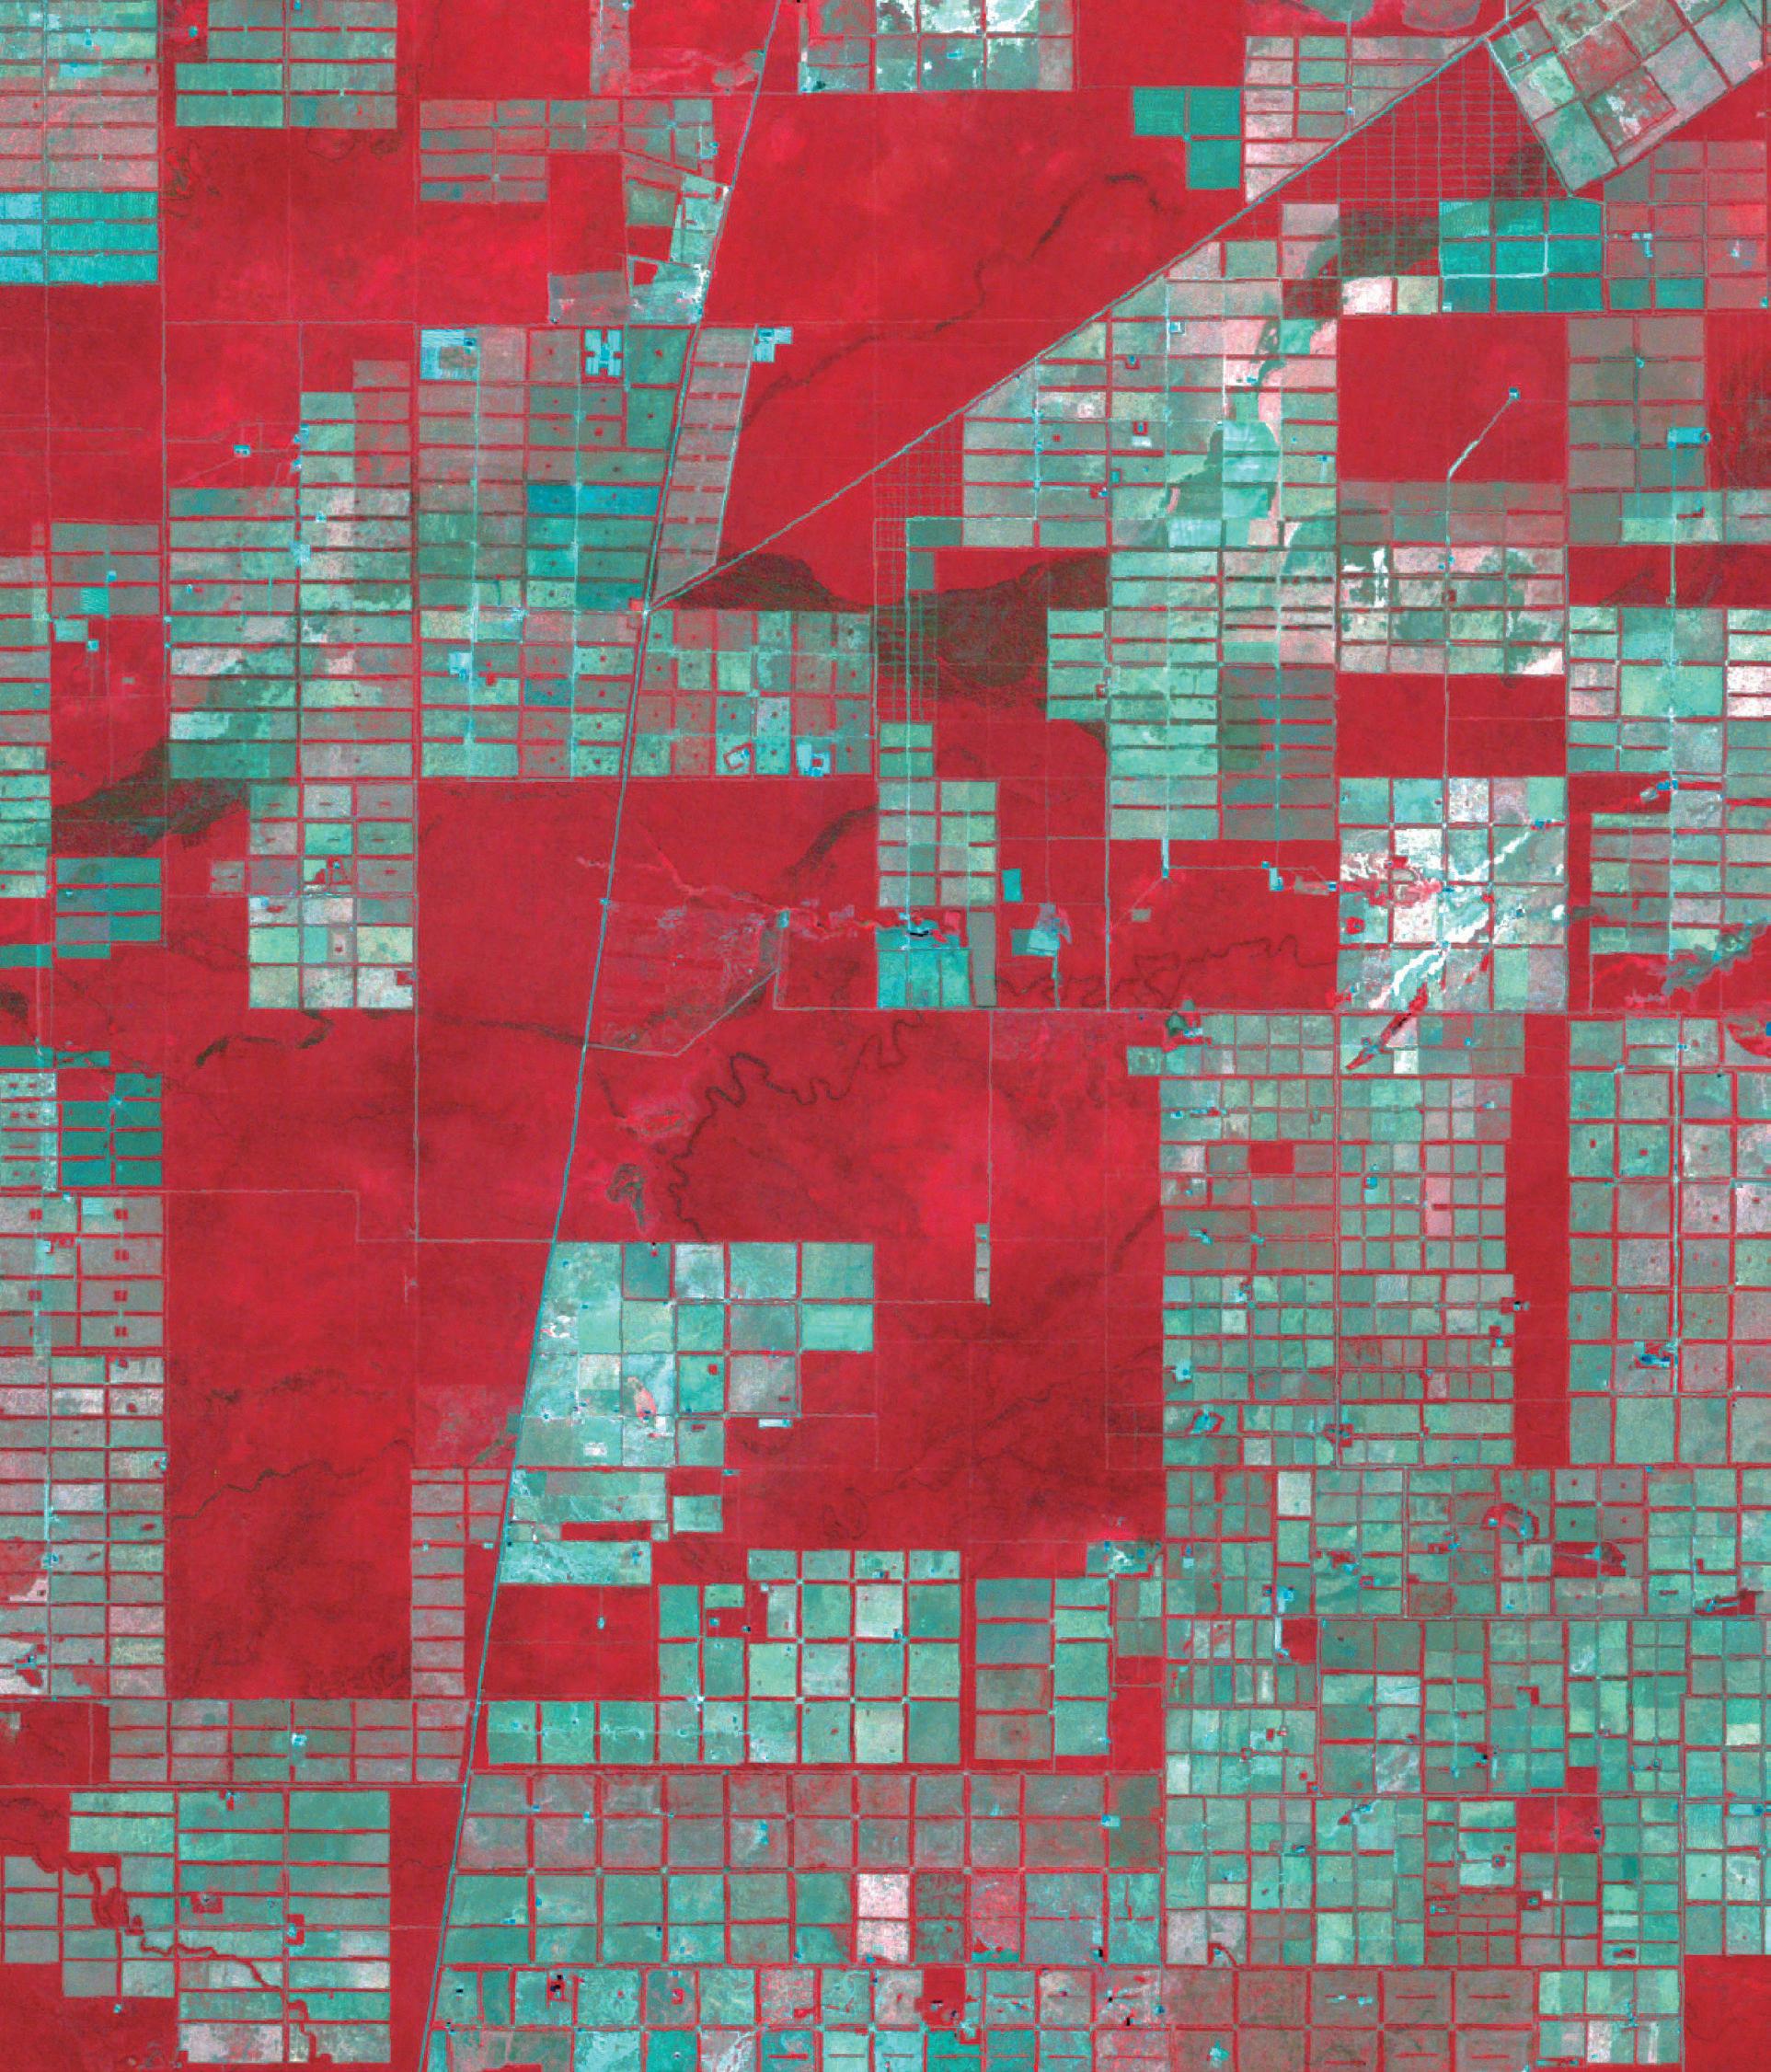
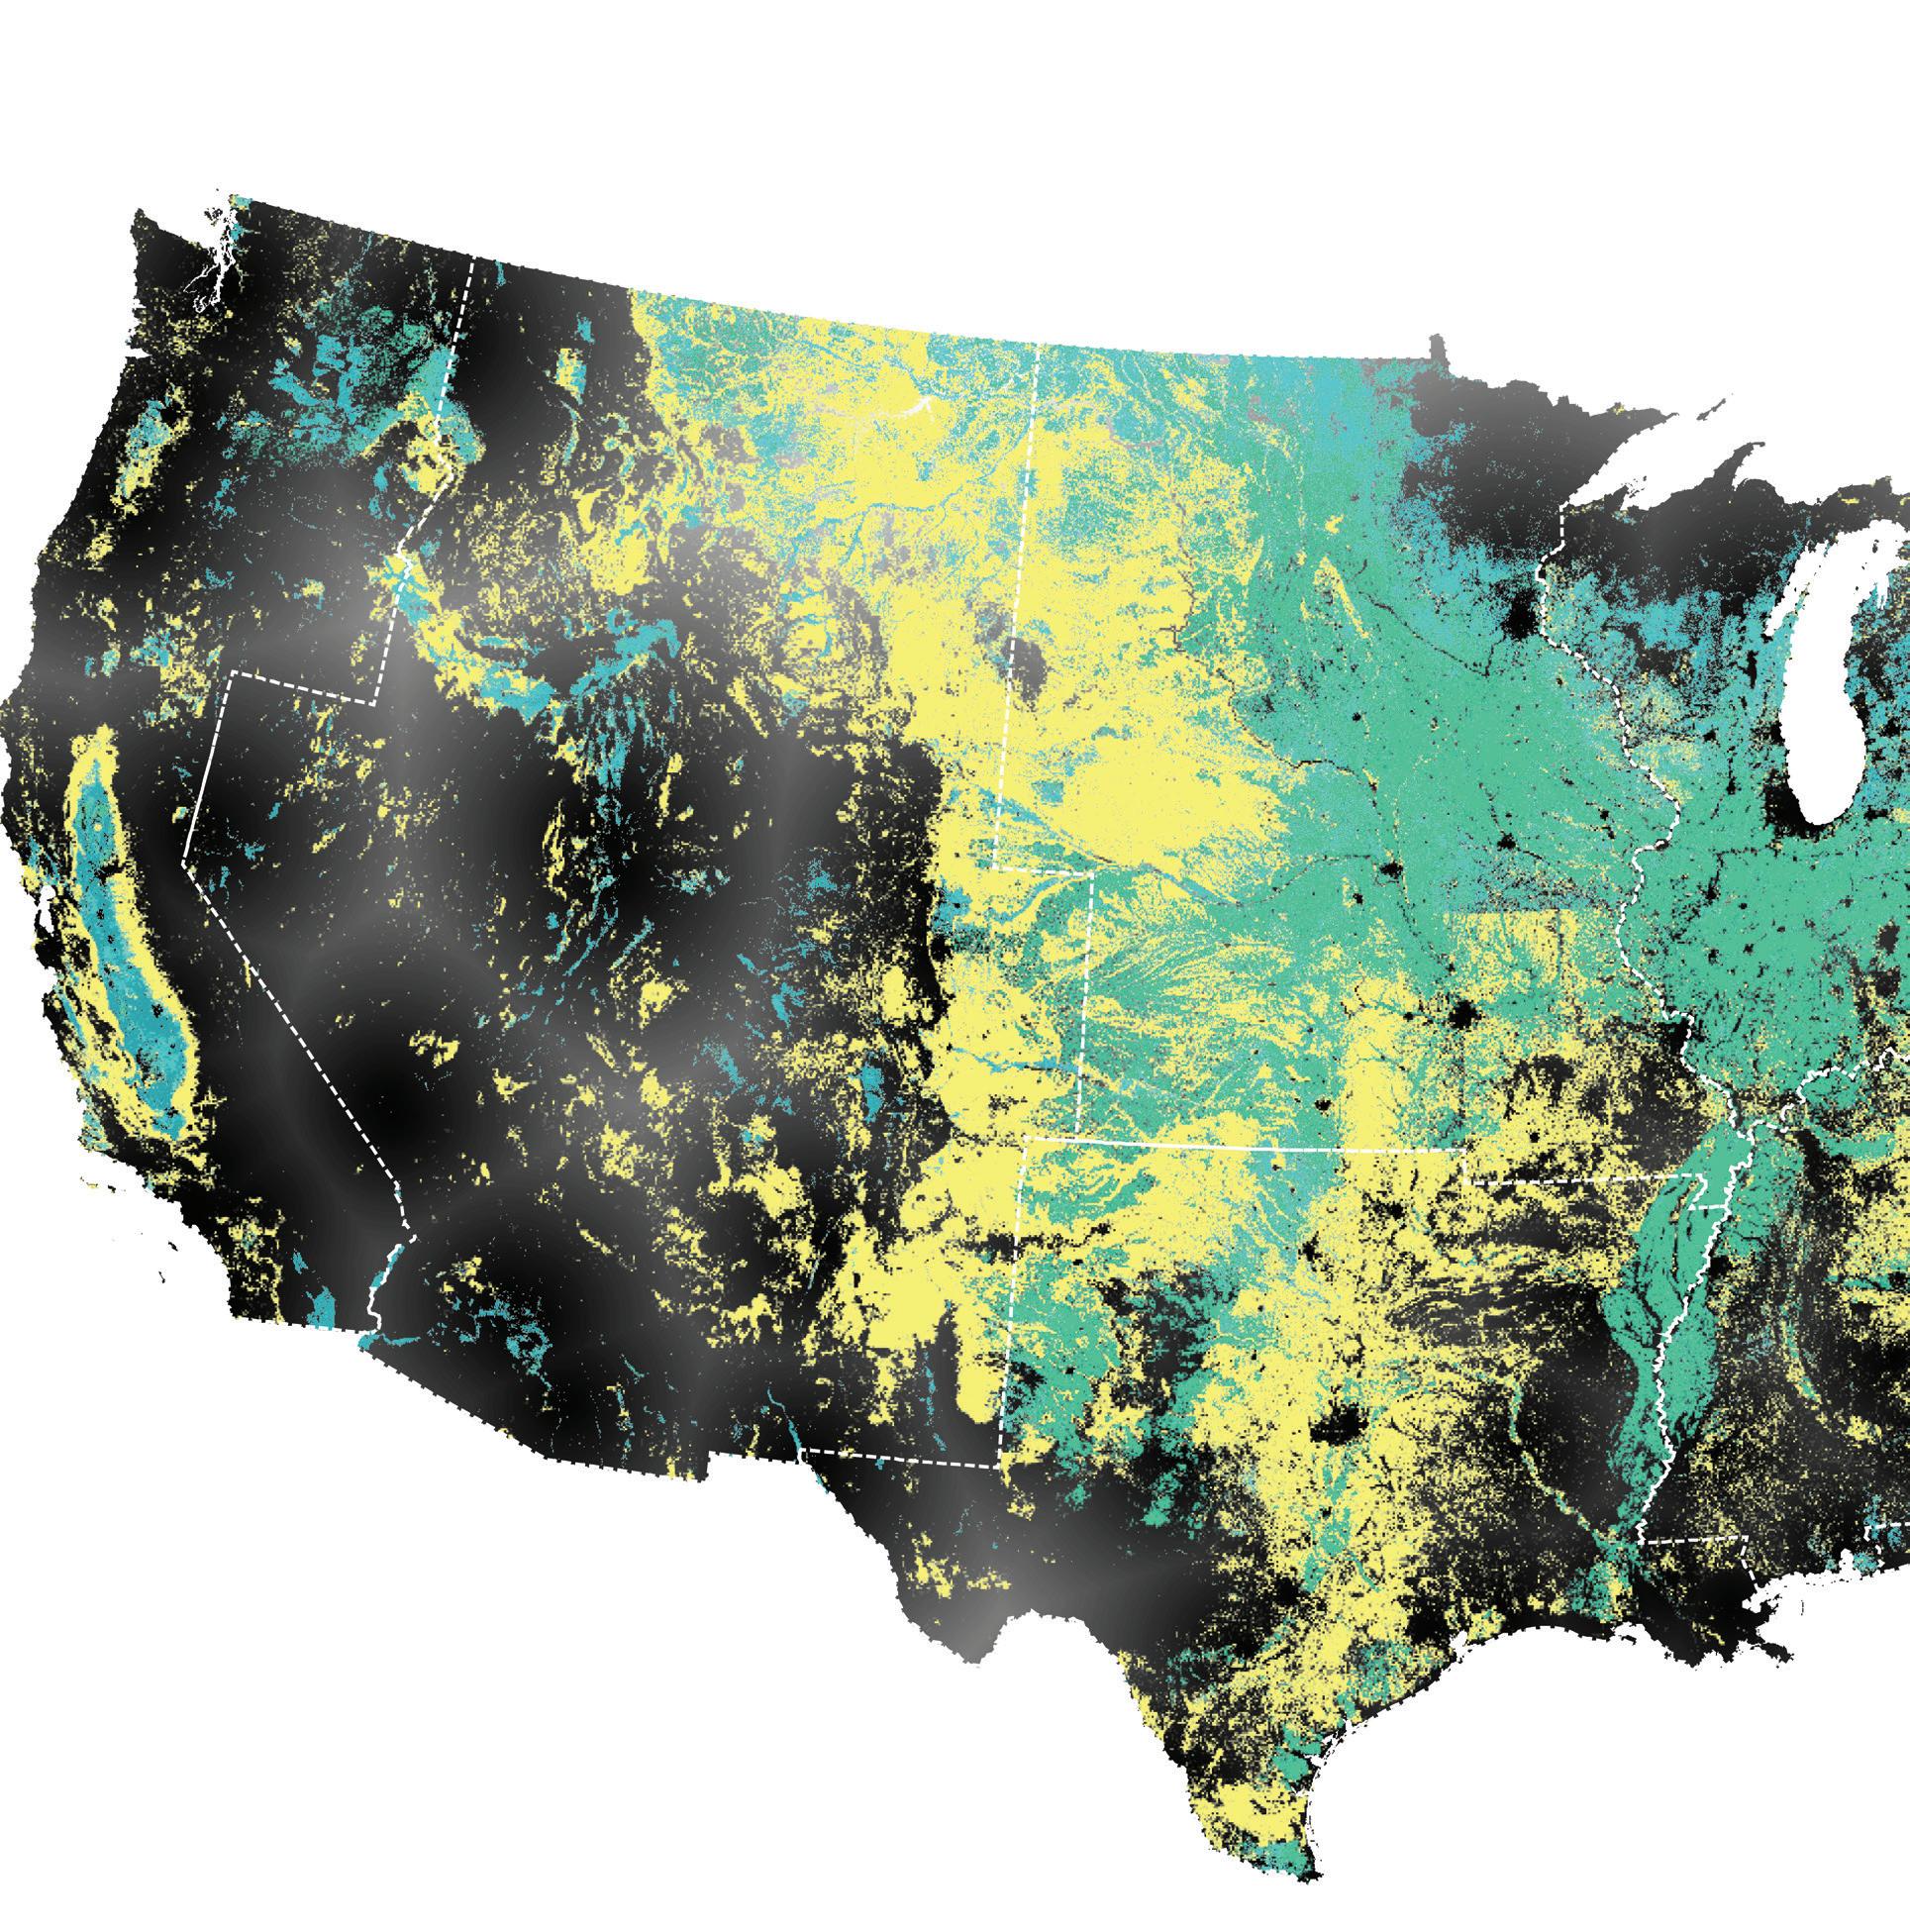
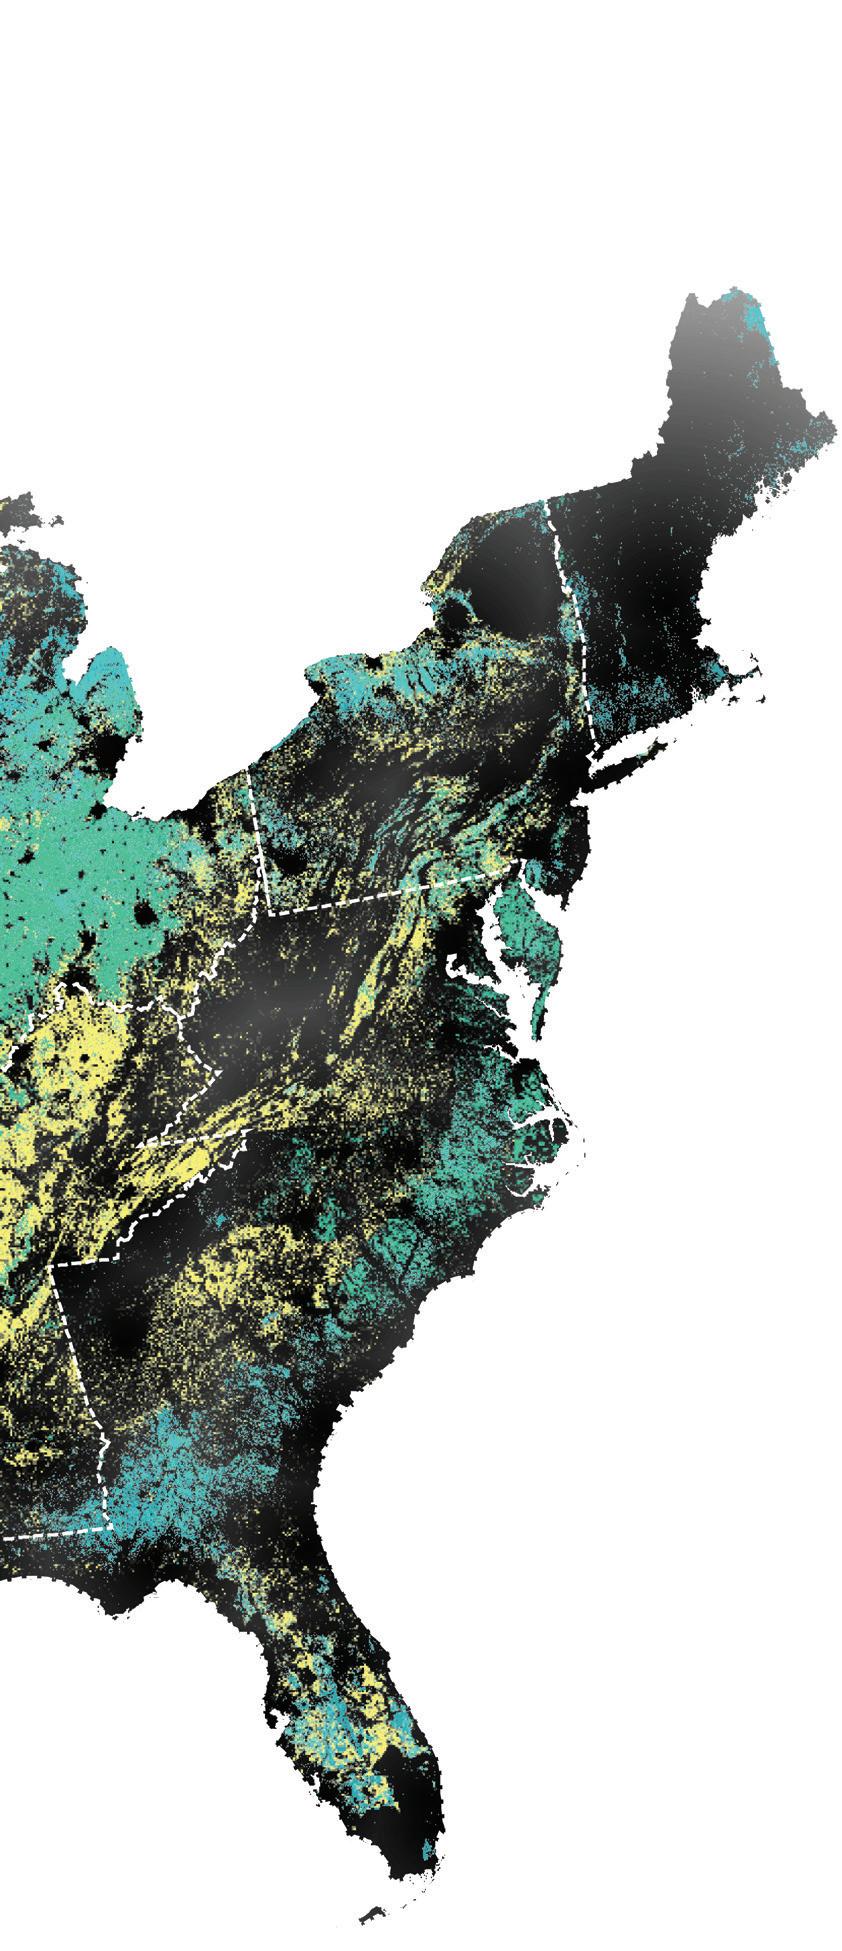
By using false color composite techniques, this visual-essay reveals the patterns of urban transformation across very diverse landscapes looking at wavelengths and intensity of visible and near-infrared light reflected by the land surface. Near-infrared light reflected provides a quantity that correlates with the capacity of the lands to absorb and synthesize solar energy. If the land surface reflects very low values it corresponds to barren areas of rock, sand or snow, but also typically urban infrastructures such as roads and buildings. Moderate values represent shrub and grassland, while high values indicate temperate and tropical rainforests. This is process enables to quantify the concentrations of green leaf and vegetation. It provides a gradient (from blue to red) that measures what is alive (red) from what is not (blue). But also, it identifies where plants are thriving and where they are under stress.
The selected images bring together eight geographies of the earth’s surface, rendering a particular urbanization process within and beyond urban agglomerations. By freezing a particular moment in time, each of them depicts a unique pattern within a larger, dynamic and ongoing process of transformation –deforestation, logging, land-grabbing, formal and informal plantations, urban agglomerations, etc.
The visual essay proposes a threefold reading: First, a comparative reading of the different sites by scale – all satellite images are at 1:250,000; Second, it enables a comparative reading of the imprints on the ground and the patterns of urban transformation – from areas of regional specialization to urban agglomerations; And third, a comparative reading of the false composite images revealing the gradients and arrays of alive vegetation in contrast with lifeless surfaces.
 RENIA KAGKOU | PORTFOLIO
Winy
Renia Kagkou and Nikos Katsikis
Urbanistica
Panama,
Urbanism
Panama,
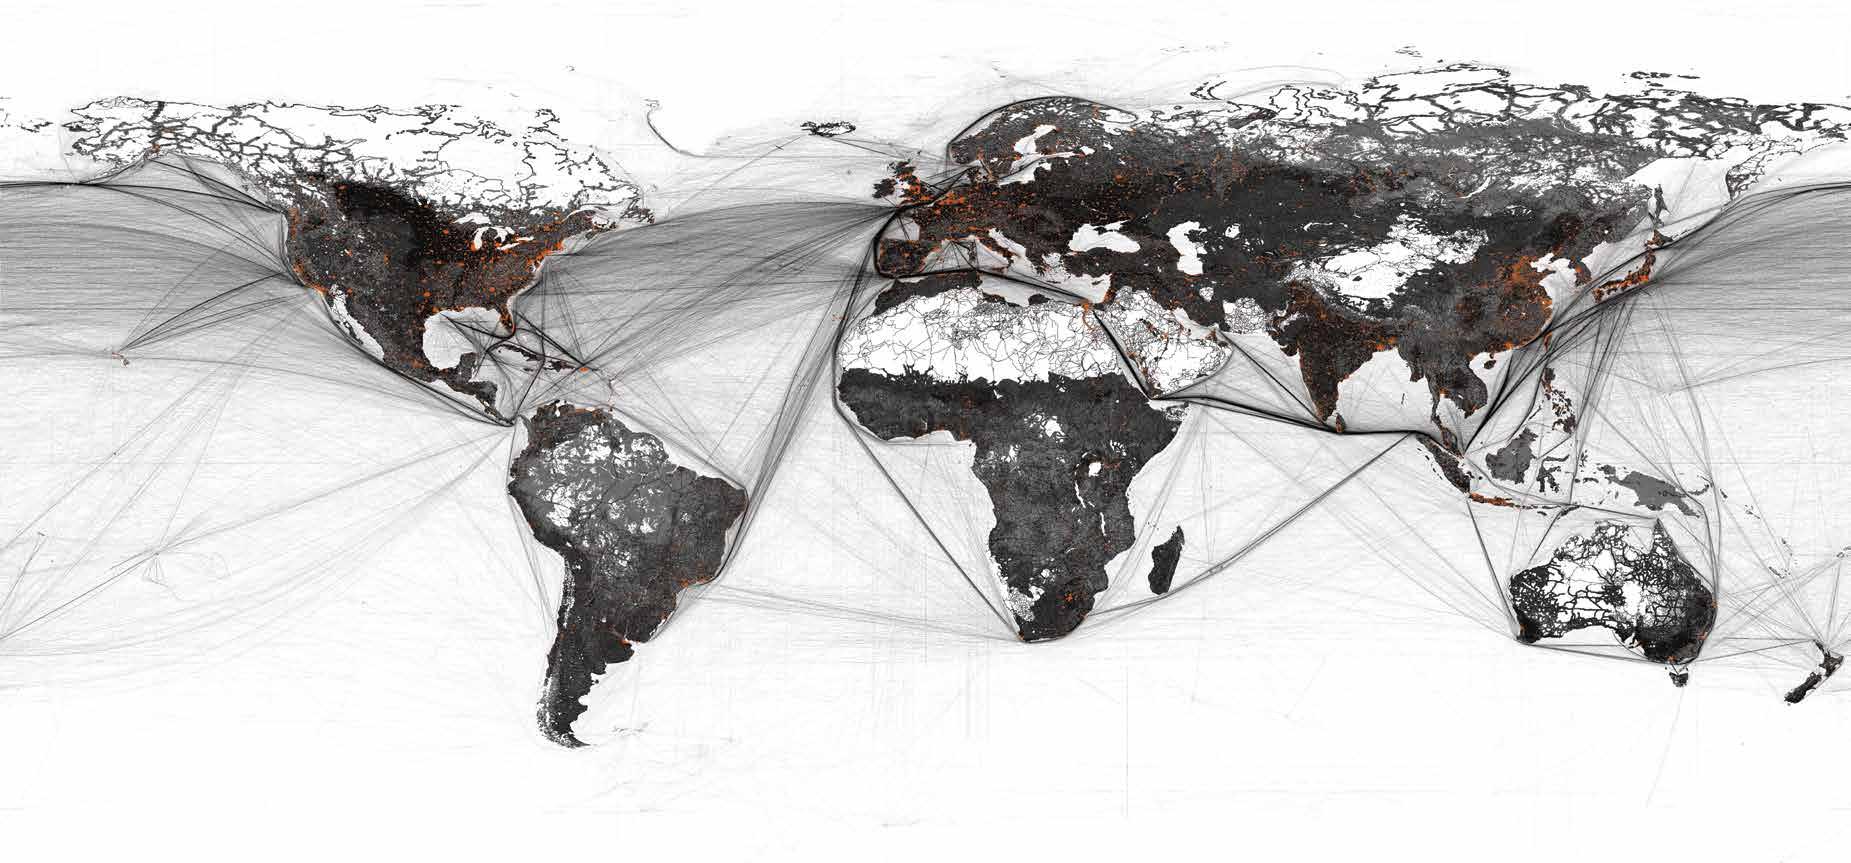
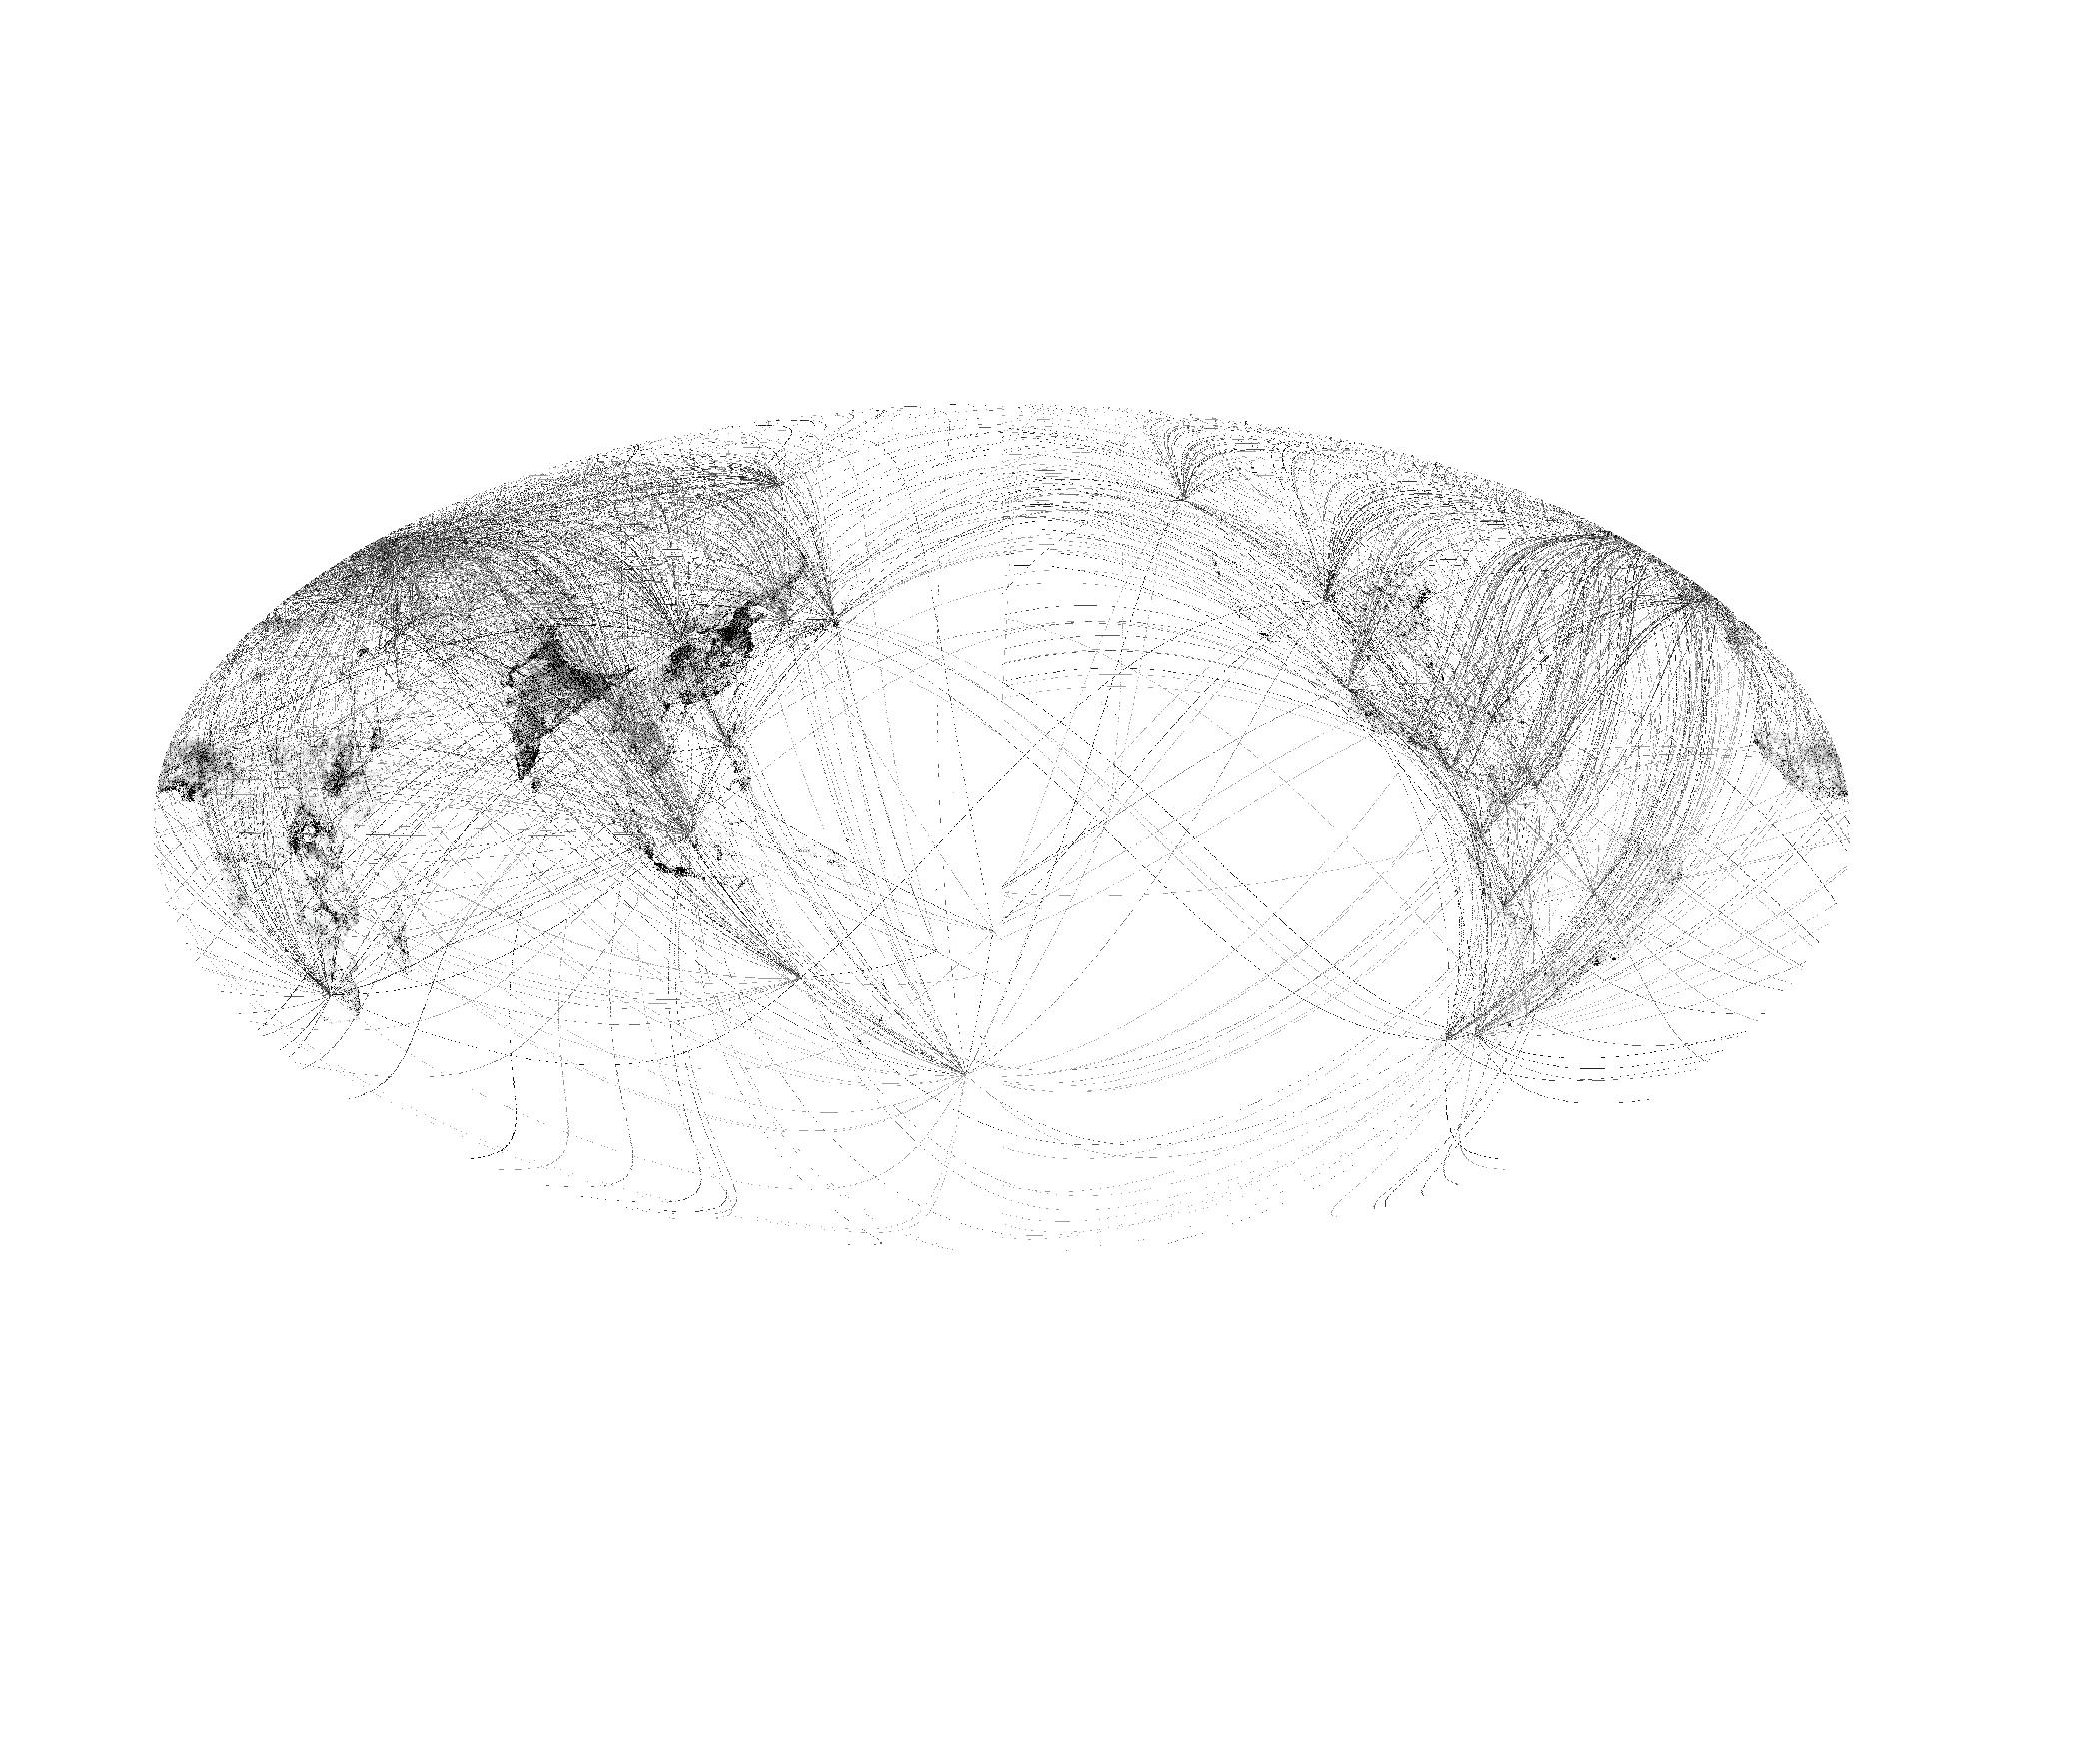
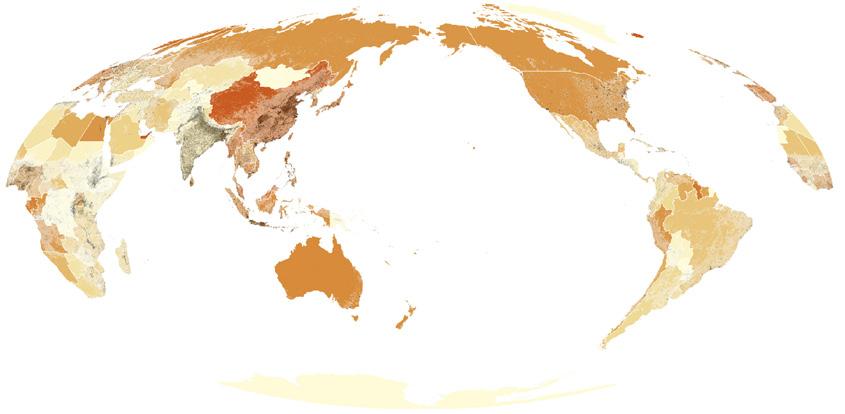
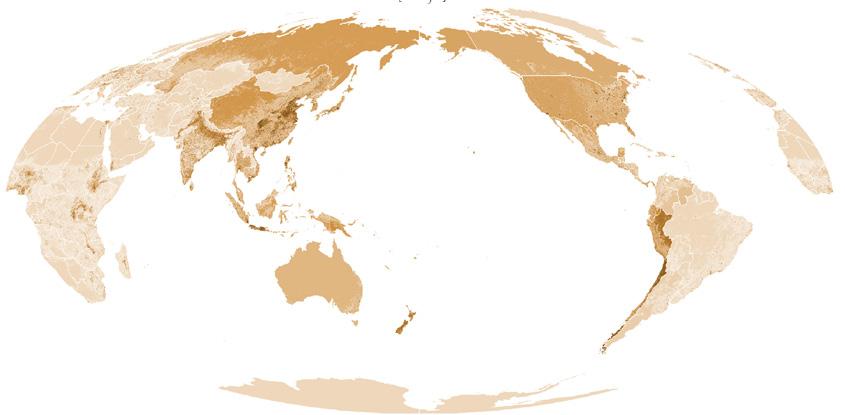
At the beginning of the 21st century, the planet is almost completely urbanized. Not just because of the unprecedented concentration of population and economic activity in larger and larger settlements, but also because of the extended biogeographical interdependencies that emerge out of it. In fact, if taken all together, human settlements cover no more than 3% of the earth’s land surface; yet they are responsible for the operationalization of more than 70% of the planetary terrain, which is currently used to support them: areas of primary production (agriculture, grazing, forestry, mining), circulation, and waste disposal, which also extend in the sea and sky across maritime and avia tion corridors. These operational landscapes, largely constitute the metabolic basis of planetary urbanization, through which resources are extracted, commodities are circulated, and urban life is sustained. As the biogeographical interdependencies of urbanization are globalized, they become tightly interwoven with patterns of international trade, and the increasingly specialized landscapes of production and circulation across the globe. Yet they remain deeply grounded in the specificities of natural geography, revealing the material and environmental dependencies of the global system of flows.
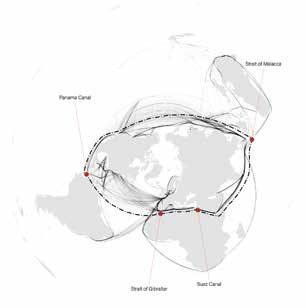
Within this context, certain operational landscapes become crystalized as strategic points in the planetary geography of urbanization. One exemplary case is the system of maritime passages located along the major maritime trade corridors, which accommodate more than 90% of global trade. Over the past decades, the major transoceanic routes have largely crystallized along a circum-equatorial corridor, linking North America, Europe and Pacific Asia. This latitudinal axis is interrupted by the longitudinal extension of a series of continental land masses, that would require circumnavigations of thousands of kilometers in the absence of a system of major straits and canals: the Malacca strait, the Suez canal, the Gibraltar strait, and the Panama canal. These passages constitute strategic points of extreme geopolitical importance for the global system of flows, since there are no effective alternatives. At the same time, they are also bottle necks, since they are obligatory points of passage for all sorts of flows (from ships, to underwater tele communication cables) and have often limited capacity. This bottleneck characteristic, creates a particular condition of centrality, creating around them clusters of operations and turning them into hubs of trans shipment, multimodal transportation, and processing.
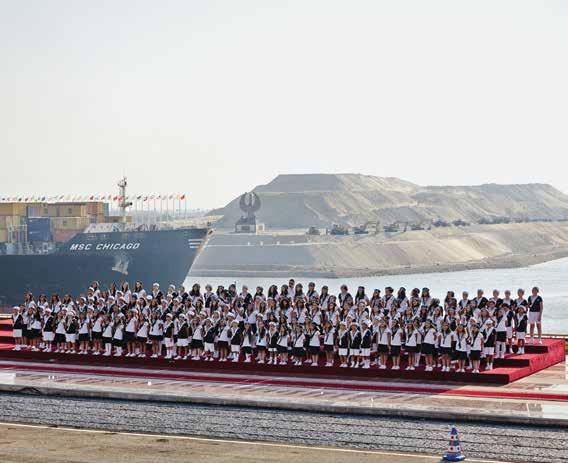
In questa pagina: inaugurazione del nuovo Canale di Suez (Ismailia, Egitto, 6.8.2015). L’ampliamento prevede di raddoppiare il traffico entro il 2023.
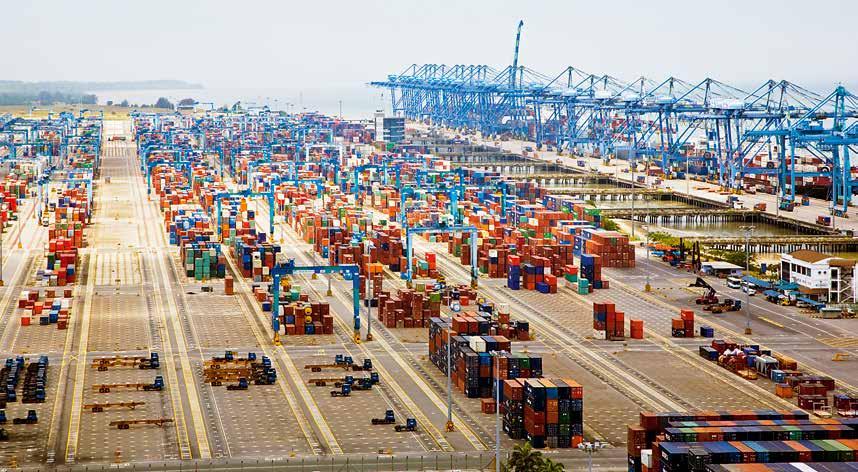
Pagina a fronte. In alto: Westports Malaysia
(Stretto di Malacca) è un gateway per il mercato del Sudest asiatico.
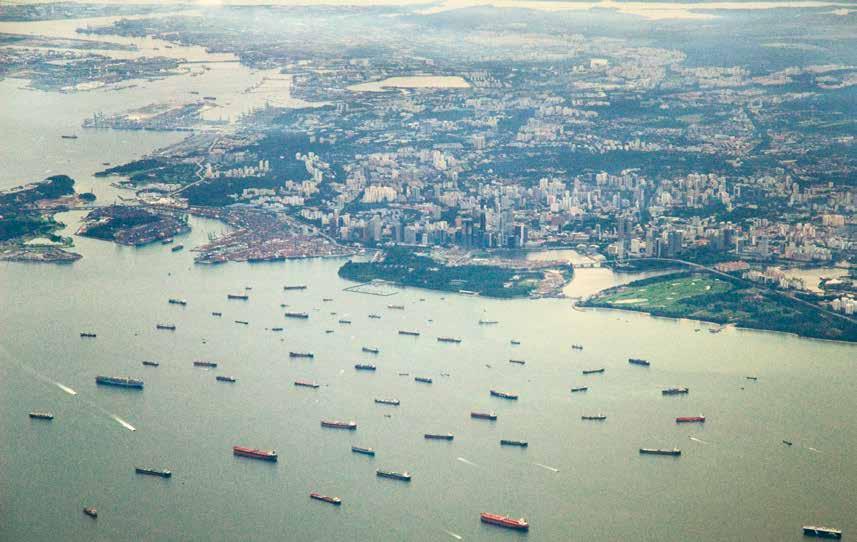
In basso: veduta della Baia di Singapore. Pagine 760-761: il porto di Singapore, con i giardini che si affacciano sulla baia
Seaborne trade is still by far the most cost-effi cient mode of transportation and responsible for more than 90 per cent of world trade.4 Over the past five decades, seaborne trade has grown more than threefold (with world population on ly doubling during the same time) and has large ly crystallised along a circum-equatorial corri dor linking North America, Europe and Pacific Asia.5 This pattern reflects the acute division between production and consumption that char acterises the world economy, following the re location of manufacturing in Asia, and could be roughly described as a latitudinal east-west axis. This axis is interrupted by the longitudinal extension of a series of continental land masses, which constitute serious breaks that would re quire circumnavigations of thousands of kilo metres in the absence of a series of straits and canals: the Strait of Malacca, the Suez Canal, the Strait of Gibraltar and the Panama Canal.
These passages are largely defined by the spe cificities of natural geography, either by offering natural straits (Gibraltar, Malacca), or narrow isthmuses that can be traversed by canals (Pan ama, Suez). They constitute strategic locations of extreme geopolitical importance for the glob al system of flows, since there are effectively no maritime alternatives, and potential disruptions would severely hinder international trade. At the same time, they are also bottlenecks, since they are obligatory points of passage (for all sorts of flows from ships to underwater telecommu
This page: opening ceremony for the new Suez Canal (Ismailia, Egypt, 6.8.2015). The enlargement plans to double traffic by 2023. Opposite page. Top: Westports Malaysia, in the Strait of Malacca, is
a gateway to the booming Southeast Asian market.
Bottom: an aerial view of downtown Singapore. Pages 760-761: Singapore, Harbour, Gardens by the Bay
nication cables) and often have limited capaci ty. This bottleneck characteristic creates a par ticular condition of centrality, constituted through the mandatory break in the flow patterns. Commercial activities have always tended to develop in points of physical breaks along trans port chains, and cities have often developed along them. Under the current highly mechanised mode of trade, these centralities are predomi nantly operational, composed by the concentra tion of logistical operations around them. These clusters of operations are becoming hubs of trans-shipment, multimodal transportation and processing, but also centres of employment and migration, creating new forms of concen tration around them. The planetary bottlenecks become new urban centralities.
But there is another dimension of these plan etary bottlenecks, one that is often hidden behind the formal numbers of economic performance, and concerns the multiple, and often informal, socio-economic meshworks stitched around them: pirates along the Indonesian coast of the Strait of Malacca and the coast of Aden south of Suez, drug trafficking and smuggling across the Panama corridor, and flows of immigrants – who aspire to cross over from Africa to Europe – across Gibraltar. This trend is fuelled by the strong patterns of uneven development between the two continents, which has recently been ampli
fied with the political instability in North Afri ca and the refugee crisis in Syria. More than 60,000 people crossed from Morocco to Spain in 2018, with the strong currents along the strait leading to the death of more than 200 people in 2017 and more than 300 in 2018.
These are reminders that while the planetary bottlenecks are striving to develop themselves as premium enclaves in the global network of flows, they are still embedded in their local and regional context, and their socio-ecological com plexities.6 Agricultural systems continue to unfold around the logistic corridors of Panama and Suez, driven by expansion in artificial irri gation (Egypt) and deforestation (Panama), while a plantation economy of palm oil production dominates the southern part of the Malaysian peninsula. These systems are not necessarily connected with the transportation capacities of the corridors, and often operate as parallel worlds, nevertheless adding additional layers of complexities, antagonisms and tensions be tween local, regional and global scales.
Planetary bottlenecks and the regions around them are revealed as composite and often unco ordinated landscapes, where primary production, transport infrastructures and logistics hubs, local settlements and foreign direct investment zones are in constant friction with each other.
Overall, they are characterised by an endless tension between fixity and motion. The more they strive to detach themselves from their im mediate contexts and become more seamlessly connected to the global system of flows, the more they have to invest on the ground, upgrading their infrastructures and intensifying their operations, reinventing the initial geographical advantages that established them in the first place, but also their relationship with all other socio-economic and ecological layers that engulf them. Through these complex processes, the planetary bottlenecks initially developed as transit points, as obstacles that needed to be transcended, are increasingly becoming attrac tors, destination points, and are thus creating new forms of centrality. They become moments of concentration within the extended operation al landscapes of planetary urbanisation, new urban centralities, without being cities.
Renia Kagkou works at Esri where she consults firms on workflows that integrate geospatial analysis, scenario testing, and impact assess ment in the decision-making processes of urban development.
Nikos Katsikis works at the intersection of urbanisation theory, design and geospatial analysis. He is postdoctoral researcher at the University of Luxembourg and the Urban Theory Lab, Harvard GSD.
1 This contribution builds upon the agenda of Planetary Urbanization developed by Neil Brenner and Christian Schmid.
Major literature on the topic includes: Neil Brenner, Christian Schmid, Planetary Urbanization, in Matthew Gandy (ed.), Urban Constellations, Jovis, Berlin 2011, pp. 10–13; Neil Brenner,
Implosions/Explosions: Towards a Study of Planetary Urbanization, Jovis, Berlin 2014; Neil Brenner, Theses on Urbanization, in Public Culture, vol. 25, No. 1, 2013, pp. 85-114.
2 See for example: United Nations, 2018 Revision of World Urbanization Prospects, 2018; for a critique of the population centric
approach to urbanization see: Neil Brenner, Christian Schmid, The Urban Age in Question, in International Journal of Urban and Regional Research No. 38.3, 2014, pp. 731-755.
3 For an initial framing of the concept of operational landscapes, see Nikos Katsikis, The ‘Other’ Horizontal
Metropolis: Landscapes of Urban Interdependence, in Paola Viganò, Chiara Cavalieri, Martina Barcelloni Corte (eds.), The Horizontal Metropolis Between Urbanism and Urbanization Springer, Berlin 2018, pp. 23–45.
4 Trade statistics based on the Statistics Portal of the United Nations Conference on Trade and
Development, Geneva: www. unctadstat.unctad.org 5 Jean-Paul Rodrigue, Claude Comtois, Brian Slack, The Geography of Transport Systems Routledge, Abingdon-on-Thames 2016.
6 For the concept of premium logistical enclaves see: Stephen Graham, Simon Marvin,
Splintering urbanism: Networked Infrastructures, Technological Mobilities and the Urban Condition, Routledge, Abingdon-on-Thames 2002.
Il Canale di Suez è un corridoio artificiale che nell’Egitto nordorientale taglia l’istmo di Suez, collegando Mar Rosso e Mediterraneo ed evitando una circumnavigazione dell’Africa di oltre 6.500 km. Realizzato nel 1869 da gruppi d’interesse francoegiziani, rimase sotto il controllo britannico fino al 1956, quando venne nazionalizzato dall’Egitto. Analogamente al Canale di Panama, quello di Suez impone una serie di restrizioni geotecniche in fatto di dimensioni e capacità decisive per la standardizzazione delle misure del trasporto navale. Al contempo, l’inevitabile interruzione dei flussi di trasporto marittimo ha anche innescato un raggruppamento di attività attorno a esso, spesso con la necessità di trasferire il carico su imbarcazioni più piccole, il che ha prodotto l’espansione di una serie di punti di trasbordo come Porto Said, Damietta e Alessandria (sul Mediterraneo) e Gedda e Sokhna (sul Mar Rosso). Il corridoio logistico è ulteriormente rafforzato da una linea ferroviaria e da un oleodotto che permettono alle petroliere che non possono attraversare il canale di scaricare petrolio. La zona di libero scambio, che integra vari porti, infrastrutture e città – come Porto Said, Suez e Ismailia – intende attrarre ulteriori investimenti e costruzioni di tipo logistico e manifatturiero lungo una fascia che si sta configurando come un centro lineare a est del principale nucleo urbanizzato egiziano sulla riva opposta del Nilo 1
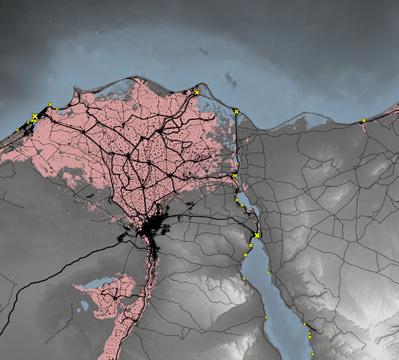
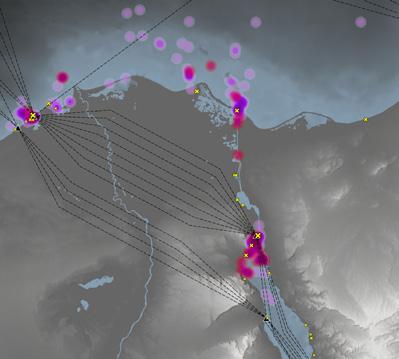
The Suez Canal is a manmade waterway that cuts across the Suez Isthmus in northeast Egypt. By creating a connection between the Red Sea and the Mediterranean, the canal allows vessels to avoid the more than 6,500-km-long journey around Africa. Completed in 1869 by French and Egyptian interests, the canal later came under British control until 1956, when it was nationalised by Egypt. Similar to the Panama Canal, the Suez Canal poses a series of geotechnical restrictions due to its size and capacity, which have been decisive for the standardisation of shipping dimensions. Meanwhile, the inevitable interruption in the flow of shipping has also triggered a clustering of activities around the canal. The frequent need to transship cargo to smaller boats, for example, has led to the growth of a series of trans-shipment points such as Port Said, Damietta and Alexandria on the Mediterranean, and Jeddah and Sokhna on the Red Sea. This logistics corridor is further consolidated by a railway and an oil pipeline, which allow tankers that are unable to cross the canal to unload their oil. Integrating several ports, infrastructures and cities such as Port Said, Suez and Ismailia, the Suez Canal Economic Zone aims to attract further investment and development in logistics and manufacturing. Occupying a belt that is emerging as a linear centre, the SCZone lies to the east of Egypt’s main urbanised heartland across the Nile.1
km di lunghezza km long 205-225 m di larghezza m wide 11-24 m di profondità m deep 6,500 km di viaggio risparmiati km of travel avoided
mld/bn $ per il progetto di ampliamento nel 2015 $ to upgrade the canal in 2015 80 navi/giorno (aperto 17 ore) ships/day (open 17 hours)
navi nel 2018 ships in 2018 1.139 mld/bn t/anno nette di TPL (2018) net metric tons/year of DWT (2018)
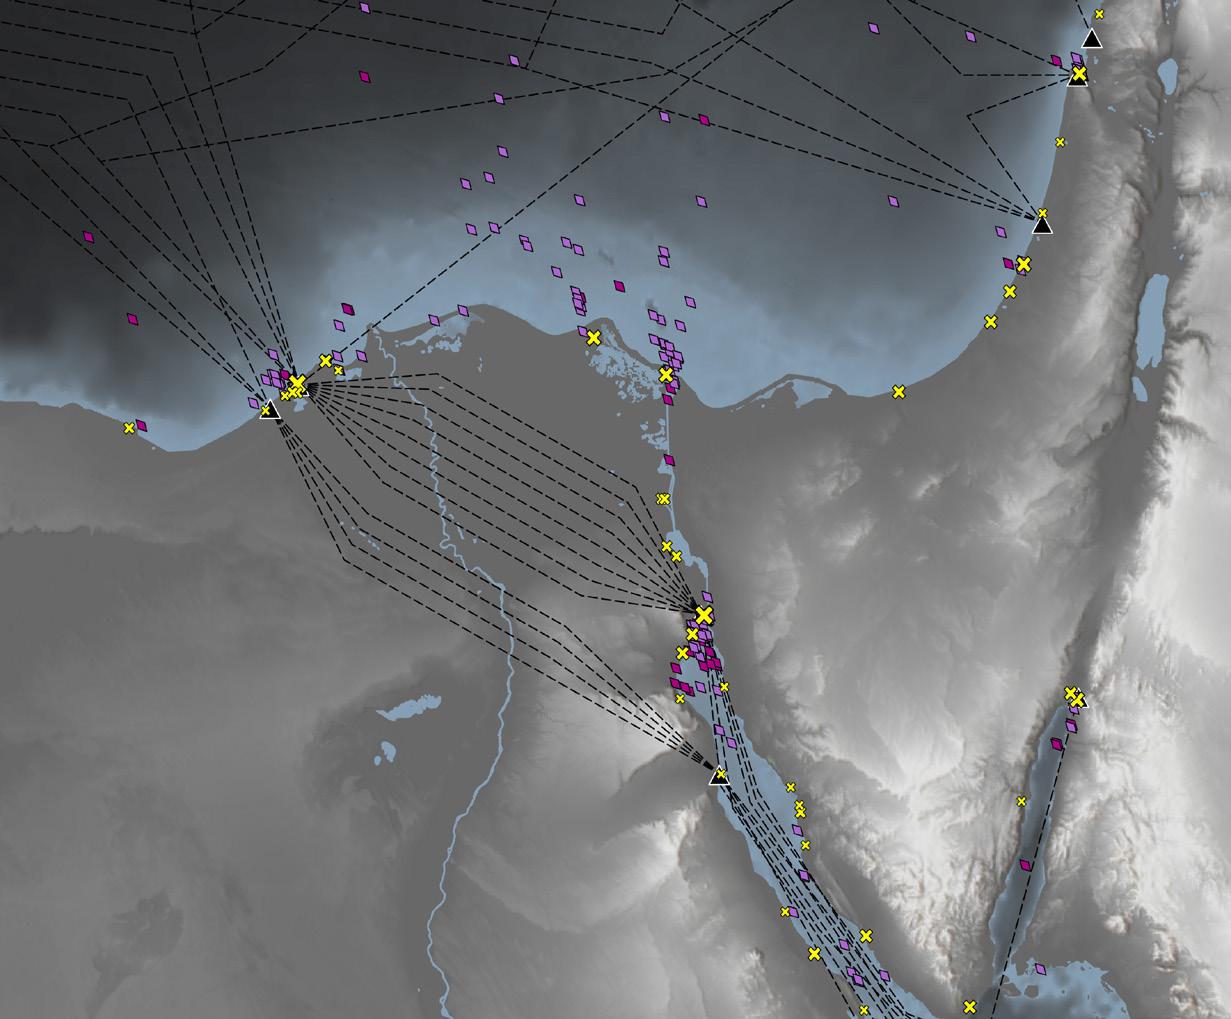
Più di 10.000 km a ovest del Canale di Suez, il Canale di Panama collega l’Atlantico e il Pacifico. Il progetto fu portato a termine nel 1914 da gruppi d’interesse statunitensi dopo che Panama aveva ottenuto l’indipendenza. Gli USA mantennero il controllo della zona fino al 1979, quando passò al Governo panamense. L’audace realizzazione comprendeva un canale sopraelevato dotato di chiuse, due dighe per la creazione di due bacini che sfruttano i fiumi Chagres e Rio Grande (Panama) e il taglio dello spartiacque continentale. Il canale ha una capacità massima di 50 navi al giorno con un tempo di transito di 10 ore, che spesso raddoppia a causa dei tempi d’attesa e, come a Suez, impone restrizioni alle dimensioni delle navi. È strategico per il commercio statunitense. Come per il Canale di Suez, l’area lungo il Canale di Panama ha visto sorgere un distretto della logistica e del trasbordo, integrati da una linea ferroviaria e da un’importante autostrada che collega la costa del Pacifico a quella dell’Atlantico. Lo storico polo portuale caraibico di Colón ha visto la concorrenza di Balboa sul Pacifico oltre che quella di Cartagena e di Puerto Limón nell’area più vasta. Le attività di trasbordo s’intrecciano con la crescita di poli logistici e industriali, per lo più riuniti delle Zone di libero scambio di entrambe le coste, con le più importanti a Colón e nella conurbazione di Panama City–San Miguelito 1
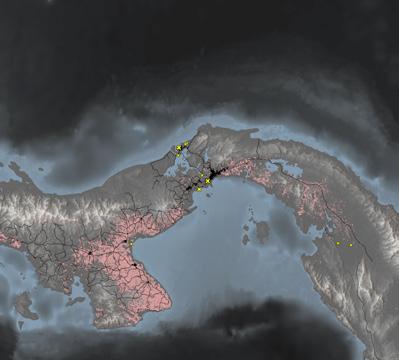
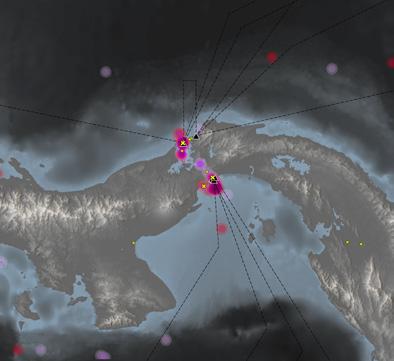
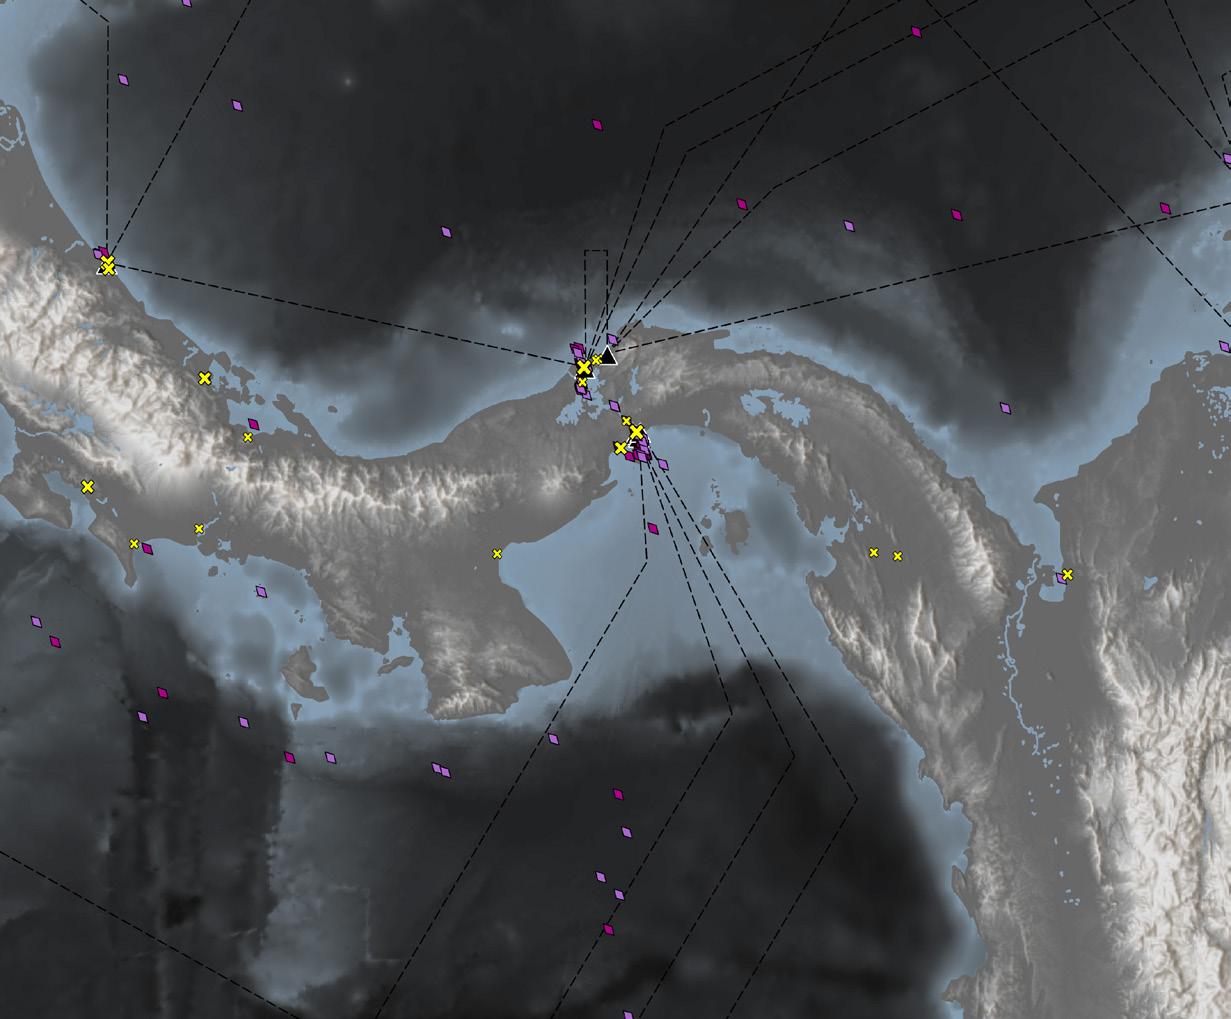
More than 10,000 km to the west of the Suez Canal, the Panama Canal connects the Atlantic and Pacific oceans. The project was completed in 1914 by US interests, after Panama had gained its independence, with the US retaining control of the whole area until 1979, when it was passed to the government of Panama. The waterway’s challenging construction involved a high-level canal with locks, two dams for the creation of two lakes fed by the Chagres and Rio Grande (Panama) rivers, and a cut through the continental divide. The canal has a maximum capacity of 50 ships per day, with a transit time of 10 hours. However, the journey can often take twice as long due to waiting times and, similar to Suez, there are also certain restrictions to ship dimensions. The Panama Canal is of strategic importance for US trade. As with the Suez Canal, the zone along the Panama Canal is developing into a logistics and transshipment cluster, complemented by a railway line and a major highway connecting the Atlantic and Pacific coasts. The historic Caribbean port city of Colón has seen competition from Balboa on the Pacific, as well as Cartagena and Puerto Limón in the broader region. Trans-shipment activities have been interwoven with the growth of logistics and processing hubs, mostly clustered into free trade zones on both coasts, the most important being in Colón and in the Panama City-San Miguelito agglomeration.1
80 km di lunghezza km long
15,000 km di viaggio risparmiati (dalla costa est alla costa ovest degli USA) km of travel avoided (from the East Coast to the West Coast of the USA)
82 m di profondità (min) m deep (min)
12-15,000 navi/anno attraversano il canale ships/year transit the canal 8-10 h tempo medio di transito h average transit time
101,000 m3 di acqua necessari per riempire una chiusa m3 of water needed to fill a lock chamber
Fonti/Sources:
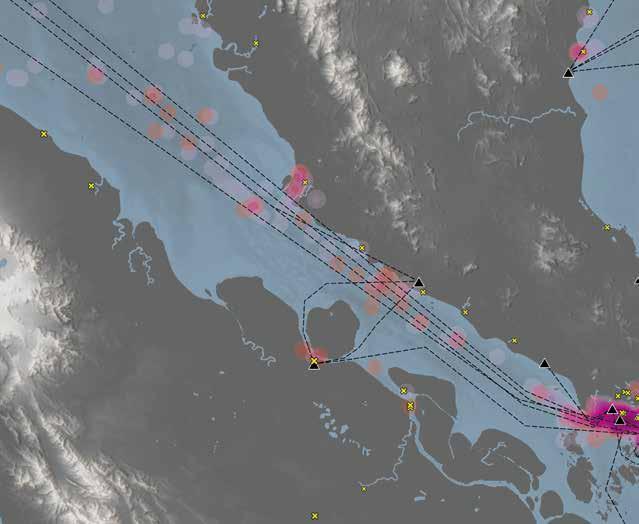
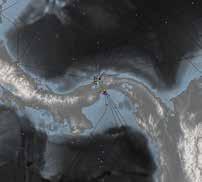
Lo Stretto di Malacca è un passaggio naturale che permette di circumnavigare la penisola omonima, che divide l’Oceano Indiano dal Mar Cinese Meridionale. Sotto il controllo portoghese fino alla metà dell’Ottocento, lo Stretto è passato poi al dominio britannico, terminato nel 1957 con l’indipendenza della Malesia. La scarsa profondità del passaggio richiede dragaggi periodici, fonte di dissidi tra Malesia, Indonesia e Singapore, e pone particolari restrizioni al traffico marittimo. Il passaggio dà accesso alle più importanti aree industriali mondiali lungo un asse marittimo che va dal distretto dell’esportazione giapponese (con i porti di Yokohama, Nagoya e Kobe) a Busan (Corea del Sud), ai porti cinesi dello Yangtze e del Fiume delle Perle e al porto di Kaohsiung a Taiwan. Semilavorati e prodotti finiti transitano per lo più verso ovest, mentre flussi di petrolio, gas naturale liquefatto e materie prime (minerali ferrosi, carbone) passano verso l’Asia orientale per rifornire gli impianti produttivi. Singapore resta il polo di trasbordo più importante, nonché il più grande del mondo, in competizione con i porti di Port Klang, Tanjung Pelepas e Pulau Pinang in Malesia. Singapore è anche al primo posto nella logistica e nelle operazioni di trasformazione delle materie prime nelle sue zone di libero scambio, mentre la crescita di ulteriori zone di libero scambio a Port Klang e Tanjung Pelepas è in gran parte nutrita da investimenti cinesi 1
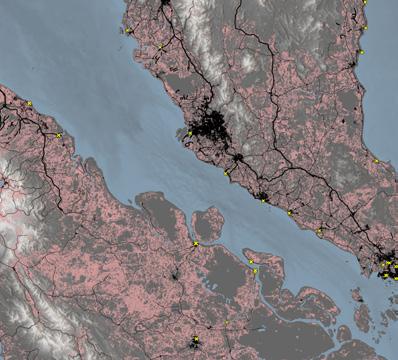
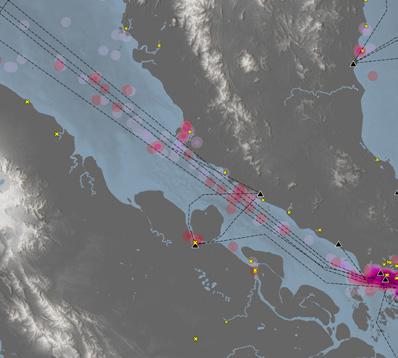
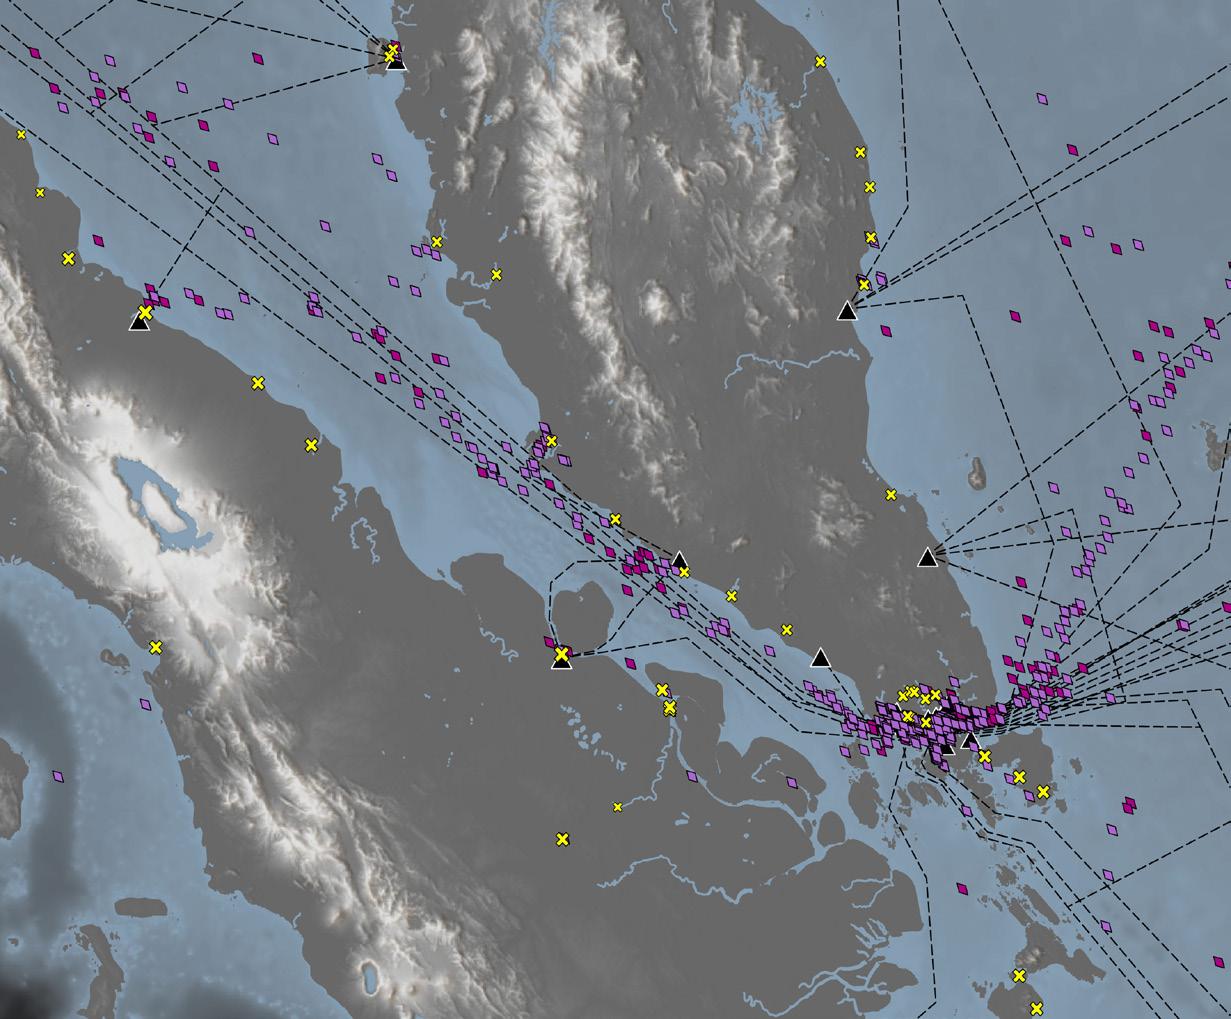
The Strait of Malacca is a natural water channel allowing the circumnavigation of the Malay Peninsula which divides the Indian Ocean and the South China Sea. Under Portuguese control until the mid-19th century, the strait passed under British rule until 1957 when Malaysia gained independence. The passage’s shallow depth not only introduces the need for regular dredging – a point of contestation between Malaysia, Indonesia and Singapore – but also restricts naval traffic. The passage gives access to the world’s most important industrial areas across a maritime axis that stretches from the cluster of Japanese export ports (Yokohama, Nagoya and Kobe) to Busan (South Korea), the Chinese ports of the Yangtze River and the Pearl River Delta, and the Taiwanese port of Kaohsiung. Semi-finished and finished products mostly move westwards, while large flows of oil, liquefied natural gas and other raw materials (iron ore and coal) transit towards East Asia to supply factories. Singapore remains the most prominent trans-shipment hub, as well as the biggest in the world, in competition with the ports of Port Klang, Tanjung Pelepas and Pulau Pinang in Malaysia. Singapore also dominates logistics and processing operations through its free economic zones, while the growth of additional free economic zones at Port Klang and Tanjung Pelepas is largely being fuelled by Chinese investment.1
km di lunghezza km long 65-250 km di larghezza (min/max) km wide (min/max)
ore di navigazione hours of navigation 27-200 m di profondità (min/max) m deep (min/max)
navi/anno attraversano lo Stretto vessels/year cross the strait
delle spedizioni mondiali % of global shipping traffic
Mentre il Canale di Suez dà accesso al Mediterraneo dall’Oceano Indiano, lo Stretto di Gibilterra è l’unico passaggio tra Mediterraneo e Atlantico. Tuttavia, i 64 km dello Stretto non solo collegano i due corpi idrici ma dividono anche l’Europa dal continente africano, e sono quindi stati un corridoio importante per la migrazione e lo scambio culturale. Un fatto che si riflette sulla lunga storia di tensioni geopolitiche tuttora presenti, con l’area circostante la Rocca di Gibilterra che è un’ enclave del territorio spagnolo sotto il controllo britannico e la città di Ceuta che è un’ enclave spagnola in Marocco. Spagna, Marocco e Gran Bretagna rivendicano il controllo territoriale sulle acque dello Stretto. La concentrazione dei maggiori porti europei lungo le coste settentrionali d’Europa (Rotterdam, Amburgo e Anversa) fa di Gibilterra un punto di passaggio obbligato per la maggior parte del traffico marittimo tra Europa e Asia, che entra nel Mediterraneo attraverso Suez, ma anche un punto d’uscita per il traffico verso l’America settentrionale. L’agglomerato di porti e di punti di trasbordo attorno allo Stretto assume la forma di una competizione a due tra il consolidato polo spagnolo di Algeciras e il polo marocchino in crescita di Tanger-Med a nord-est di Tangeri. Ma lo Stretto sta diventando anche un fattore d’attrazione per i migranti che vogliono passare dall’Africa all’Europa.
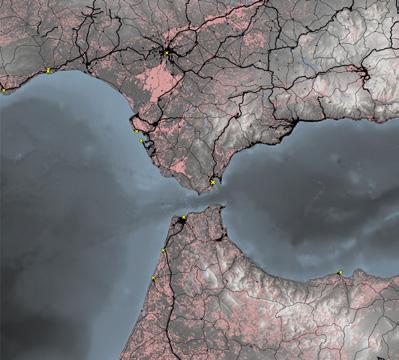
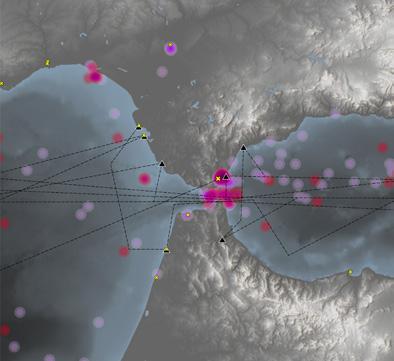
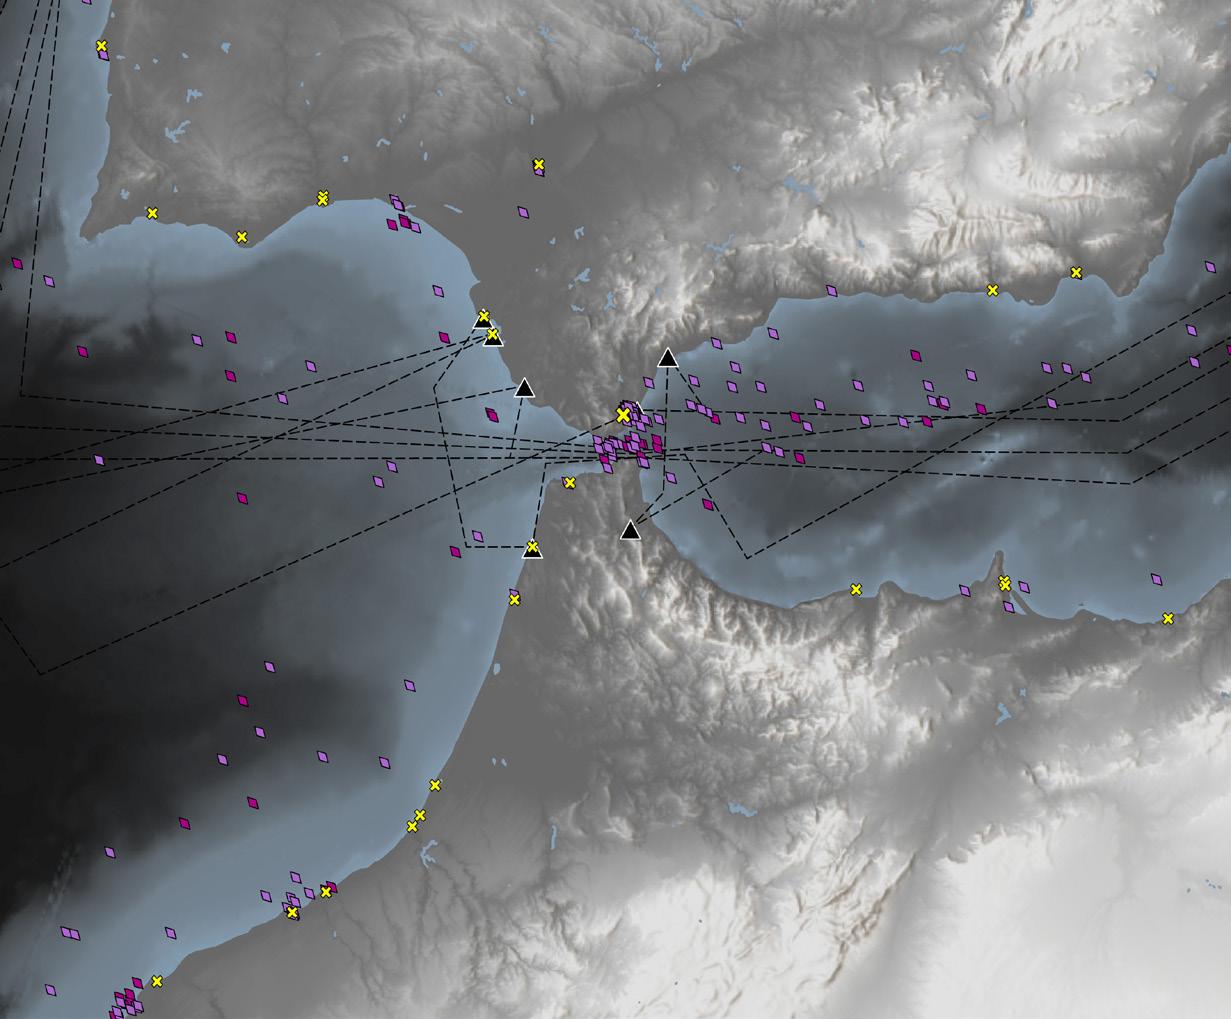
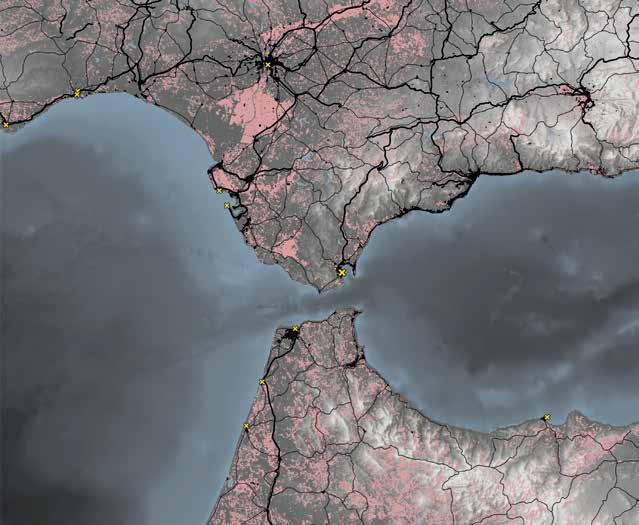
While the Suez Canal offers access to the Mediterranean from the Indian Ocean, the Strait of Gibraltar is the only passage from the Mediterranean Sea to the Atlantic. However, the 64-km strait not only connects the two bodies of water but also divides Europe from the African continent, and has thus been a major corridor for migration and cultural exchange. This is also reflected in the long history of geopolitical tensions that continue today, with the area around the Rock of Gibraltar being an enclave of British control within Spain, and the city of Ceuta being a Spanish enclave within Morocco, while Spain, Morocco and the UK claim territorial control over the waters of the strait. The concentration of the largest European ports along the north coast of Europe (Rotterdam, Hamburg and Antwerp) makes Gibraltar an obligatory point of passage for most maritime flows between Europe and Asia that enter the Mediterranean through Suez. Yet the strait is also an exit point for flows towards North America. The agglomeration of ports and transshipment operations around the strait takes the form of a two-way competition between the established Spanish hub of Algeciras and the growing Moroccan hub of Tanger-Med northeast of Tangier. Meanwhile, this stretch of water is also becoming an attractor point for migrants who aspire to cross over from Africa to Europe.
58 km di lunghezza km long 13-43 km di larghezza (min/max) km wide (min/max)
900
m di profondità (max) m deep (max) 100,000 navi/anno superano lo stretto vessels/year cross the strait 90
% del traffico sono navi cargo % of traffic is cargo 60,000 migranti hanno attraversato lo stretto nel 2018 people crossed the strait in 2018 300 vittime umane tra i migranti (2018) human victims (2018)


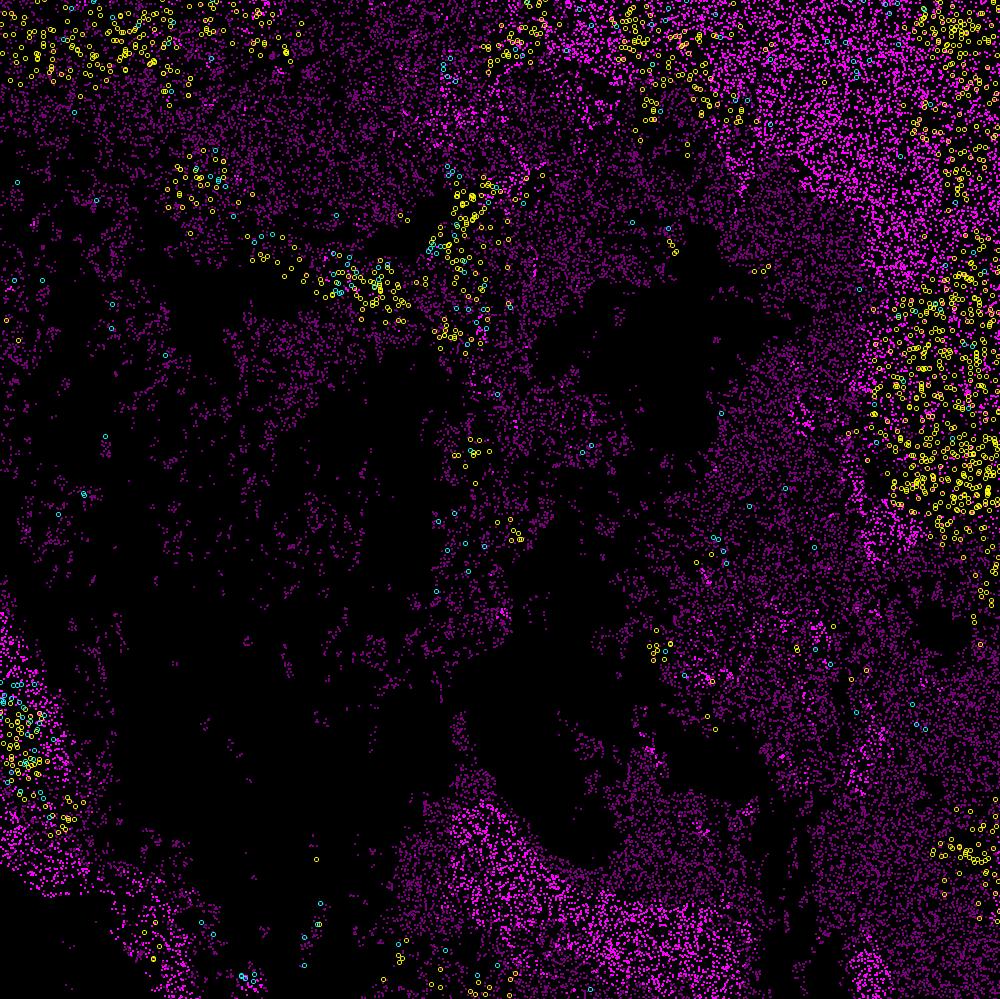
Investigating and visually narrating the exploitations of wild fisheries in the Pacific [ YouTube Video ]
The project uses AIS transmission vessel data provided by navama® website: http://navama.com
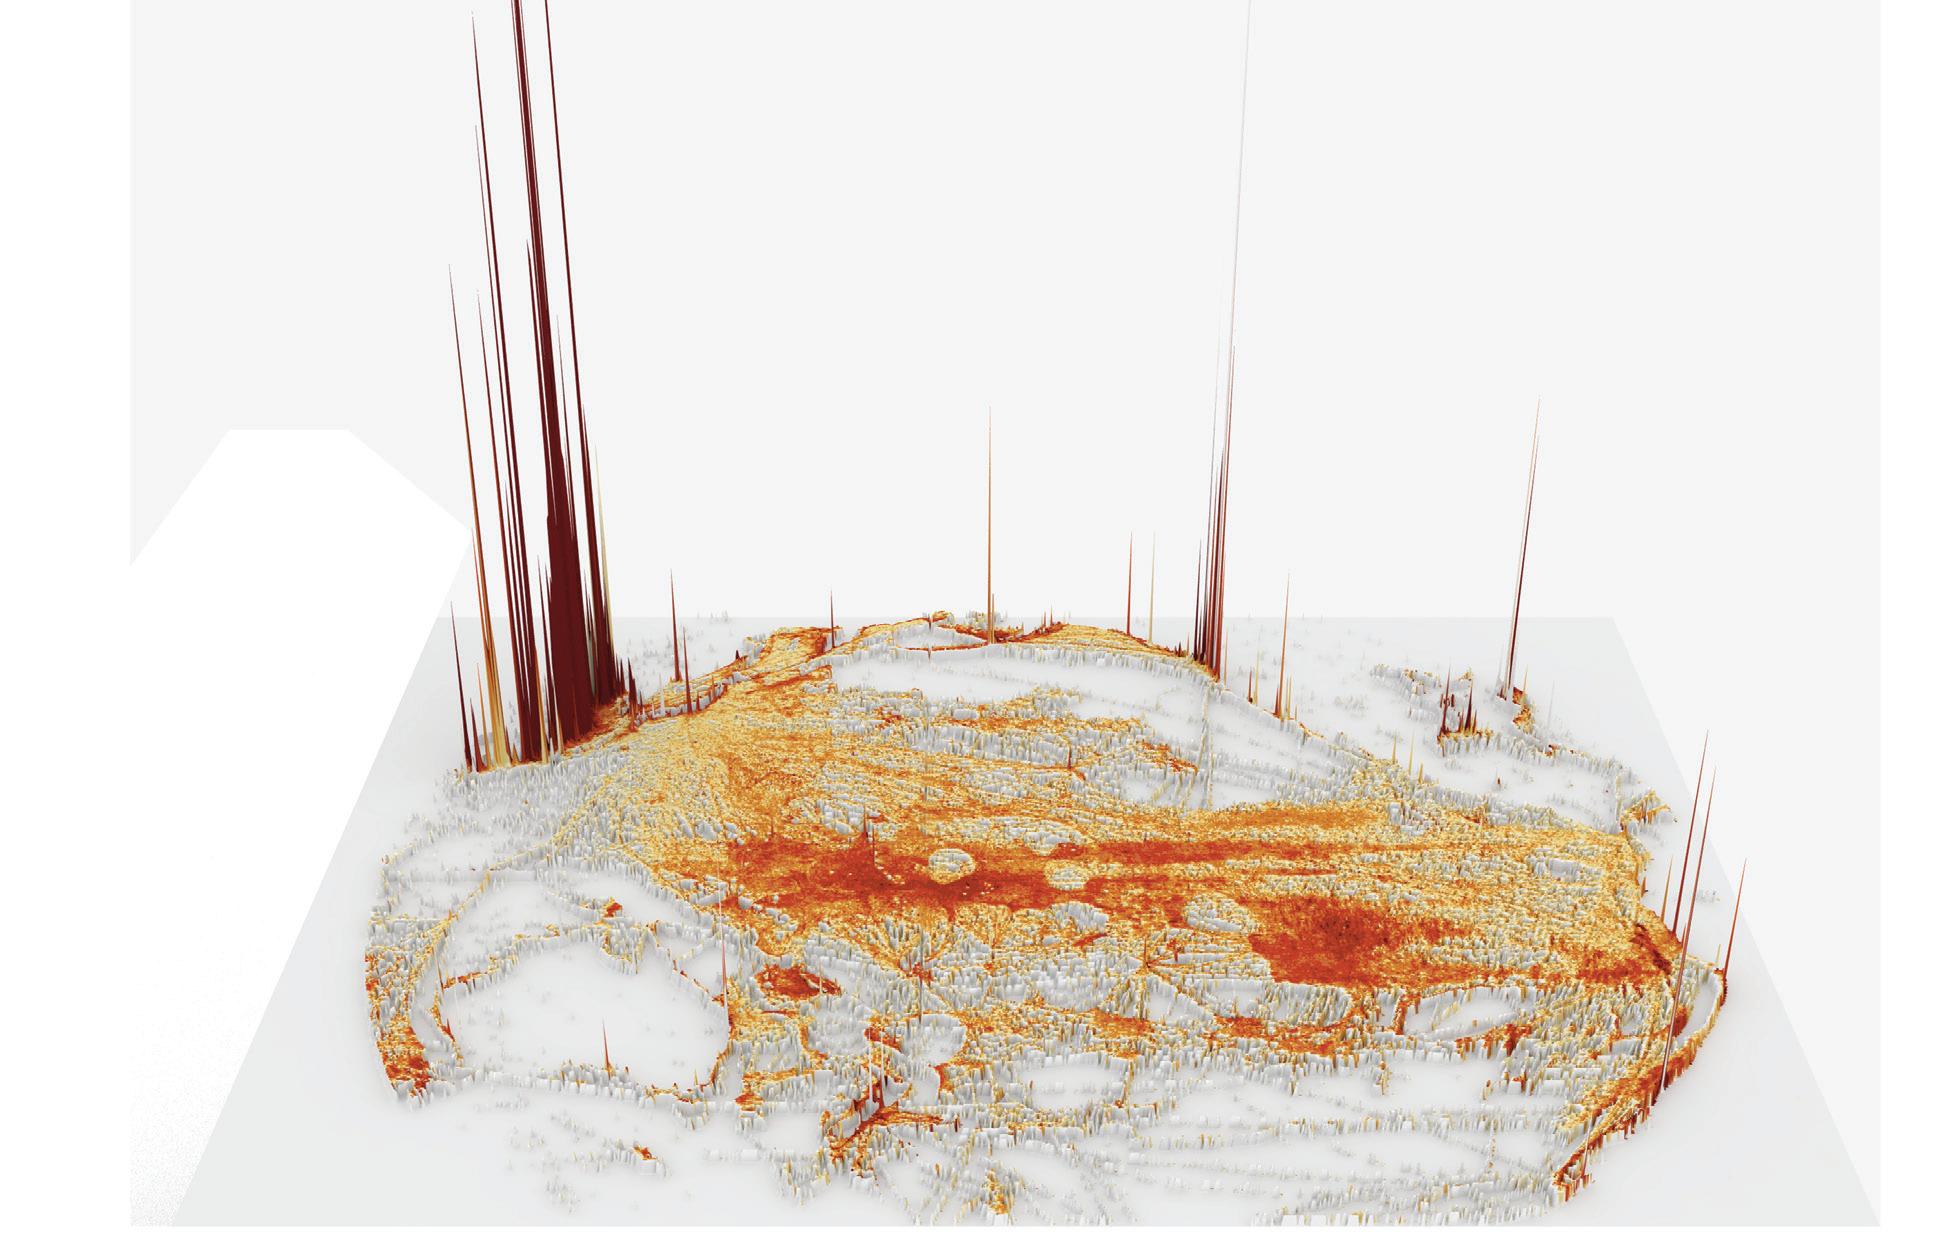
One of the only remaining ‘last frontiers’, the Pacific Ocean is a rare site in the 21st century still capable of supporting the exploration and appropriation of new territories and resources, what Moore terms ‘cheap nature’. Despite historic notions of a vast expanse of endless resource, the Pacific is in fact far from limitless.
Analyzing the reorganization of the ocean as an operational landscape, we identify processes of urbanization, and specifically the exploitation of wild food-source by the commercial fishing industry driven by capitalist accumulation, commodification, and privatization. The investigation reveals the intensification and connectivities of the fishing industry to the agglomerations in relation to territorial rights and com petitive access to open-seas, patterns of regional and international trade, and the role of states versus operations of transnational corporations to include considerations of labor and technology. The intensifica tion of these practices demonstrates how commercial fishing has been rendered disassociated both with supply and demands of food systems, but also from the resource base, the marine biomass itself. Instead, fishing industries and the regulatory and governance frameworks within which they operate are dependent on achieving economies of scale to secure projected assurances to fish, synonymous with present and future profit. Furthermore, exploitative manipulation of these political and economic mechanisms are in fact jeopardizing access to and heath of wild fisheries with massive implications for the enduring stability of the Pacific Ocean as an future source of sustenance, livelihood, commerce, and culture.
Exclusive Economic Zones and Regulatory Fishery Bodies

Pacific Bathymetry in Section
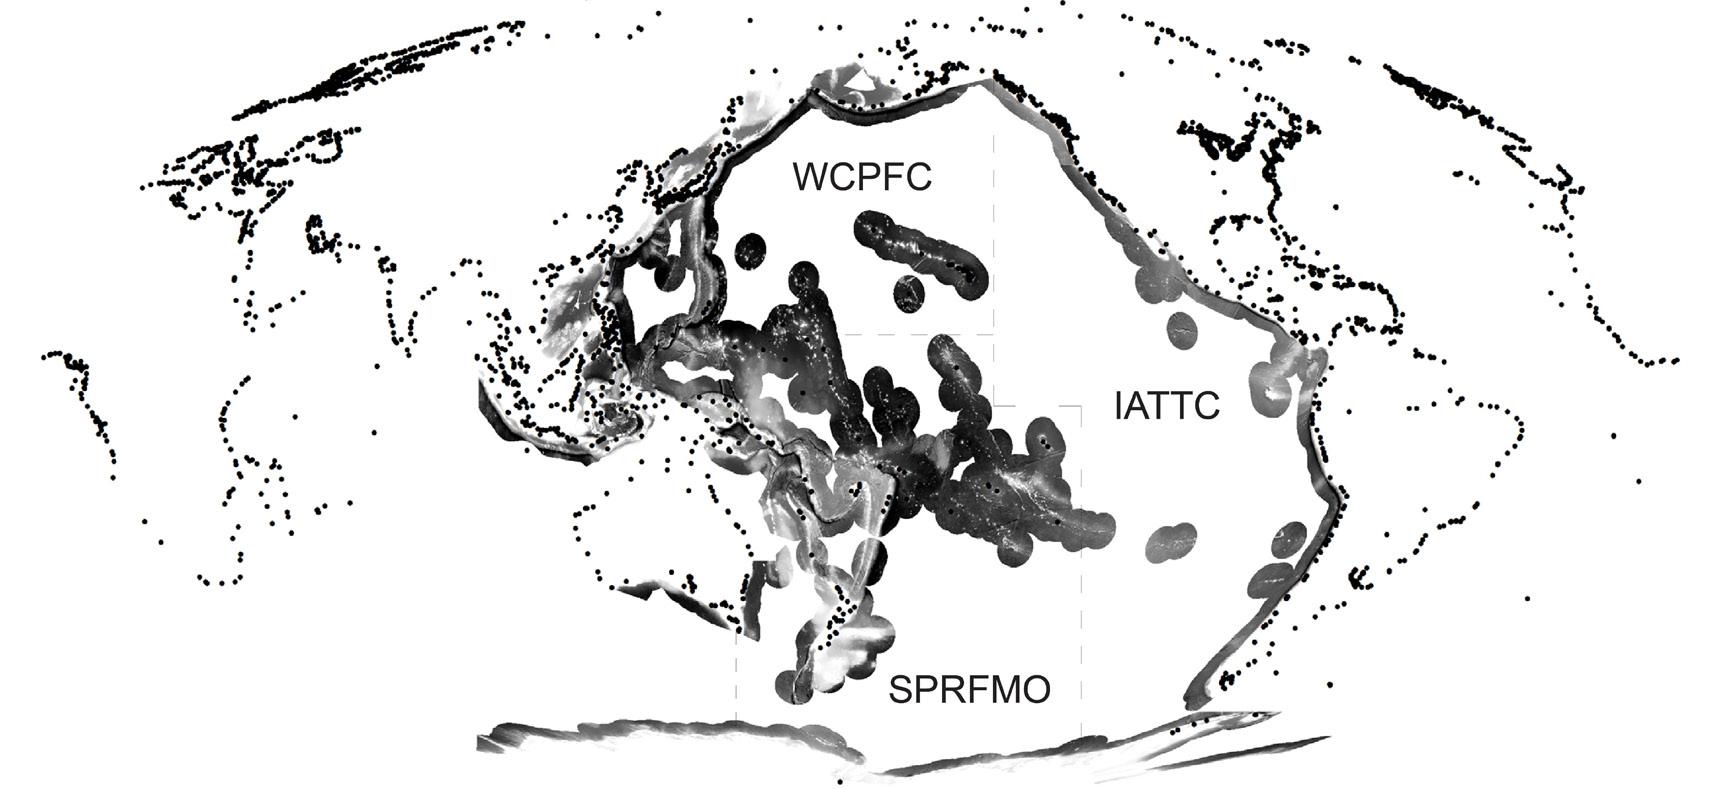
Investigating exploitations of oceanic ecological production in the Pacific Renia Kagkou | Ashley Thompson

Population Density
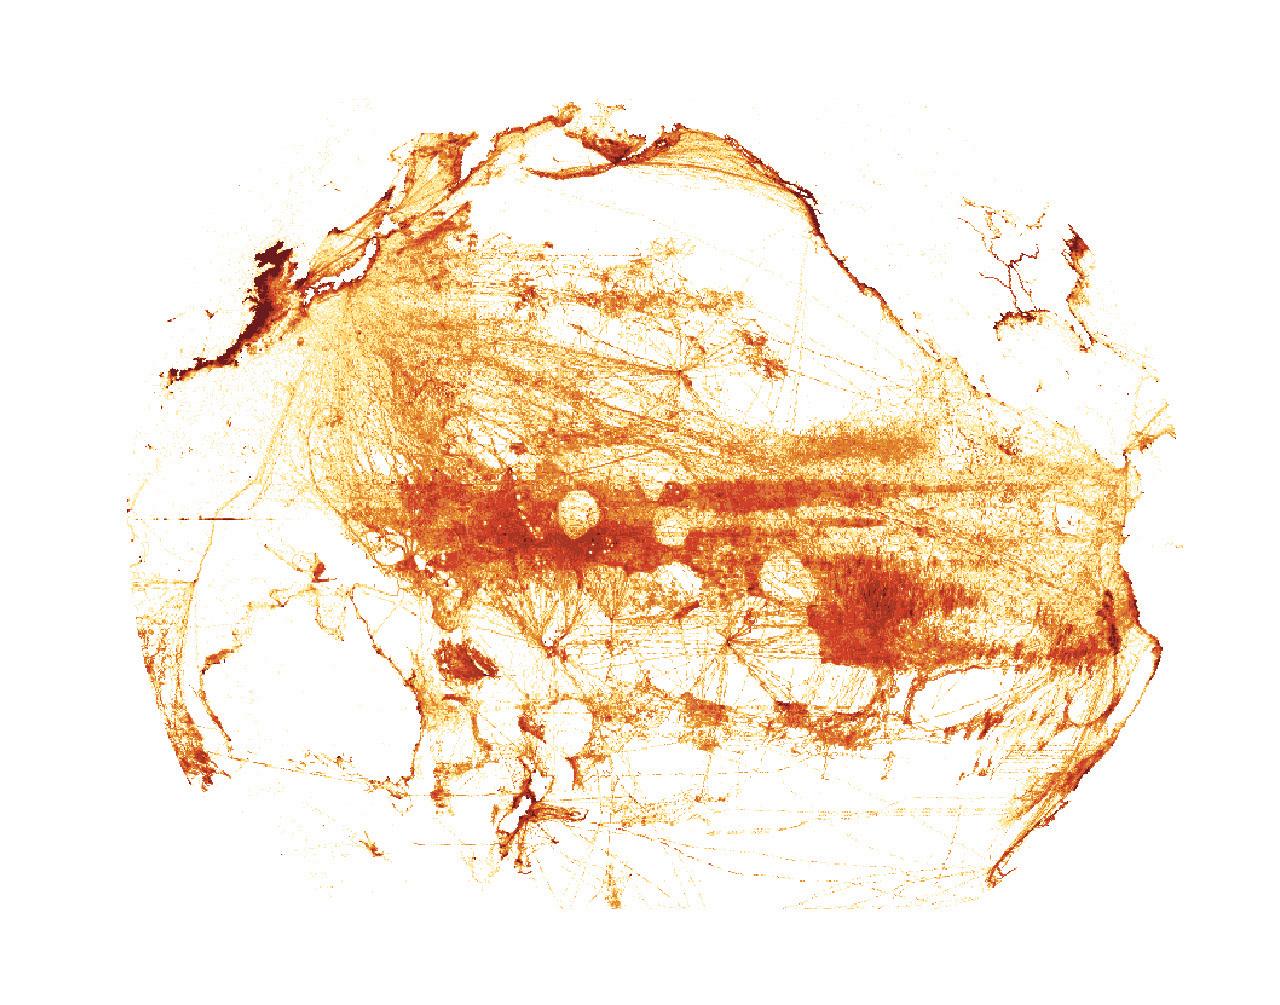
Fishing Density
Delineating the bounds of an increasingly limitless[ed] ocean, the result of this diminutive dynamic will result in overcapitalization that sinks profits to satisfy endless capital investment as all other marine social and ecological resources are inversely depleted. Investing more and more for less and less, shoring up profit margins on speculation and intensification until the system collapses, long after all the wild fish are gone – the ultimate exhaustion of cheap nature.
Pacific Fish Production Per Capital Global Fish Consumption Per Capita Harvard Graduate School of Design © Renia Kagkou | Ashley ThompsonGlobal Fish Trade Operationalization of the Pacific Mapping relational geographies is pacific limitless[ed] | UTLAltitudes of Extraction water extraction & population analysis
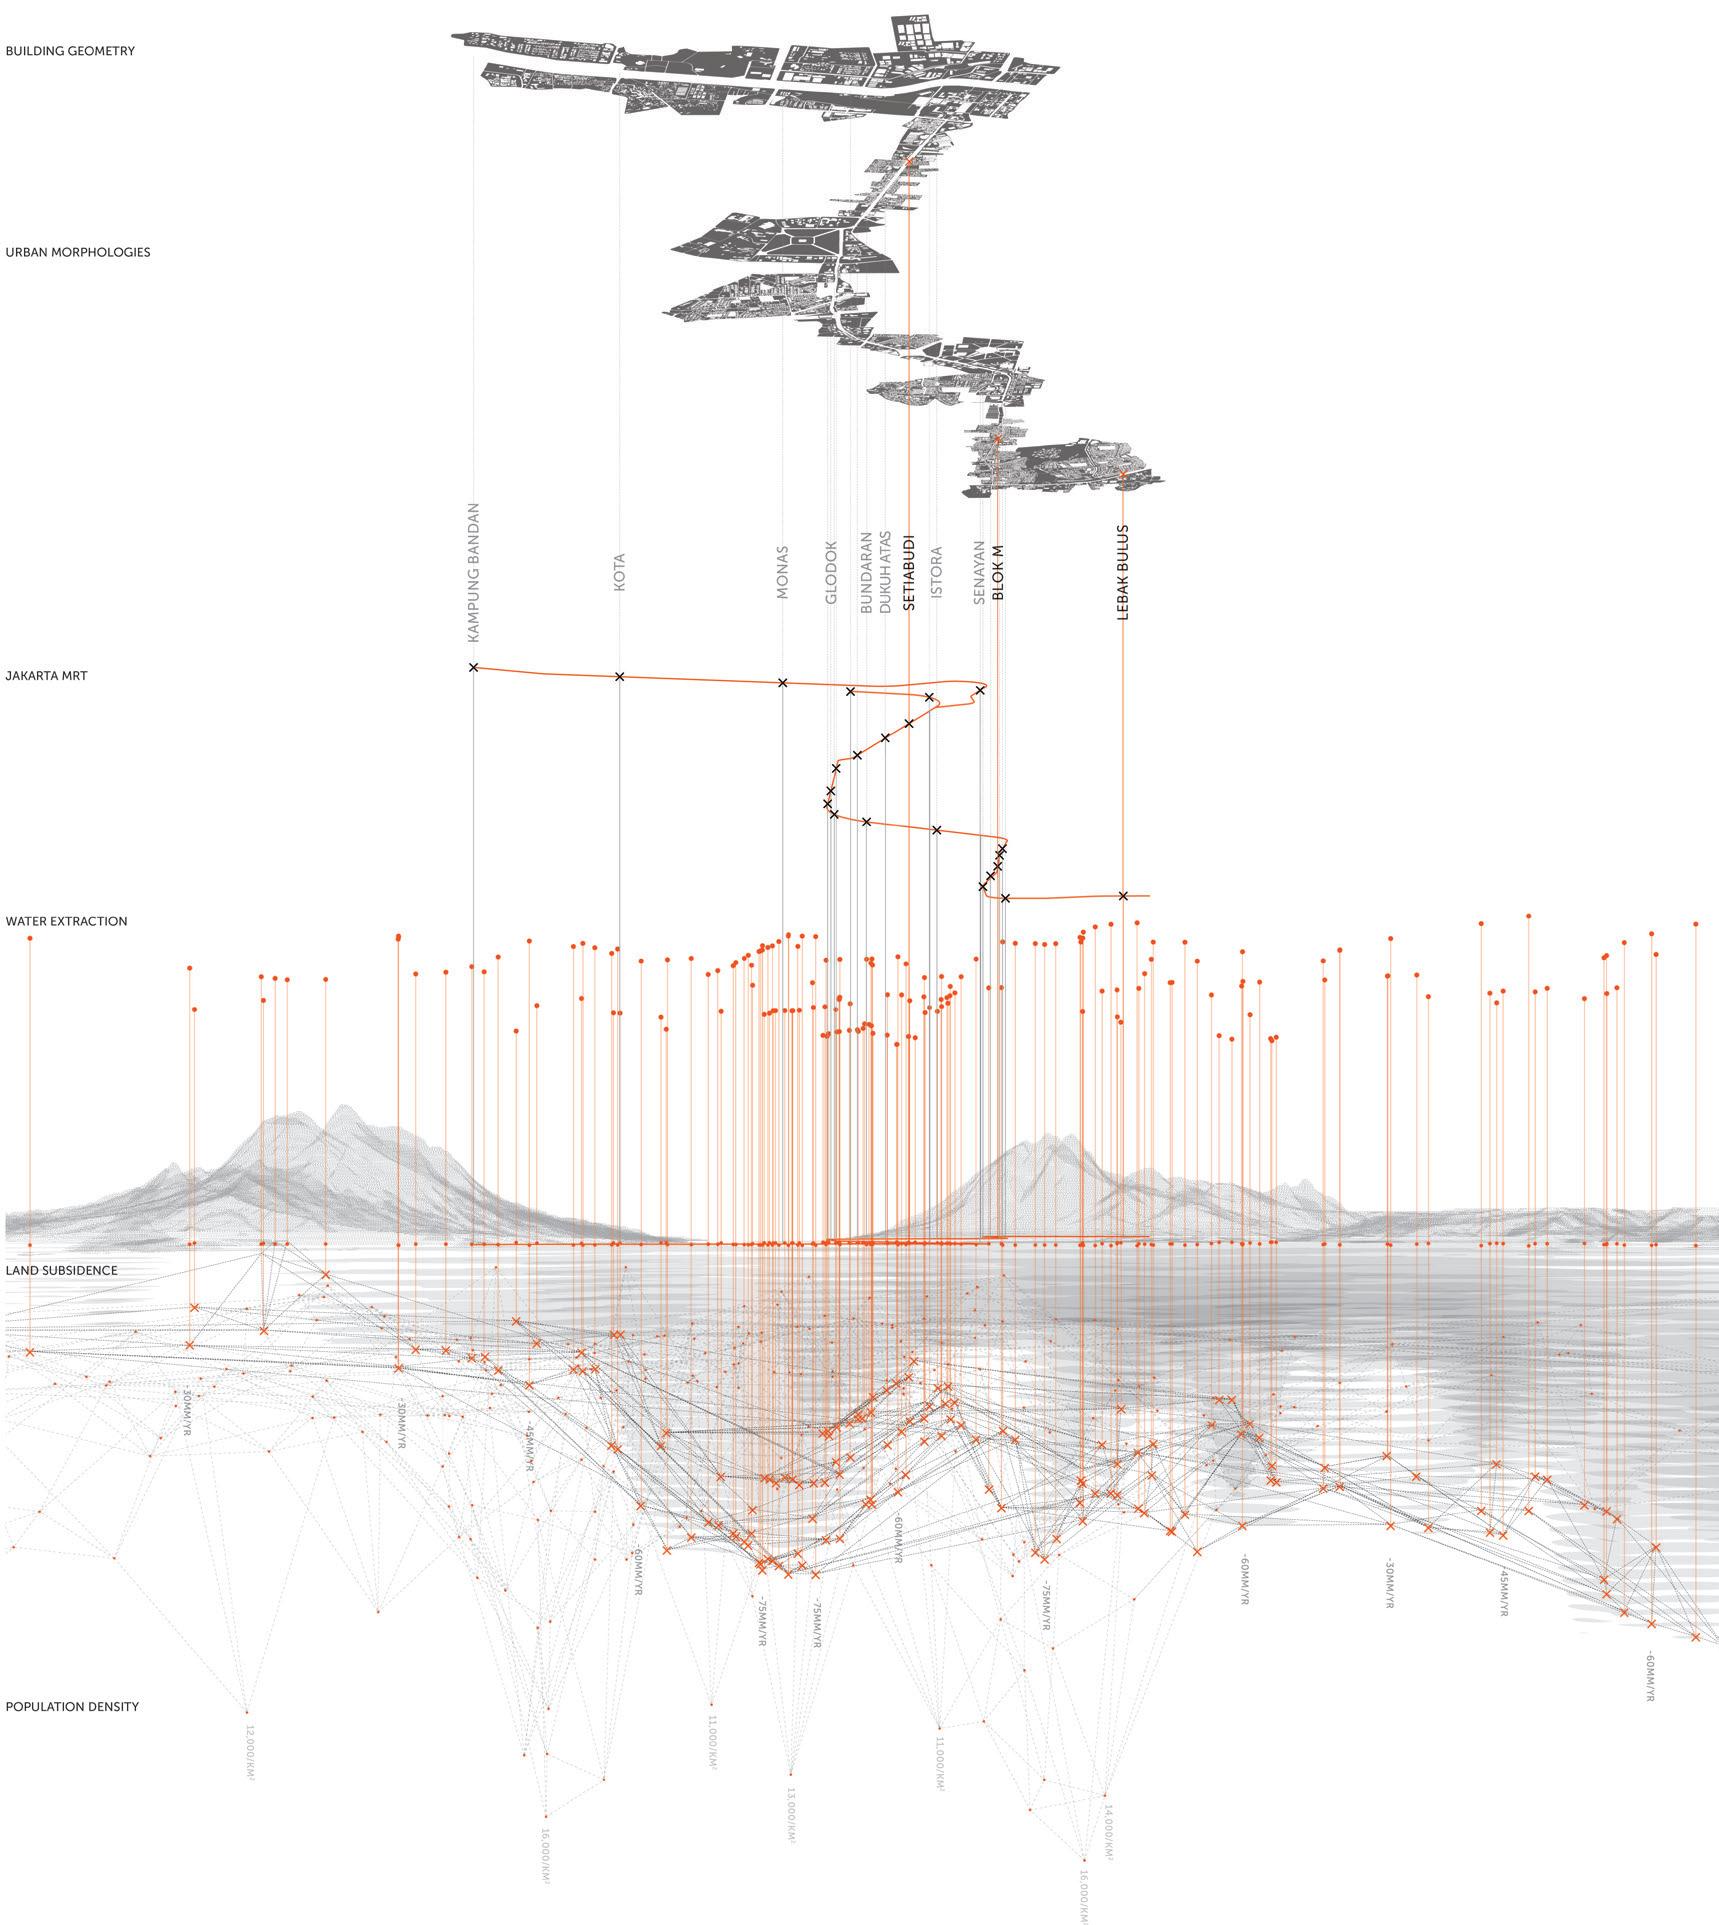
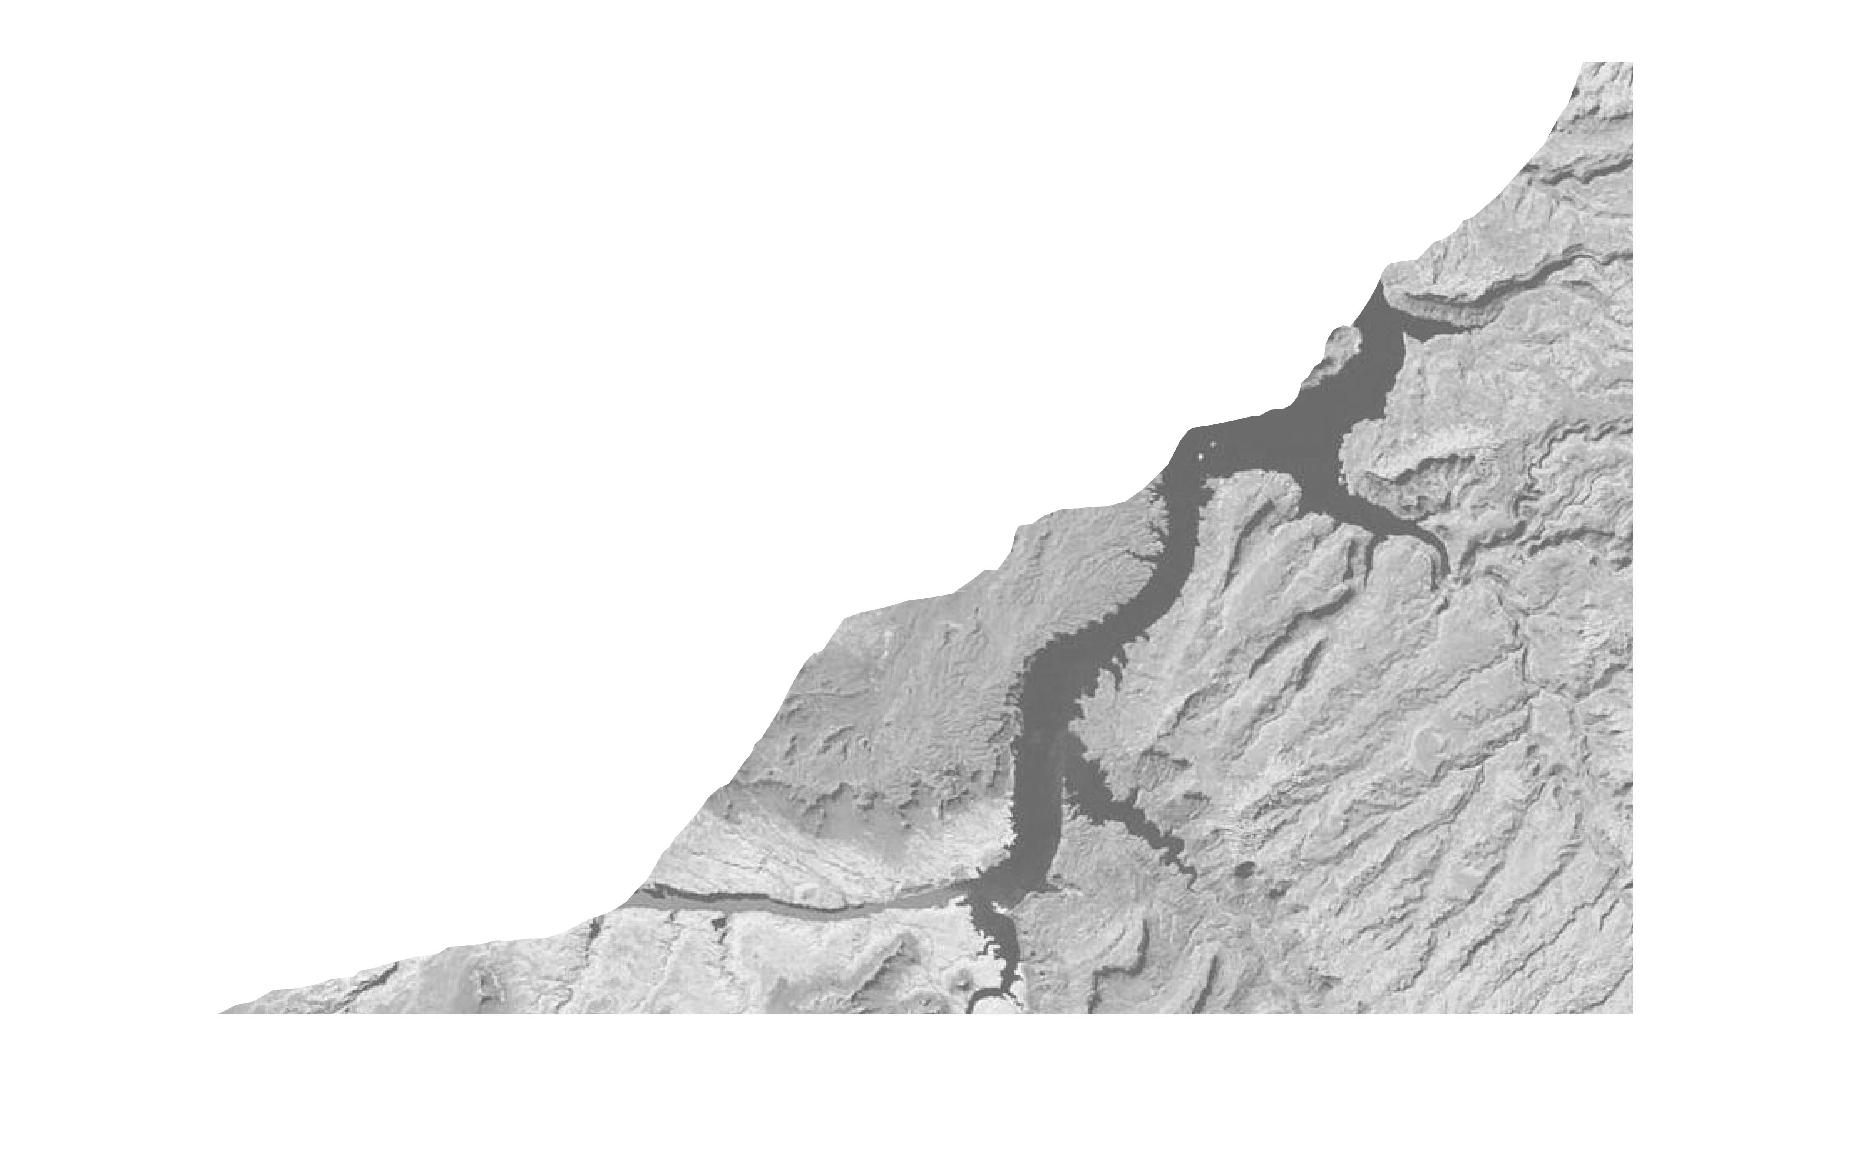
No city is sinking faster than Jakarta because of a phenomenon called subsidence. This surface motion happens when extraction of groundwater causes layers of rock and sediment to slowly pancake on top of each other. The problem is particularly acute in Jakarta because most of its millions of residents take water through wells that tap shallow underground aquifers. Wells also provide about a third of the needs of business and industry, according to city data.
As a result, the metropolitan area is sinking at an average rate of three inches a year, outpacing the one-third inch annual rise in mean sea level in the area, while the coast near Jakarta is sinking at a much greater rate of six inches a year.
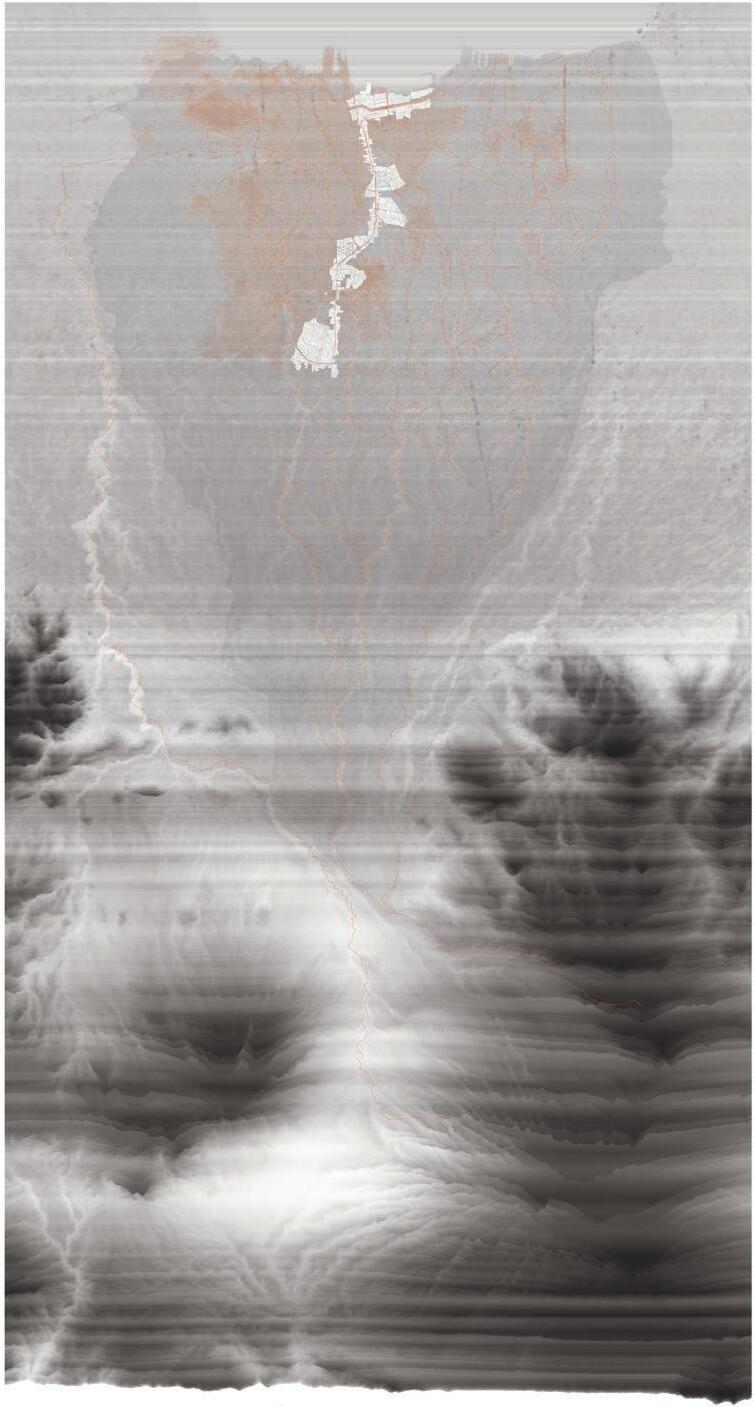
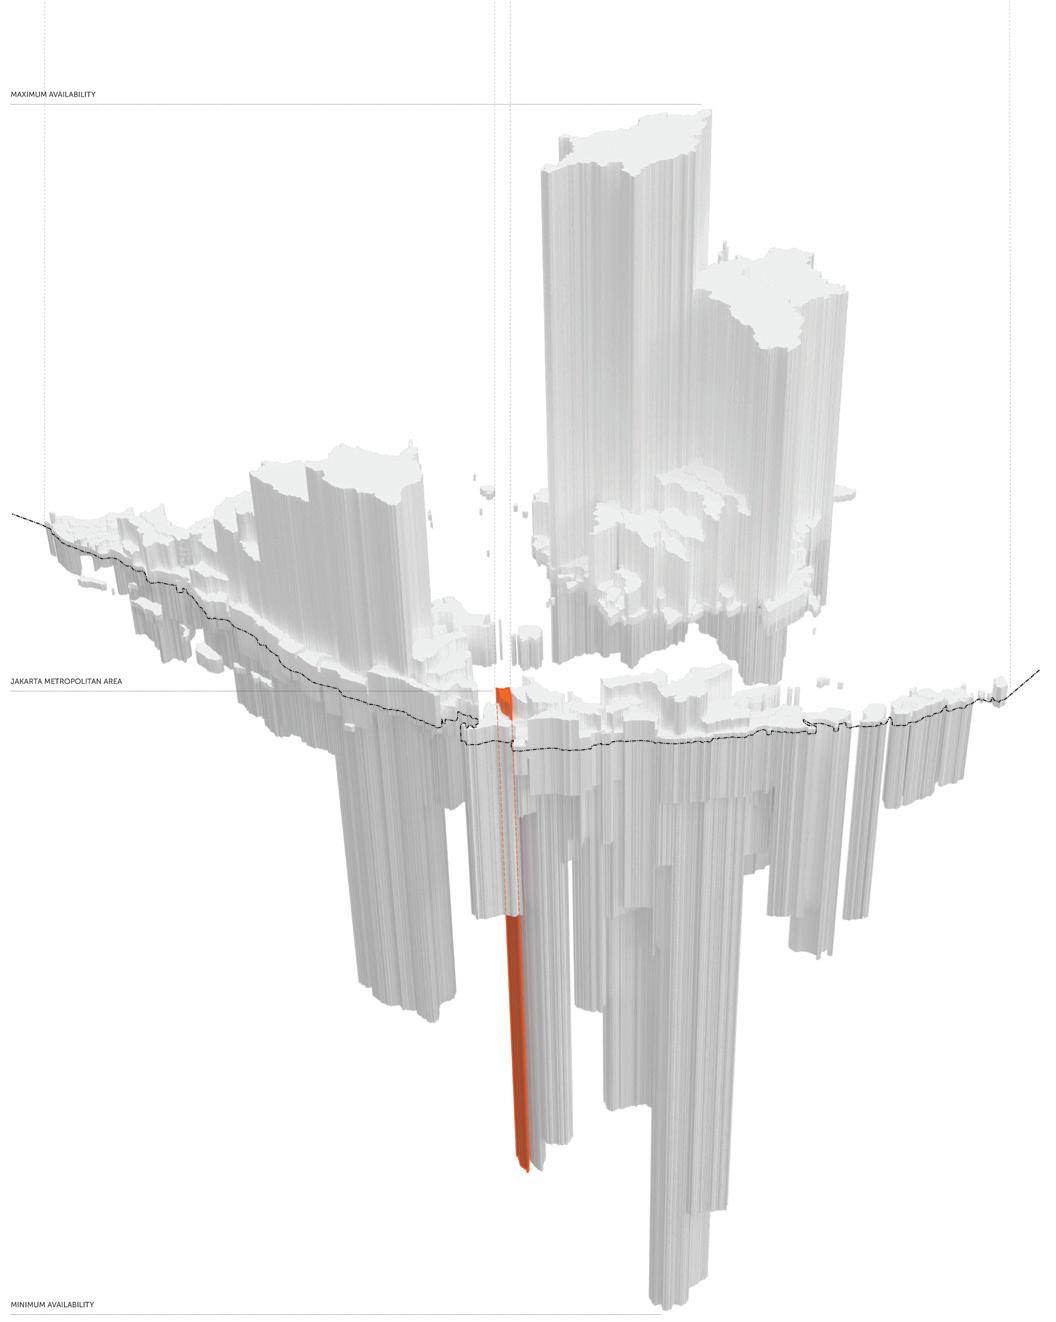
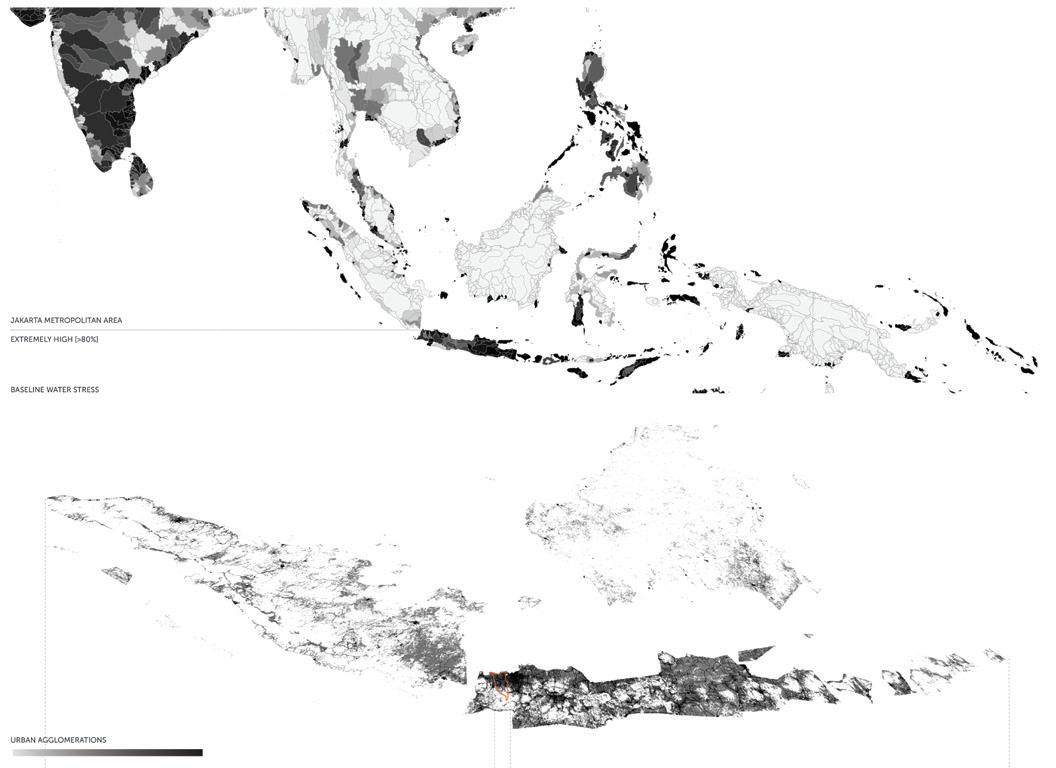
Indonesia Water Availability & Water Withdrawal water analysis around the Java Sea territory
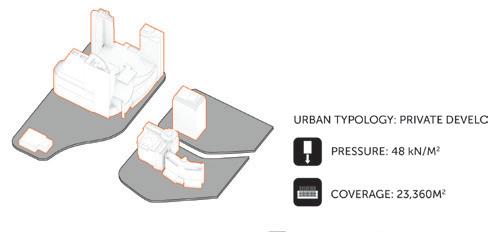
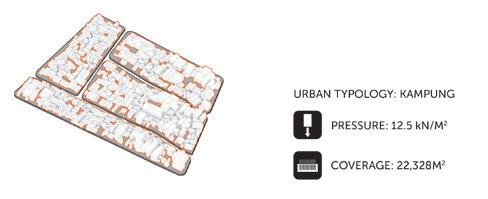
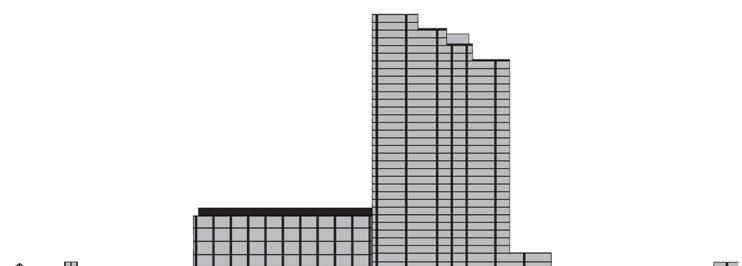
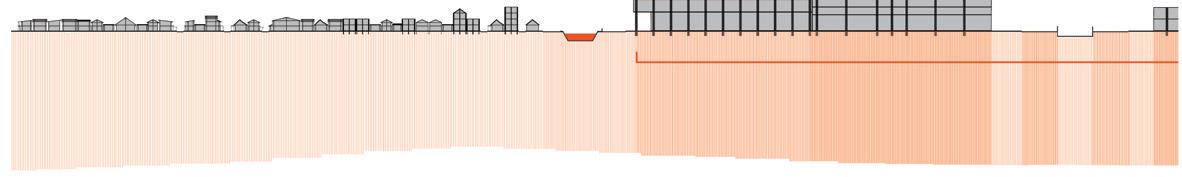
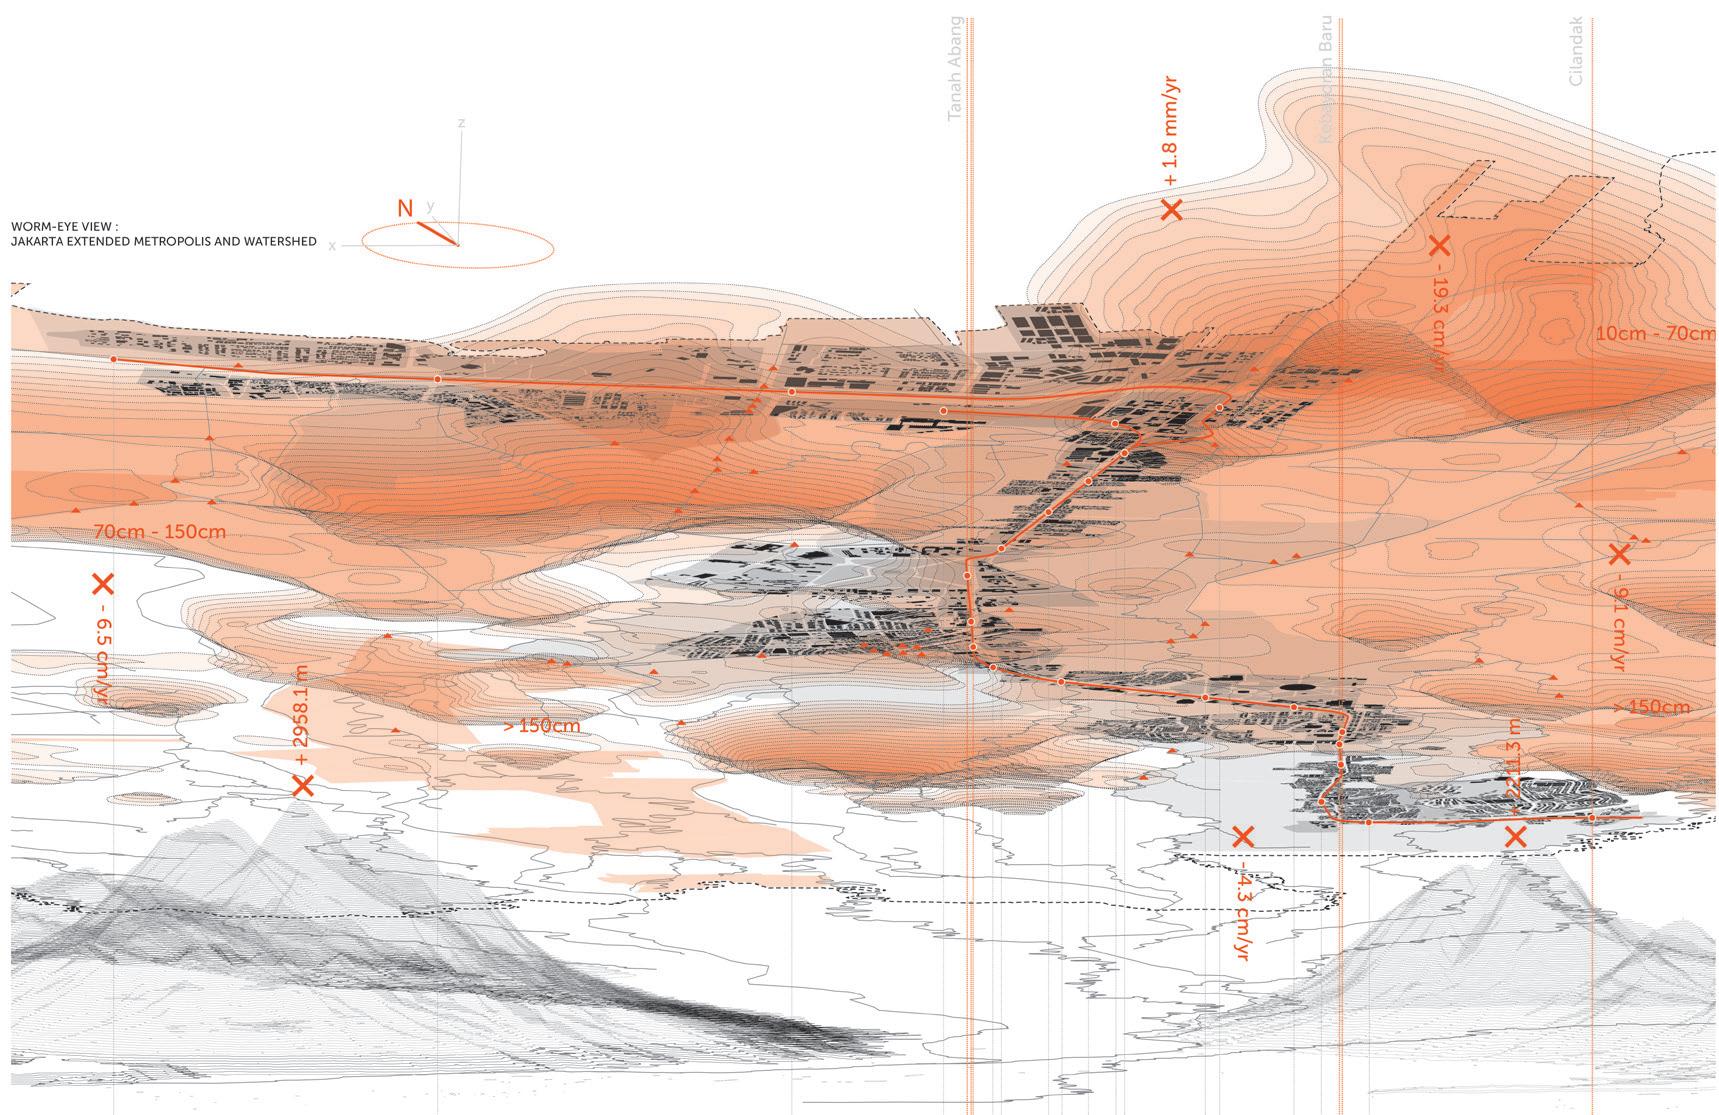
The subsidence effect of Jakarta is worsened by the sheer weight of Jakarta’s urban sprawl. Economic development in recent decades has transformed the city’s traditional low-rise silhouette into a thickening forest of high-rise towers whose weight crushes the porous ground underneath .
Kampung & New Development Pressure section of sediment and ground stress
Stratification of Subsidence view from below of Jakarta's overall sinking
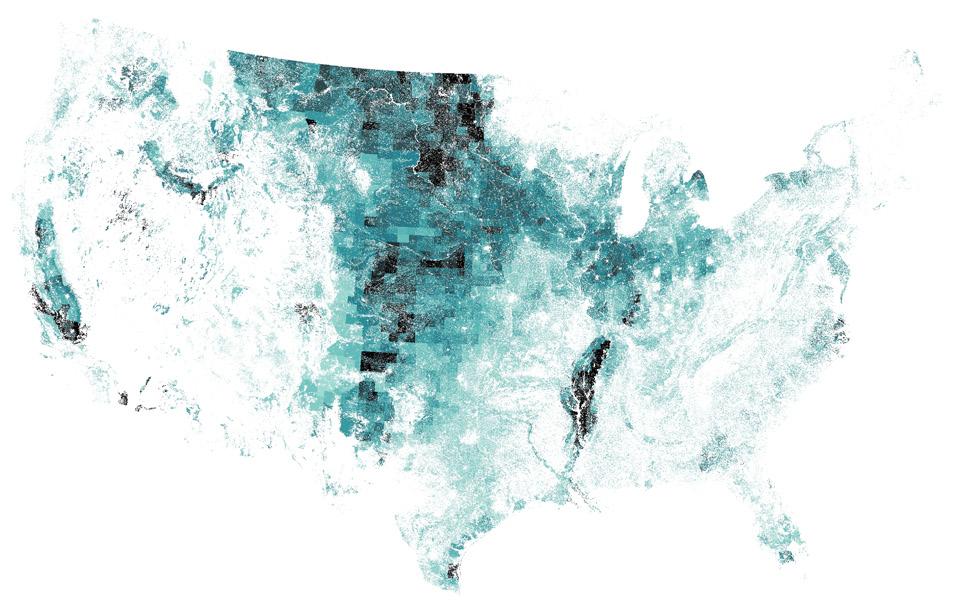
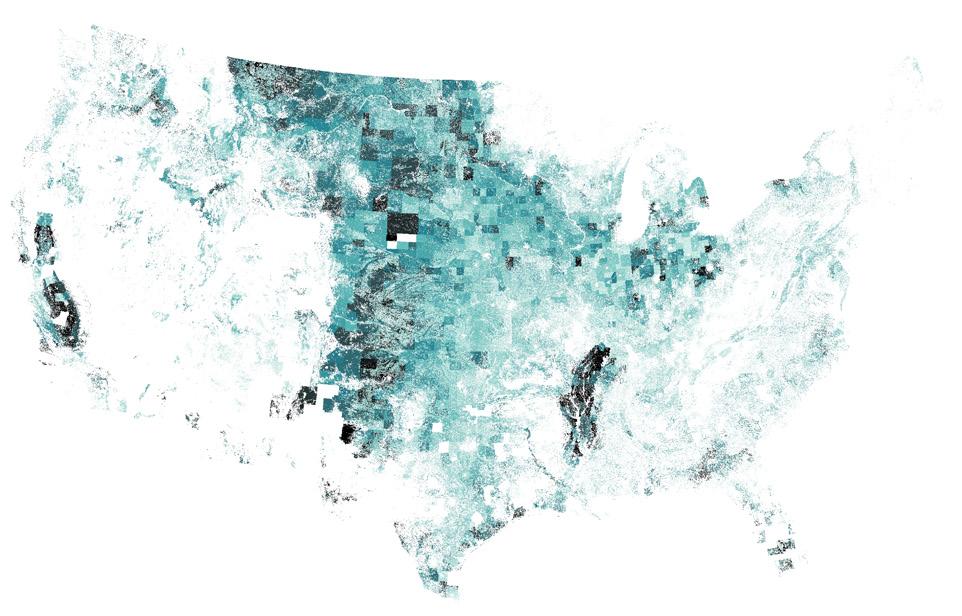
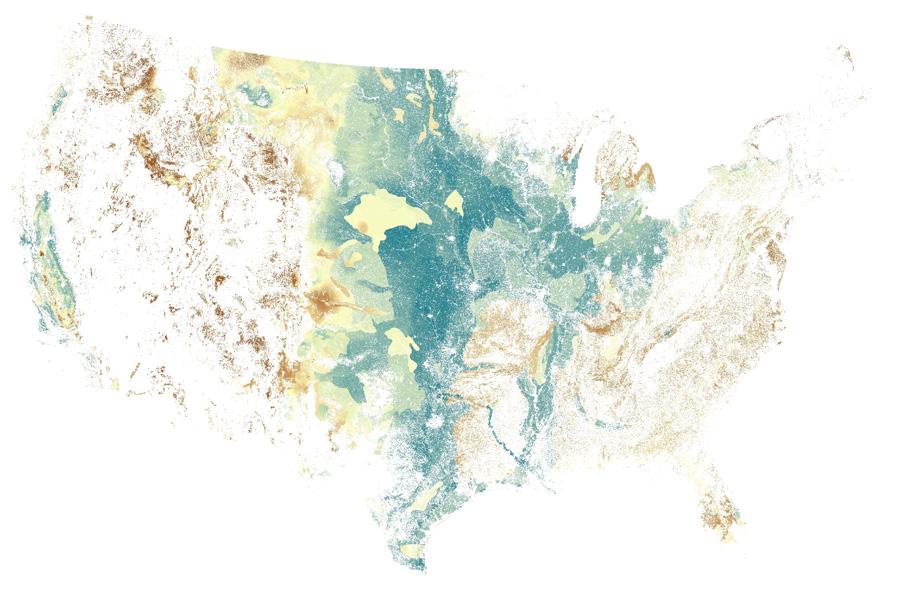
Crop Distribution in the United States
Grazing & Pasture
Commodity Crops
Specialty Crops
Synthetic Map of Agricultural Production overlay of grazing, commodity crops and specialty crops
2017
An exploration based on Spatial Analysis and Land Use Modeling
Mapping 2: Geosimulation | Robert Gerard Pietrusko [instructors], Ashley Thompson [partner] Independent Research | Robert Gerard Pietrusko [instructors]
This project tries to investigate the territorial dimension of urban metabolic processes focusing on the structure of the broader landscapes of food systems within the United States. It offers a complementary way of understanding urban metabolism which is not reduced to flows and networks but is directly connected to the ground conditions of the cultivation processes of various crops.
Through a series of cartographic representations, systems analysis and simulation models that benefit from the recent proliferation of data and modeling tools, the research explores how a series of regulatory, economic and environmental parameters affect the formal, spatial and material attributes of the geography of food production in the United States and the structure of its land use patterns.
The project grounds geographies of food systems not only by cataloging and representing the factors of agricultural production but also by comparing how different factors and their combinations are reflected upon variable patterns of the organization of agricultural land.
Federal Funding, Credit Loans , Government Payments
Cost of Land and Buildings, Equipment and Machinery Expenses
Fuel and Gas Expenses, Cost of Fertilizers and Chemicals, and Labor Costs
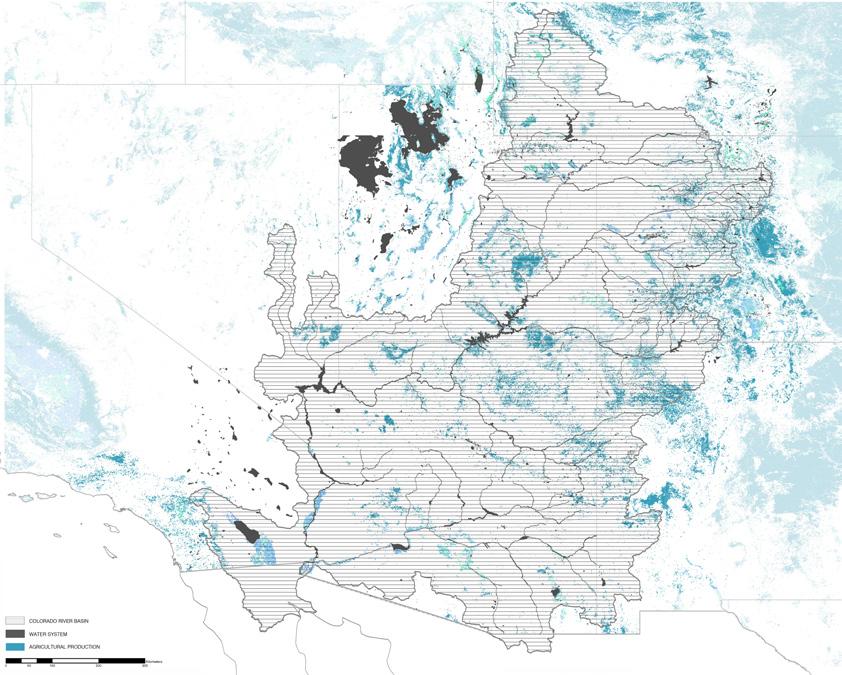
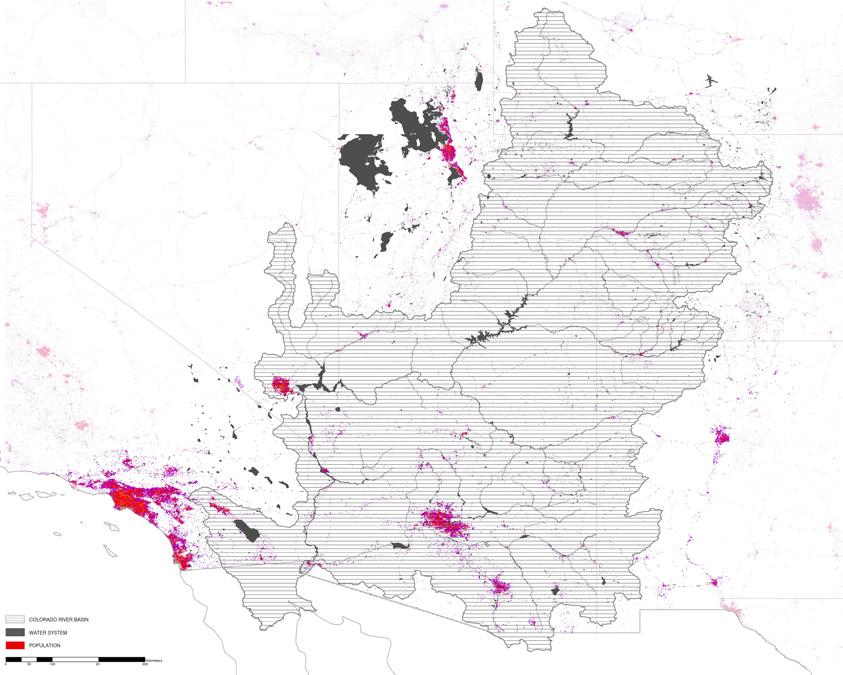
Building on the basis of these observations, the second part of the research focuses on the Colorado River Basin and speculates different scenarios of policies and regulation of agricultural productivity.
Urban Agglomerations urban areas in relation to water system
TRANS-BASIN WITHDRAWAL
METRO BOULDER FORT COLLINS COLORADO SPRINGS PUEBLO CHEYENNE
RIVER
SALT LAKE CITY PROVO
GRANDE RIVER
ALBUQUERQUE SANTA
WITHDRAWAL
GRAND JUNCTION
Agricultural Production Land specialty and commodity crops in relation to water system
LAS VEGAS
LAKE HAVASU CITY
LOS
SAN
COACHELLA

Disrepair Response
Response
Increase in number of calls is negatively correlated with property value. This could be because properties of higher value are less likely to have absentee landlords and have higher exposure to other complaint solving avenues than those of lower market value. Additionally, there is a negative relationship between quantity of physical disrepair complaints and real-estate values. This is probably because issues of physical disrepair in high property value areas are handled quickly, before residents feel motivated to call in and complaint whereas disrepair in lower property values lingers, warranting a call.
Response time statistics was expected to show a negative relationship between income and response time because government is more responsive to richer block groups. (Brown & Coulter,1983) There is a positive correlation between average response time and real-estate value for residential complaints. This may be caused by difference in the type of residential complaint made from high property value areas and low property value areas. Complaints from low value areas may be deemed more problematic and, as a result, placed above high value area complaints with respect to hierarchy of response urgency.
2017
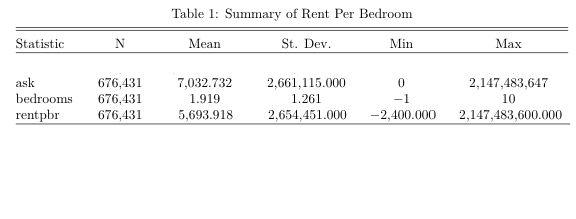
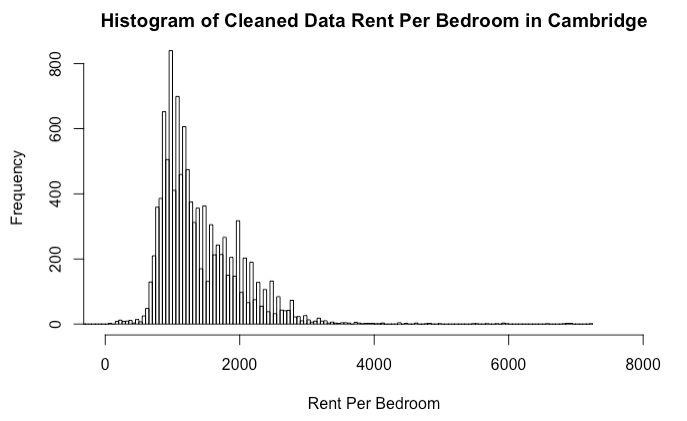
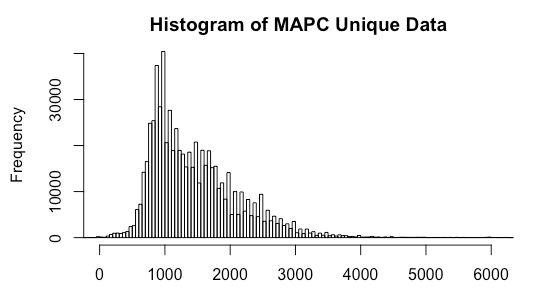
Using Craigslist data to understand rental conditions Prepared for Metropolitan Area Planning Council (MAPC)
MIT 11.521 | Joe Ferreira [instructor], Matthew Archer, Liana Banuelos & Omar De La Riva [partners]
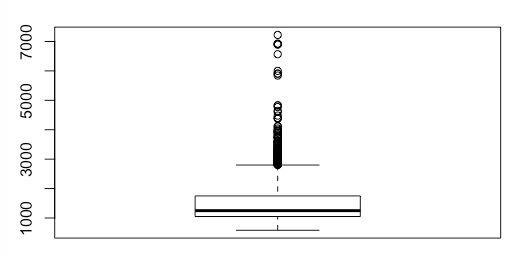
Over the past two years, the MAPC has collected data on 1.95 million rental listings in Massachusetts to better understand housing affordability and spatial variation in rental prices in the Boston Metropolitan area. Recognizing and predicting these patterns can help the MAPC work with partner cities to propose
effective policy that preserves affordability in communities throughout the region. Because the listing information was collected through a scraping process on websites such as Craigslist and PadMapper, the data includes listings that are duplicates and/or improperly geolocated. Drawing meaningful relationships and conclusions from this dataset, then, can be hindered by the excess, and often incomplete, information. .
To aid in the MAPC efforts, our team set out to:
Establish an effective, replicable method for de-duplication
Distinguish between listings seeking housemates and whole units
Determine average rent prices (using only whole units)
Use average rents to re-run distinction between housemates and units
Transform housemate listing prices to full unit prices
Examine the effect of site specific and unit specific amenities on price
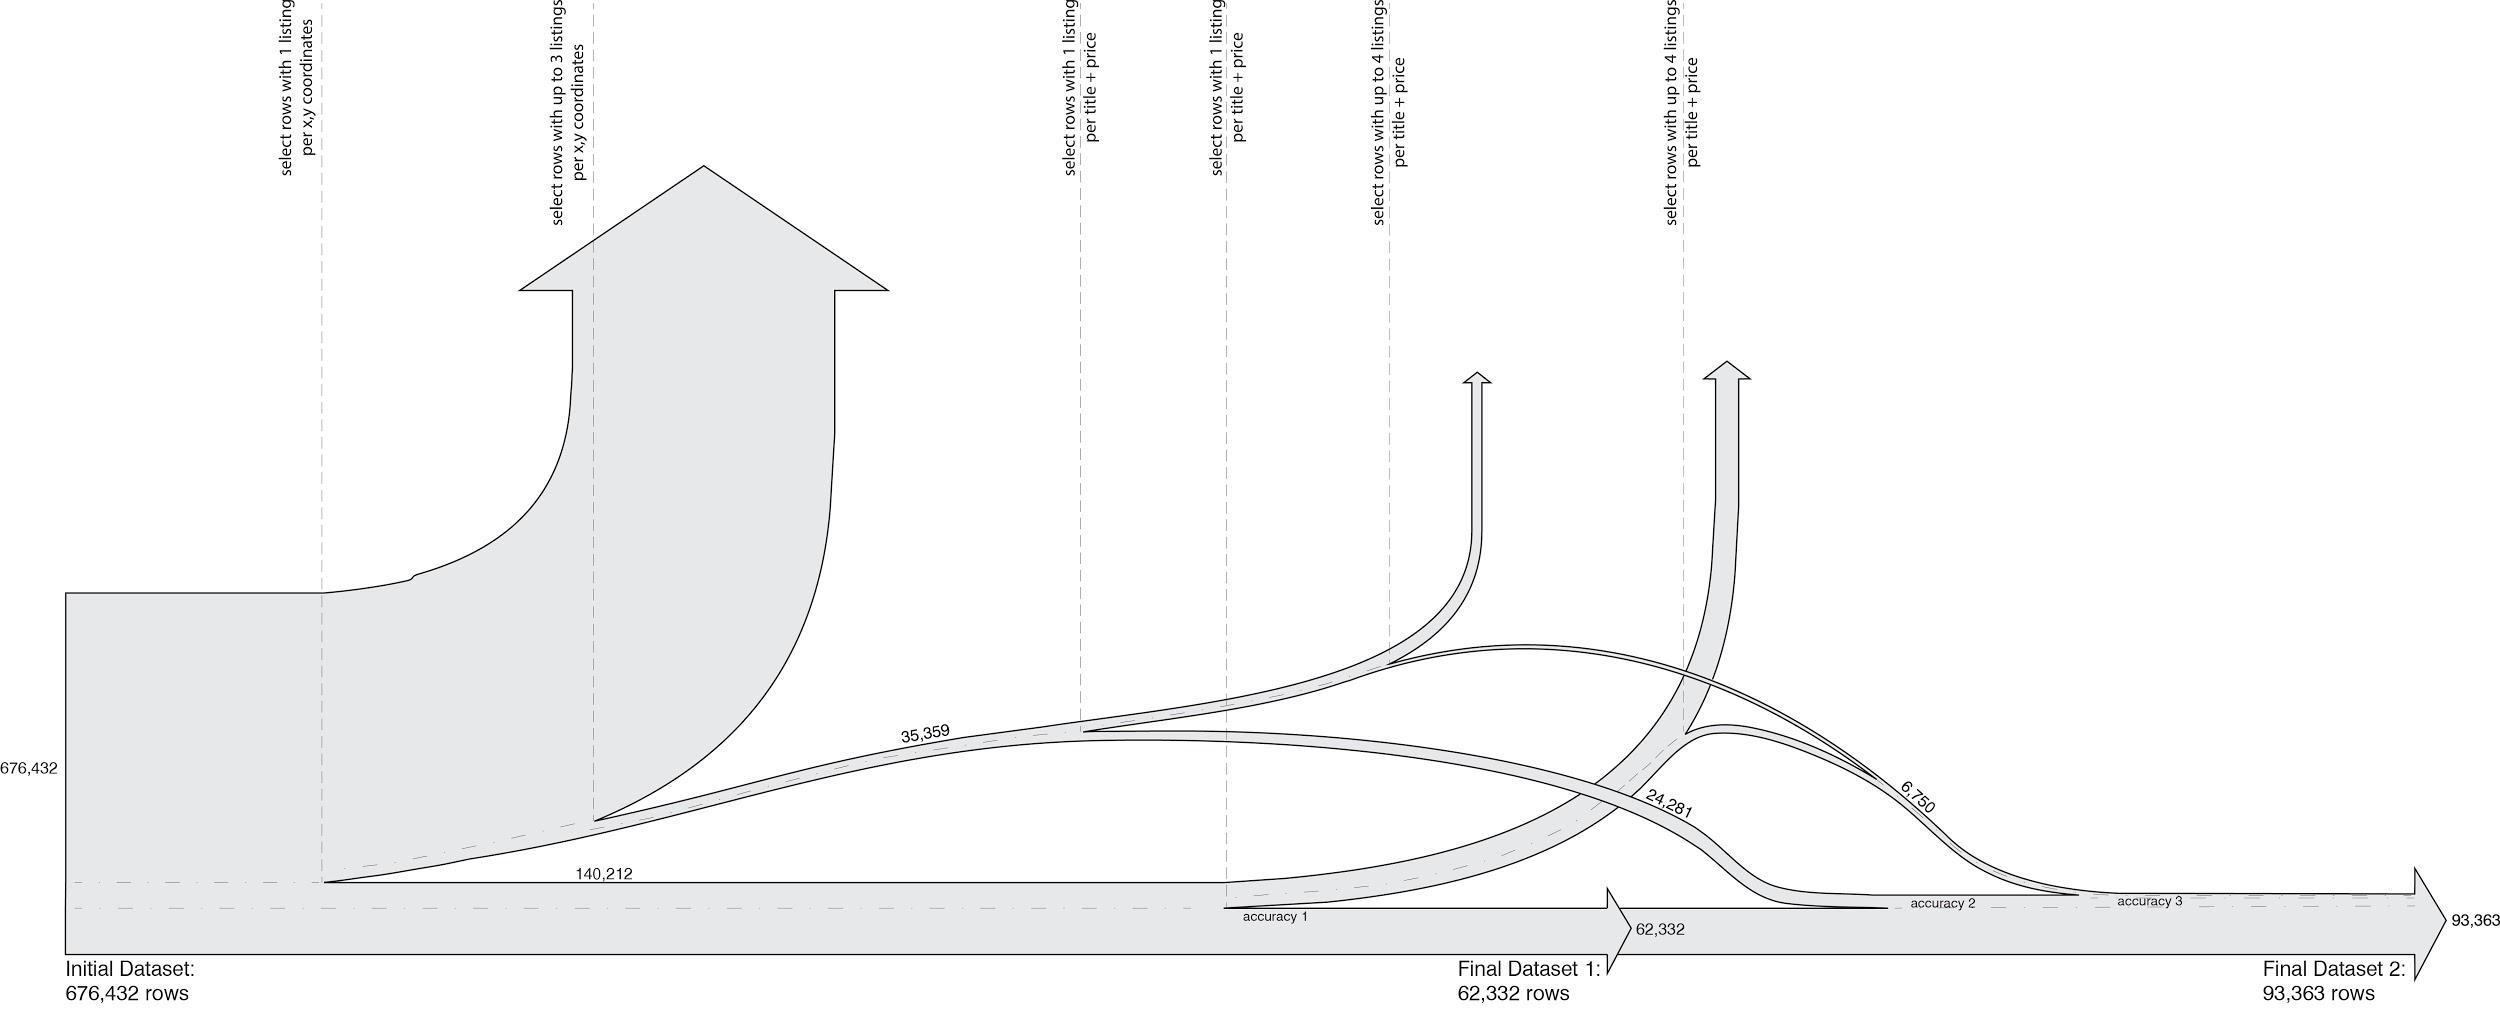
Understand these characteristics spatially
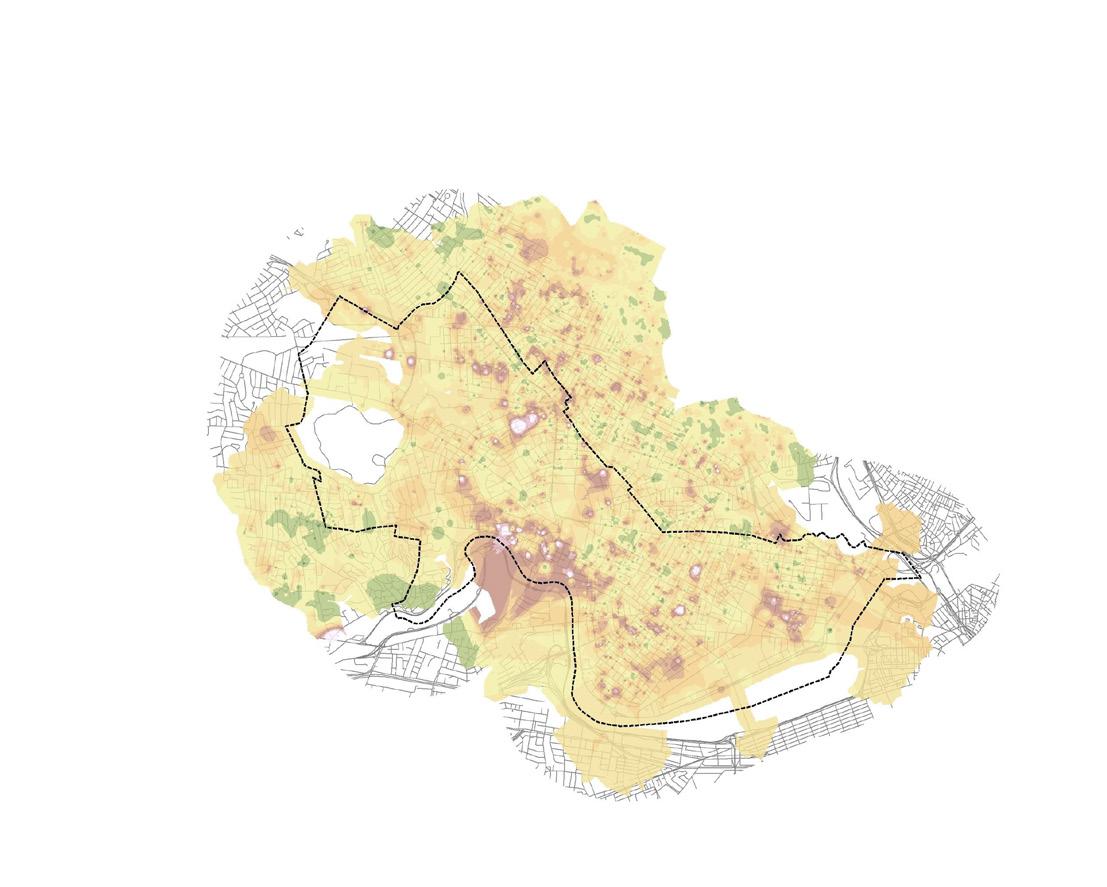
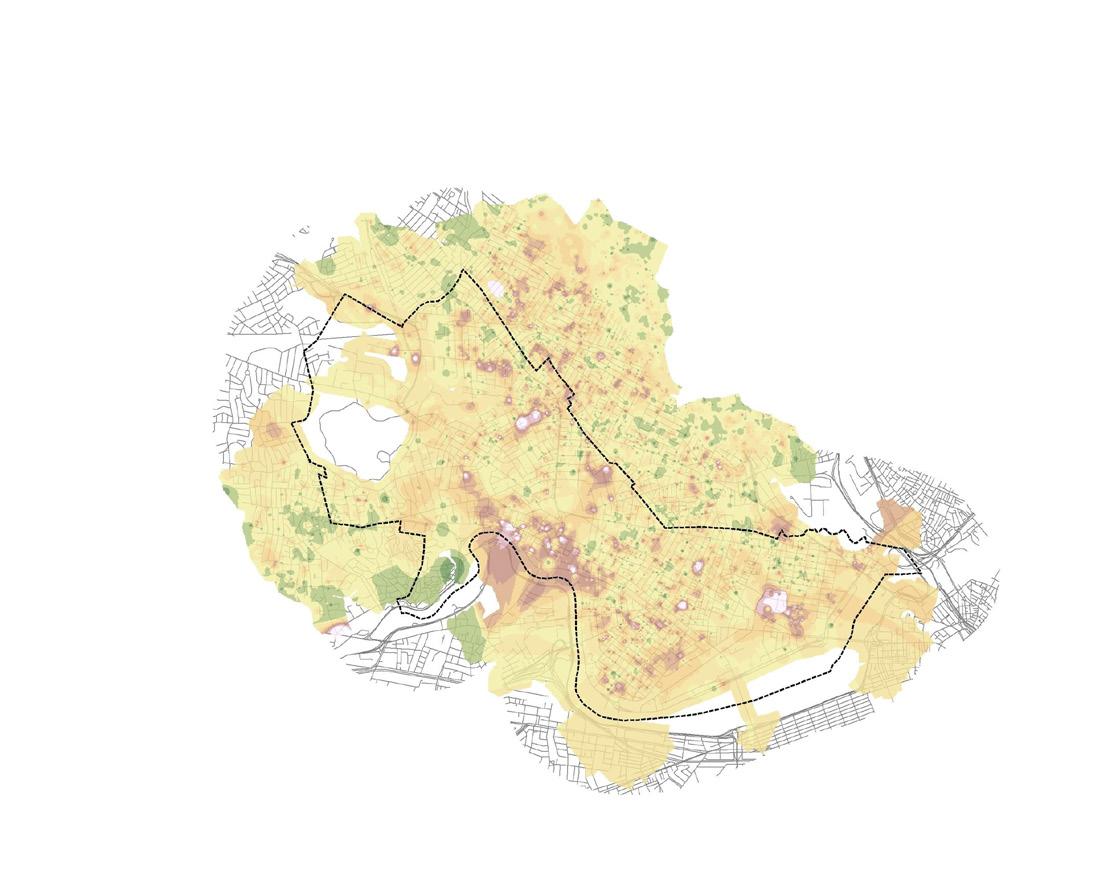
Defining Neighborhood Size based on a transit, businesses & households
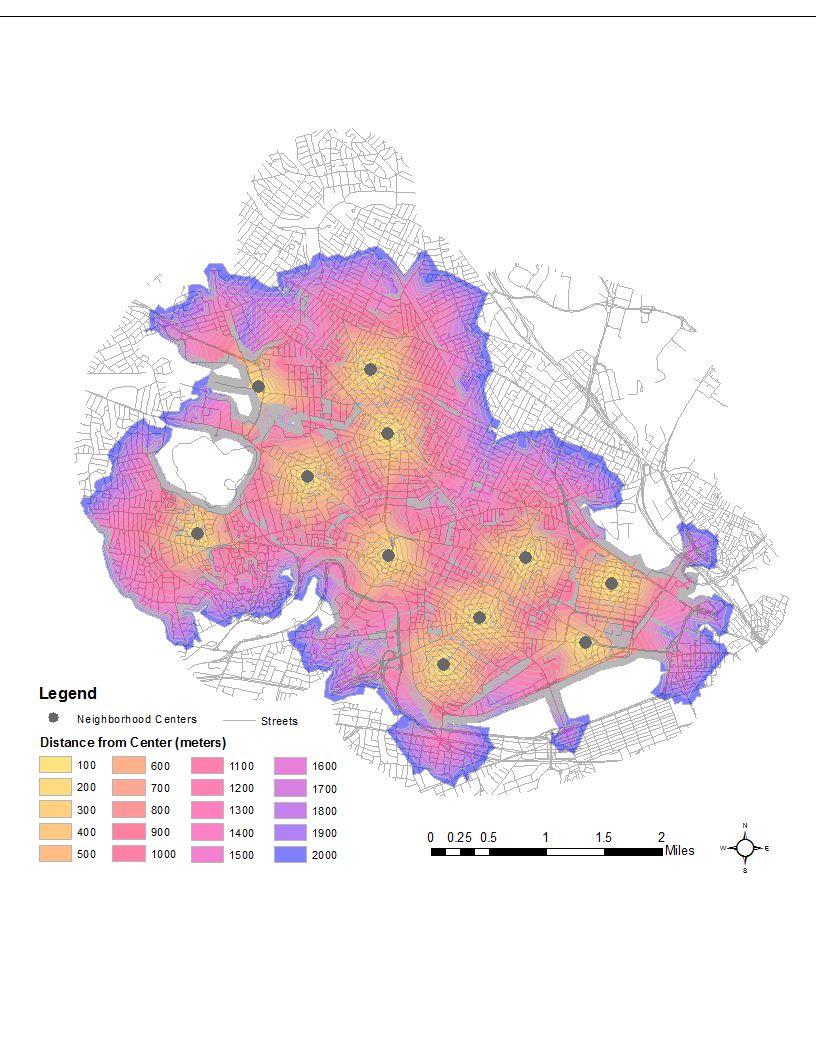
team considered the following
to
Distance from MBTA Rail Stop
Amenities :
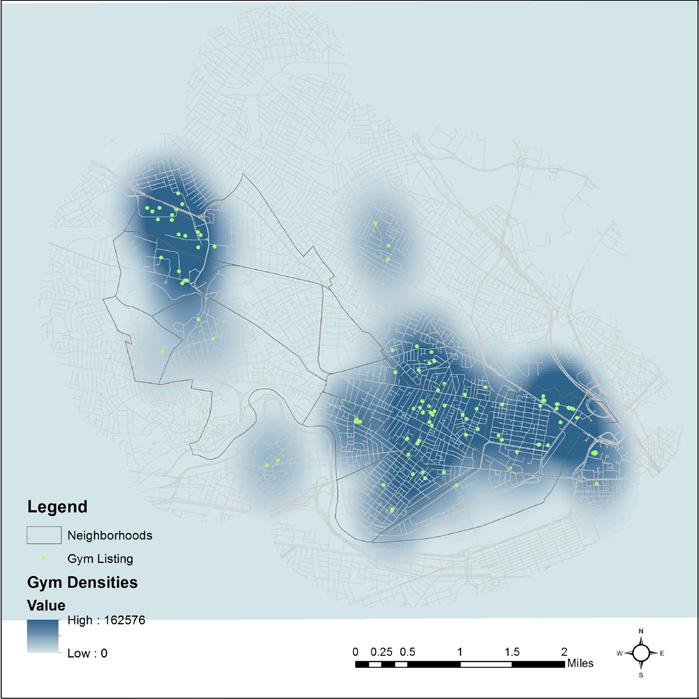
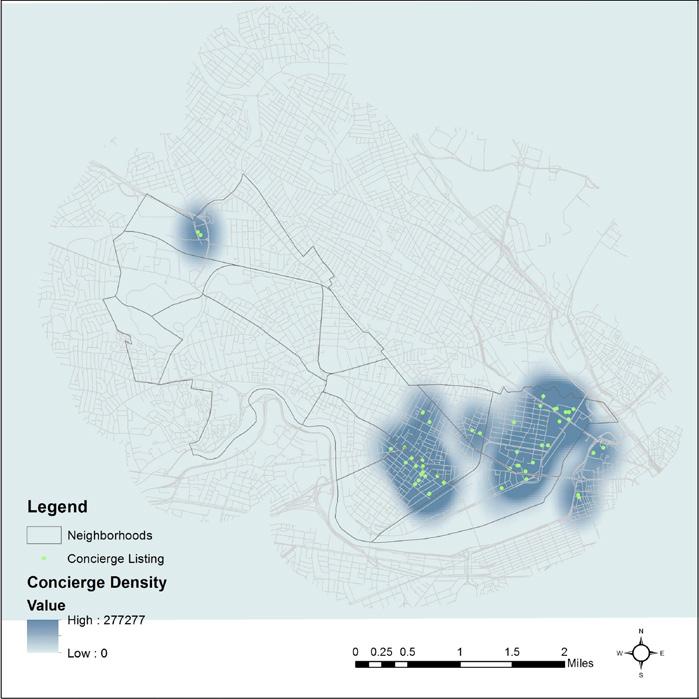
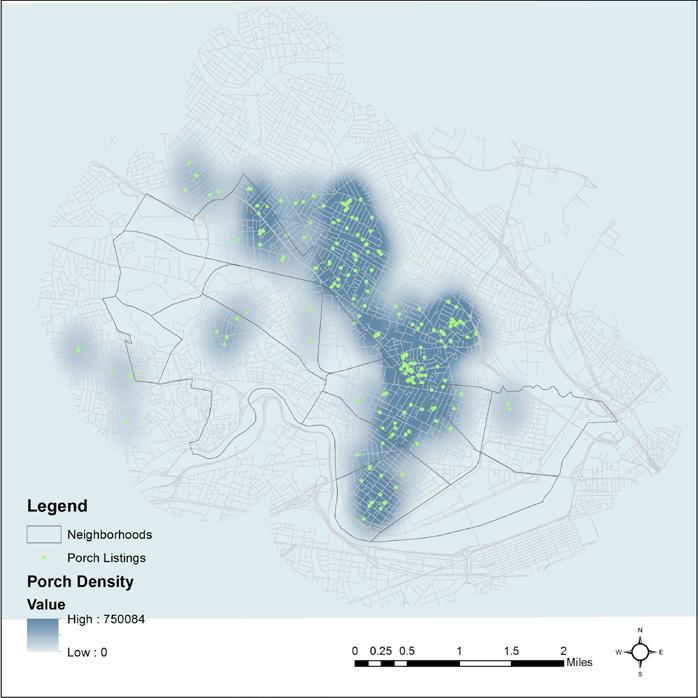
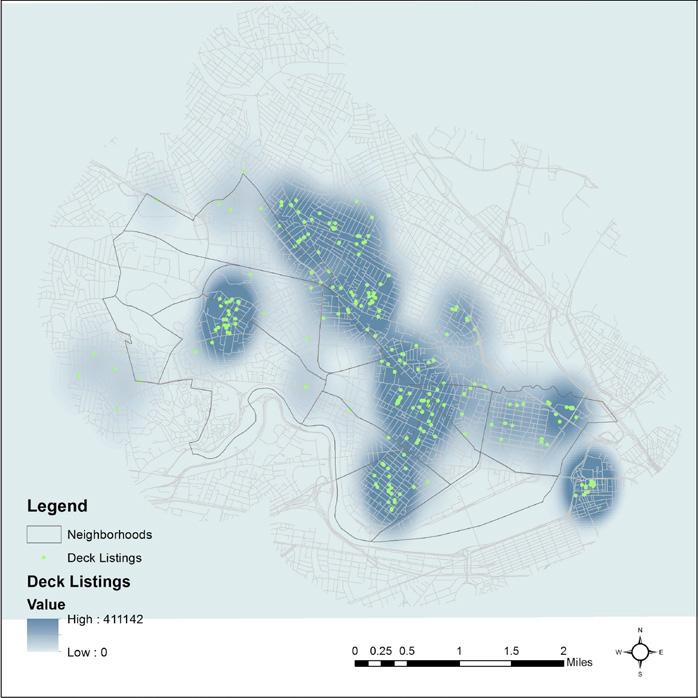
Deck, Porch, Yard, Brick, Laundry, Parking, AC, Gas & Heat, Dishwasher, Hardwood
Floors, Electricity Included, Utilities Included, No Broker’s Fee, In Unit Gym, Concierge, Loft, Natural Light, Pets Allowed, Storage ,Internet
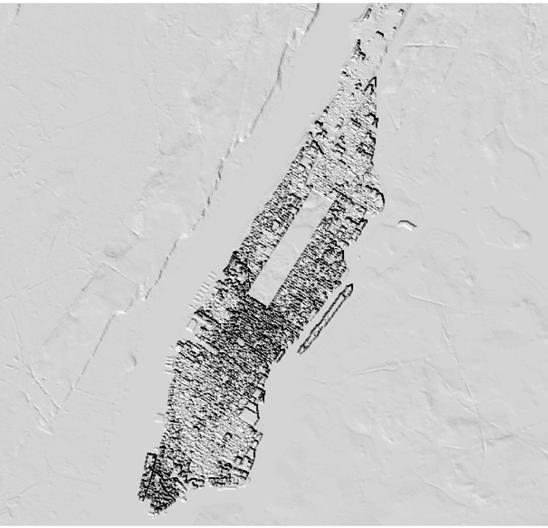
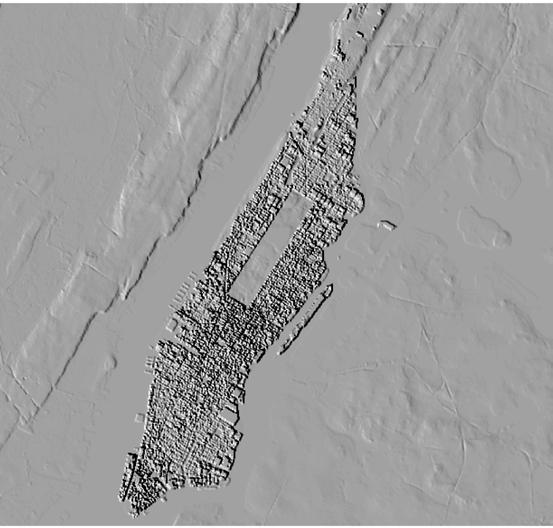
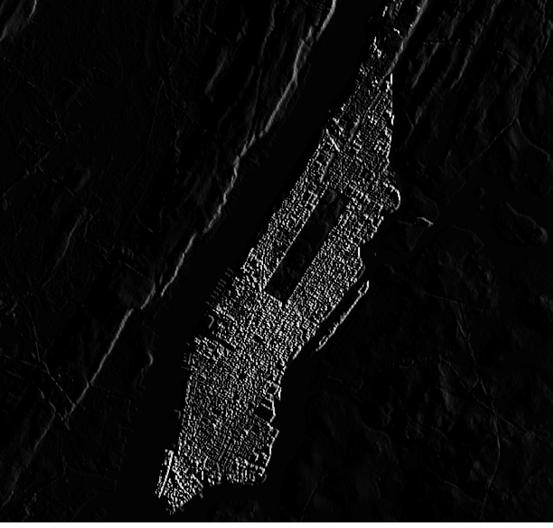
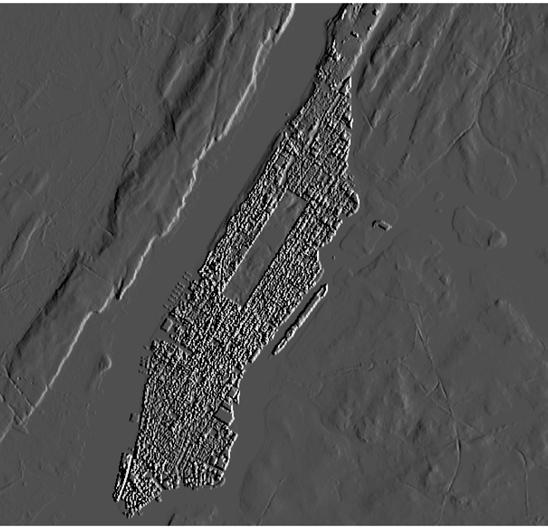
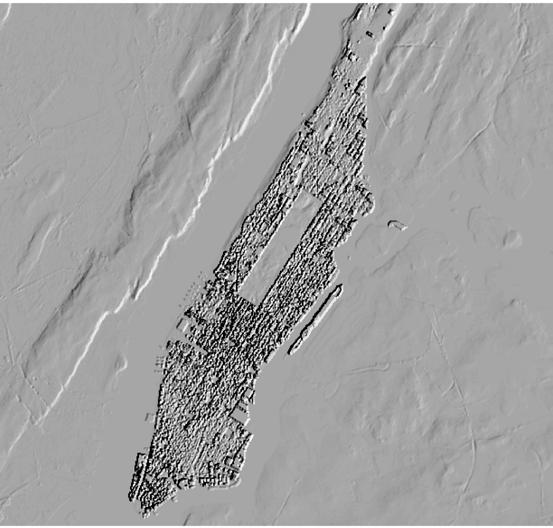
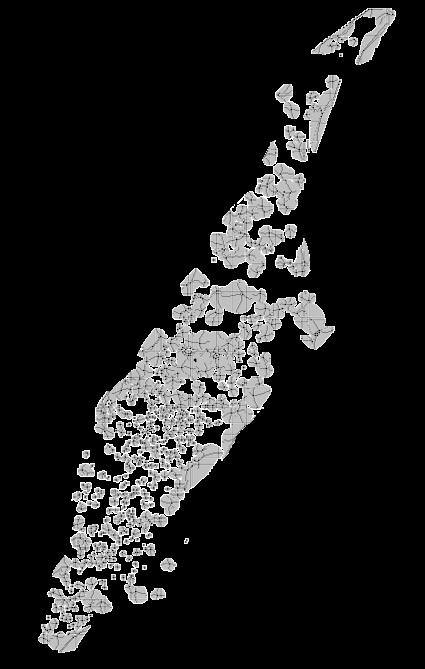
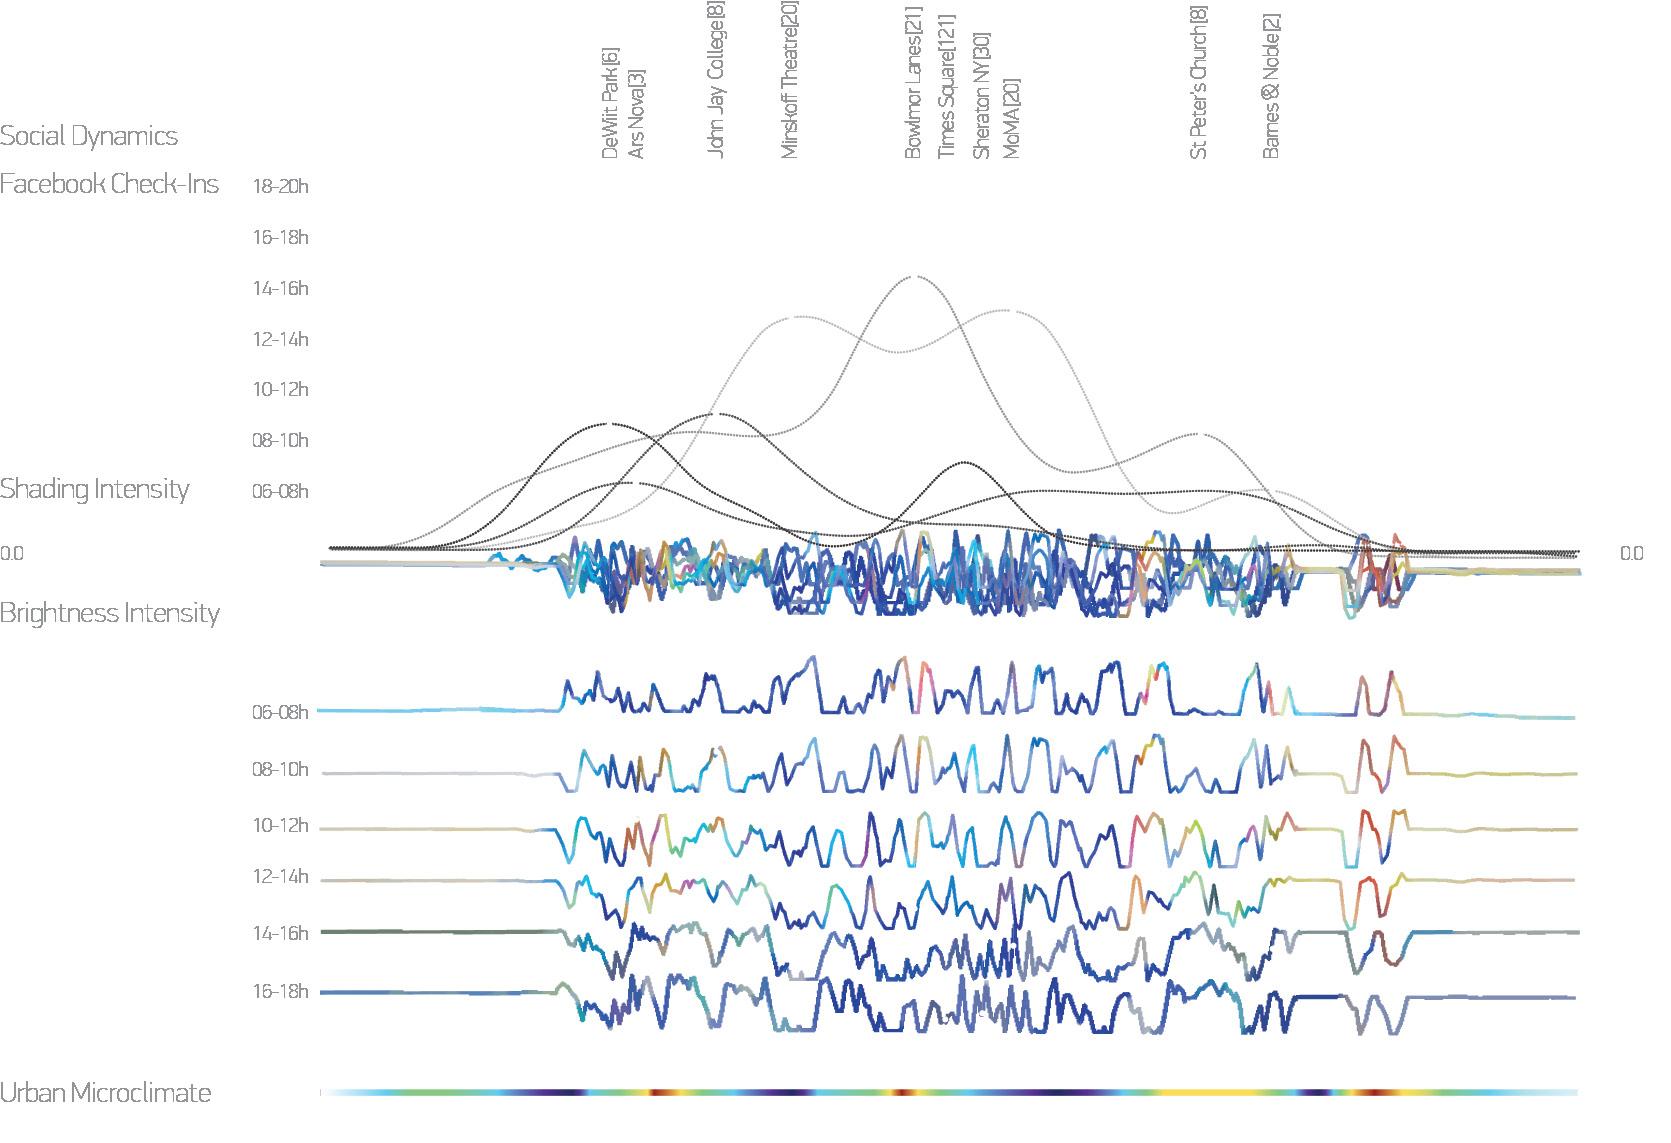
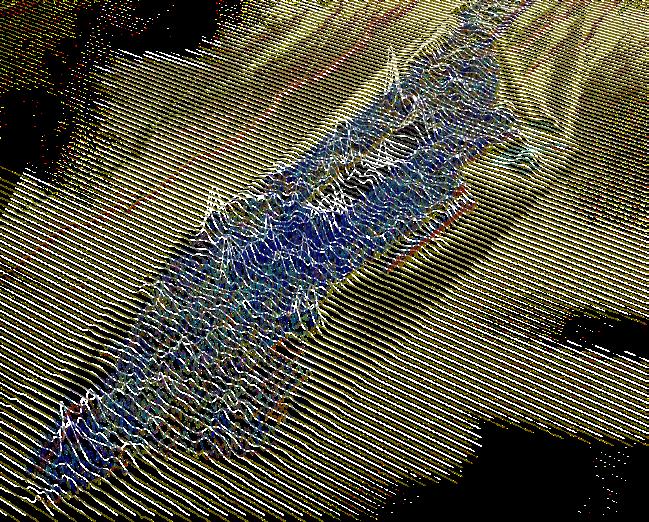
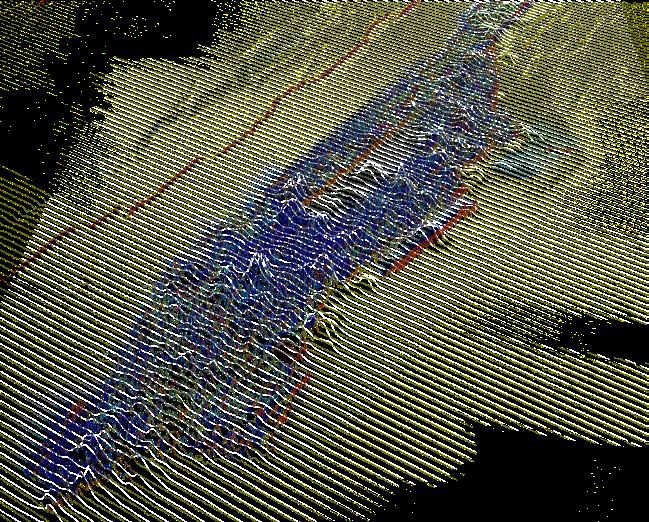
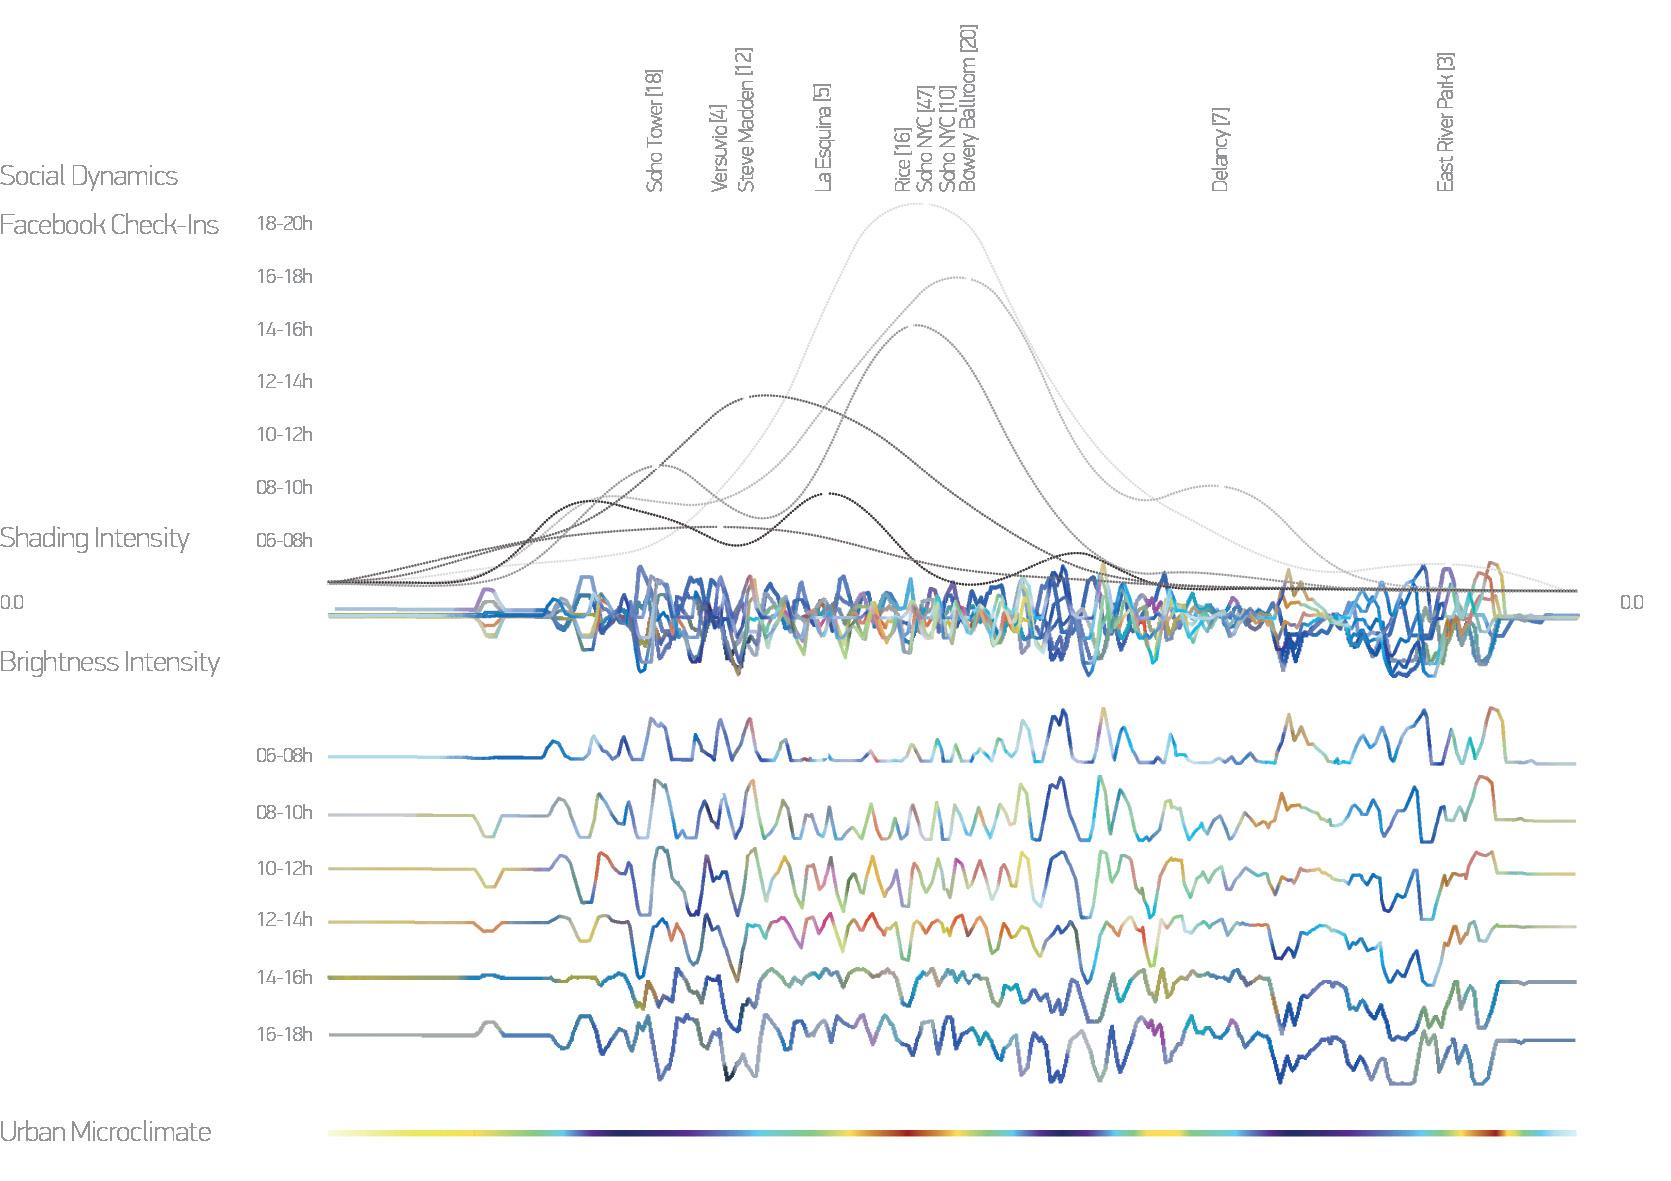
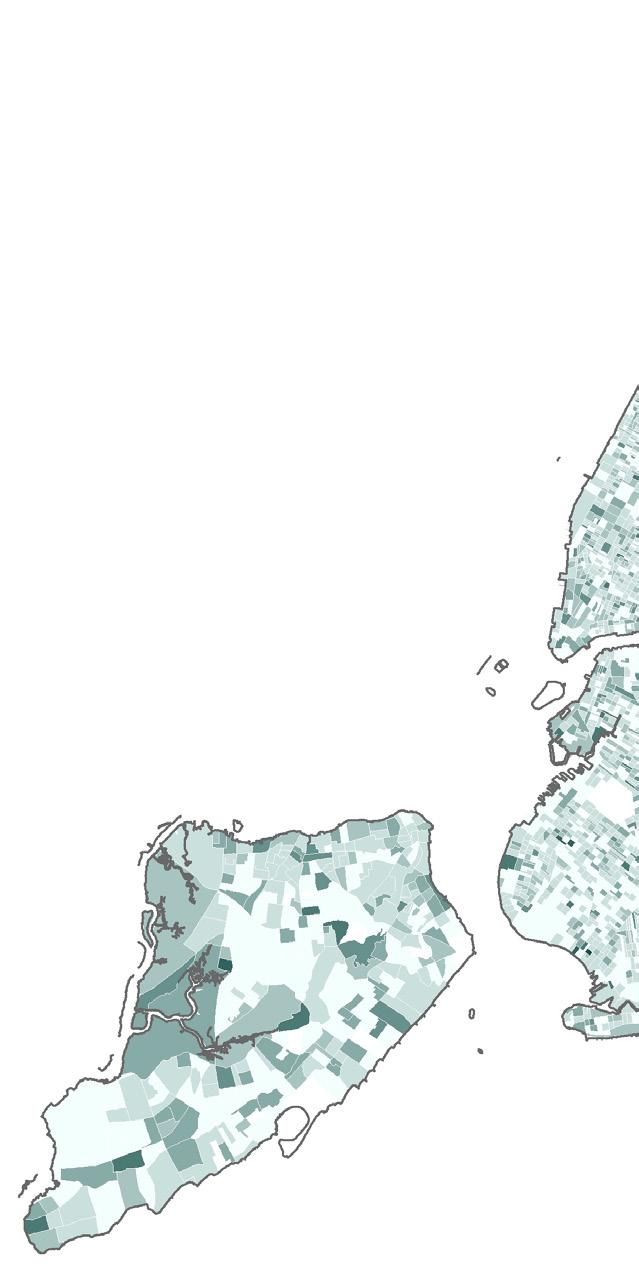
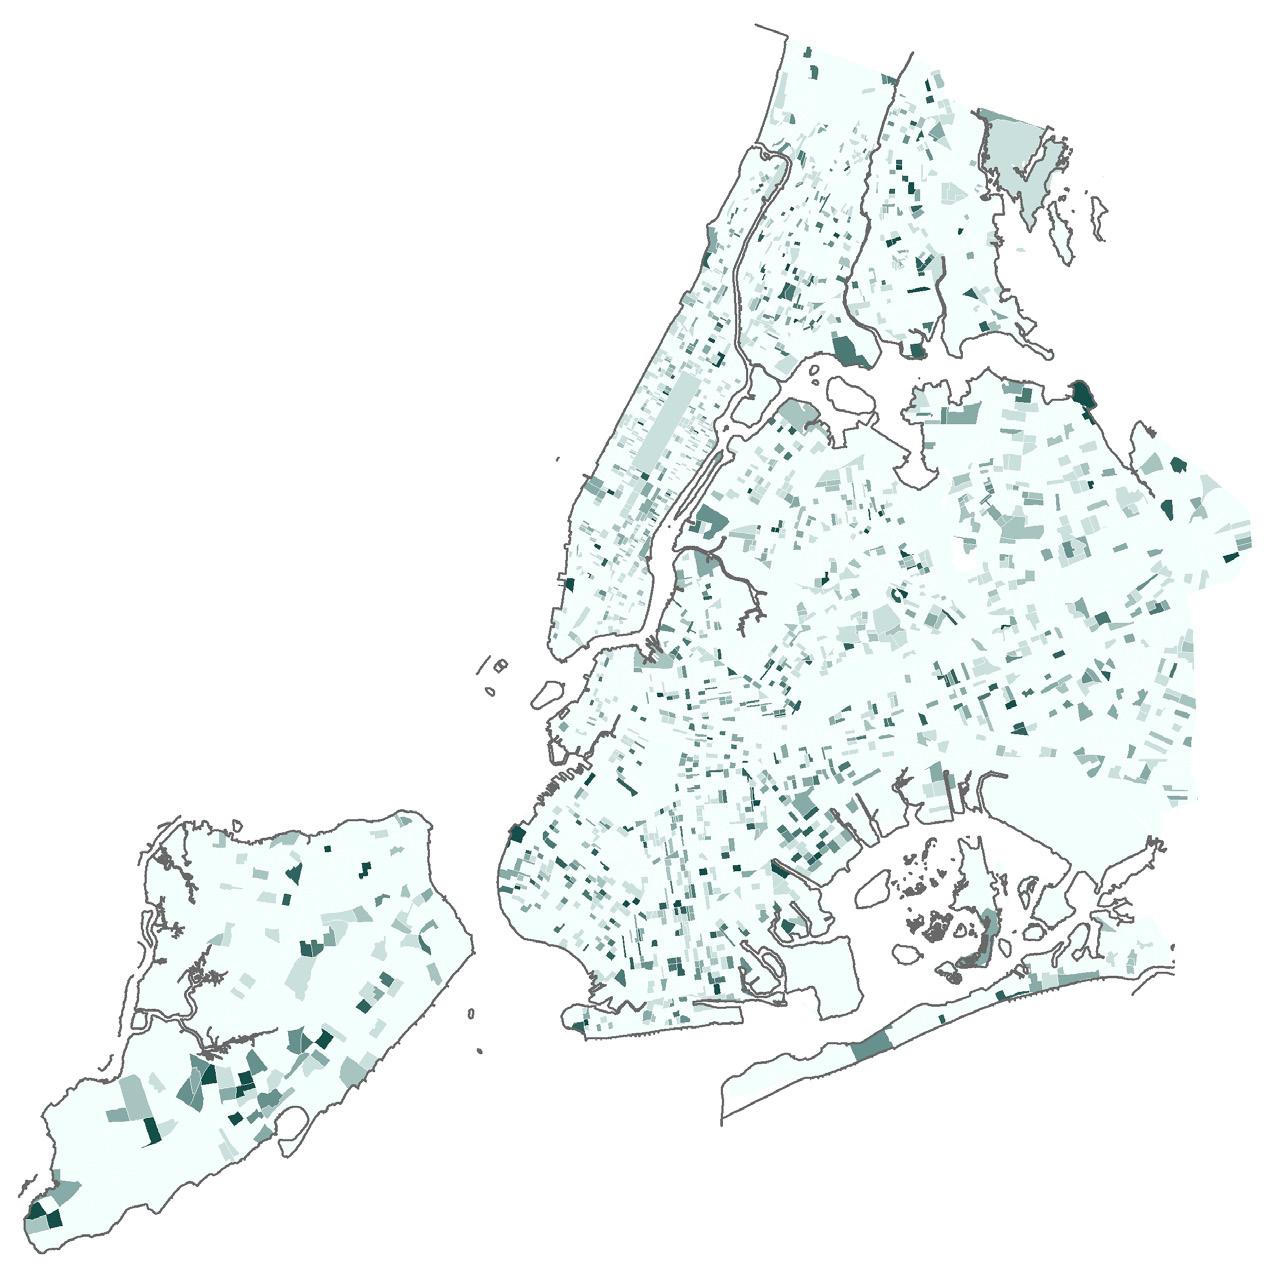
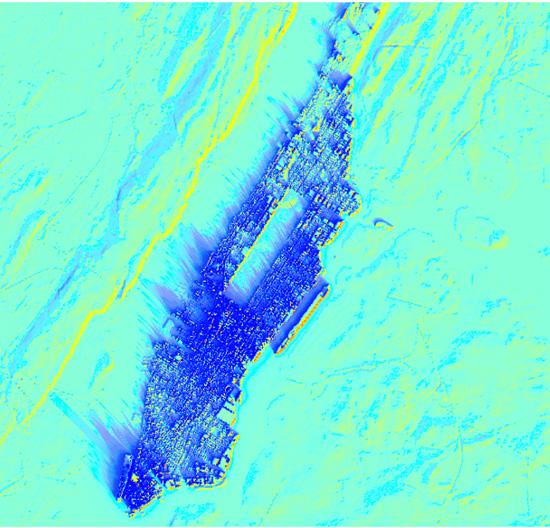
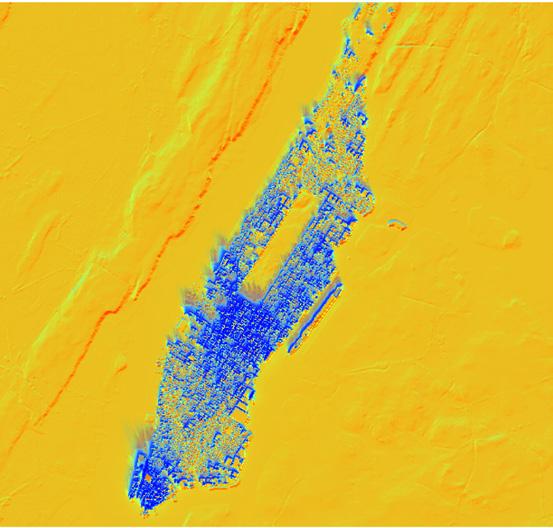
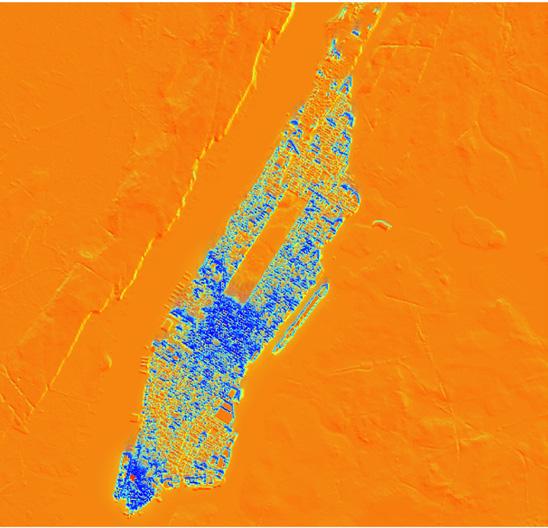
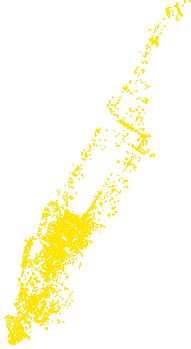
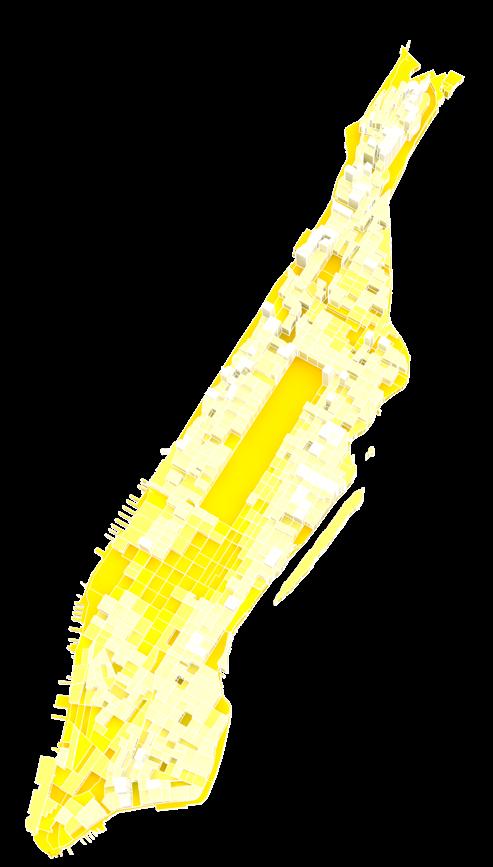
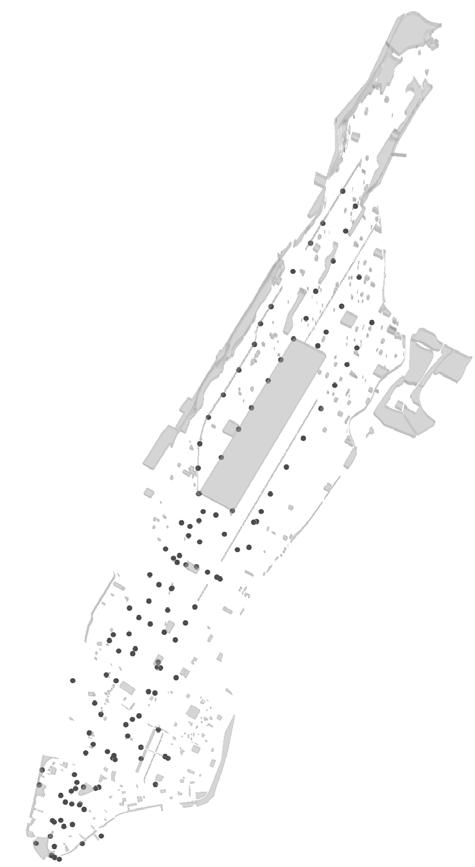
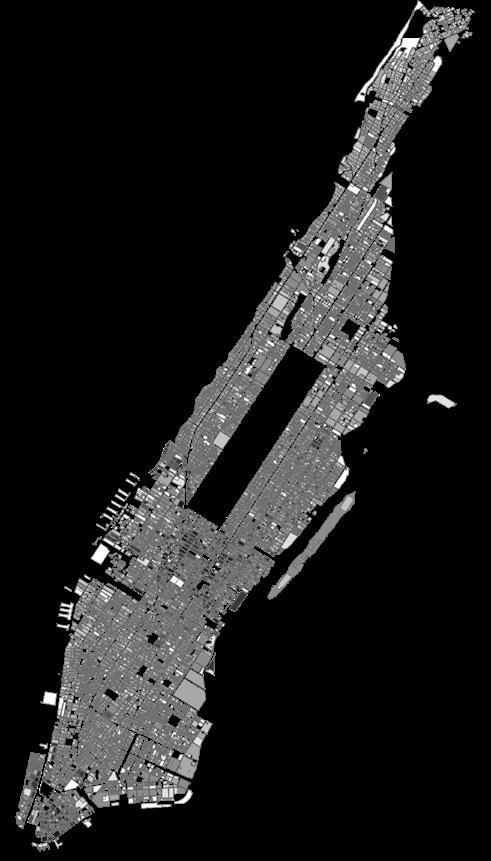
The research focused on understanding Manhattan and its complexities through the visualization off its intangible surfaces as well as their methods of interaction. The assumption made is that outdoor comfort and urban microclimate conditions relates to the vibrancy of social interactions. The two main parameters are classified as “hardscape”; the preconditioned physical form of the city, and “softscape”; the social dynamics that include physical and virtual interaction between people. The two surfaces are overlapped and generate a new representation of Manhattan. The final diagram explores through sections the potential of a correlation between the two conditions of the city. In order to account for scale variations within the city one section is taken from Lower Manhattan and one from Midtown. Although in certain points there seems to be a strong correlation this cannot be generalized and lead to particular conclusions about the affects of urban microclimate and outdoor comfort on social vibrancy.
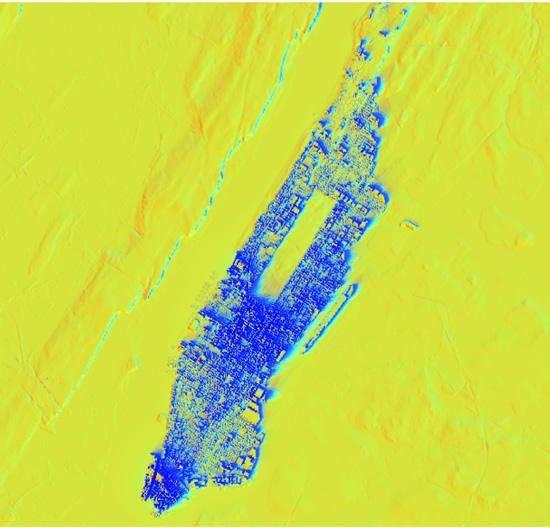
Building Heights[3]
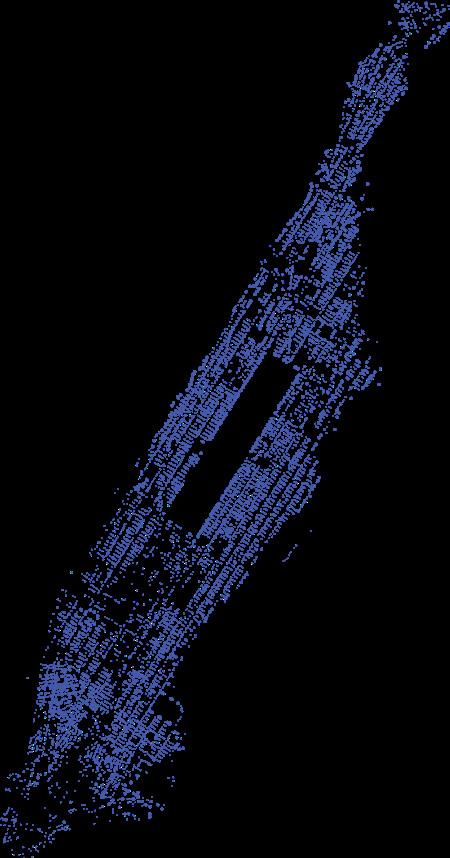
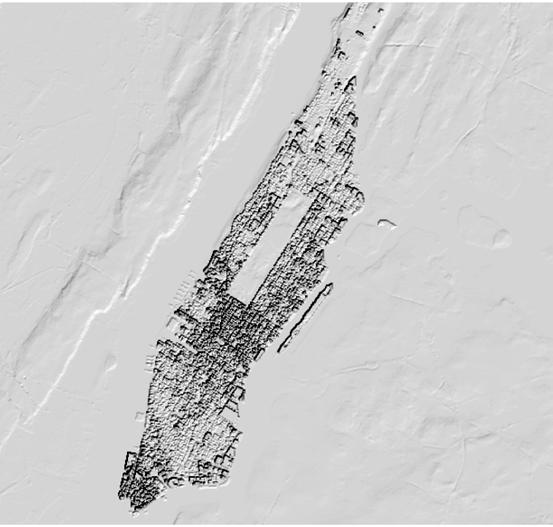
Building Age & Energy Use[4] Population Density[5]
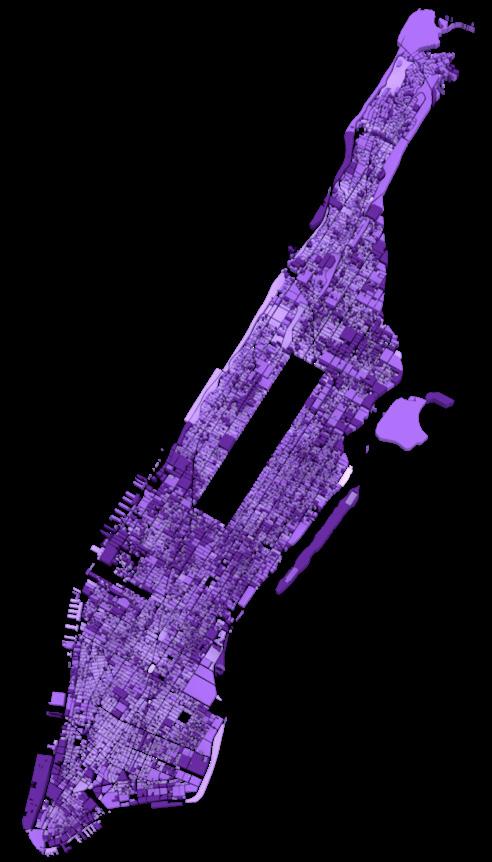
1765-1880 80 kBTU/sqf/yr 74 kBTU/sqf/yr 71 kBTU/sqf/yr 76 kBTU/sqf/yr 1881-1921 1922-1961 1962-2013low
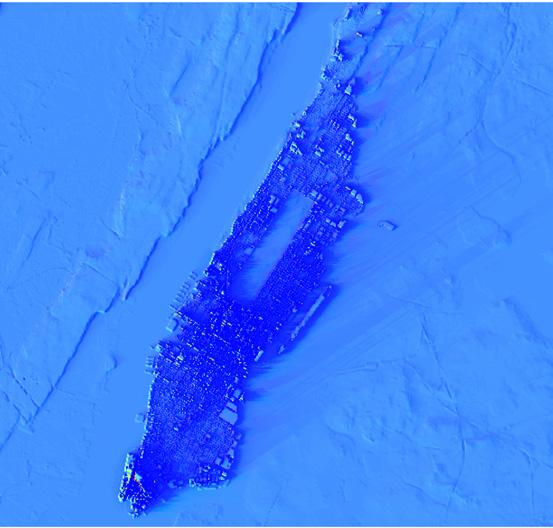
Vegetation Desnity[6] Commercial Desnity[7]
lowmedium medium medium medium
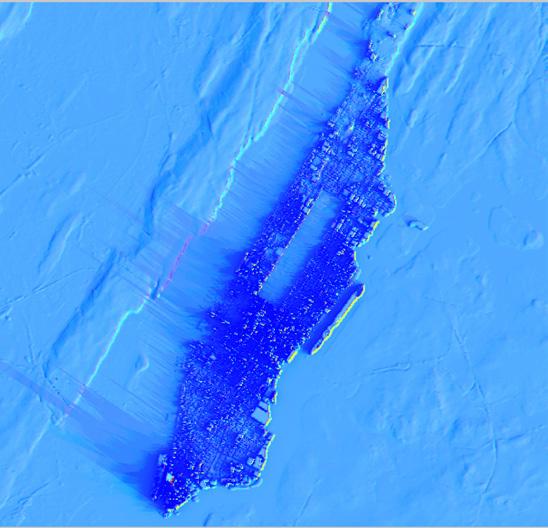
public spaces transportationlow low
high high high high
Additional Factors atrributes that were considered in the analysis