Developing a Youth Labour Market Index for South Africa at the sub-national level

Page 1

Developing a Youth Labour Market Index for South Africa at the sub-national level

Authors Gibson Mudiriza Joanna Grotte Ariane De Lannoy Anda David Murray Leibbrandt Coordination Anda David (AFD) SEPTEMBER 2023 No. 296
Research papers

Agence française de développement

Papiers de recherche

Les Papiers de Recherche de l’AFD ont pour but de diffuser rapidement les résultats de travaux en cours. Ils s’adressent principalement aux chercheurs, aux étudiants et au monde académique. Ils couvrent l’ensemble des sujets de travail de l’AFD : analyse économique, théorie économique, analyse des politiques publiques, sciences de l’ingénieur, sociologie, géographie et anthropologie. Une publication dans les Papiers de Recherche de l’AFD n’en exclut aucune autre.

Les opinions exprimées dans ce papier sont celles de son (ses) auteur(s) et ne reflètent pas nécessairement celles de l’AFD. Ce document est publié sous l’entière responsabilité de son (ses) auteur(s)

AFD Research Papers

AFD Research Papers are intended to rapidly disseminate findings of ongoing work and mainly target researchers, students, and the wider academic community. They cover the full range of AFD work, including: economic analysis, economic theory, policy analysis, engineering sciences, sociology, geography, and anthropology. AFD Research Papers and other publications are not mutually exclusive.

The opinions expressed in this paper are those of the author(s) and do not necessarily reflect the position of AFD. It is therefore published under the sole responsibility of its author(s).

Developing a Youth Labour Market Index for South Africa at the sub-national level

Abstract

Gibson

Joanna Grotte

SALDRU, University of Cape Town

Ariane De Lannoy SALDRU, University of Cape Town

Anda David

Murray Leibbrandt

Assessing the labour market situation for young people is a critical area of research that has attracted the attention of scholars and policymakers globally. However, understanding the complexity of the labour market for youth, particularly in developing countries, requires a comprehensive, multidimensional approach. We address this need by developing a Youth Labour Market Index (YLMI) for South Africa, incorporating ten indicators that capture the unique youth labour market situation from various perspectives. Drawing on nationally representative data from the Quarterly Labour Force Survey for the period 2013-2023, the YLMI provides a nuanced understanding of the labour market for 15-35-year-olds, and further allows for the identification of variations in the labour market’s functionality for various subgroups of the youth population. The study reveals alarmingly low YLMI scores for South Africa and its nine provinces, which have decreased over time. Significant gender and rural-urban disparities in the distribution of the YLMI scores are observed, and the YLMI scores exhibit an unequal spatial distribution, with lower values concentrated in provinces in former homeland areas. Further analysis reveals that the working conditions and education dimensions are the primary contributors to the low YLMI score, highlighting their role as major drivers of the underperforming youth labour market.

Specifically, relative unemployment, skills mismatch, vulnerable employment, and lack of secondary education are the key indicators contributing to the low YLMI scores, with vulnerable employment being particularly critical. These results highlight that the South African labour market for youth is highly dysfunctional and has worsened over time A defunct labour market entrenches inequality by contributing to further unemployment, pointing to an urgent need for policymakers to address the deteriorating situation. The YLMI provides a valuable tool for informing and targeting the necessary policies and interventions to promote a well-functioning labour market for youth.

Keywords

Youth, labor market, unemployment, inequality, South Africa

Classification JEL

J13, J21

Original version

English

Keywords

July 2023

Acknowledgments

This paper benefited from funding from the EU-AFD Research Facility on Inequalities.

3
Mudiriza University of the Free State Agence Française de Développement SALDRU, University of Cape Town

Résumé

L'évaluation de la situation des jeunes sur le marché du travail est un domaine de recherche essentiel qui a attiré l'attention des chercheurs et des décideurs politiques du monde entier. Cependant, la compréhension de la complexité du marché du travail pour les jeunes, en particulier dans les pays en développement, nécessite une approche globale et multidimensionnelle. Nous répondons à ce besoin en développant un indice du marché du travail des jeunes (Youth Labour Market Index - YLMI) pour l'Afrique du Sud, incorporant dix indicateurs qui capturent la situation unique du marché du travail des jeunes sous différentes perspectives. S'appuyant sur des données représentatives au niveau national issues de l'enquête trimestrielle sur les forces de travail pour la période 2013-2023, l'YLMI offre une compréhension nuancée du marché du travail pour les 15-35 ans, et permet en

outre d'identifier les variations dans la fonctionnalité du marché du travail pour divers sousgroupes de la population des jeunes. L'étude révèle des scores YLMI alarmants pour l'Afrique du Sud et ses neuf provinces, qui ont diminué au fil du temps. On observe d'importantes disparités entre les sexes et entre les zones rurales et urbaines dans la distribution des scores YLMI, et les scores YLMI présentent une distribution spatiale inégale, les valeurs les plus faibles étant concentrées dans les provinces situées dans les anciens bantoustans. Une analyse plus approfondie révèle que les dimensions des conditions de travail et de l'éducation sont les principaux facteurs contribuant au faible score de l'YLMI, soulignant leur rôle en tant que principaux moteurs du marché du travail des jeunes peu performant. Plus précisément, le chômage relatif, l'inadéquation des compétences, l'emploi

vulnérable et le manque d'éducation secondaire sont les principaux indicateurs contribuant aux faibles scores de l'YLMI, l'emploi vulnérable étant particulièrement critique. Ces résultats montrent que le marché du travail sud-africain pour les jeunes est très dysfonctionnel et qu'il s'est aggravé au fil du temps. Un marché du travail défectueux renforce les inégalités en contribuant à aggraver le chômage, ce qui montre qu'il est urgent que les décideurs politiques s'attaquent à la détérioration de la situation. Le YLMI constitue un outil précieux pour informer et cibler les politiques et interventions nécessaires à la promotion d'un marché du travail performant pour les jeunes.

Mots-clés

Jeunesse, marché du travail, chômage, inégalités, Afrique du Sud

4

1. Introduction

Labour markets often perpetuate existing inequalities, further marginalising individuals and groups based on factors such as gender, race, socioeconomic status, and educational background (Kabeer, 2012; Häusermann and Schwander, 2012; Rubery and Piasna, 2017; Gerber, 2022). The South African labour market is characterised by high levels of unemployment, precarious job security, and a significant wage disparity that disproportionately affects marginalized groups such as women, people of colour and young people (National Economic Development and Labour Council, 2023; Francis, Valodia and Webster, 2020; Mhlana, 2023; Jain et al., 2020; Inclusive Society Institute, 2023).

Youth, defined as 15-35 years old in the South African context, are one of the most vulnerable groups in the South African labour market, with a labour force participation rate of 48.5%. 1 This is considerably lower than the adult (3664 years) labour force participation rate of 66.7%. Although approximately 30.1% of young people are currently engaged in school or post-school education programmes and 25.8% are employed, their relatively low overall labour force partici-

1 The statistics presented in this introduction section have been derived by the authors using data from

pation indicates that many young people are not economically active. This could be dueto various reasons, including a lack of job opportunities which can lead to discouragement, and caregiving responsibilities, especially among young females. Additionally, youth unemployment rates are alarmingly high, with the official unemployment rate at 46.8% and the expanded unemployment rate at 58.3%. These rates are significantly higher than the adult unemployment rates, which stand at 24.1% and 33.3% respectively. Additionally, about 10 million youth (46.4%) are not in employment, education or training (NEET)

The majority of these NEET youth are unemployed (47.3% are searching unemployed and 22.9% are discouraged job seekers), and just under a third (29.7%) are inactive (i.e., ‘disengaged’ from the labour market).

The high levels of youth unemployment are driven by a range of factors, including low levels of education and skills, in a labour market that rewards mostly higher levels of education (Hofmeyr, Branson & Leibbrandt, 2013; van der Berg et al., 2020; Mudiriza et al., 2021). However, even with higher levels of education, entry into the labour market is

5
Statistics South Africa Quarterly Labour Force Survey (QLFS), Quarter 1 of 2022

constrained, as 31.0% of youth with some form of tertiary education are strictly unemployed, and this increases to 37.4% for expanded unemployment. This seems to suggest a shortage of jobs, and also points to a mismatch between what the education system is producing (supply) and what firms require (demand). Additional factors hindering young people’s engagement with the labour market are income poverty, transport constraints and connectivity issues – including high data costs and a lack of internet access, and the lack of access to social capital that could facilitate entry to the labour market.

The fact that many young people are longterm, searching unemployed (Mudiriza and De Lannoy, 2023), also means that youth face the significant cost of searching for a job, exacerbating existing financial inequalities (Graham et al., 2019; Inclusive Society Institute, 2023). In addition, young people who live in households where no or few members are employed are more likely to struggle to find employment, with this

social exclusion further imbedding labour market inequalities, and vice versa (Inclusive Society Institute, 2023; Mitchell and Shillington, 2002).

2 In contrast, approximately 9.3 million (50.6%) adults aged 36-64 years are employed. However, similar to young people, a considerable proportion of adults also find themselves in precarious occupations, with 22.3% in elementary roles, 15.0% in services, shop, and market positions, and 10.9% in craft and related trades. Elementary occupations include sales and services occupations, shoe cleaning and other street services occupations, domestic and related helpers, cleaners and launderers, building caretakers, window and related cleaners, messengers, porters, doorkeepers and related workers and garbage collectors and

However, the labour market vulnerabilities experienced by young people in the country extend beyond those who are unemployed. Recent data reveals that among the relatively small number of youth who do have jobs, 5.6 million or 25.8%, a significant number are disproportionately represented in precarious occupations, which are characterised by low wages, poor working conditions, and a lack of job security These include elementary workers (25.3%), service workers, shop and market sales workers (19.4%) and craft and related trades workers (10.7%). 2 Informality in the labour market is one of the main drivers of often high levels of inequality in developing countries, as workers engaged in informal work earn substantially less than formally employed workers, and they are more vulnerable as they are not protected by the relevant legal and regulatory frameworks related labourers. Service workers and shop and market sales workers includes personal and protective services workers, housekeeping and restaurant services workers, personal care and related workers, hairdressers, barbers, beauticians and related workers and protective services workers. Craft and related trades workers include extraction and building trades workers, building frame and related trades workers, building finishers and related trades workers and painters, building structure cleaners and related trades workers. The statistics are author’s own calculations using 2022 Quarterly Labor Force Survey, Quarter 1 data.

6

(ILO, 2018) The informality rate for young people in South Africa stood at 27% in 2022, which is similar to the rate among adults. 3

The high levels of youth unemployment and discouragement, alongside the disproportionate representation of young people in precarious occupations, perpetuate inequality in the labour market, and contribute to overall income inequality in the country (Wakefield, Yu, and Swanepoel, 2022; Melrose, 2012; Graham and Mlatsheni, 2015). It has been found that reducing unemployment is important for reducing inequality, to the extent that a 10percentage point reduction in unemployment lowers the Gini coefficient by 3% (Anand, Kothari, and Kumar, 2016). A similar reduction in inequality achieved through government transfers would require a 40% increase in grant payments (Anand, Kothari, and Kumar, 2016).

In recent years, the government has implemented several interventions to create jobs, reduce unemployment, and promote overall youth development in the country. The bulk of the interventions have been labour supply initiatives targeting the formal education system, post-school

training, entrepreneurship, and job placement (see National Treasury, 2011; Cassim and Oosthuizen, 2014). Implementation of labour demand initiatives remains limited largely to public employment and deployment, including the Social Employment Fund One prominent labour demand intervention that has been implemented is the employment tax incentive that came into effect in 2014, which incentivises firms to hire young people (Cassim and Oosthuizen, 2014; De Lannoy et al., 2020). Despite these efforts, labour market difficulties experienced by youth persist, suggesting that the policy interventions have not been effective in achieving their objectives.

3 When compared to other developing countries, South Africa's informality rates are notably lower. For example, several countries in Sub-Saharan Africa have informality rates of approximately 50% or even higher (e.g., Kenya at 79.1% and Rwanda at 73.4%), making South Africa stand out with a

While the National Youth Policy for 2020‐2030 (NYP 2030), developed by the government in early 2020, alongside of the Presidential Youth Employment Intervention (The Presidency of South Africa, 2022), has the potential to address youth unemployment and promote overall youth development in the country (National Youth Development Agency, 2020), effective implementation of the proposals in the NYP 2030 requires a comprehensive understanding of various aspects of young relatively low rate of just 18% (Grabrucker et al., 2018). This significant difference from its regional counterparts highlights the country's unique economic landscape.

7

people’s lives that affect their participation in the labour market. To help address this need, this paper proposes the development of a sub-national, youth-specific labour market index that comprises indicators that capture various aspects of young people’s lives which affect their participation in the labour market The Youth Labour Market Index (YLMI henceforth) developed draws on the work of Renold et al. (2014), Pusterla (2015) and Kudrzycki et al. (2020). Using publicly available Quarterly Labour Force Survey data, the YLMI is calculated at the sub-national level for the period 2013-2022 The study provides rankings for each province based on the YLMI score to show how they compare across the country. Additionally, the index is decomposed to

reveal the dimensions and indicators that have the greatest influence on the functioning of the youth labour market. Further disaggregations by geography and gender are also explored.

Overall, the study contributes to a better understanding of the challenges faced by young people in the labour market, and helps identify areas that require policy attention with the aim of reducing unemployment. The proposed Youth Labour Market Index (YLMI) has the potential to be a valuable tool in facilitating the design of effective sub-national interventions aimed at promoting the transition of young people from school to work, thus reducing inequality in the country.

8

2. Literature review

Assessment of the functioning of the local labour market is crucial for understanding economic development and requires a range of indicators capturing both the supply and demand side of the labour market to fully understand the dynamics at work. Labour supply refers to the population that provides the labour input needed in the economy. Data on labour supply includes population size, structure and characteristics such as age, gender, occupation, educational level, and geographic location. Labour supply measures also include information on employment, unemployment, and individuals who are not part of the labour force. In contrast, labour demand refers to the entities that require labour input, where data includes information on the firms that provide employment, vacancies, productivity levels, and the costs associated with hiring. While household-level surveys are the primary source of supply-side information, firm-level surveys are the primary source of demand-side information. Access to both data types is crucial to fully understanding the labour market situation. However, while household survey data is easily accessed, firm-level surveys are not easily accessible, limiting the scope of the existing literature on labour demand, and essentially leaving policy discussions to take place in an analytical vacuum. 4

A large body of international literature has documented the functioning of the labour market for the full population, as well as specifically for youth, using various labour market indicators derived from household surveys. For a detailed list of all these indicators, see Table A1 in the Appendix. The International Labour Organization (ILO) has taken the lead in developing these indicators by publishing a collection of 18 Key Indicators for the Labour Market (KILM) for the general population, including employment and indicators related to employment (status, sector, occupation and hours worked), the conditions of work (wages and working poverty), the characteristics of jobseekers, (education, and labour productivity), and lack of work (ILO, 2015). Botelho and Da Silva (2019) consequently developed a set of 18 indicators characterising the Euro area labour market conditions. While the bulk of these indicators align with the 18 KILM by the ILO, several additions were introduced.

A further group of studies developed indicators specific to young people. Using the school-towork transition survey, the ILO published a set of 13 Key Indicators for the Labour Market (KILM) that specifically focus on youth aged 15-29 years (Elder, 2009) These indicators were further categorised into supply-side and demand-side measures. However, while categorised as demand-side indicators, these measures are derived from household surveys, and as such, they do not directly measure labour demand but serve rather as proxy indicators.

4 A few exceptions focussing on labour demand indicators do exist, including Saunders (2001), Edwards and Gustafsson (2013), and Baker and Ball (2018). These studies develop indicators for the full working population, such as the job vacancy ratio, job vacancy rate, job advertisement rate, job turnover rate, job intention rate, job matching rate, output, productivity, growth, industry characteristics (size and distribution of firms), job market trends (wages and conditions), and employment (levels and change)

9

The ILO further published a set of eight youth-specific indicators covering a wide range of aspects related to employment and unemployment, as well as characteristics of the youth labour force (Puerto et al., 2011). These indicators are categorised into three groups: mapping youth in the labour market, mapping employed youth, and linking the labour market with education. While the indicators developed by Elder (2009) and Puerto et al. (2011) are specific to youth, they reflect the 18 KILM indicators published by the ILO in 2015. Most notably, Elder (2009) introduced the vulnerable employment rate, which captures the precarious working conditions experienced by young people. The OECD too developed a scoreboard of 10 labour market indicators specific to youth aged 15 to 24 years (OECD, 2010). These indicators capture various dimensions of youth employment, unemployment, and educational attainment. While some of these are similar to those of the 13 KILM produced by the ILO (Elder, 2009), new indicators include the NEET rate and job vacancy rate.

These studies offer valuable insights into the labour market conditions experienced by the general population and young people, however, their reliance on single indicators limits their ability to fully capture the complex and multifaceted nature of these conditions. To address this limitation, another set of studies emerged, which focuses on developing labour market indices that incorporate multiple indicators into a comprehensive labour market index (Renold et al., 2014; Pusterla, 2015; Kudrzycki et al., 2020; Bolli-Kemper, 2022). The indices aim to provide a more holistic understanding of the labour market conditions experienced by young people. Two key factors make an index more attractive than single indicators. Firstly, an index captures the complexity and multidimensional nature of labour market conditions experienced by young people. Secondly, an index can be decomposed into its individual components to identify the indicators with the greatest influence on the labour market conditions experienced by young people and how these change over time.

The index studies group the indicators into four main dimensions: activity state, working conditions, education, and transition. Activity state includes indicators that reflect the inactivity of youth; working conditions cover indicators on the quality of jobs; education includes indicators related to the education system and the skills level of job seekers; and transition comprises indicators capturing the ease of transition from education to work. Renold et al. (2014), Pusterla (2015) and Bolli-Kemper (2022) developed the KOF Youth Labour Market Index (KOF YLMI). This index combines a total of 12 indicators distributed across the four dimensions. 5 Similarly, Kudrzycki et al. (2020) developed the Youth Labour Index for Low-Income Countries (YLILI). This index also integrates 12 indicators, grouped into three dimensions: transition, working conditions, and education. 6 A detailed breakdown of these dimensions, along with their

5 In the study, Bolli-Kemper, 2022) renamed KOF Youth Labour Market Index (KOF YLMI) to CES Youth Labour Market Index (CES YLMI).

6 Kudrzycki et al. (2020) argue that the transition and working conditions dimensions contain indicators that best capture labour demand, while the education dimension includes indicators that best capture labour supply. However, as already explained, because the indicators in the transition and working conditions dimensions are

10

respective indicators, can be found in Table 1. Collectively, these studies make significant contributions to the field by providing comprehensive frameworks that capture the multidimensional nature of labour market conditions experienced by young people. As a result, policymakers are empowered to formulate targeted interventions aimed at improving the overall well-being and labour market prospects of young people.

Building on this literature, we develop a Youth Labour Market Index (YLMI) for South Africa at the provincial level. The YLMI can contribute to a better understanding of how the labour market functions for youth and help facilitate the design of interventions that can better support the transition of young people from school to work in South Africa.

derived from household surveys, these indicators are not direct measures of labour demand but are more accurately considered to be proxy indicators.

11

3. Dimensions and indicators of the Youth Labour Market Index for

South Africa

Based on the reviewed literature, we identify four broad dimensions relevant for a youth labour market index: 1) activity state, 2) working conditions, 3) transition, and 4) education. The activity state, working conditions, and transition dimensions comprise proxy indicators for labour demand, while the education dimension consists of labour supply indicators. For each dimension, we include indicators that best capture the most important aspects of the South African youth cohort which influence their labour market participation, as summarised in Table 2

3.1 Activity state

The activity state dimension captures the level of youth engagement, or the lack thereof, in the labour market. We utilise three key indicators: the strict unemployment rate, the expanded unemployment rate, and the NEET rate. The strict unemployment rate represents the proportion of youth within the labour force who are without work, available for work, and actively seeking employment. The expanded unemployment rate extends the strict definition and includes not only the strictly unemployed individuals, but also those who are discouraged and have stopped actively looking for work. The NEET rate captures the proportion of youth who are not engaged in any form of education, employment, or training. By examining these three indicators, we gain a more nuanced understanding of the activity state of the youth population.

12

Table 1. Dimensions and indicators of youth labour market indices

KOF Youth Labour Market Index

Dimensions

Activity State

Working Conditions

Youth Labour Market Index for Low Income Countries

Renold et al. (2014) Pusterla (2015) Kudrzycki et al. (2020)

* Unemployment rate

* Relaxed unemployment rate

* NEET rate

* Unemployment rate

* Relaxed unemployment rate

Temporary worker rate Temporary worker rate

Youth working poverty rate

Involuntary part-time workers rate Involuntary part-time workers rate

In work at risk of poverty rate In work at risk of poverty rate

* Vulnerable employment rate

* Vulnerable employment rate

Education Formal education and training rate Formal education and training rate

Transition

Source: Authors

Notes:

Youth time-related underemployment rate Atypical working hours rate Atypical working hours rate

* Skills mismatch rate

* Relative unemployment ratio

* Incidence of long-term unemployment rate

* Skills mismatch rate

* Relative unemployment ratio

* Incidence of long-term unemployment rate

* Share of youth in informal employment

* Share of youth working in elementary occupations

* Youth vulnerable employment rate

Share of youth working in skilled agriculture, fishery and forestry

* Share of youth with no secondary education

Youth illiteracy rate

Harmonised test scores

* Relative unemployment ratio

* Youth skills mismatch rate

* NEET rate

* Denotes indicators common to our index. Like the ones developed by Renold et al. (2014) and Pusterla (2015), our index consists of four primary dimensions and shares seven of the 12 indicators. Similarly, Kudrzycki et al. (2020) employed three dimensions, and our index again includes seven of the 12 indicators.

13

3.2 Working conditions

Working conditions relate to the quality and decency of employment opportunities available to young people; these conditions provide the context in which young people are employed. While having a job is important, the working conditions of that job are equally important in trying to understand how well a labour market functions for youth 7 Existing evidence shows that many young people are engaged in precarious work, which is mainly part-time, temporary, casual, or informal (MacDonald, 2017; ILO, 2020) This type of work lacks formal work arrangements such as a written contract, job security, benefits, social protection, and decent pay. Young workers in these jobs are highly vulnerable as the jobs are unstable and expose them to various economic risks. To assess the quality of young people’s working conditions, we use three indicators: the rate of vulnerable employment, the rate of informal employment, and the share in elementary occupations Together, these indicators measure the extent to which employed young workers are vulnerable in the labour market.

3.3 Transition

The transition dimension captures the difficulty young people face in their move from school to work. In a stable and growing economy with a well-functioning labour market, the school-towork transition involves a smooth integration of young people into productive and respectable work after completing their education. However, this transition is often complex and nonlinear, as young people may study while holding jobs, return to school after work, or start in irregular employment and then transition to regular employment (UNICEF, 2019) To capture the transition process, we follow the existing literature and use two indicators: the relative unemployment rate and the long-term unemployment rate By examining these indicators, we can better understand the challenges and opportunities that young people face as they navigate the transition from school to work.

7 Workers can either be in standard employment, where a worker is employed by one employer on a full-time, permanent basis, receiving decent wages and benefits, and has access to and effective protection or in nonstandard employment also referred to as precarious work where a worker’s employment is temporary, informal, part-time or casual in nature, lacking benefits or legal protections, and usually associated with low income (International Labor Organisation, 2016).

14

Table 2. Dimensions and Indicators for the Youth Labor Market Index (YLMI) for South Africa

State Unemployment rate – the number of unemployed youths (without work but currently available and seeking work) to the youth labour force. The higher the rate, the lower the YLMI, indicating a poor functioning labour market.

Activity

Working Conditions

Expanded unemployment rate – the number of unemployed youths plus the number of discouraged youths to the youth labour force. The higher the rate, the lower the YLMI, indicating a poor functioning labour market.

NEET rate – the share of young people not in employment, education or training (NEET) in the total youth population. The higher the rate, the lower the YLMI, indicating a poor functioning labour market.

Youth

Self employed youth + Youth assisting household business Total youth employment ∗ 100

Elementary occupation rate – the share of young workers in elementary occupations 8 in total youth employment. The higher the rate, the lower the YLMI, indicating a poor functioning labour market.

Transition Relative unemployment ratio – youth unemployment rate (aged 15 to 35 years) to adult unemployment rate (aged 36+ years). 9 The higher the rate, the lower the YLMI, indicating a labour market that functions more poorly for youth.

Long-term unemployment rate – share of youths who have been continuously unemployed for a year or more (52 weeks or longer) as a proportion of the total youth labour force (employed plus unemployed youths). The higher the rate, the lower the YLMI, indicating a poor functioning labour market.

Youth workers in elementary occupation

Total youth employment ∗ 100

Youth unemployment rate

Adult unemployment rate ∗ 100

Youth unemployment longer than one year

Total youth unemployed ∗ 100

1 2 ���Employed youth with educ ���� Total youth employed Unemployed youth with educ ���� Total youth unemployed �� 3 ����=1

Youth

No secondary education rate – the number of youths with no secondary education in youth population The higher the rate, the lower the YLMI, indicating poor-functioning labour market.

with no secondary education Youth population *100

8 Elementary occupations includes sales and services occupations, shoe cleaning and other street services occupations, domestic and related helpers, cleaners and launderers, building caretakers, window and related cleaners, messengers, porters, doorkeepers and related workers and garbage collectors and related labourers.

9 The ratio of adult to youth unemployment is standardised using the Min-Max normalisation method.

(See Section 4.2 for more information).

15
Formula
Dimension Indicator
Unemployed youth Youth labour force(Employed + Unemployed) ∗ 100
Unemployed youth + Discouraged youth Youth labour force(Employed + unemployed + discouraged) ∗ 100
NEET Youth Youth population ∗ 100
Informal sector worker rate – the share of informal sector young workers in total youth employment. The higher the rate, the lower the YLMI, indicating a poor functioning labour market. workers in informal employment Total youth employment ∗ 100
Vulnerable employment rate – the share of young workers who are self-employed and who help a household business without pay in total youth employment. The higher the rate, the lower the YLMI, indicating a poor functioning labour market.
Education Skills mismatch rate – the share of unemployed youth with a given education level to the share of employed youth with the same education level. The higher the rate, the lower the YLMI, indicating a poor functioning labour market.
Source: Authors Notes: NEET: not in employment education or training

3.4 Education

The education dimension describes the job seekers' education and skills and is captured using two indicators: the proportion of youth with no secondary education, and the skills mismatch rate. The proportion of young people without secondary education considers those young people who have not successfully completed matric (grade 12), as a proportion of all youth. The skills mismatch rate quantifies discrepancies between the share of unemployed youth with a given education level and the share of employed youth with the same education level. The latter serves as an indication of whether young people have acquired the necessary skills that employers demand. A high skills mismatch rate may imply that the existing education and training programs are not adequately preparing young people for the job market.

16

4. Data and Methodology

4.1 Data sources

As discussed in the literature review section, both supply-side and demand-side indicators are required for a full understanding of the labour market. South Africa has various nationally representative household-level surveys conducted by Statistics South Africa (Stats SA), which gather supply-side information These surveys include the October Household Survey (OHS), conducted annually between 1993 and 1999, and the Labour Force Survey (LFS), which replaced the OHS and was conducted bi-annually between 2000 and 2007. Data is also collected through the Quarterly Labour Force Surveys (QLFS), conducted since 2008, replacing the LFS. Other surveys conducted by Stats SA that contain supply-side information include the National Population Censuses for 1996, 2001 and 2011, the Community Surveys (CS) for 2007 and 2016, the General Household Surveys (GHS) conducted annually from 2002, and the Income and Expenditure Survey (IES) conducted every five years from 1995. The National Income Dynamics Study (NIDS) survey collects longitudinal supply-side information and has been conducted by the Southern Africa Labour and Development Research Unit (SALDRU) at the University of Cape Town every two years since 2008.

Of these potential surveys, we selected to utilise the Quarterly Labour Force Survey (QLFS) Quarter 1 data, for the period 2013 to 2023. In addition to being collected more frequently, the QLFS is considered the country's most reliable source of labour market information as it interviews the actual individuals on their labour market status, as opposed to using proxy respondents as the GHS does Apart from standard demographic information, the survey collects information on individual education, employment status, occupation, and sector of employment, critical in profiling various aspects of the South African labour market. However, a major drawback of the QLFS is that information cannot be disaggregated to smaller, subprovincial geographic levels. Analysis at the provincial level, which is a relatively higher level of aggregation, masks substantial variation in the functioning of the labour market at the small area level. Nevertheless, results at the provincial level remain significant in guiding the design of youth labour market interventions aimed at promoting youth employment. While provinces may be limited in their capacity to set policy on nationally held departmental responsibilities, there is, for instance, the possibility to think about offering additional services that could work towards change in relevant domains such as education. However, there remains a need for further research using alternative datasets such as the Census to provide a more fine-grained geographical analysis of youth labour market situations.

17

4.2 Method

A Youth Labour Market Index (YLMI) for South Africa is developed based on the labour market indicators presented in Table 2. The focus is on youth aged 15-35 years, a broader definition than the United Nations’ international definition of youth, which is 15-24 years (see United Nations, 2013). We adopt this broader definition of youth, as the broader age band is particularly relevant for the country, because many young people face complex and delayed transitions to independent adulthood (see National Youth Development Agency, 2020)

To create a composite index, the indicators are standardised before grouping them into dimensions used for the final aggregation, to ensure comparability. Of the ten indicators, nine are expressed as rates and thus can be considered standardized, as their values range between 0 and 100%. 10 The remaining indicator – relative unemployment – is a ratio of youth to adult employment, which is not standardised. We follow Kudrzycki et al. (2020) and use the MinMax normalisation method to standardise the indicator in line with many other composite indicators in the literature (e.g. the Commonwealth Youth Development Index, the Human Development Index, the Global Competitiveness Index 4.0, among others). The normalisation converts the indicator into a unit-less score ranging from 0 to 100, allowing for comparability across all indicators. To achieve this, the standardised indicator is computed as follows:

where �������������������� represents province ����’s score for indicator ���� from dimension ���� at time ���� , ranging from 0 to 100. �������������������������������� is province ����’s observed value for indicator ���� from dimension ���� at time ���� . �������������������� Is the value of indicator ���� from dimension ���� at or below which the score is 0 and �������������������� is the value of indicator ���� from dimension ���� at or above which the score is 100. Since the relative unemployment ratio is not naturally bounded, to determine the �������������������� And �������������������� values, we follow the KOF YLMI and give minimum and maximum values of 1 and 10, respectively (see Renold et al., 2014)

All ten indicators are now measured on a scale of 0 to 100 and can be combined to create a composite index However, prior to creating the index, we have to ensure that a higher score for a given indicator corresponds with a better outcome. Thus, in the case of indicators where a higher value reflects a worse outcome (all of the indicators except formal education and training rate), the scores become 100−�������������������� , so that 100 always represents the best outcome.

10 However, even for indicators that are rates, Renold et al. (2014) suggested that such indicators should also be standardised because the values of most of the indicators are dispersed only in a small part of the spectrum. Renold et al. (2014) standardised each indicator on a scale of 1 to 7 using the following formulas:

for which a higher value is associated with a higher score and ���������������� =

+7 for which a higher value is undesirable and should get a lower score.

18
�������������������� = ������������������������������������� �������������������� �������������������� �������������������� �.100
���������������� =6 ∗������������������������������������������������� �������������������� ������������ �������������������� ������������−�������������������� ������������ �
6 ∗ ������������������������������������������������� �������������������� ������������ �������������������� ������������−�������������������� ������������ �
+1

Consequently, a higher score of any given indicator reflects that the labour market situation is more favourable and more efficient in integrating young people into the labour market.

Furthermore, a weighting scheme which reflects the relative importance of each dimension and indicator in determining the overall functioning of the youth labour market is needed to combine the indicators into an index. Most empirical studies have applied equal weights, and to date, no theoretical insights exist to suggest an alternative weighting scheme (Bandura, 2008; OECD, 2008; Alkire and Santos, 2014). As such, an equal weighting scheme is applied here too, where each dimension is equally weighted, and each indicator within a dimension receives equal weight, as detailed in Table 3. Thus, we assume that each dimension of the index and each indicator within a dimension is of equal importance for the youth labour market in South Africa. 11 This assumption is tested in the robustness section in 5.2

The score for each dimension is computed as follows:

where ���������������� is the score of dimension d for province ���� at time t, ������������ corresponds to the weight attributed to indicator ���� in dimension ���� where ∑ ������������ =1, and �������� is the total number of indicators in dimension ���� with a score different from zero. The YLMI for each year is derived by computing an arithmetic mean of the four dimensions as follows:

11 While indicators are weighted equally within a dimension, they are not equally weighted across dimensions as each dimension is comprised of a different number of indicators, as detailed in Table 3

19
Domain Indicator Weight of dimension Weight of indicator Activity State 1. Unemployment rate ¼ 1/12 2. Relaxed unemployment rate 1/12 3. NEET rate 1/12 Working Conditions 4. Informal sector worker rate ¼ 1/12 5. Vulnerable employment rate 1/12 6. Elementary occupation rate 1/12 Transition 7. Relative unemployment ratio ¼ 1/8 8. Long-term unemployment rate 1/8 Education 9. Skills mismatch rate ¼ 1/8 10. No secondary education rate 1/8
Table 3. Weights of the Youth Labour Market Index (YLMI)
���������������� = ��������������������� ������������ �������� ����=1
�������� = � 1 4 ���������������� 4 ����=1
YLMI

The index ranges between 0, indicating a totally dysfunctional labour market, and 100, reflecting a fully functioning labour market. Following the Alkire-Foster methodology (Alkire and Foster, 2011), we decompose the index by dimension and indicator to determine the contribution of each to the overall index score. This decomposition is critical as it allows us to identify the dimensions and indicators that exert the most influence over the overall score. By pinpointing these influential dimensions and indicators, we gain valuable insights into the specific areas within the youth labour market that require attention and intervention. Furthermore, we disaggregate the index by geographic and demographic characteristics to further enhance our understanding of the performance of different regions and demographic groups within the labour market. The YLMI thus enables a comprehensive assessment of the functionality of the youth labour market, and it offers invaluable insights through decomposition by dimension/ indicator, location, and demographic characteristics.

20

5. Empirical results

This section presents an analysis of the trends observed in the YLMI for South Africa from 2013 to 2023, as well as an examination of the trends disaggregated by geographic location and gender. This comprehensive analysis allows us to better understand how the labour market performs for different subgroups of the youth population.

5.1 Profiling YLMI in South Africa

We start with an overview of each indicator over the period 2013-2023, as presented in the summary statistics in Table A2 in the appendix. While some indicators have changed slightly over time, there have been significant changes in crucial indicators such as the no secondary education rate, NEET rate, unemployment rate, long-term unemployment rate and informal worker rate. Firstly, notable progress has been made in improving the levels of education among young people as the rate of those without secondary education has significantly decreased over time. The percentage of young people with no secondary education decreased from 62.7% in 2013 to 52.8% in 2023. This substantial drop is encouraging, given that completing secondary education and attaining a post-secondary qualification significantly enhance employability in South Africa (van der Berg et al., 2020).

However, the changes observed in indicators such as the NEET rate, unemployment rate, longterm unemployment rate, and informal worker rate indicate a concerning trend of labour market deterioration for young people in South Africa. For instance, in 2013, the youth unemployment rate was 35.3% by the strict definition and 47.9% by the expanded definition. By 2023, these rates had increased to 45.5% and 55.1%, respectively. Similarly, adult unemployment rates increased from 14.6% (strict) and 22.6% (expanded) in 2013 to 21.9% (strict) and 30.6% (expanded) in 2023. This means that a larger share of young people was unemployed compared to adults, as the strict youth unemployment rate was 2.4 and 2.1 times higher than the adult unemployment rate in 2013 and 2023, respectively. In addition, the long-term unemployment rate also increased significantly from 64.2% to 75.4% over the same period. The NEET rate increased from 37.6% in 2013 to 43.2% in 2023, while the informal employment rate rose from 22.9% in 2013 to 25.6% in 2023.

National estimates of the Youth Labor Market Index (YLMI)

Figure 1 plots the YLMI scores over the period 2013–2023 and depicts a youth labour market that has been consistently underperforming for youth for the past decade. The figure shows that the YLMI has remained persistently low, with a score of less than 18.0, for the past ten years. In 2013, the score stood at 16.8 before increasing slightly to 17.0 in 2015 However, from there, it exhibited a steady decline, reaching 15.5 in 2022 before experiencing a modest increase to 15.7

21

in 2023. This trend highlights the challenges and shortcomings within the youth labour market over the examined timeframe 12 Overall, these findings point to a dysfunctional labour market situation for youth in South Africa, that has deteriorated over time.

Source: Own calculations using QLFS, Q1, 2013-2023 data.

Notes: Point estimates are weighted using person weights.

To better understand the complex and multifaceted nature of the labour market and how it functions for young people, we examine the contribution of each dimension to the overall Youth Labor Market Index (YLMI) score. Figure 2 presents the percentage contribution of each dimension to the overall index score over time, shedding light on the relative importance of each dimension. Despite assigning equal weights to the four dimensions of the index, the figure shows that the contribution of each dimension to the overall score is not equal. Specifically, working conditions and education emerge as the main contributors to the overall index score, accounting for over 30% and more than 25% of the total score, respectively, over the period. These scores exceed their assigned weights of 25%, indicating that poor working conditions and low education outcomes are the major drivers of the poorly functioning youth labour market.

12 These scores are significantly low compared to the cross-country scores obtained by Kudrzycki et al. (2020) for a group of lower-middle and low-income countries, where 36.4 for Niger was the lowest score, and 86 for Ukraine was the highest score. However, we would caution against direct comparisons as our index incorporates slightly different dimensions and indicators.

22
Figure 1. The YLMI for South Africa by year
16,8 16,9 17,0 16,8 16,8 16,6 16,4 16,1 15,8 15,5 15,7 14,5 15,0 15,5 16,0 16,5 17,0 17,5 2013 2014 2015 2016 2017 2018 2019 2020 2021 2022 2023
Years
Youth Labour Market score

On the other hand, the contributions of the remaining two dimensions, namely activity state and transition, exhibit minor variations over time, with their contributions consistently below their assigned weights of 25%. Thus, the impact of activity state and transition is less pronounced than that of working conditions and education. This finding is important, as it points at dysfunction on both the supply and demand sides of the labour market.

Source: Own calculations using QLFS, Q1, 2013-2023 data.

Notes: Point estimates are weighted using person weights.

Figure 3 provides valuable insights by illustrating the percentage contribution of each indicator to the overall YLMI score over time, shedding light on their relative significance in shaping the youth labour market situation. It is important to note that, in a given year, the contribution of the indicators vary considerably, with some indicators accounting for as little as 4.5% and others as high as 18.0%. However, the contribution of each indicator remains relatively stable over time, with the greatest variation observed for long-term unemployment, which fluctuates by 2.5 percentage points.

23
Figure 2. Contribution of each dimension to overall YLMI
22,2 22,4 22,1 22,0 21,9 22,2 21,9 21,3 20,6 20,1 20,7 29,8 30,0 29,6 29,7 29,9 30,1 30,2 30,7 31,7 31,4 31,4 22,3 22,2 23,0 22,9 23,1 22,5 22,6 22,6 22,1 22,5 22,4 25,6 25,4 25,3 25,4 25,1 25,1 25,3 25,4 25,6 26,0 25,5 0% 10% 20% 30% 40% 50% 60% 70% 80% 90% 100% 2013 2014 2015 2016 2017 2018 2019 2020 2021 2022 2023 Activity State Working Conditions Transition Education

Acknowledging the differences in the indicator weights, it is worth noting that relative unemployment, skills mismatch, vulnerable employment, and no secondary education emerge as the biggest contributors to the overall index score. 13 The contributions of these indicators exceed their assigned weights, highlighting their significant impact on the dysfunctionality of the youth labour market in South Africa. Notably, vulnerable employment proves particularly critical as it contributes significantly to the overall index score despite having a relatively low weight.

Source: Own calculations using QLFS, Q1, 2013-2023 data

Notes: Point estimates are weighted using person weights.

In summary, the findings indicate that improving working conditions and education will have the greatest impact on promoting a well-functioning labour market for youth in South Africa

Disaggregation of the YLMI

A unique feature of the YLMI is that it can be disaggregated by various subgroups to enhance our understanding of the performance of these different groups within the labour market. In this section, we will disaggregate the index by gender and geographic location. 14

13 The YLMI has some dimensions with three indicators and others with two, meaning that direct comparisons of the indicator contributions may be misleading due to differences in the weighting. See Table 2 for the weighting scheme.

14 It is possible to further disaggregate the YLMI into smaller subgroups for more detailed comparisons, such as males and females, 15-24, in rural areas. However, each subgroup would require a recalculation of the YLMI based on the various indicator scores within that specific group. We leave this exercise to future studies which can gain deeper insights into specific subgroups of interest.

24
Figure 3. Contribution of each indicator to overall YLMI
7,7 7,8 7,8 7,8 7,7 7,8 7,7 7,7 7,6 7,4 7,5 8,0 8,0 7,8 7,8 7,7 7,9 7,8 7,5 7,2 7,1 7,2 6,5 6,6 6,5 6,5 6,5 6,5 6,3 6,1 5,8 5,6 6,0 11,4 11,5 11,4 11,4 11,4 11,6 11,6 11,8 12,0 12,0 12,0 9,6 9,5 9,5 9,4 9,5 9,5 9,6 9,7 10,0 9,8 9,9 8,9 9,0 8,7 8,9 8,9 9,0 9,1 9,3 9,7 9,6 9,5 6,7 6,4 7,0 6,8 6,8 6,1 6,0 5,7 4,6 4,5 4,9 15,7 15,8 16,0 16,1 16,3 16,5 16,6 16,8 17,5 18,0 17,5 14,0 13,9 13,8 13,9 14,0 14,2 14,4 14,6 14,9 15,1 15,0 11,7 11,5 11,4 11,4 11,1 10,9 11,0 10,8 10,7 10,8 10,5 0% 10% 20% 30% 40% 50% 60% 70% 80% 90% 100% 2013 2014 2015 2016 2017 2018 2019 2020 2021 2022 2023 NEET Off Unemployment Exp Unemployment Vulnerable Employment Informal Employment Elementary Occupation Long Term Unemployment Relative Unemployment Skills Mismatch No Secondary Education

Disaggregation of the YLMI by gender

Figure 4 provides a gender disaggregation of the index, revealing a significant gender gap in the functioning of the youth labour market. In 2013, the index score for young females was 16.2, 7.4% lower than for young males, which stood at 17.4. Similarly, in 2023, the index score for young females was 15.4, indicating a 3.9% difference compared to the score for young males, which stood at 16.0. 15 These findings align with existing studies that consistently highlight substantial gender disparities within the labour market, wherein females face greater challenges than their male counterparts (Mosomi, 2019; Schwidrowski et al., 2021). Despite a narrowing of the gender gap over time, the index score for female youth is consistently below the national average, while the score for male youth is above it. Furthermore, both young females and males experienced a steady decline in their index scores over time in line with the national decline

Notes: Point estimates are weighted using person weights.

15 A 95% confidence interval analysis shows that the observed gender gap is statistically significant throughout the entire period.

25
Figure 4. The YLMI by gender and year
16,8 16,9 17,0 16,8 16,8 16,6 16,4 16,1 15,8 15,5 15,7 16,2 16,4 16,5 16,3 16,3 16,0 15,9 15,7 15,4 15,2 15,4 17,4 17,3 17,4 17,3 17,2 17,1 16,8 16,6 16,1 15,8 16,0 14,0 14,5 15,0 15,5 16,0 16,5 17,0 17,5 18,0 2013 2014 2015 2016 2017 2018 2019 2020 2021 2022 2023 YLMI SCORE YEAR National Female
Male

Overall, these results highlight the disadvantaged position that young females continue to face in the labour market. The potential reasons for this are numerous, ranging from social and cultural factors to structural barriers and discrimination. While the YLMI does not include social or cultural factors as measures of labour market functionality, we can explore what indicators do drive the gender disparity.

A decomposition of the index by dimension shows that working conditions and education contribute the largest to the overall index score for both male and female youths, accounting for at least 30% and 25% of the total score respectively over the period (see Table A3 in the appendix). A further decomposition by indicator shows that relative unemployment, skills mismatch, vulnerable employment and no secondary education contribute the largest share to the overall index score for male and female youths, accounting for at least 10% of the total score over the period (see Table A4 in the appendix). These findings align with the national trends discussed earlier.

Disaggregation of YLMI by geographic location

We disaggregate the index by geographic location next, specifically the rural-urban division and by province. The analysis in Figure 5, which disaggregates the index by the rural-urban division, highlights a significant labour market penalty for rural youth. 16 For instance, in 2013, rural youth had an index score of 16.1, 5.6% lower than their urban counterparts, who scored 17.0. Similarly, in 2023, the index score for rural youth decreased to 15.1, indicating a 5.3% disparity compared to urban youth, whose score stood at 15.9. These findings are consistent with existing evidence highlighting significant labour market inequalities between rural and urban areas, where urban regions consistently exhibit better outcomes (Ntuli and Kwenda, 2014; Rathi and Vermaak, 2018; Visagie and Turok, 2021). Despite the declining scores for both rural and urban youth over time, the persistent rural labour market penalty highlights the ongoing disadvantage rural youth face.

A closer examination of the index decomposition by dimension reveals the key drivers behind the poorly functioning labour market for urban and rural youth. In the case of urban youth, the major contributing dimension is poor working conditions, which accounts for over 30% of the total index score (see Table A5 in the appendix). Conversely, the main contributing dimension for rural youth is poor education, which accounts for over 28% of the total score Further decomposition of the index by indicator reveals that the poorly functioning labour market for both urban and rural youth is driven primarily by relative unemployment, skills mismatch, vulnerable employment and no secondary education (see Table A6 in the appendix).

16 A 95% confidence interval analysis shows that the observed urban/rural differences are statistically significant throughout the entire period.

26

Figure 5 The YLMI by location and year

Source: Own calculations using 2013-2023 QLFS quarter one data.

Notes: Point estimates are weighted using person weights.

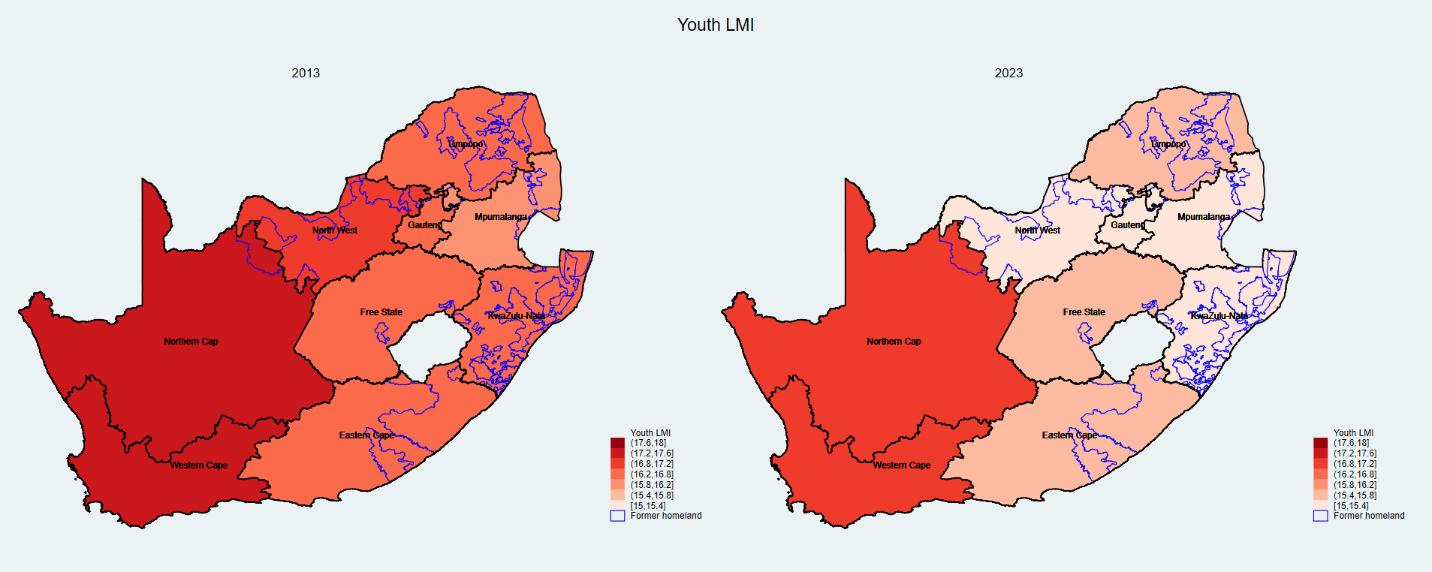
Figure 6 shows the spatial distribution of the index score across provinces in 2013 and 2023. The darker red colour indicates higher scores, implying better functioning labour markets. The maps clearly show that the national average scores, which are already low, mask substantial disparities across provinces. The Western Cape consistently reports the highest index scores in both 2013 and 2023, indicating better labour market outcomes, while Mpumalanga in 2013 and North West in 2023 exhibited the lowest scores. Notably, the index scores are relatively lower in provinces in former homeland areas. The observed variation in the scores across provinces highlights the importance of disaggregating the index by location and the need for targeted, place-based policies rather than adopting place-neutral policies.

27
16,8 16,9 17,0 16,8 16,8 16,6 16,4 16,1 15,8 15,5 15,7 16,1 16,2 16,4 16,5 16,2 16,0 15,8 15,5 15,3 15,2 15,1 17,0 17,0 17,1 16,9 16,9 16,7 16,5 16,3 15,9 15,6 15,9 14,0 14,5 15,0 15,5 16,0 16,5 17,0 17,5 2013 2014 2015 2016 2017 2018 2019 2020 2021 2022 2023 National Rural Urban

Source: Own calculations using 2013 - 2023 QLFS quarter one data.

Notes: Point estimates are weighted using person weights.

Figure 7 shows a complete picture of the evolution of the index across provinces and over time. 17 The index scores for most provinces gradually decreased over time, indicating deteriorating labour market situations for young people. However, the index scores improved slightly for most provinces in 2023. While the Western Cape has the highest scores and is ranked first for all the years, the scores and ranks for the other provinces changed over time. Whereas Mpumalanga was the lowest-ranked province in 2013, North West was the lowest ranked in 2023. The observed changes in the provincial ranks almost every year points to volatile local labour markets. Despite some provinces performing relatively better than others, all provinces can be classified as having dysfunctional youth labour markets due to their low scores of less than 18.

17 A table of the provincial scores can be found in Table A7 in the Appendix.

28
Figure 6. Spatial distribution of YLMI by province in 2013 and 2023

Source: Own calculations using 2013 and 2023 QLFS quarter one data.

Notes: Point estimates are weighted using person weights.

Additionally, Figure 8 examines each dimension's contribution to each province's overall index score. In most provinces, working conditions and education are the two major contributors to the overall index score in both 2013 and 2023. However, working conditions and activity state are the two biggest contributors for the Western Cape. Notably, the contribution of working conditions and education exceeds their assigned weight of 25% for most provinces, underscoring their importance in influencing the functioning of the labour market for youth.

29
Figure 7 The YLMI by province and year
14,5 15,0 15,5 16,0 16,5 17,0 17,5 18,0 2013 2014 2015 2016 2017 2018 2019 2020 2021 2022 2023 YLMI Year
National Eastern Cape Free State Gauteng KwaZulu-Natal Limpopo Mpumalanga North West Northern Cape Western Cape

Source: Own calculations using 2013 and 2023 QLFS quarter one data.

Notes: Point estimates are weighted using person weights.

Figure 9 further disaggregates each province's index by indicator. The results demonstrate that while relative unemployment and skills mismatch are the primary contributors to the overall index score across all provinces, vulnerable employment, informal employment, and lack of secondary education also exert substantial influence over the overall index score across different provinces.

30
Figure 8 Contribution of each dimension to the YLMI by province in 2013 and 2023
20,8 21,6 23,2 22,8 21,9 21,3 21,2 20,0 23,9 19,7 21,0 21,7 20,2 19,8 19,2 20,9 17,5 24,0 28,0 29,4 31,5 29,9 26,1 28,9 30,0 29,9 30,6 29,2 30,7 33,2 32,0 29,2 30,1 30,2 31,4 30,8 22,7 22,6 21,9 21,6 24,3 22,1 23,1 24,2 21,8 22,8 22,1 21,5 21,8 23,9 24,2 23,9 23,8 22,0 28,4 26,4 23,4 25,7 27,7 27,7 25,6 25,8 23,7 28,3 26,2 23,6 26,0 27,0 26,4 25,0 27,4 23,2 0% 10% 20% 30% 40% 50% 60% 70% 80% 90% 100% Eastern Cape Free State Gauteng KwaZulu-Natal Limpopo Mpumalanga Northern Cape North West Western Cape Eastern Cape Free State Gauteng KwaZulu-Natal Limpopo Mpumalanga Northern Cape North West Western Cape 2013 2023 Activity state Transition Working conditions Education

Notes: Point estimates are weighted using person weights.

5.2 Robustness checks

Acknowledging that the equal weighting scheme is subjective, it is important to conduct robustness checks using alternative weighting schemes to determine if the chosen weighting scheme significantly affects the results Therefore, following Alkire and Santos (2014) and Frame et al. (2016), the YLMI is re-estimated using three alternative weighting structures, as outlined in Table A8 in the appendix. 18 The alternative weighting structures give 40% of the relative weight to one dimension and 20% to each of the remaining three. Rankings between provinces are derived for each estimation, including the original estimation with equal weighting. Finally, the rank correlation coefficients of the estimates are calculated to evaluate the level of association between alternative weighting structures. Higher coefficients indicate stronger associations between the alternative weighting structures.

18 Of these studies, Frame et al. (2016) applied these three alternative weighting schemes for their robustness test in their calculation of the youth multidimensional poverty index for South Africa.

31
Figure 9. Contribution of each indicator to overall Youth LMI by province and year Source: Own calculations using 2013-2023 QLFS quarter one data.
7,5 7,8 8,1 7,8 7,6 7,7 7,4 6,8 8,0 7,3 7,7 8,1 7,1 7,4 7,3 6,9 6,6 8,1 7,7 7,4 7,9 8,7 8,8 7,7 7,3 7,7 8,1 6,5 6,9 7,1 7,6 7,2 6,7 8,1 6,4 8,2 5,6 6,4 7,1 6,3 5,5 5,9 6,5 5,5 7,7 5,9 6,3 6,5 5,4 5,2 5,2 5,9 4,4 7,6 11,5 11,8 11,2 11,6 10,6 11,6 11,8 11,3 11,6 11,7 11,7 12,1 12,3 11,7 12,1 12,0 12,7 11,7 8,5 9,7 10,1 9,5 7,5 8,9 10,5 9,8 10,4 8,7 9,7 10,3 10,1 8,5 8,8 10,7 9,6 10,5 8,1 7,9 10,1 8,7 7,9 8,5 7,7 8,9 8,6 8,7 9,3 10,8 9,7 9,0 9,2 7,5 9,1 8,6 6,1 6,1 6,2 7,3 9,2 6,0 7,7 8,6 6,3 4,6 4,6 3,4 4,9 6,3 5,9 7,1 5,8 6,9 16,6 16,4 15,8 14,3 15,1 16,1 15,4 15,6 15,5 18,2 17,6 18,1 16,9 17,7 18,3 16,9 18,0 15,1 14,2 14,4 14,0 14,0 14,0 14,6 13,6 13,7 13,4 14,9 15,2 15,3 15,3 15,2 15,3 13,8 15,6 13,8 14,2 12,1 9,4 11,7 13,8 13,1 12,0 12,1 10,3 13,4 11,1 8,3 10,7 11,8 11,1 11,2 11,9 9,4 0% 10% 20% 30% 40% 50% 60% 70% 80% 90% 100% Eastern Cape Free State Gauteng KwaZulu-Natal Limpopo Mpumalanga Northern Cape North West Western Cape Eastern Cape Free State Gauteng KwaZulu-Natal Limpopo Mpumalanga Northern Cape North West Western Cape 2013 2023 NEET Off Unemployment Exp unemployment Vulnerable employment Informal employment Elementary occupation Long term unemployment Relative unemployment Skills mismatch No sec education

Table A9 in the appendix shows Spearman’s correlation coefficients between the provincial rankings derived from the YLMI with equal weights and those derived from the three alternative weighting schemes. The correlation between the equal weighting structure estimation and the three alternative structures is at least 0.8667, with Spearman’s coefficients ranging between 0.8061 (weights 2 and 3) and 0.9879 (Weights 1 and 2) for the alternative weighting schemes. These coefficients indicate that all the alternative weighting schemes are correlated. 19

These results demonstrate that while changes in the weights could affect the size of the YLMI score for each province, they would not significantly affect the relative positions of each province. The Western Cape remains the highest-ranked province, while Mpumalanga remains the lowest-ranked province. Thus, the rankings of the YLMI between provinces are robust when using alternative weighting schemes.

19 While the Spearman’s correlation coefficients of the alternative weighting schemes for 2014-2022 are not reported here, the coefficients of the different years also revealed high correlation of the alternative weighting schemes.

32

6. Conclusion

Young people in South Africa are one of the most vulnerable groups in the labour market. A large proportion of young people have limited or no job experience, low levels of education, and inadequate skills, which greatly restricts their employability. Even among those who manage to secure employment, many find themselves in precarious and informal jobs characterised by low wages and unstable working conditions, perpetuating a cycle of poverty and limiting upward mobility, and ultimately further entrenching inequality. The labour market challenges faced by young people in South Africa are further exacerbated by insufficient financial support, inadequate social safety nets, and intensified competition for scarce employment opportunities. To effectively tackle these multifaceted challenges, a comprehensive approach is required.

There is, however, limited analysis of the multidimensional aspects inherent in the youth labour market. To bridge this knowledge gap, this study develops a Youth Labor Market Index (YLMI) to profile the labour market situation for young people aged 15-35 in South Africa. The index encompasses ten indicators grouped into four dimensions that capture the unique and multifaceted labour market situations experienced by young people. Drawing on nationally representative data from the Quarterly Labour Force Survey for the period 2013-2023, the YLMI provides a nuanced understanding of the functioning of the youth labour market in South Africa.

The findings of this study reveal alarmingly low and decreasing YLMI scores over time, highlighting a highly dysfunctional and deteriorating labour market situation for young people. The index score began at 16.8% in 2013, experienced a slight increase to 17.0% in 2017, but gradually decreased to 15.5% in 2022. Although there was a slight increase to 15.7% in 2023, this increase was not statistically significant at the 95% confidence interval. Further analysis of the YLMI decomposition by dimension reveals that working conditions and education are the two largest contributors to the YLMI, highlighting that these factors are the major drivers of the poorly functioning youth labour market in South Africa. Further index decomposition by indicator demonstrats that relative unemployment, skills mismatch, vulnerable employment, and lack of secondary education are key factors contributing to the poorly functioning youth labour market in South Africa, with vulnerable employment being particularly critical.

The disaggregated results show significant disparities among various sub-groups of young people, highlighting notable variations in the functioning of the labour market for these subgroups. The analysis reveals significant gender gaps, with the index score for young females substantially lower than that of young males throughout the period. The results highlight the disadvantaged position that young females continue to face in the labour market. The findings also reveal a significant labour market penalty for living in rural areas, with rural youth experiencing considerably lower index scores than their urban counterparts. Moreover, the results show a highly unequal spatial distribution of the index scores across provinces, with lower scores registered in provinces in former homeland areas. Similar to the national trend, all

33

sub-groups of young people experience a worsening labour market situation as their index scores steadily decrease over time (the slight increase in 2023 is not statistically significant). Furthermore, the index decomposition by dimension and indicator highlight that different factors drive the poorly functioning labour market situation among the various sub-groups.

The findings of this study carry significant policy implications and highlight the urgent need for policymakers to address the highly dysfunctional and worsening labour market situation for young people in South Africa. The results indicate the need to implement a combination of policies aimed at improving education, working conditions, and addressing specific challenges faced by different sub-groups of youth to promote a better-functioning labour market. Expanding educational opportunities and enhancing educational outcomes, together with equipping young individuals with skills that align with job market demands, is crucial Addressing concerns such as job security, fair wages, and adequate workplace safeguards can further enhance the labour market environment for young people. Policymakers should prioritise addressing specific challenges young people face, including high unemployment, skills mismatch, vulnerable employment, and the lack of secondary education. This could involve expanding job training programs to align them better with job requirements and implementing apprenticeship programs to bridge the skills gap. It is also essential to implement labour market policies that support decent work for young people. Moreover, there is a need for targeted policies and interventions that address the specific labour market requirements and challenges faced by different sub-groups of youth, such as young woman and rural youth

In summary, the results presented in this study underscore the usefulness of the YLMI as a tool for informing and targeting policies and interventions aimed at promoting a well-functioning labour market for youth. The analysis of the YLMI, along with its decomposition by dimension and indicator, guides policymakers in addressing the most pressing challenges and needs faced by young people in the labour market. Additionally, the disaggregation of the YLMI by various sub-groups of youth enables the identification of the most vulnerable sub-groups, facilitating the effective allocation of resources towards those who need them the most.

34

References

Anand, R., Kothari, S. and Kumar, N. (2016)

‘South Africa: Labor Market Dynamics and Inequality’. IMF Working Paper (WP 16/137)

International Monetary Fund

Alkire, S. and Foster, J. (2011)

‘Counting and multidimensional poverty measurement’, Journal of public economics. Elsevier, 95(7–8), pp. 476-487.

Alkire, S. and Santos, M.E. (2014)

‘Measuring acute poverty in the developing world: Robustness and scope of the multidimensional poverty index’, World Development. Elsevier, 59, pp. 251–274.

Baker, A. and Ball, M. (2018)

‘Indicators of Labour Market Conditions in Advanced Economies. Bulletin-June 2018’, Reserve Bank of Australia Reserve Bank of Australia.

Bandura, R. (2008)

‘A survey of composite indices measuring country performance: 2008 update’, New York: United Nations Development Programme, Office of Development Studies (UNDP/ODS Working Paper).

Office of Development Studies

United Nations Development Programme, New York

Bolli-Kemper, J.M. (2022)

‘CES Youth Labor Market Index: Technical Report’, CES Studies

ETH Zurich, 25.

Botelho, V. and Da Silva, A.D. (2019)

‘Indicators of labour market conditions in the euro area’, Economic Bulletin Boxes European Central Bank, 8.

Cassim, A. and Oosthuizen, M. (2014)

‘The state of youth unemployment in South Africa’, Africa in Focus.

[Accessed June, 2023.

https://www.brookings.edu/blog/ africa-in-focus/2014/08/15/thestate-of-youth-unemploymentin-south-africa/]

De Lannoy, A., Graham, L., Patel, L. and Leibbrandt, M. (2020)

‘Why is youth unemployment so intractable in South Africa?

A synthesis of evidence at the micro-level’, Journal of Applied Youth Studies. Springer, 3(2), pp. 115–131.

Edwards, K. and Gustafsson, L. (2013)

‘Indicators of labour demand’, RBA Bulletin, September, pp. 1–11.

Elder, S. (2009)

‘ILO school-to-work transition survey : A methodological guide. Module 4 - Key indicators of youth labour markets: Concepts, definitions and tabulations’, Technical report, International Labour Office Geneva

Frame, E., De Lannoy, A. and Leibbrandt, M. (2016)

‘Measuring multidimensional poverty among youth in South Africa at the sub-national level’, Southern Africa Labour and Development Research Unit Working Paper Number 169. Cape Town: SALDRU, University of Cape Town

Francis, D., Valodia, I. and Webster, E. (2020)

‘Politics, policy, and inequality in South Africa under COVID-19.’ Agrarian South: Journal of Political Economy, 9(3), pp. 342-355.

Gerber, C. (2022)

‘Gender and precarity in platform work: old inequalities in the new world of work.’ New Technology, Work and Employment, 37(2), pp. 206-230.

Grabrucker, K., Grimm, M. and Roubaud, F. (2018)

‘The informal sector in subSaharan Africa: A comparative perspective’, The South African Informal Sector: Creating Jobs, Reducing Poverty. HSRC Press Cape Town, pp. 48–74.

Graham, L. and Mlatsheni, C. (2015)

‘Youth unemployment in South Africa: Understanding the challenge and working on solutions’, In: De Lannoy, A., Swartz, S., Lake, L. & Smith, C. (eds) South African Child Gauge 2015, pp 51-59. Children’s Institute, University of Cape Town

35

Graham, L., Patel, L., Chowa, G., Khan, Z., Masa, R., Mthembu, S. and Williams, L. (2019)

‘Siyakha Youth Assets Study: Developing Youth Assets for Employability.’ Centre for Social Development in Africa, Johannesburg. Available: https://www.uj.ac.za/wpcontent/uploads/2021/10/siyakha -report-june-2019-weblowres.pdf

Häusermann, S. and Schwander, H. (2012)

‘Varieties of dualization? Labor market segmentation and insider-outsider divides across regimes.’ The age of dualization: The changing face of inequality in deindustrializing societies, pp. 27-51.

Hofmeyr, C., Branson, N. and Leibbrandt, M. (2013)

‘The matric certificate is still valuable in the market.’ Econ 3x3. https://www.econ3x3.org/article/ matric-certificate-still-valuablelabour-market Accessed 06/06/2023

International Labour Organisation (ILO) (2015)

‘Key Indicators of the Labour Market (KILM) 2015. International Labour Office, Geneva.’ Available at:

https://www.ilo.org/global/statisti cs-and-databases/researchand-databases/kilm/lang en/index.htm [accessed 29/06/2022].

International Labour Organisation (ILO) (2016)

Non-standard employment around teh world. Understanding challenges, shaping prospects. International Labour Office, Geneva

International Labour Organisation (ILO) (2018)

Women and Men in the Informal Economy: A Statistical Picture Third Edition. International Labour Office, Geneva

International Labour Organisation (ILO) (2020)

‘Global Employment Trends for Youth 2020: Technology and the future of jobs’, International Labour Office, Geneva.ILO (2021). 'Inequalites and world of work'. International Labour Conference, 109th Session. International Labour Office, Geneva

Inclusive Society Institute. (2023) ‘Understanding youth inequality.’ Inclusive Society Institute, Cape Town. Available: https://www.inclusivesociety.org. za/post/understanding-youthinequality

Jain, R., Budlender, J., Zizzamia, R. and Bassier, I. (2020) 'The labour market and poverty impacts of covid-19 in South Africa.' SALDRU Working Paper Series 264, Cape Town.

Kabeer, N. (2012)

‘Women’s economic empowerment and inclusive growth: labour markets and enterprise development.’ SOAS Discussion Paper 29/12. School of Oriental and African Studies (SOAS), London.

Kudrzycki, B., Gunther, I. and Lefoll, E. (2020)

‘Youth labor index for low income countries’, Working Papers, No. 13. NADEL - Center for Development and Cooperation, ETH Zurich Chair of Education Systems, Swiss Federal Institute of Technology Zurich.

MacDonald, R. (2017)

‘Precarious work: the growing precarité of youth’, in in A. Furlong (ed.) The international handbook of youth and young adulthood, 2nd edn. London: Routledge

Melrose, M. (2012)

‘Young people, welfare reform and social insecurity.’ Youth and Policy, 108, pp. 1-19.

Mhlana, S. (2023)

‘Precarious Work and the Gendered Individualisation of Risk in the South African Manufacturing Sector, 2002–2017.’ Global Labour Journal, 14(2).

Mitchell, A. and Shillington, E.R. (2002)

'Poverty, inequality and social inclusion.' Laidlaw Foundation, Toronto.

Mudiriza, G. and De Lannoy, A. (2022).

Profile of young NEETs in South Africa.Southern Africa Labour and Development Research Unit, Policy Brief. University of Cape Town. [Accessed, June, 2023]

Mudiriza, G., De Lannoy, A. and Youth Capital (2021)

‘Youth in the time of a global pandemic: An analysis of recent data on young people’s experiences during COVID-19. In De Lannoy, A., Langa, M., and Brooks, H. (eds).’, Youth in South Africa, Agency, (in)visibility and national development: Mapungubwe Institute for Strategic Reflection (MISTRA), Johannesburg, 187-221.

National Economic Development and Labour Council (2023) ‘Economic and Employment Trends in South Africa.’ Issue 1, April 2023.

36

National Treasury (2011)

Confronting Youth

Unemployment: Policy Options for South Africa: Discussion Paper. National Treasury, Pretoria.

National Youth Development Agency (2020)

‘National Youth Development Agency. Revised NYDA 5-year strategic plan 2020-2025’.

Ntuli, M. and Kwenda, P. (2014)

‘Labour unions and wage inequality among African men in South Africa’, Development Southern Africa, 31(2), pp. 322–346.

OECD (2008)

Handbook on constructing composite indicators: methodology and user guide OECD Publishing.

OECD (2010)

Off to a Good Start? Jobs for Youth OECD,Paris, France. doi: 10.1787/9789264096127-en.

Puerto, S., Pilgrim, M. and Weck, S. (2011)

‘Benchmarks for youth employment. report on the first benchmarking exercise of the lead country network’, Technical report, International Labour Office-Yen Secretariat

Pusterla, F. (2015)

‘How did the youth labour market situation evolve between 2012 and 2013? Second release of the KOF Youth Labour Market Index, KOF Studien, No. 67, ETH Zurich, KOF Swiss Economic Institute, Zurich’.

Rathi, S.S. and Vermaak, C. (2018)

‘Rural electrification, gender and the labor market: A crosscountry study of India and South Africa’, World Development, 109, pp. 346–359.

Renold, U., Bolli, T., OswaldEgg, M.E. and Pusterla, F. (2014) 'On the multiple dimensions of youth labour markets: A guide to the KOF Youth Labour Market Index,' KOF Studien, No. 51, ETH Zurich, KOF Swiss Economic Institute, Zurich

Rubery, J. and Piasna, A. (2017)

‘Labour market segmentation and deregulation of employment protection in the EU.’ Myths of Employment Deregulation: How It Neither Creates Jobs Nor Reduces Labour Market Segmentation. Brussels: ETUI, 43-60.

Saunders, S. (2001)

‘Using Training Indicators To Improve Planning for Vocational Education and Training.’, National Centre for Vocational Education Research, South Australia. ERIC, (Proceedings of the Australian Vocational Education and Training Research Association (ANETRA) Conference).

Schwidrowski, Z.B. et al. (2021) ‘Assessing gender gaps in employment and earnings in Africa: The case of Eswatini’, Development Southern Africa Routledge, 38(4), pp. 643–663. doi: 10.1080/0376835X.2021.1913996.

South African Schools Act (1996) Government Gazette, 377(17579).

Statistics South Africa (2022)

‘Quarterly Labour Force Survey

2013-2023, Quarter 1, Pretoria: Stats SA. Analysis by authors.’

Available at:

https://www.datafirst.uct.ac.za/d ataportal/index.php/catalog/902

The Basic Conditions of Employment Act (1997) Government Gazette, 390(18491).

The Presidency of South Africa (2022)

'Overview of the PYEI.' Available at:

https://www.stateofthenation.go v.za/presidential-youthemployment-intervention

UNICEF (2019)

‘Transitions from School to Work. New York: United Nations Children’s Fund (UNICEF)’, Education Section. New York

United Nations (2013)

‘Definition of youth - United Nations Youth’. Available at: https://www.un.org/esa/socdev/ documents/youth/factsheets/youth-definition.pdf, accessed 23 June 2022.

van der Berg, S., Gustafsson, M. and Malindi, K. (2020)

‘Education and skills for the economy and links to labour markets in South Africa’, Pretoria: National Planning Commission.

Visagie, J. and Turok, I. (2021)

‘Rural urban inequalities amplified by COVID-19: evidence from South Africa’, Area Development and Policy, 6(1), pp. 50–62.

Wakefield, H.I., Yu, D., and Swanepoel, C. (2022)

‘Revisiting transitory and chronic unemployment in South Africa.’ Development Southern Africa, 39(2) pp. 87-107.

37

Appendix

Study

International Labour Organization (ILO), 2015

Labour Market Indicators

Key Indicators for the Labour Market (KILM): Labour force participation rate, employment-to-population rate, status in employment, employment by sector, employment by occupation, part-time workers, hours of work, employment in the informal economy, unemployment, youth unemployment, long-term unemployment, time-related underemployment, inactivity, educational attainment and illiteracy, skills mismatch, wages and compensation costs, labour productivity, poverty, income distribution, employment by economic class and working poverty.

Botelho and Silva, 2019

Aligned with the KILM but made some key additions: Job separation rate, job finding rate, job vacancy rate, real compensation per hour, labour productivity per hour, and skills mismatch.

Elder, 2009**

Demand side: Youth unemployment rate, the ratio of youth-to-unemployment rates, the youth employment-to-population ratio, the inactivity rate of youth, the discouraged worker rate of youth, the distribution of youth employment, the distribution of youth employment status, the vulnerable employment rate of youth, the share of time-related underemployed in total youth employment, the share of young workers engaged in excessive hours of work, and the wage or earnings of young workers (all these indicators are proxy measures as they are derived from household surveys).

Supply side: The net enrolment rate at the secondary and tertiary levels, and the distribution of the youth labour force based on the level of educational attainment.

Puerto et al., 2011**

Indicators that map youth in the labour market: Distribution of the youth population by primary activity, the youth unemployment rate, the relaxed youth unemployment rate, and the youth employment-to-population rate.

Indicators that map youth in the labour market: The status of young workers in employment, youth employment by sector, and median earnings for wage and salaried workers.

Indicator linking the labour market with education: Educational attainment of the youth labour force.

OECD, 2010**

Scoreboard of ten labour market indicators: Youth unemployment rate, youth employment rate, share of temporary contracts in youth employment, share of part-time employment in youth employment, youth not in education, employment, or training (NEET) rate, share of youth under-employed (working part-time but desiring full-time work), youth labour market participation rate, youth job vacancy rate, youth long-term unemployment rate and youth educational attainment level.

** indicates that the labour market indicators found in the study are specific to youth.

38
Table A1. Labour market indicators in the literature
39
Year Activity state Transition Working conditions Education NEET rate Unemployment rate (Off) Unemployment rate (Exp) Relative unemployment rate Long-term unemployment rate Vulnerable employment rate Informal employment rate Elementary occupation rate Skills mismatch rate No secondary education rate 2013 37.6 35.3 47.9 2.4 64.2 8.1 22.9 28.2 24.9 62.7 2014 36.4 35.3 46.6 2.3 65.1 7.0 22.7 27.0 24.9 62.0 2015 36.6 36.1 46.9 2.2 61.9 7.6 22.7 29.0 24.9 62.2 2016 37.3 36.9 47.8 2.2 63.5 8.0 23.8 27.9 24.9 61.6 2017 37.6 38.0 47.9 2.1 63.7 7.8 23.2 28.3 24.7 59.7 2018 38.1 37.1 48.4 2.2 67.7 8.0 24.2 28.3 24.7 58.0 2019 39.3 38.5 50.3 2.2 68.7 9.0 24.9 28.8 24.7 57.5 2020 40.3 42.1 52.6 2.2 70.3 8.9 25.0 28.4 24.8 56.0 2021 42.4 45.2 56.4 2.0 76.7 9.0 24.4 26.2 24.8 54.3 2022 44.8 46.8 58.3 1.9 77.9 10.7 27.0 28.2 24.8 53.8 2023 43.2 45.5 55.1 2.1 75.4 9.4 25.6 28.2 24.7 52.8
Table A2. Summary statistics of the Youth Labour Market Index (YLMI) indicators by year

Notes: Point estimates are weighted using person weights.

Source: Own calculations using 2013-2023 QLFS quarter one data.

40
Year Male Female Activity State Working Condition Transition Education Activity State Working Condition Transition Education 2013 21.2 30.6 21.9 26.3 23.0 29.1 22.7 25.1 2014 21.4 30.8 22.1 25.7 23.2 29.3 22.4 25.1 2015 21.1 30.4 22.9 25.6 23.0 28.9 23.1 25.0 2016 20.8 30.9 22.6 25.7 23.0 28.8 23.1 25.1 2017 20.9 31.0 22.9 25.3 22.7 28.9 23.3 25.1 2018 21.1 31.3 22.0 25.5 23.1 29.1 23.0 24.9 2019 21.1 31.2 22.3 25.4 22.5 29.4 22.8 25.3 2020 20.3 31.7 22.3 25.7 22.1 29.9 22.8 25.2 2021 19.5 32.8 21.9 25.8 21.4 30.8 22.3 25.5 2022 19.3 32.5 22.3 25.9 20.8 30.5 22.6 26.0 2023 19.4 32.8 22.4 25.3 21.8 30.3 22.4 25.6
Table A3. Contribution of each dimension by gender

A4. Contribution of each indicator by gender

Notes: Point estimates are weighted using person weights.

Source: Own calculations using 2013-2023 QLFS quarter one data.

41
Table
Year NEET Official Unemployment Expanded Unemployment Vulnerable Employment Informal employed Elementary Employment Long term unemployment Relative unemployment Skills mismatch No Sec education 2013 7.3 7.9 6.0 11.9 9.8 8.9 6.1 15.8 14.5 11.8 2014 7.5 7.8 6.2 11.9 9.7 9.2 6.2 15.9 14.3 11.4 2015 7.5 7.6 6.0 11.8 9.8 8.8 6.5 16.4 14.2 11.4 2016 7.4 7.5 6.0 11.8 9.9 9.1 6.3 16.2 14.4 11.3 2017 7.4 7.4 6.1 11.9 10.0 9.1 6.4 16.4 14.4 10.9 2018 7.5 7.7 6.0 12.1 10.1 9.1 5.4 16.6 14.7 10.8 2019 7.5 7.6 6.0 12.1 10.0 9.2 5.5 16.9 14.7 10.7 2020 7.4 7.2 5.7 12.3 10.1 9.3 5.3 17.1 15.0 10.7 2021 7.3 7.0 5.3 12.4 10.5 9.9 4.2 17.7 15.2 10.5 2022 7.2 6.9 5.2 12.4 10.4 9.7 4.0 18.3 15.5 10.5 2023 7.2 6.8 5.4 12.4 10.6 9.8 4.8 17.6 15.3 10.1 Male Youth 2013 8.1 8.1 6.8 11.0 9.3 8.9 7.2 15.5 13.5 11.6 2014 8.2 8.1 6.9 11.1 9.4 8.8 6.7 15.7 13.5 11.6 2015 8.1 8.0 6.9 11.0 9.2 8.6 7.5 15.6 13.5 11.5 2016 8.1 8.0 6.8 11.0 9.0 8.7 7.2 15.9 13.6 11.5 2017 8.0 7.9 6.8 11.1 9.1 8.7 7.1 16.2 13.7 11.4 2018 8.1 8.1 6.9 11.1 9.1 8.9 6.7 16.3 13.8 11.1 2019 8.0 7.9 6.6 11.2 9.2 9.0 6.5 16.3 14.0 11.3 2020 8.0 7.7 6.5 11.4 9.3 9.2 6.2 16.6 14.2 11.0 2021 7.9 7.4 6.2 11.7 9.6 9.6 5.0 17.3 14.5 10.9 2022 7.6 7.3 5.9 11.6 9.3 9.5 4.9 17.7 14.8 11.2 2023 7.8 7.6 6.4 11.7 9.3 9.3 5.0 17.4 14.7 10.9
Female Youth
42
Year Urban Rural Activity State Working Condition Transition Education Activity State Working Condition Transition Education 2013 23.2 30.8 22.0 24.0 20.4 26.7 23.5 29.4 2014 23.4 30.9 22.1 23.7 20.7 26.8 23.1 29.4 2015 23.0 30.2 23.1 23.6 20.6 27.8 22.8 28.8 2016 22.7 30.7 22.7 23.9 21.0 27.1 23.5 28.3 2017 23.1 30.6 22.7 23.6 19.7 27.8 24.1 28.4 2018 23.3 30.8 22.3 23.6 20.1 28.0 23.4 28.6 2019 23.0 30.9 22.4 23.8 19.7 28.2 23.3 28.7 2020 22.4 31.4 22.3 23.9 19.1 28.5 23.6 28.8 2021 21.7 32.5 21.7 24.2 18.4 29.4 23.5 28.8 2022 21.4 32.1 21.9 24.6 17.6 29.5 24.1 28.8 2023 22.0 32.1 21.8 24.0 18.1 29.1 24.1 28.7 Notes:
Source: Own calculations using 2013 - 2023 QLFS quarter one data.
Table A5. Contribution of each dimension by urban and rural location
Point estimates are weighted using person weights.

Notes: Point estimates are weighted using person weights.

Source: Own calculations using 2013-2023 QLFS quarter one data.

43
Urban Year NEET Official Unemployment Expanded Unemployment Vulnerable Employment Informal employed Elementary Employment Long term unemployment Relative unemployment Skills mismatch No Sec education 2013 8.1 8.0 7.1 11.4 9.9 9.5 6.5 15.5 13.8 10.2 2014 8.2 8.0 7.2 11.5 9.9 9.5 6.3 15.8 13.8 9.9 2015 8.1 7.9 7.1 11.3 9.7 9.2 7.1 16.0 13.7 9.9 2016 8.0 7.7 7.0 11.4 9.8 9.5 6.6 16.0 13.9 10.0 2017 8.1 7.9 7.1 11.4 9.8 9.3 6.4 16.3 13.9 9.7 2018 8.2 8.0 7.1 11.6 9.8 9.4 5.9 16.4 14.1 9.5 2019 8.1 7.9 7.0 11.5 9.8 9.5 5.9 16.5 14.2 9.5 2020 8.1 7.6 6.7 11.8 10.0 9.6 5.5 16.8 14.4 9.5 2021 7.9 7.5 6.3 11.9 10.3 10.3 4.2 17.5 14.7 9.4 2022 7.8 7.4 6.2 11.9 10.1 10.1 4.0 17.9 15.0 9.6 2023 7.9 7.5 6.6 11.9 10.2 10.0 4.6 17.3 14.8 9.3 Rural 2013 7.3 8.1 5.0 11.5 8.3 6.8 7.3 16.3 14.6 14.9 2014 7.4 8.1 5.1 11.3 8.3 7.2 7.1 16.0 14.5 14.9 2015 7.5 7.8 5.4 11.5 8.9 7.4 6.8 15.9 14.4 14.4 2016 7.4 8.2 5.4 11.3 8.4 7.4 7.3 16.2 14.3 14.1 2017 7.3 7.3 5.2 11.5 8.7 7.6 7.6 16.5 14.5 13.9 2018 7.2 7.7 5.1 11.6 8.6 7.8 6.5 16.9 14.7 13.8 2019 7.2 7.5 5.0 11.8 8.8 7.6 6.3 17.1 14.8 13.9 2020 7.2 7.1 4.9 11.9 8.6 8.0 6.5 17.1 15.1 13.7 2021 7.1 6.6 4.6 12.3 9.1 8.0 5.6 17.9 15.4 13.4 2022 6.8 6.5 4.3 12.3 9.0 8.1 5.6 18.5 15.5 13.3 2023 6.9 6.5 4.7 12.4 8.9 7.9 5.6 18.5 15.6 13.1
Table A6. Contribution of each indicator by urban and rural location

Notes: Point estimates are weighted using person weights.

Source: Own calculations using 2013-2023 QLFS quarter one data.

44
Province National Eastern Cape Free State Gauteng KwaZuluNatal Limpopo Mpumala nga North West Northern Cape Western Cape 2013 16.8 16.5 16.3 16.7 16.7 16.8 16.2 17.1 17.2 17.5 2014 16.9 16.7 16.3 17.0 16.8 16.9 16.0 16.9 16.8 17.4 2015 17.0 16.6 16.6 16.9 17.0 16.6 16.6 16.8 16.9 17.8 2016 16.8 16.8 16.4 16.5 16.7 17.4 16.5 16.7 17.8 17.8 2017 16.8 16.7 16.3 16.6 16.3 17.3 16.5 16.7 17.2 17.5 2018 16.6 16.3 16.3 16.4 16.3 16.6 16.0 16.7 17.0 17.6 2019 16.4 15.9 16.0 16.3 16.0 16.6 16.1 16.5 16.9 17.5 2020 16.1 15.9 15.9 15.9 15.8 16.1 15.7 16.0 16.8 17.4 2021 15.8 15.4 15.0 15.6 15.6 16.2 15.5 15.4 16.0 17.0 2022 15.5 15.4 15.6 15.0 15.5 15.6 15.1 15.3 16.2 16.9 2023 15.7 15.8 15.6 15.4 15.4 15.5 15.4 15.2 17.0 17.0
Table A7. The YLMI by province and year

Table A8. Alternative weighting schemes

Notes: Point estimates are weighted using person weights.

Source: Own calculations using 2013 QLFS quarter one data.

Notes: Point estimates are weighted using person weights.

Source: Own calculations using 2013 QLFS quarter one data.

45
Equal weights Weights 1 Weights 2 Weights 3 Activity state 25% 40% 20% 20% Working conditions 25% 20% 40% 20% Transition 25% 20% 20% 40% Education 25% 20% 20% 20%
Equal weights Weights 1 Weights 2 Weights 3 Equal weights 1 Weights 1 1 1 Weights 2 0.9879 0.9879 1 Weights 3 0.8667 0.8667 0.8061 1
Table A9. Spearman’s rank correlation coefficients

What is AFD?

Éditions Agence française de développement publishes analysis and research on sustainable development issues. Conducted with numerous partners in the Global North and South, these publications contribute to a better understanding of the challenges faced by our planet and to the implementation of concerted actions within the framework of the Sustainable Development Goals.

With a catalogue of more than 1,000 titles and an average of 80 new publications published every year, Éditions Agence française de développement promotes the dissemination of knowledge and expertise, both in AFD’s own publications and through key partnerships. Discover all our publications in open access at editions. afd.fr.

Towards a world in common.

Publication Director Rémy Rioux

Editor-in-Chief Thomas Melonio

Legal deposit 3rd quarter 2023

ISSN 2492 - 2846

Rights and permissions

Creative Commons license

Attribution - No commercialization - No modification https://creativecommons.org/licenses/by-nc-nd/4.0/

Graphic design MeMo, Juliegilles, D. Cazeils

Layout Denise Perrin, AFD

Printed by the AFD reprography service

To browse our publications: https://www.afd.fr/en/ressources-accueil

Agence française de développement
l
5, rue Roland Barthes 75012 Paris
France www.afd.fr

Turn static files into dynamic content formats.

Create a flipbook
Issuu converts static files into: digital portfolios, online yearbooks, online catalogs, digital photo albums and more. Sign up and create your flipbook.