Global biodiversity scenarios: what do they tell us for BiodiversityRelated Financial Risks?

Research papers Authors Julie Maurin Julien Calas Etienne Espagne Antoine Godin Coordination Julien Calas DECEMBER 2022 No. 266
INTRODUCTION
1. BIODIVERSITY-RELATEDFINANCIALANDSOCIO-ECONOMICRISKS(BRFRS)
1.1. Assessmentofphysical andtransitionriskrelatedtobiodiversity
1.2. The growinginterestofthe financialcommunity inBRFRs
1.3. Methodology ofbiodiversity-relatedstresstest
2. AGENERALPRESENTATIONOFBIODIVERSITYSCENARIOS
2.1. The differenttypesofscenariosandmodels
2.2. The existingbiodiversityscenarios
2.3. Identificationofbiodiversityscenariosfortheliteraturereview
3. COMPARISONOFQUANTITATIVEBIODIVERSITYSCENARIOSSELECTED
3.1. The conceptualframework
3.1.1. The type ofscenarios
3.1.2. The scenariomethod
3.1.3. The environment
3.1.4. The time horizonofscenarioprojections
3.2. The scenario(qualitative)narratives
3.3. Assumptionsandquantifiedparameters
3.3.1. Quantificationofthe SharedSocio-economic Pathways (SSPs) andthe Representative Concentration Pathways(RCPs)
3.3.2. Additional quantitative trajectoriesrelatedtobiodiversity
3.4. Modelingtrajectories
3.4.1. Modelsofchange ofdirectandindirectdrivers ofbiodiversityloss
3.4.2. Biodiversitymodels
3.4.3. EcosystemService(ES)models
3.5. The evaluationofquantitativeresults
4. DISCUSSION
4.1. The long-termprospects
4.2. The shortandmiddle-termrecommendations
5. APPENDICES
5.1. DetailedSharedSocio-economic Pathways (SSPs)
5.2. Detailedscenarionarratives ofCheunget al.(2019)
5.3. Detailedscenarionarratives ofKoket al.(2020)
BIBLIOGRAPHY
LISTOFACRONYMSANDABBREVIATIONS
AgenceFrançaisedeDéveloppement
Papiersderecherche
Les Papiers de Recherche de l’AFD ont pour but de diffuser rapidement les résultats de travaux en cours.Ilss’adressentprincipalementauxchercheurs, auxétudiantsetaumondeacadémique.Ilscouvrent l’ensemble des sujets de travail de l’AFD : analyse économique, théorie économique, analyse des politiques publiques, sciences de l’ingénieur, sociologie, géographie et anthropologie. Une publication dans les Papiers de Recherche de l’AFD n’enexclutaucuneautre.
Lesopinionsexpriméesdanscepapiersontcellesde son (ses) auteur(s) et ne reflètent pas nécessairement celles de l’AFD. Ce document est publié sous l’entière responsabilité de son (ses) auteur(s)oudesinstitutionspartenaires.
AFDResearchPapers
AFD Research Papers are intended to rapidly disseminate findings of ongoing work and mainly target researchers, students and the wider academic community. They cover the full range of AFD work, including: economic analysis, economic theory, policy analysis, engineering sciences, sociology, geography and anthropology. AFD Research Papers and other publications are not mutuallyexclusive.
Theopinionsexpressedinthispaperarethoseofthe author(s) and do not necessarily reflect the position of AFD. It is therefore published under the sole responsibility of its author(s) or its partner institutions.
Globalbiodiversity scenarios:whatdotheytell usforBiodiversity-Related FinancialRisks?
Abstract
AUTHORS
JulieMAURIN AFD
JulienCALAS AFD
AntoineGODIN AFD
EtienneESPAGNE WorldBank
Therisksassociatedwith biodiversity losscouldhave severesocio-economicand financialconsequences,at leastaslargeasthoseimposed byclimatechange,inaddition tointeractingwiththem. Becauseofthe potentialthreat, theypose tofinancialstability, Biodiversity-RelatedFinancial Risks(BRFRs) haverecently capturedthe attentionofthe financialcommunity.As with climaterisks,centralbanksand financialauthoritiesmighthave toconductbiodiversityrisk stress tests andadjusttheir dailyoperations andregulatory toolstothisnewnormal.
COORDINATION
JulienCALAS(AFD)
However, unlessappropriate biodiversityscenariosare foundtobuildaforwardlookingassessmentofthe consequences ofphysicaland transitionshocks onindustries andsectors,meaningful inclusionofNature-Related FinancialRisks(NRFRs)cannot seethe lightofday.This paper aimstoreviewandcompare existingquantitative biodiversityscenariosand models onaglobalscale that couldhelpfulfill thisrole. Italso offers anassessmentofthe pathforwardfor researchto developingscenariosforBRFRs ateachstepofthe process: frombuildingnarratives, quantifyingtheimpactsand dependencies, assessingthe uncertaintyrangeonthe resultsallthewayfromthe ecosystemtotheeconomic andfinancial asset.
The paperhasseveralkey findings.First,globaland quantitativephysicalrisk scenariosarealmostabsent; thisiswhyitconcentrateson transitionscenarios of biodiversity.Second, most ecological transitionscenarios are built inaccordancewith the ConventiononBiological
Diversity(CBD) goals,evenif future landallocationvaries acrossstudies.Third,Shared Socio-economicPathways (SSPs) donotassessthe biophysicalconsequences of theireconomicgrowth hypothesis.Fourth, thepaper highlights theneedforcentral banks andsupervisorstotake intoaccountthe uncertainties inherentinbothintegrated models andbiodiversity indicators.Forthe latter, the uncertaintyresults from measuringonlyatinyfraction ofglobal biodiversity. Finally, thestudyoffers recommendationsforcentral banks andfinancialauthorities toimprovetheirscenario selectionintheshorter-term.
Keywords
Biodiversityscenarios; Biodiversity-relatedfinancial risks; Ecologicaltransition modeling
Acknowledgments
We are grateful tothe peer reviewers whoprovided invaluableinputona preliminary draft, including Benoit Faivre-Dupaigre(AFD), Hélène Soubelet(FRB),and YoshihideWada(IIASA).We wouldalsoliketoacknowledge andthankMarcel Kok(PBL), MathildeSalin(Banque de France)andPaul Hadji-Lazaro (AFD)forthemultiple discussionswehadwiththem onthesetopics.Allremaining errorsinthetext areourown responsibility. Originalversion English
Introduction
Biologicaldiversityisthelivingfabricofour planet. It refers to the variety of living organisms present in each terrestrial and aquatic ecosystem and the ecological complexes of which they are part; including diversity within species (i.e., genetic diversity), diversity between species (i.e., species diversity), and diversity of ecosystems (i.e., ecological diversity). The interactionswithinandbetweenthesethree levels of diversity are another crucial componentofbiodiversity.
Humanactivityexacerbatestheerosionof biodiversity both directly and indirectly. The main anthropogenic drivers1 of biodiversity loss are land-use change, natural resource use, pollution, the introductionofinvasivespecies,andclimate change.In turn, indirectpressuresrelatedto demographic, socio-economic, technological, and governance trends in human societies influence these direct pressures. The human impact on biodiversity has severe and sometimes irreversible consequences for Ecosystem Services (ESs), which correspond to the contributions of ecosystems to human survival and quality of life. Four types of ESs are usually distinguished: supporting services (e.g., decomposition of organic matter that contributes to soil fertility), provisioning services (e.g., food products derived from plants, animals, and microorganisms), regulating services (e.g., trees and plants regulate the climate by storing greenhouse gases)andcultural services (e.g., recreation andecotourism).
Recently, the the Network for Greening the Financial System (NGFS, a network of 114central banks and financial supervisors) recognized that Biodiversity-Related Financial and socio-economic Risks (BRFRs), i.e.therisksrelatedtocollapseofbiodiversity orrelatedtoatransitiontoaneconomywith low impacts on biodiversity, is to be considered as a major threat to financial stability (INSPIRE & NGFS, 2022). Given the difficulty of identifying a coherent biodiversity scenario that captures plausible financial shocks (Chenet et al., 2022), this paper presents a literature review aiming to provide an overview of the scenarios useful for BRFR quantification. It can thus inform the choice of central banks and financial authorities in their search for biodiversity scenarios. It can also contribute to improving macroeconomic models used to assess the risks associated with biodiversity loss, by raising methodological problems of existing attempts to scenarios quantification
This paper is structured as follows. Section 1 introduces general concepts on BRFRs Section2 presents the general characterristicsofglobalbiodiversityscenariosaswell as our approach to identify suitable scenarios for BRFR assessment. Section 3 is devoted to the comparison of these biodiversity scenarios and is structured according to the scenario development process (i.e., construction of qualitative narratives, quantification of hypotheses, trajectory modeling, analysis of results, and, ifnecessary,refiningnarratives ormodeling
1 We will use the terms "driver" and "pressure" indifferentlyinthispaper.
hypotheses)andproposesacriticalanalysis for each one. In section 4, we finally make several recommendations, achievable in the short- or long-term, for central banks and financial authorities to improve their scenarioselection.
1. Biodiversity-Related Financial and socio-economic Risks(BRFRs)
1.1 Assessmentofphysicalandtransitionriskrelatedtobiodiversity
ThefastdegradationofESs,onwhichcompaniesdependfortheirproduction,explains,in part, the growing interest of academic research and financial communities in BRFRs These risks can be at least as large as those generated by climate change, in addition to interacting with them (Bradshaw et al., 2021; Section 1 Pörtner et al., 2021; Chenet et al., 2022). They have the potential to threaten the entire economy as well as the stability of financial systems(INSPIRE&NGFS,2022).TheconceptualframeworkdevelopedtoanalyzetheseBRFRs follows the one designed for the case of climate change, distinguishing between physical andtransitionrisks2
Physical risks generated by biodiversity loss arise when environmental changes affect human capital and economic activity, and thus indirectly, financial valuation. As biodiversity loss leads (in a non-linear way) to the loss of ESs, industries that are highly dependent on these ESs, directly or indirectly through their value chain, will be the most affected. Forexample, the agricultural sectoris highlydependent on the pollinationservice, whichalone determines alarge proportionofcropyieldsandthus ofprofitsandjobs.
The central bank of the Netherlands, De Nederlandsche Bank NV (DNB) was the first to conduct BRFRs assessment on a national scale (Van Toor et al., 2020). According to their study,36%ofthe listedequityportfoliosof financialinstitutionsinthe Netherlandsare highly or very highly dependent on at least one ES. Other researchers have subsequently used all orpartofthismethodologytoanalyzeBRFRsinBrazil,Europe,andMalaysia.Caliceetal.(2021) find that 45% of Brazilian banks' total corporate loan portfolio is exposed to sectors that are highly or very highly dependent on one or more ESs. In France, 42% of the value of securities held by financial institutions comes from issuers highly or extremely dependent on at least one ES(Svartzmanet al.,2021).Inaddition, Kedward(2021) find that 40% of the bonds heldby the EuropeanCentral Bankare highly orvery highlydependenton ESs. The ESs on which the centralbank'sbalancesheetassetsaremostdependentarethoserelatedtowater,andthe corresponding financial exposure amountsto38.6 billioneuros. Accordingtothe Malaysian centralbank(BNM,2022),54%ofthecommercialloanportfolioofMalaysianbanksisexposed to sectors that are highly dependent on ESs, particularly surface water (29%) and climate regulation(26%).
Sources of transition risk include changes in policy, consumer preferences or behavior, and changes in technology that aim at mitigating human activity's impact on biodiversity (INSPIRE & NGFS, 2022). These changes will affect industries that degrade ecosystemsthemostcomparedtomorevirtuousindustriesinthesamesector.Forexample,
2 The Taskforce on Climate-related Financial Disclosures recommended this classification for climate change relatedfinancialrisk(TCFD, 2017).
in April 2022, the European Commission accepted the registration of a citizens' initiative called "End The Slaughter Age", which proposes to remove all subsidies dedicated to the livestocksectorinfavorofethicalandecologicalalternativessuchascellularagricultureor plantproteins3
In terms of transition risk exposure, the biodiversity footprint of Dutch financial institutions wouldbecomparabletothelossof58,000km²ofpristinenature,whichismorethan1.7times the terrestrial surface of the Netherlands (Van Toor et al., 2020). For the case of France, Svartzmanetal.(2021)findthatthebiodiversityfootprintoffinancialstocksiscomparableto the artificialization of at least 130,000 km² of pristine nature, equivalent to the conversion of 24%ofmetropolitanFranceintoaparkinglot.Land-usechangeisthemainfactorexplaining these results. In addition, the authors find that most industries' biodiversity footprint is causedbyindirectactivities (e.g., pollution generatedby asupplier).InBrazil, 15% of the loan portfolio of banks is composed of companies that potentially operate in Protected Areas (PAs), 25% if areaslikelytobecome PAssoonare added, and38% ifall high-priority areas for biodiversity conservation are included (Calice et al., 2021). As Brazil adopts biodiversity regulations and policies, as agents' preferences shift toward more sustainable consumption,andaslitigationandreputationaldamagestoindustriesemerge,companies andbanks(ifthey failto adapt)arelikelytoseelosses.
1.2 ThegrowinginterestofthefinancialcommunityinBRFRs
Nature-Related Financial Risks (NRFR) is a new term used by the financial community, particularly by the Taskforce on Nature-related Financial Disclosures (TNFD)4 and the Network for Greening the Financial System (NGFS)5. It refers to risks related to climate change and other environmental disruptions in a single package, this study will concentrate on BRFRs. Indeed, it is only very recently that financial institutions have recognized biodiversityloss asa potential source ofeconomic and financial riskand set up projectstodevelopastrategytorespondtothem.
Since2021,theNGFShasformedaworkinggroupthatdevelopsresearch-basedapproaches to help central banks and supervisors fulfill their mandates in light of biodiversity loss. In particular, it recommends assessing the degree of exposure of financial systems to BRFRs by conducting impact and dependence assessments and developing scenario analyses andbiodiversity-relatedstresstests(INSPIRE&NGFS,2022).
3 EuropeanCommission.
https://ec.europa.eu/commission/presscorner/detail/fr/ip_22_2668
4 TheTaskForceonNature-relatedFinancialDisclosures(TNFD)isaglobalworkinggroupoffinancialinstitutions, companies, and service providers. It develops and provides a common risk management and disclosure frameworkfororganizations toreportandrespondtoNRFRs,withtheultimategoal ofdirectingglobalfinancial flowstowardpositiverather thannegativeoutcomes fornature.
5 The Network for GreeningtheFinancial System (NGFS) is a voluntary initiative created on the occasion of the "One Planet Summit" launched in 2017 by the French President Emmanuel Macron, the United Nations, and the World Bank to identify and accelerate transformational initiatives and financing for climate, biodiversity and oceansolutions.TheNGFSregroups 116centralbanksandregulatorsworldwide.
Both NGFS and TNFD consider the double materiality approach to risks, which requires assessing not only how nature can impact an organization's immediate financial performancebutalsohowtheorganizationaffectsnature.
In addition to the growing interest of financial institutions in assessing BRFRs, financial authorities could systematize this assessment. For example, Article 29 of France's 2019 energy and climate law suggests the integration of BRFRs into the reporting practices of financialactors;itwasthefirstcountrytomakeitmandatory.Frenchbankingregulatorsand insurers have also recognized that, like climate change, growing awareness of the risks posed by biodiversity loss could lead to increased regulation around this issue (ACPR et al., 2020).
Morebroadly,theconceptofBRFRisrapidlyemerginginthepoliticalandeconomicspheres (WorldEconomicForum,2021).Policymakers(G7,2021;OECD,2019),civilsocietyorganizations (Finance Watch, 2022; WWF, 2020), the private sector (TNFD, 2021; SIF, 2021), and academia (Dasgupta, 2021; Kedward et al., 2020 and 2021) have all seized on the link between biodiversity loss and financial/economic instability caused by both the dependence of economic activities on degrading ESs and the likely growth of the activities that have the greatestimpact onthe biosphere.
1.3 Methodologyofbiodiversity-relatedstresstest
It is possible to approach BRFRs statically by analyzing industries or sectors’ positive or negative impacts on biodiversity (i.e. exposure to transition risk) and dependencies on ESs (i.e. exposure to physical risk). Given their complexity and the many methodological challenges BRFRs raise, this method has been widely used, while ignoring the dynamics of ecosystems. Indeed, ecological processes are made up of complex non-linear dynamics, which sometimes lead toirreversible changes in ecosystems and to tipping points that are difficult to predict (Folke et al., 2004). For instance, if regulating and supporting ESs were to disappear, production would be impossible (Dasgupta, 2021) The destruction of natural capital must thus necessarily remain limited to its regeneration capacity to be sustainable inthelongrun.
In macroeconomic models, the value of ESs is often estimated in terms of their contributiontoGrossDomesticProduct(GDP)oroutput,leadingtounderevaluatingtheir importancefor economicactivities.In developed countries, for example, agriculture does not account for a large share of GDP. Furthermore, it represents one of the sectors with the greatestimpactonbiodiversityloss.Accordingtomacroeconomicmodels,ifESsassociated withthissectorwere to collapsepartiallyor entirely,the effectontotal GDPwould hence be marginal.However,lackofagriculturalproductcouldleadtoinflationarypressuresorsocial unrest potentially disrupting the entire economy. Economic models thus need to consider the possibility that the ecosystem could be damaged to the extent that it affects related economic activities or could collapse altogether. Another major challenge is the impossibility of aggregating all aspects of biodiversity into a single measure that implies they arecommensurableandcomparable.
Assessing BRFRs dynamically and prospectively is essential, as regulators and financial actorsneedtoanticipatetheemergenceofrisksthathaveneverbeenobserved. Indeed, the future of biodiversity will depend on many factors, such as the actions of agents (e.g., consumption preferences), political strategies implemented (e.g., biodiversity conservation policies), or demographic changes (e.g., increasing population). In addition, pressures on biodiversity and their associated impacts evolve in a non-linear way. Regarding ClimateRelated Financial Risks (CRFRs), central banks and financial authorities agree that it is impossible to simulate climate shocks using historical data (Batten et al., 2016; DG Treasury, 2017; TCFD, 2017; NGFS, 2019; Regelink et al., 2017). With a forward-looking approach, financial institutions expect to be able to understand and test the resilience of the companies, containedintheirportfolio,the potential materializationofphysicalandtransitionrisks, and theimpactofthesecompaniesonkeyperformanceindicesandtheirabilitytoadapt(Bolton et
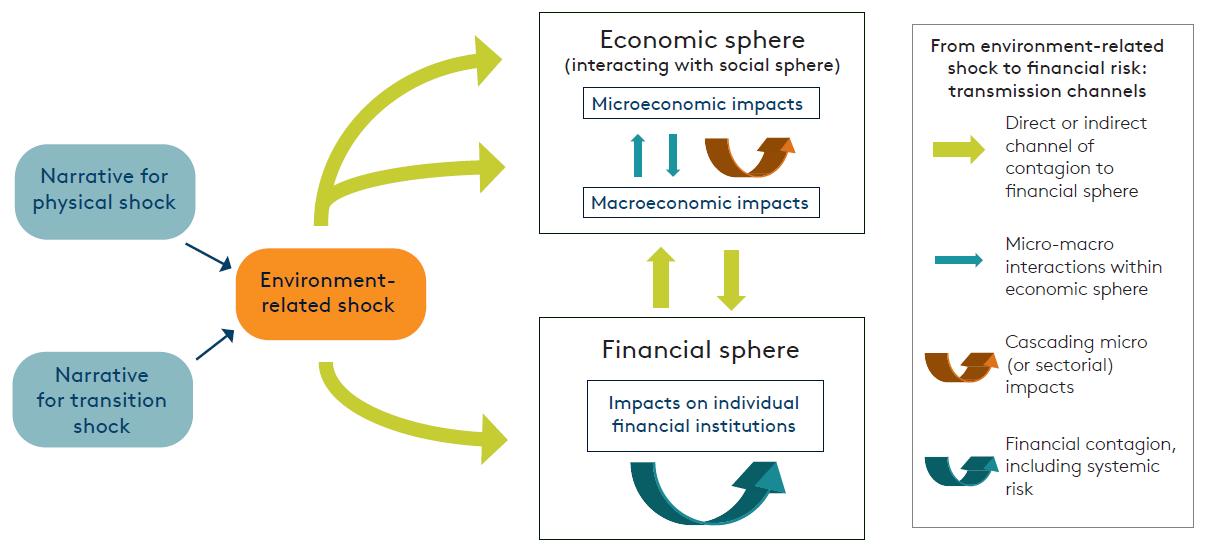
Financial institutions use forward-looking scenario analysis in their stress testing to understand and anticipate CRFRs and the associated future economic costs. Three components are required to conduct these stress test (see Figure 1): (1) developing a scenario of the hazards or shocks that could translate into financial risks; (2) modeling the micro and/or macroeconomic consequences; and (3) modeling the impact of shocks on financialinstitutions.
Thefirststepthusistodefineoridentifyoneormorescenariosofhazardsorshocksthat could occur. It is complicated, however, to have a clear idea of the type of physical or transition shock that might emerge, notably because of the non-linearity of BRFRs. For example, because of increased external nutrient inputs (e.g., from agriculture), lakes can suddenly change from a biodiversity-rich state with clear, transparent water to an
 al.,2020).
Figure1. An environmental stress test (from INSPIRE & NGFS, 2022). Shock narratives are used to model environmental effects and their direct and indirect effects on the economic and financialspheres
al.,2020).
Figure1. An environmental stress test (from INSPIRE & NGFS, 2022). Shock narratives are used to model environmental effects and their direct and indirect effects on the economic and financialspheres
alternative, degraded state with cloudy water and lower species diversity: this is called eutrophication. In the eutrophic state, the water is degraded, invasive species (e.g., green algae in Brittany) can proliferate, and the abundance of fish decreases, which can have a substantialimpactontourismandfishingindustriesandallthosewhousethe lakewater.
In the meantime, biodiversity-related transition shocks could occur in the form of the introduction of specific policies to reduce biodiversity decline. Conservation policies, however, lackatarget and metric comparable tothe 1.5°Candtons of CO2-equivalentthat are used for climate scenarios. For example, greenhouse gas (GHG) emissions contribute almost equally to global warming regardless of where they are emitted, while the impacts of biodiversity loss depend greatly on geographic location and ecosystem types. It is thereforenotsurprisingthatinthe faceofadditional layers ofuncertaintyand non-linearity related to BRFR, the scientific literature aimed at proposing scenarios for analysing these risksface additional scientificchallenges andlimitsincomparisonwiththeCRFR.
2. Ageneralpresentationofbiodiversityscenarios
2.1 Thedifferenttypesofscenariosandmodels
Scenarios are qualitative and/or quantitative representations of possible futures. They describe the evolution of one or more biodiversity pressure factors (e.g., land-use changes) and policy and management options to modify their impacts (e.g., PAs expansion). Scenarios do not predict the future, as there is no consensus on future environmental and socio-economic trajectories; instead, they allow for the description of likelyfuturesinsituationsofhighuncertaintybasedonasetofassumptions(Brondizioetal., 2019).Scenarioscanbe usedtounderstandlocal,regional, andglobaldynamics. Whilethey cannotclaimtorepresenteverything,theyguaranteeinternalconsistencytosupportsound reasoning.
According to the IPBES (2016), three prominent families of scenarios can be distinguished (seeFigure2):
● Exploratoryscenarios examine a range of plausible futures based on the potential trajectories ofdirectand/orindirectdriversofbiodiversity loss.
● Intervention scenarios are used to evaluate policy or management options. They are composed of two subclasses: target-seeking scenarios and policy-screening scenarios. Target-seeking scenarios identify one or more objectives, either in terms of achievable targets or as an objective function to be maximized, and then determine different pathways to achieve that outcome. Policy-screening scenarios allow for ex-ante assessments to predict the effects of different interventions on environmental outcomes.
● Retrospective policy evaluation scenarios are used for ex-post evaluations, i.e., currentassessments of past efforts to achieve policyobjectives across all stages of thepolicycycleanddecision-makingcontext.
Thescenarionarrativecanbedesignedbyexpertsorthroughparticipatorymethods.The so-called"expert"approachusesexperts'opinions,knowledge,andjudgment,i.e.,individuals withexperience ina particulardimension throughtheirtraining, studies, and/orpractices. It is among experts that the first assessments of climate damage functions were developed (Keen, 2021). The participatory approach is stronglyrecommended in some contexts for the developmentofbiodiversityscenarios(Brondizioetal.,2019);itconsistsofpromotingtheuse oflocal knowledgeandincludingvariousstakeholders inthe developmentofvisions forthe future,oftenthroughworkshops.However,dependingonthescale(e.g.,global,regional,and national)considered,theeffectivenessofthisapproachmayvary Indeed,onaglobalscale, the participatory approach is a challenge because the loss of biodiversity and natural resources are in principle, caused by very local problems. However, global scenarios are importantbecause of theinterconnectionofecologicalassets anddriversofchanges
Once a scenario narrative is complete, it can be transformed into a quantitative trajectory using models. The storyline must be translated into a quantitative scenario, specifying values (constant or varying) for several model parameters. The model will also needotherquantitativehypothesestofixvaluesoftheparametersthatdonotbelongtothe specified scenario (this is also known as calibrating or estimating the model). Different models can be used and coupled to quantify biodiversity scenarios Some models assess how changes in indirect pressures (e.g., economy, technology and demography) affect directpressuresfornature(e.g.,land-usechange,climatechangeandnitrogendeposition). Others will model the magnitude of change of direct and indirect pressures on nature regardingbiodiversityandecosystemfunctioning.Afinalcategoryofmodelswillassessthe consequences of natural changes on the well-being that people derive from nature and thatcontributetoagoodqualityoflife,includingESs(Brondizioet al.,2019).
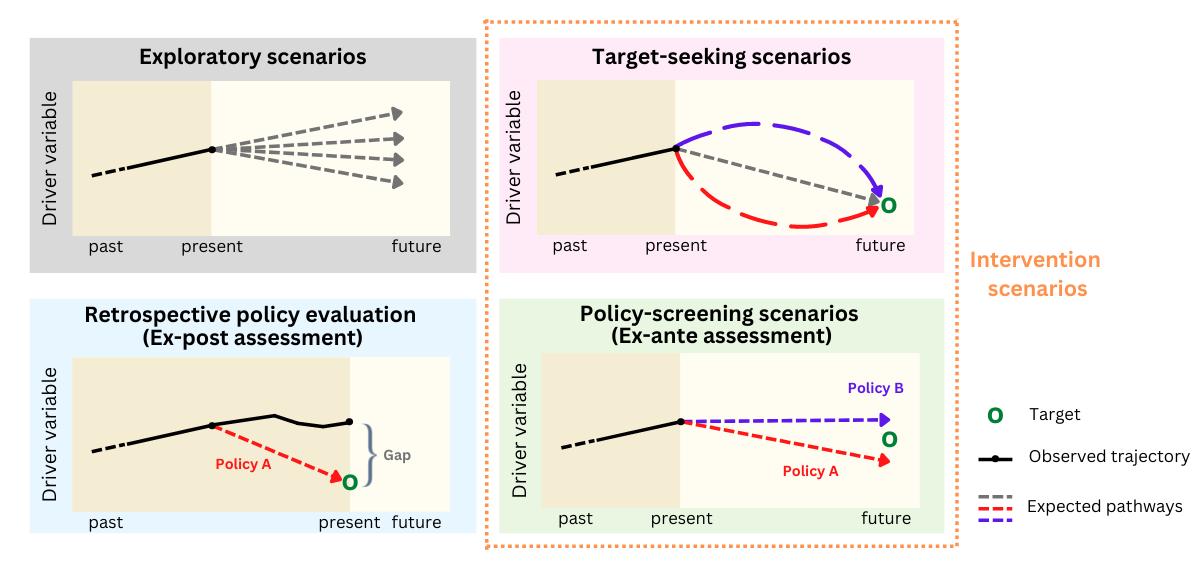 Figure2. The main types of scenarios that can be developed regarding the purpose of developersandusers(adaptedfromFerrieretal.,2016)
No single set of scenarios and models is perfect for representing the future: they have inherent limitations that are more or less manageable. The quality of the model can be assessed by comparing projections of the same scenario with independent data sets, i.e., those that have not been used for calibration or model building; a process also known as backtesting.Itis,moreover,advisabletoprojectthesamescenariothroughmultiplemodels to improve the robustness of projected trajectories (Ferrier et al., 2016). Depending on the differences in policies and contexts, it is essential to diversify the types of scenarios and models to find the most appropriate approach, and use different spatial and temporal scales. Finally, uncertainties inherent in scenarios and models need to be clearly assessed and communicated to avoid the propagation of false results (either optimistic or pessimistic). These uncertainties can have various origins, such as the use of erroneous or insufficient data, the lack of understanding of ecological processes, or the poor predictabilityofthesystem.
2.2 Existingbiodiversityscenarios
To our knowledge, there are no comprehensive scenarios designed to assess the resilienceoffinancialsystemstospecificphysicalortransitionhazardsorshocksrelated tobiodiversity,makingdifficulttoconductbiodiversity-relatedfinancialstresstests.Indeed, biodiversity scenarios, in their current state, do not allow for visualizing the risks incurred by the financial system through its portfolio of assets. They permit assessing the impacts of differenthumanpressuresonland,aquaticecosystems,vegetation,andspecies,butnot necessarilytheimpactonindustriesandsectorsofeconomicactivity.
In the absence of such scenarios, assessing transition and physical risks related to biodiversitycouldconsistinidentifyingtheassetsmostlikelytobestrandedorimpaired intheeventofanecologicaltransitionorecosystemdegradation Forexampleinthecase ofclimate,itisestimatedthat60%ofoilandgasreservesand90%ofcoalreserveswillremain unusedifglobalwarmingislimitedto1.5°C,thethresholdsetbytheParisAgreement(Welsby et al., 2021). In this case, many fossil resources will not be able to be burned, and fossil fuel infrastructure (e.g., pipelines and power plants) will no longer be used: resulting in losses before the end of their anticipated life (i.e. stranded assets).In terms of biodiversity risks, if governments were to suddenly decide to ban certain pesticides and herbicides that significantly degrade soil and surrounding biodiversity, industries in the sector may be left with stranded assets. However, unlike CRFR, no specific activity easily explains the vast majority of human-induced impacts on biodiversity (e.g., similar to sectors emitting GHGs through direct or indirect combustion of fossil fuel for climate change), making sectoral identification difficult. Nevertheless, quantitative scenarios provide a better understanding ofchangesinthe indirectanddirectdeterminantsofbiodiversitydeclineandtheirimpacts ontheenvironment.Thesescenariosmainlyusebiophysicalmodels,althoughsomeexplore socio-economicdynamics(seeChapter 3.4).
Furthermore, as stressed by the NGFS (INSPIRE & NGFS, 2022), cascading and secondround effects, as for CRFRs, will play an important role Cascading effects imply that sectors or corporations can be indirectly affected by a shock through international supply
chains (e.g., Cahen-Fourot et al., 2021; Godin & Hadji-Lazaro, 2022; Espagne et al. 2021) or through financial networks (e.g., Battiston et al., 2017). The combination of multidimensional impacts on biodiversity with multidimensional contagion or cascading effect makes the assessmentofBRFRsparticularlycomplex.
According to the IPBES (2019) literature review on global biodiversity scenarios, global target-seeking scenarios are the most widely used, followed by exploratory and policyscreening scenarios, and the participatory approach is the most common for building scenario narratives. Scenarios are mainly quantitative to the detriment of qualitative scenarios that allow for a better understanding of the interactions between different componentsofasystem,astheyarenotconstrained,intermsofassumptions,bymodeling. There are mainly long projection scenarios with a strong representation of results for the 2050 and 2100 horizons. The agricultural and the forestry sectors are the most represented, followed by the energy and water sectors. The most widely modeled sustainable development goals (SDGs) are 2 (i.e., eradicate hunger) and 15 (i.e., preserve and restore terrestrialecosystems) onthe trade-offbetweenfoodsecurityandterrestrialbiodiversity.
At the regional scale, biodiversity scenarios do not necessarily analyze the greatest pressures on biodiversity. Indeed, the most widely studied indirect drivers of pressure in scenarios are economics, and demography, while climate change and invasive alien species are the most represented direct drivers (Ferrier et al., 2016). Moreover, Titeux et al. (2016) analyzed 2,313 biodiversity scenario articles, at any scale, between 1990 and 2014 and estimated that 85.2% projected only climate change-related impacts, 4.1% related to landuse, and only 10.7% combined both pressure factors. The pressure factor that nevertheless hasthemostsignificantandimminentimpactonterrestrialbiodiversityisland-usechange, not climate change: not integrating this factor in scenario analyses is equivalent to minimizing the risks to biodiversity. According to Titeux et al. (2016), in addition to underestimating land-use as a driver of biodiversity pressure, only some papers consider changes in how humans use and manage land. Indeed, land management regimes (e.g., whether grasslands are mowed or grazed) and land-use intensity (e.g., through timber harvesting or the use of fertilizers, pesticides, and irrigation in cultivated areas) are poorly representedorevencompletelyabsentinthescenarios.
Among global biodiversity scenarios, only a few are designed for freshwater and/or marine environments For marine environments, scenarios primarily explore physical shocks to the fisheries sector through changes in fish catch numbers for different climate warming trajectories (Cheung et al., 2016 and 2017). Another area of great interest for these scenarios is identifying and assessing the impact of expanding Marine Protected Areas (MPAs)onfishingintensityorbiodiversity(Halpernet al.,2010;Pompaetal.,2011).
2.3 Identificationofbiodiversityscenariosfortheliteraturereview
For the development of stress tests, central banks and financial institutions will need quantitativeinterventionscenarios(i.e.,target-seekingandpolicy-screeningscenarios) to assess biodiversity transition risks, and exploratory scenarios for analyzing physical shocksrelatedtobiodiversitydegradation. Therefore, we selected a panel of quantitative biodiversity"transition"scenarios (Table1)forassessingbiodiversitytransitionshocks.These scenarios project biophysical and/or socio-economic dynamics to identify biodiversity changesunderthetransitionassumption.
We found almost no global "physical" scenarios, i.e., scenarios of physical shocks that anticipate, ceteris paribus or assuming a climate scenario, the crossing of tipping point and possible regime shifts, as well as changes in ESs at different points in the world that would be linked to these regime shifts (Turner et al., 2020). The only scenario in this literature review suitable to analyze physical shocks is the exploratory scenario of Johnson etal.(2021). Itproposesanarrativeinwhichthe tippingpointsofthreearbitrarilychosenESs are crossed (i.e. pollination, marine production and wood production) and decline by an arbitrary magnitude Some scenarios, nevertheless, measure changes in ESs under an ecological transition assumption, which could help assessing which economic sectors or businesseswouldbeaffectedifthesechangesweretooccur.Theseanalyzesarelimited,as tipping points and regime shifts are not considered (see Chapter 3.4.3). Thus, most of the quantitative biodiversity scenarios explore transition shocks, with results that can be used for transition risk analyses (changes in biodiversity after the implementation of an ecological transition), and sometimes transition derived physical risk analyses (changes in ESsafter the implementationofanecologicaltransition).
We selected only scenarios with global coverage because most of the economic assets heldarepartofaglobalizedeconomythroughtwodynamics:ontheonehand,globalvalue chains and international financial networks implying strong interconnections between industries in different countries; and on the other one, a geographical (and sectoral) diversification of industries’ dependencies and impact on biodiversity. The analysis conducted by the DNB and the Banque de France shows that many impacts and dependencies are imported or exported through globalized value chains. Working on local scenarios may, therefore, quickly fail to cover all impacts and dependencies, and an aggregation of a multitude of local scenarios would considerably increase the complexity ofthe analysis.Asthisisan"emergingscience",itseemedpreferabletoanalyzethestate of the science globally in order to examine, in a second step, the possibilities and limits of working with disaggregated results of these scenarios at national (or even sub-national) levels, which are the usual levels at which financial regulators aggregate economic and financial data. It is implicitly accepted that these global scales are based on less sophisticated and precise scenarios than more localized ones. In this first approach, we have thus favored a criterion of completeness to the detriment of precise but not reproduciblescenarios
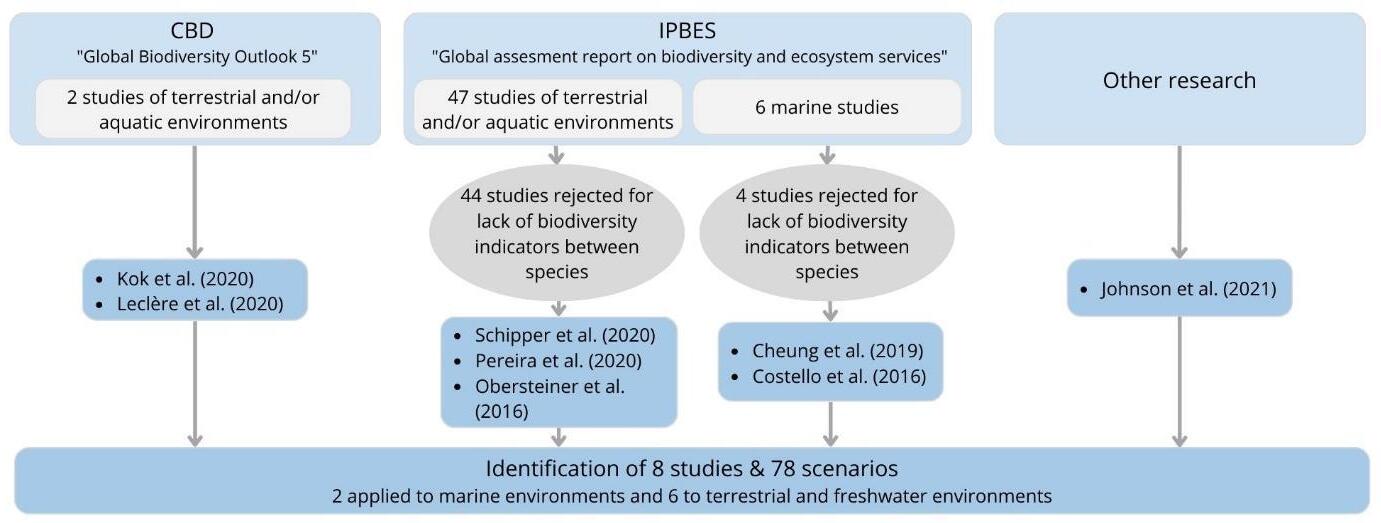
As represented in Figure 3, to identify these scenarios, we analyzed the Convention on Biological Diversity (CBD)6 report, "Global Biodiversity Outlook 5" (Hirsch et al., 2020), which describes two articles with quantitative biodiversity scenarios with global coverage for achievingtheCBD's"2050Vision"7:Koketal.(2020)andLeclèreetal.(2020).Weincludedthem in the literature review since they have global coverage and propose several biodiversity indicators.ThenweexploredtheIPBES(2019)literaturereviewofthemainterrestrial,aquatic, and marine biodiversity scenarios. The database contains 47 articles with quantitative and/or qualitative scenarios of global coverage. Among these studies, we excluded scenarios assessing only changes in biodiversity drivers (e.g., land-use changes). Instead, we chose scenarios quantifying input pressure into at least one interspecies indicator of biodiversity after the implementation of a transition scenario. Indeed, our focus is on measuring and comparing the impact of industries/sectors on biodiversity. We finally selected five articles from the IPBES report: 2 applied to marine biodiversity and 3 to terrestrialand freshwater realms
Finally, we completed this panel of scenarios with further research and gathered 8 studies and78quantitativeand globalscale scenarios
The articles selected for this review are therefore the result of a purposive sampling methodadaptedtoourqualitativeresearchbutareneithertheresultofasystematicreview northe resultofa meta-analysisofexistingbiodiversityscenarios.
6 The Convention on Biological Diversity (CBD) is a legally binding international treaty that was opened for signature on June 5, 1992, at the United Nations Conference on Environment and Development (also known as the"EarthSummit").The196signatoriescommittothreemainobjectives:toconservebiologicaldiversity,touse biological diversity sustainably, and to share the benefits arising from the use of genetic resources fairly and equitably.
7 The "2050Vision" is a world of "living in harmony with nature" by 2050, as established in the Strategic Plan for Biodiversity 2011-2020. This vision describes a world where "by 2050, biological diversity is valued, conserved, restored, and used wisely, sustaining ESs, maintaining a healthy planet, and providing essential benefits to all people".
Figure3. Flowchart reporting the process of selecting global scale quantitative biodiversity scenariosarticles
Table1. Overviewofbiodiversityscenariosarticlesselectedforthisliteraturereview
8 The type of analysis refers to the results of the modeled scenarios: in some studies, only the biophysical dynamics resulting from the implementation of a scenario are explored, and in other studies, only economic trajectories are explained. However, it is important to dissociate the modeled trajectories from the results because ascenariomayinclude, for example,GDPtrajectories butnotquantify the impactofthe scenarios on these trajectories: thisbringsus backtothe biophysicalanalysiscategory.
ARTICLE TYPEOF APPROACH NUMBEROF SCENARIOS TYPEOF ANALYSIS8 TYPEOF RISKS TYPEOF SCENARIOS MAIN ENVIRONM ENTS TIME HORIZON Koketal. (2020) N/A 5 Biophysical Transition, physical Targetseeking Terrestrial, freshwater 2030, 2050, 2070 Johnsonet al.(2021) N/A 10 Economic Transition, physical Exploratory, policyscreening, targetseeking Terrestrial 2030 Leclèreet al.(2020) Expert 7 Biophysical Transition Targetseeking Terrestrial 2050 Cheunget al.(2019) Participato ry 4 Biophysical, economic Transition Policyscreening Marine 2030, 2050, 2090 Obersteine r etal. (2016) N/A 42 Biophysical Transition Policyscreening Terrestrial 2030, 2050 Costelloet al.(2016) N/A 3 Biophysical, economic Transition Policyscreening Marine From1980 to2050 Schipperet al.(2020) N/A 3 Biophysical Transition Policyscreening Terrestrial 2050 Pereiraet al.(2020) N/A 4 Biophysical Transition, physical Policyscreening Terrestrial From1900 to2050
3. Comparison of quantitative biodiversity scenarios selected
There is no universal methodology for developing global and quantified biodiversity scenarios. However, we have identified five main steps (see Figure 4): (1) setting the conceptual framework, (2) constructing narratives, (3) quantifying parameters and assumptions,(4)quantifyingscenariosthrough thesimulationsofone or more models,and (5)analyzingtheresults. Wethus organizedthispaperaccordingly
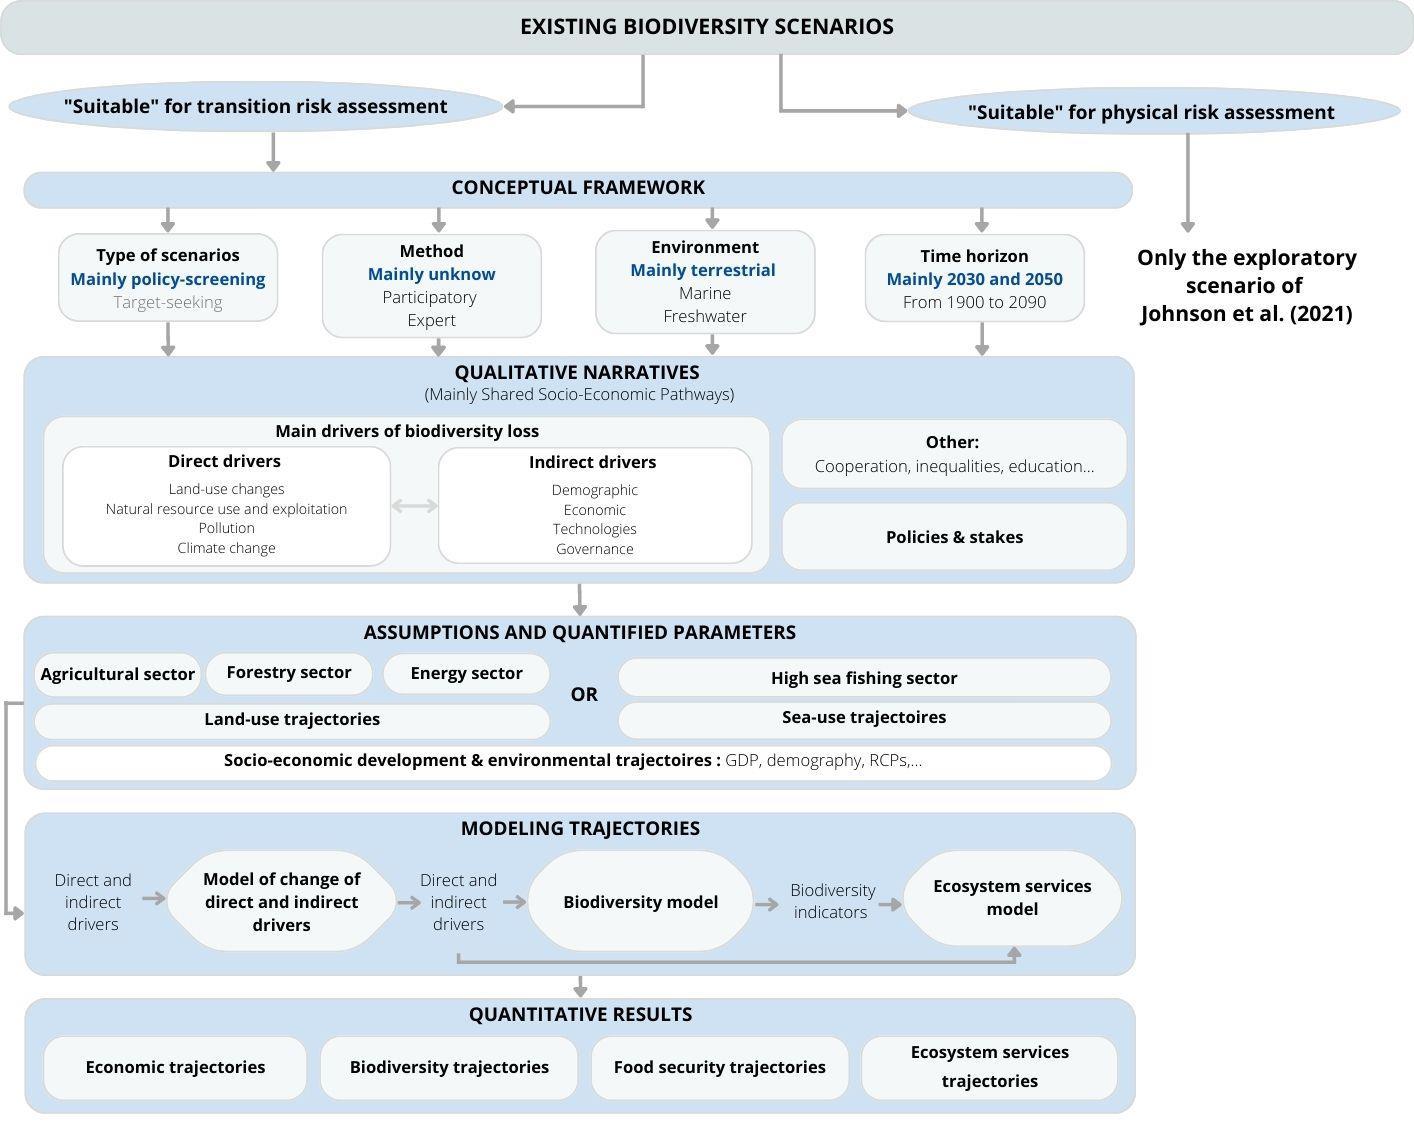 Figure4. Representationofexistingbiodiversityscenariodevelopmentprocesses
3.1 Theconceptualframework
3.1.1. The type ofscenarios
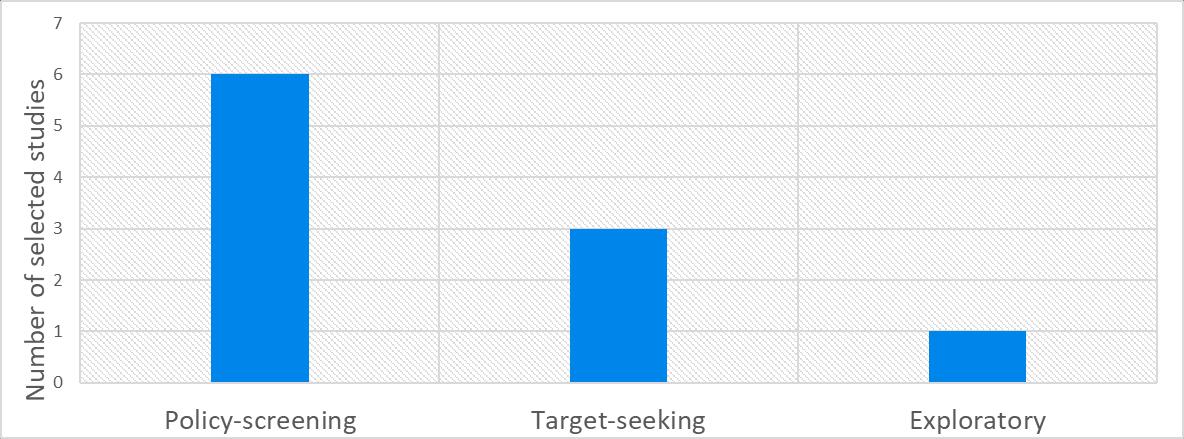
The first step in constructing a scenario is to define the research question (see Chapter 2.1).Policy-screeningand target-seekingscenarioscansimulatetheimpact ofan "ecological transition" on biodiversity or the economy. In contrast, exploratory scenarios explore the responses of the economy or the environment to a shock related to a specific modification, change, or degradation of nature. Policy-screening scenarios are the most represented among the studies identified, followed by target-seeking and exploratory scenarios(seeFigure 5).
Figure5. Type of scenarios used in the articles identified, according to the IPBES (2016) classification.Someauthorsdevelopeddifferenttypesofscenariosinthesamestudy
Target-seeking scenarios analyze the impact of a set of policies, agent behavior assumptions, or technologies to achieve one or more defined targets. To protect biodiversity,thereisnoconsensusonthesuitabletarget,unlikeclimate transitionscenarios, which mainlyuse the target of 1.5 °C(or 2 °C) of global warmingabove pre-industrial levels. It is possible, however, to use the biodiversity targets defined in the new CBD framework. Indeed, the CBD has established a strategic plan, the "Post-2020 global biodiversity framework", which proposes 21 targets to be achieved, including expending PAs to 30% by 2030, to enable the recovery of natural ecosystems and "living in harmony with nature" by 2050. For example, Kok et al. (2020) analyzed how a set of policies could achieve the CBD "2050 Vision" while ensuring food security and meeting the 2°C global warming target. Johnsonetal.(2021)exploredhowtoreachthePAexpansiontarget,andLeclèreetal.(2020) addedthe dimension of feeding the growing population while meetingthe Bonn Challenge of restoring 3.5 million km² of degraded and deforested landscapes by 2030 and more by 2050.
Policy-screening scenarios involve constructing a hypothetical narrative of transformative policies and changes, which are needed for analyzing BRFR transition shocks. Thechoiceofshocksisinfinite,andprobablyduetoalackofhistoricalbenchmarks for conservation policy and for the purpose of simplification, the policies associated with these scenarios sometimes lack realism about their feasibility and/or scientific basis. They allow,however,testingtheefficiencyofcertaininnovativeactionsinfavorofbiodiversity.For example,Costelloetal.(2016)analyzedtheimpactsofcontrastingmanagementregimeson fishbiomassandthefishingindustry(representing78%ofglobalreportedfishcatch).Oneof their scenarios requires equalizing each capture rate to the Maximum Sustainable Yield (MSY), which is the largest amount of catch extractable from a fish stock in the long-term and,onaverage,underexistingenvironmentalconditionsandwithoutsignificantlyaffecting the reproductive process. This scenario is rather indicative, as it does not provide information onthe implementationofthese managementregimes.
We identify only one scenario suitable to analyze physical shocks, the exploratory scenario of Johnson et al. (2021) It corresponds to a narrative where biodiversity tipping points are crossed. Indeed, they analyzed how the partial decline of three ESs (pollination, marine production, and timber production) would affect the economy. The study does not specifythe nature ofthe shockthatwouldleadto such degradation, probablybecause itis challenging to explain scientifically the causes, the likelihood of triggering the collapse or regimeshiftofES anditsmagnitude (Turneret al.,2020).
Foreachtypeofresearchquestion,itisadvisabletoexploredifferentpossiblenarratives and thus not be limited to a single scenario because the future is unknown. For instance, Obersteiner et al. (2016) generated 42 scenarios by combining several policies with climate trajectories, see Table 1 The advantage of this method is uncertainty transparency; nevertheless, the main risk is losing the coherence of the stories behind the scenarios. The authors ofthisliterature review developedbetween3and10 scenariosin the otherarticles.
3.1.2. The method toconstructscenarios
The identified articles were mainly written by research institutes, including the Netherlands Environmental Assessment Agency (PBL)9 , involvedin Kok et al. (2020), Schipper et al. (2020), andtoalesserextentinPereiraetal.(2020),Obersteineretal.(2016)andLeclèreetal.(2020). Another research center widely represented in the selected studies is the International Institute forAppliedSystemsAnalysis(IIASA)10.Some co-authors neverthelessare fromnongovernmental organizations such as WWF, BirdLife, Wildlife Conservation Society (Leclère et
9 TheNetherlandsEnvironmentalAssessmentAgency(PlanBureau voordeLeefomgeving -PBL) is the Dutch institute for strategic policy analysis in the fields of environment, nature, and spatial planning. It contributes to improving the quality of policy and administrative decisions by conducting prospective studies, analyses, and assessments.
10 The International Institute for Applied Systems Analysis (IIASA) is an international research institute that advances systems analysis and applies its research methods to identify policy solutions toreduce the human footprint,improvetheresilienceofnaturalandsocio-economicsystems,andcontributetotheachievementof the SustainableDevelopmentGoals.
al., 2020), or the Environmental Defense Fund (Costello et al., 2016). Finally, we identified only onefinancialinstitution,theWorldBank,whichisthesourceoftheJohnsonetal.(2021)study.
The type of approach used to develop scenarios (participatory or expert approach) is rarely specified in the articles selected for this literature review. It does imply that scenarios were not developed with the participation of actors with diverse backgrounds, experiences, and knowledge, given the varied origins of the co-authors. Nevertheless, if no informationisgiveninthearticle,wecannotknowwhichauthorsparticipatedin developing the scenario narrative. Only Cheung et al. (2019) expressed their choice in this matter; they optedfortheparticipatorymethod.Inaworkshop,theybrought18professionalswithvaried experiences: fisheries managers, marine ecologists, fisheries scientists, socio-ecological researchers, economists, marine geospatial scientists, high seas policy advisors, and fisheries policy and governance specialists. Participants were asked to describe their perceptions of future environmental, management, economic, governance, and social projections for high seas fisheries for three Shared Socio-economic Pathways (SSPs) (see Chapter3.2)andpoliciesdedicatedtothesector.The authorsusedthisinformationtobuild their scenarios. Participatory scenario analysis often reveals trade-offs and conflicts between different sectors and communities when identifying pathways to achieve MPA objectives (Daw et al., 2012). They are a good approach for mitigating uncertainties around futuretrajectoriesandsimultaneouslyintegratingdifferentstakeholderpriorities.
3.1.3. The environment
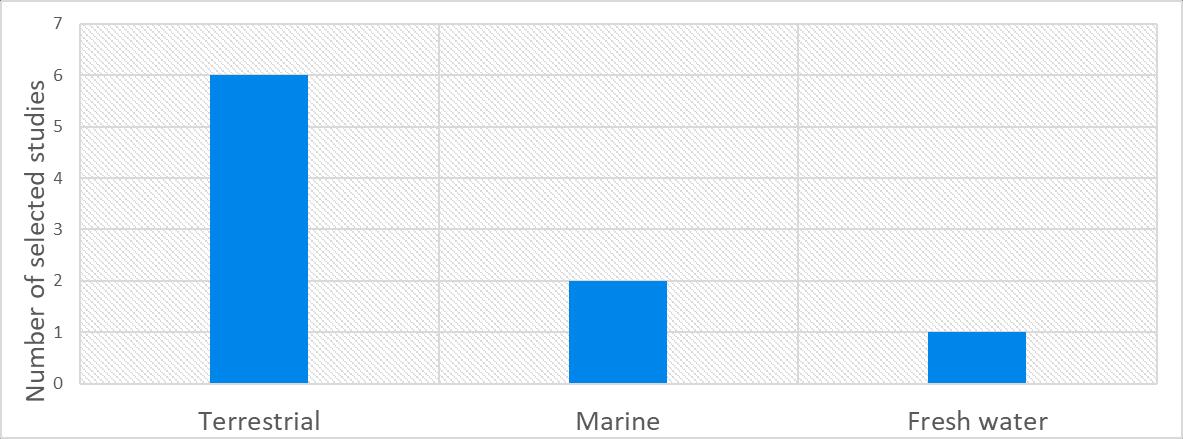
Thescenariossurveyedaremainlyterrestrial,tothedetrimentoffreshwaterandmarine environments (see Figure 6); only one freshwater and two marine scenarios met our criteria (see Chapter 2.3). The biological diversity of marine environments, however, is potentially considerable, particularly in terms of species richness11: Marine scientists estimate that there are between 300,000 and 10 million marine species for only 150,000 to 274,000knownspecies (Appeltanset al.,2012). Thelackofdata onspeciesdistributionpartly explainsthe poorknowledgeof these ecosystemsandthusleadstotheabsence of marine scenarios.
Although representing a biodiversity sink, marine environments are being degraded at an unprecedented rate: nearly 33% of reef-forming corals, sharks, and shark-related species, andmorethan33%ofmarinemammalsarethreatenedwithextinction(Brondizioetal.,2019). Globally, direct exploitation of marine organisms (e.g., fishing activities) and land-/sea-use changeoverthepast50yearshavecausedthelargestbiodiversitydeclineandaccelerated climate change driver (Brondizio et al., 2019). In addition, the loss of marine biodiversity weakens the ocean ecosystem and its ability to withstand disturbances, adapt to climate change, andplayitsrole asaglobalecologicalandclimateregulator.
Underrepresenting the future trajectories of marine biodiversity and associated ESs, as well asthepoliciesformanagingandconservingtheseecosystems,tendstounderestimatethe impact of their degradation on socio-economic indicators and, thus also on the financial
11 Speciesrichnessisameasureofthebiodiversityofallorpartofanecosystem;itreferstothenumberofspecies withinagivenarea.
systems.Indeed,thefisheriessectorhighlydependsontheESoffishproduction,contributing to0.5to2.5%ofglobalGDP.Nevertheless,insomecountries,suchasMauritaniaandVietnam, theaquacultureandfisheriessectorrepresents10%oftheirGDP(MartiniandLindberg,2013). Additionally, many nations depend on fish as their main food and livelihood source. The biggest nutritional reliance on fish and marine environments is seen in West African and SoutheastAsiancountries,particularlythe PhilippinesandIndonesia(Tehet al.,2017).
The most comprehensive marine scenarios for analyzing the impact of possible future trajectories through conservation policies and socio-economic pathway variation with anassessmentofenvironmentalandsocio-economicimpactsarethoseofCheungetal. (2019). The authors assessed the consequences of these trajectories for the high-sea fish sector.Also,throughthefisheriessector,Costelloetal.(2016)assessedthestatus,trends,and outcome ofrecoverypoliciesfor4,713 fisheriesworldwide.
Koketal.(2020)evaluatedtheimpactofambitiousbiodiversityconservationpoliciesonthe integrity12 of freshwater environments for two aquatic ESs: natural water purification measured by the reduction in the proportion of water bodies with excessive nutrient concentrationsandlakehealth,whichrepresentstheproportionoflakesmeetingtheworld healthorganizationstandardsforharmfulalgal blooms.
3.1.4. The time horizonofscenarioprojections
INSPIRE & NGFS (2022) estimate that BRFRs may emerge sooner than CRFRs, generally consideredtobelong-term.Inaddition,physicalshockstendtooccurearlierthantransition shocks, which depend on policy announcements regarding conservation targets whose effectsare spread over time.Itis thus important tochoose the appropriate time horizon for thedifferentfuturetrajectoriesanalyzed
12 Ecosystemintegrityisgenerallyusedtorefertothecompletenessandfunctionalityofanecosystem.Whenwe usethetermecosystemintegrity(orintegrity),werefertothecompletenessandfunctionalityofanecosystem anditsecologicalprocesses,particularlyconcerningitsnaturalstate.
Figure6. Numberofstudiesthathavedevelopedscenariosadaptedtoterrestrial,freshwater, and marineenvironments. Somestudies haveanalyzed two different environments atthesametime.
Indeed, according to studies used for assessing biodiversity transition risks, the future horizons chosen are between the present and 2090, with a strong representation of projections for 2030 and 2050. Indeed scenario horizons are aligned with the CBD's "Post2020 global biodiversity framework", which gives targets and time horizons for these two years:2030beingthe horizontargettohaltbiodiversityloss,and2050beingthe onetostart recording a net positive increase (recovery) in biodiversity. Some articles, such as Kok et al. (2020)andLeclèreetal.(2020),alsoassessedtheimpactoftheirscenariosfor2070and2090 respectively,whichare horizonsbeyondthe“2050Vision”.Moreover,Pereiraetal.(2020)and Costello et al. (2016) also evaluated past trends in environmental and socio-economic trajectoriessince1900and1980respectively.
Some authors do not explain their time horizon choice (Costello et al., 2016; Schipper et al., 2020), and others aligned their scenarios with the Sustainable Development Goals (SDGs), which have a time horizon of 2030 (Cheung et al., 2019;Obersteiner et al., 2016).Forexample, Obersteiner et al. (2016) analyzed sets of policies that correspond to different SDG targets such as energy and climate policies (SDG 7 clean and affordable energy, SDG 13 measures to address climate change, and SDG 14 aquatic life), or biodiversity conservation policies (SDG14aquaticlife andSDG15terrestriallife).
Itshouldbenotedthatscenarioassumptionshavedifferenttimehorizonsthanscenario projections.Forexample,Leclèreetal.(2020) projectedtheir scenariosto2090, butsome of theirassumptions have a much closer time horizon. For example, one suchassumption is a 50% linear total waste reduction by 2050. The time horizon of the assumptions is very importantbecause apolicywill nothave the same impactifitisimplementedinthe short-, medium-, or long-term. Their choice has to deal with the fact that natural resource conservation policies are cheaper and simpler than restoration because they avoid potential tipping points and difficulties associated with regime shifts and maintain option values13 byprotectingecosystemsandspecies(Dasgupta,2021).
Moreover,themagnitudeofthepressuresthat havethegreatestimpactonbiodiversity will be different in the future. Indeed, pollution and climate change are factors that could become more problematic in a few years than land and sea use changes (Millennium Ecosystem Assessment, 2005; Brondizio et al, 2019). Furthermore, if a policy aiming at reducingland-usepressureisimplementedwithtoolongatimehorizon,thepolicymaynot beadaptedtothe biodiversityissues ofthe future.
13 The optionvalue reflects the willingness to pay to keep an alternative (an option) available for possible use in the future.
3.2 Thescenario(qualitative)narratives
Once the conceptual framework is established, the next step is to create or select the scenario narratives(i.e.,storylines); describing the possibleevolution oftheworld given a specified context. These narratives can explore qualitative socio-economic pathways, policies, technological changes, agent preferences/behavior shifts, and assumptions on naturalresourceconditions,i.e.,changesindirectandindirectdrivers of biodiversityloss.
Almost all of the authors in this literature review used Shared Socio-economic Pathway (SSP) narratives, sometimes complemented with other narratives, except Kok et al. (2020),Johnsonetal.(2021),andCostelloetal.(2016),whodidnotspecifytheirchoice.SSPs are qualitative scenarios that describe possible socio-economic development trends (e.g., GDPgrowth,demography,technology, and governance) (O'Neilletal.,2014and2017;Riahiet al., 2017). SSPs were created to define a common research framework on global warming issuesandthusfacilitatetheproductionofintegratedassessmentsbasedoncombinations of climate model projections, socio-economic conditions, and assumptions about mitigation and adaptation policies. It is important to note that these narratives do not address either climate (or biodiversity) policies or the consequences of climate change (or biodiversity loss). These trajectories are intended to be coupled with policies that may, for example, aim to achieve radiative forcing targets (Vuuren et al., 2013) or ecosystem protection.Indeed,inthecontextofbiodiversityscenario,theycanprovidestorylinesforthe main drivers of indirect biodiversity loss (i.e., demography, economy, governance, and technology) and main direct drivers (i.e., land-use changes, natural resource use and exploitation,climate change, andpollution) Forthelatter, itis noted that theintroduction of invasive speciesis alwaysabsent
SSPs are composed of five specific narratives describing different worlds in terms of socio-economic development with a horizon of at least 2100. These trajectories explore uncertainties regarding mitigation and adaptation challenges associated with different climates and socio-economic futures. They thus describe the conditions that will make it more or less difficult for countries to manage a transition to a low-carbon economy rather thananecologicaltransition(see Figure 7).
SSPswerepurposelyconstructedinoddnumberstoavoidtheriskofusingonetrajectoryas abaseline(alsoknownas"business-as-usual")(Koketal.,2017).However,inlightofuserdrift, the designers agreed on a "central" path, the SSP2, although it does not represent the most likely pathway (Fricko et al., 2017).Original SSP narratives are available in O’Neill et al. (2017) andtheland-use-relatednarrativesin(Poppet al.,2017),whileasummaryisavailableinthe Appendix 1.
Most authors have relied solely on SSPs for their narrative, even though they do not incorporate the specifics of ecosystem dynamics due to their design for assessing climatechangemitigationandadaptationchallenges.

Alternatively, Cheunget al.(2019)developedthreefisheries narrativesthatcomplementthe SSP1, SSP3,andSSP5storylines,mostmodeled in theliterature.Thisapproachallowsthemto startfromaconceptualframeworkwidelyusedintheliteratureandaddspecificitiesrelated tothehigh-seafishingsector,suchaschangesinagentconsumptionormarinebiodiversity protectionpolicies(see Appendix2formoredetails)
Kok et al. (2020) constructed their storylines without qualitatively specifying the socioeconomic contexts in which they are embedded. They thus developed two scenarios that describe different goals in terms of biodiversity conservation objectives. The first promotes a “land sparing” approach to protect the intrinsic values of nature, while the second has a “land sharing” vision where ESs play a central role in decision-making (see Appendix 3 for more details)14 .
14 While a landsharing systemcontains apatchworkoflow-intensity agriculturecontainingnatural features like ponds and hedgerows, rather than keeping agriculture and wilderness separate, a land sparing system requiressubstantial,separateareasofsustainablyintensifiedagriculture andwildness.
Figure7. SSPsmappedinthemitigationandadaptationchallengespace (adaptedfromO'Neilletal.,2014)
3.3 Assumptionsandquantifiedparameters
3.3.1 QuantificationoftheSharedSocio-economicPathways(SSPs)andtheRepresentative ConcentrationPathways(RCPs)
Once a scenario narrative is complete, it can be transformed into quantitative trajectories usingmodels Indeed,thestorylineisoftentranslatedintoaquantitativescenario,specifying values for several model parameters. The model will also need other quantitative hypotheses to fix values of the parameters that do not belong to the specified scenario. However, moving from qualitative to quantitative scenarios often means that some dynamicsare notmeasurableornoteasilyaccounted for.
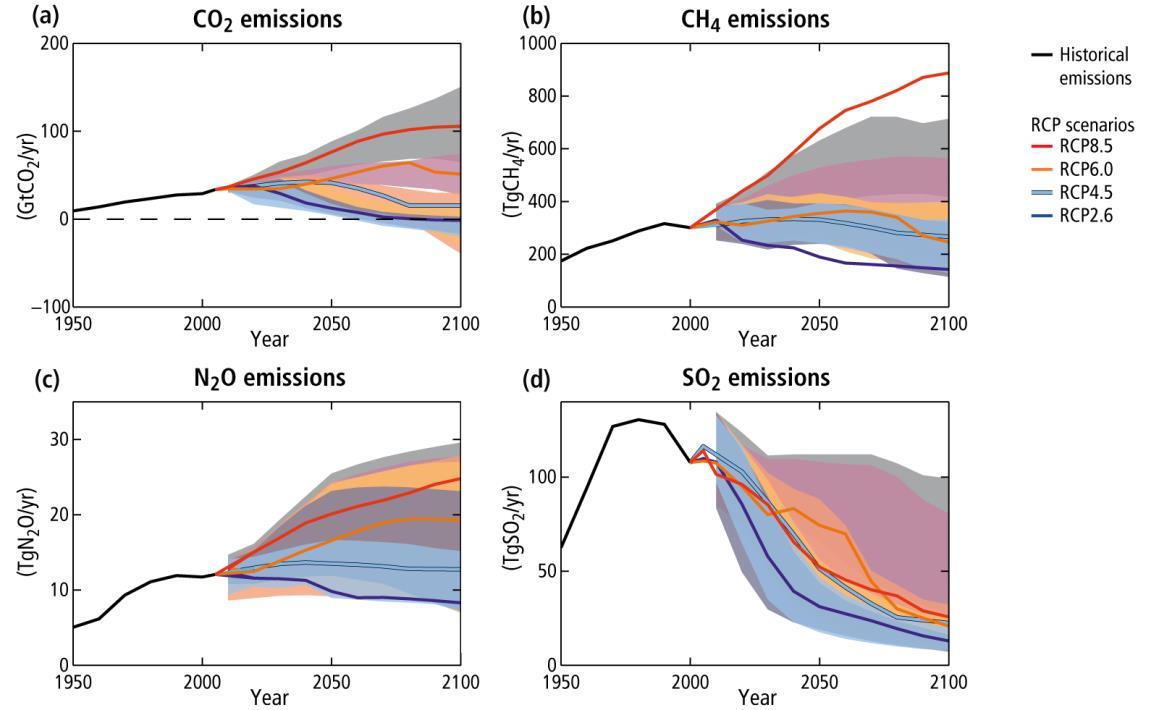
Almost all studies used quantification of GDP and population trajectories (at least) from SSPs, with the exception of Costello et al. (2016). Many of them also coupled the SSP assumptions with one or more Representative Concentration Pathways (RCPs) that describefutureGHGconcentrationfordifferentclimatescenariosuntil2300(VanVuuren etal.,2011)(seeFigure8).
Figure8
Emission scenarios and the resulting radiative forcing levels for the RepresentativeConcentrationPathways.Panelsatodshowtheemissionsof carbondioxide (CO2), methane(CH4), nitrous oxide(N2O) andsulfur dioxide (SO2).(fromPachauri&Meyer,2)
For the computation of GDP trajectories of SSP, the Organization for Economic Cooperation and Development (OECD), the Potsdam Institute for Climate Impact Research (PIK),andtheIIASAhavedevelopeddifferentmethods15.TheOECDapproach,however,is the most widely used when extracting SSP data (see below) However, nothing prevents researchers from testing the sensitivity of their scenarios with the other computational methods.
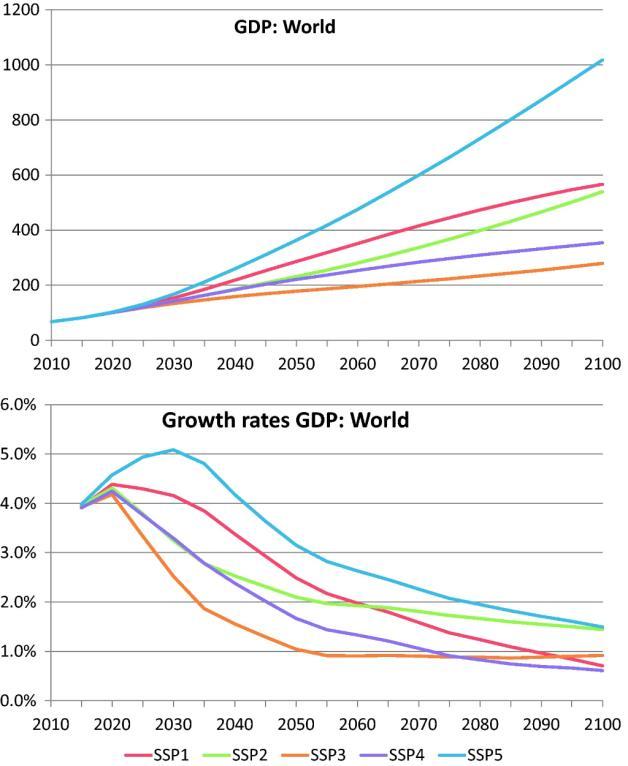
GDP trajectories are assumed to be positive for every country even though the scenario envisaged proposes a major structural change (either an ecological transition or a collapse of biodiversity) which should impact long-term growth. Indeed, the OECD used the "ENV-Growth" model (Dellink et al., 2017) to attribute an economic growth path for each country per SSPs. It is an augmented version of the Solow growth model. It relies on several growth factors (e.g., physical capital, labor capital, and energy demand) but does not include natural resources and land-use other than crude oil and natural gas. It means, for example,thatifnolandisavailabletoexpandagriculture,theoutputand/orvalueaddedto the sector will not be impacted. The model is based on historical data from the OECD and the international monetary fund (from 2012 to 2017) and uses the assumption of conditional convergence. This means that from the first year of the projection, the GDPs of the least developed countries will increase more rapidly than those of the developed countries to converge towards the same values (catch-up effect). As a result, the GDPs of all countries will increase at least until 2100 (total and per capita), and the annual growth rate of aggregate GDP is expected to stagnate or decline for all SSPs from 2030 to 2100 (see Figure 9).Itislikely,however,thatthedramaticchangesindirectandindirectdriversofbiodiversity loss and mitigation policies implied by the scenarios will result in a decrease in global GDP, oratleastforsomecountriesthatfailtoadapttotheecologicaltransitionorthebiodiversity collapse.
15 The International Institute for AppliedSystemsAnalysis(IIASA). https://tntcat.iiasa.ac.at/SspDb/dsd?Action=htmlpage&page=about
Figure9. Global GDP (trillion 2005 dollars) and income levels (thousand 2005 dollars) for the five SSPs and associated average annual growth ratesover 5 years (%/year) (from Dellink et al.,2017).
AllSSPtrajectoriesconsiderpositiveeconomicgrowth(O'Neilletal.,2017)forallcountries in the long run, which leaves no room for exploring trajectories with low, zero, and negative growth (Kim et al., 2018) that could emanate from conservation strategies or simplytheconsequencesofgeopoliticalandenvironmentalbarriers. The onlyattemptto recast SSPs by coupling biodiversity loss to economic growth, i.e., by incorporating the possibilityoflimitedgrowthduetonaturalresourcedegradation,isthatofOteroetal.(2020). However, these storylineshave neverbeenquantified.
The SSP demographic trajectories are computed given future assumptions of fertility, mortality,migration,andeducation(KC&Lutz,2017).AccordingtoIIASA(KC,2020),in2100,the population is expected to decrease slightly for SSP1 and SSP5, reaching about 7.2 billion instead of 9.5 billion for SSP2 and SSP4. The largest increase is expected for SSP3, with 13.6 billionpeople.Forcomparison,thelatestworldpopulationprojectionsfor2100areestimated at10.4billion(UN, 2022).
The most common models used to detail SSP trajectories at the sectorial level are integrated assessment models (IAMs) such as AIM (National Institute of Environmental Studies;Fujimorietal.,2014and2016),GCAM(NationalInstituteofEnvironmentalStudies;Wise etal.,2014),IMAGE(PBL;Stehfestetal.,2014),MESSAGE-GLOBIOM(IIASA;Kindermannetal.,2006; Havlíketal.,2014;Riahietal.,2012),REMIND/MAgPIE(NationalInstituteofEnvironmentalStudies; Poppetal.,2011and2014),andWITCH(EuropeanInstituteonEconomicsandtheEnvironment, Riahietal.,2021).IAMsandclimatemodelscantranslatecombinationsofSSPsandRCPsinto
land-use change and climate change projections. Subsequently, biodiversity and ecosystem service modelscan beused totranslate these changesinto impacts on nature, seesection3.4.1formoredetails
3.3.2 Additionalquantitative trajectories relatedtobiodiversity
OntopofSSPtrajectories,mostauthorsaddedvariouspathways,political/behaviorshifts,or collapse assumptions; they incorporated strategies for biodiversity conservation, ecosystemrestoration, foodsecurity,orglobalwarmingmitigation.Someauthors, however, didnotnecessarilycoupleSSPwithbiodiversityconservationpoliciesandonlylookedatthe impactofSSPonbiodiversity(Schipperetal.,2020;Pereiraetal.,2020).Alltheseassumptions andquantifiedparametersare mostlyembeddedinthefollowingsectorsorareasoffocus.
● The agriculturalsector
Theagriculturalsectoriscrucialinthedevelopmentofbiodiversityscenariosasitisone of the main pressure factors driving land-use change, with more than a third of the world's land area and nearly three quarters of the world's water resources devoted to livestockandcropproduction(Brondizioetal,2019).
Thetrajectoriesattributedtothissectoraremainlysupply-side,andtrajectoriesrelated totheagriculturalsectorproductivityarethemostwidelymodeled.
In the baseline scenario of Leclère et al. (2020), agricultural productivity is supposed to increase by 60% by 2100 (under the SSP2 pathway), and global demand for land-based production by more than 70% over the century. In their supply-side policies pathway, crop yields follow the SSP1 scenario, and land productivity in developing countries rapidly convergestothelevelofdevelopedcountries.Forexample,intheirmostambitiousscenario (in terms of efforts to reverse biodiversity trends), productivity increases by 34% to 63%, dependingontheIAMforthe2010-2050period.Adversely,Johnsonetal.(2021)simulatedthe effect of a 90% reduction in wild pollination sufficiency 16 on agricultural yields (i.e., partial collapseofpollinatorESs)onlyforcropsthatare dependent onwildpollination.
In the baseline scenario of Kok et al. (2020), an extension of the current land-use pattern is simulated. When the baseline is coupledwithadditional climate change mitigation, hunger elimination, and agricultural and energy system changes, productivity and nutrient use efficiency increase in line with the FAO agricultural outlook and future GDP projections (Doelman et al., 2018). In the "Half-Earth" scenario, agriculture is separated from natural areas. When additional measures are added to this scenario, crop yields increase by 20% compared to the baseline (in line with SSP1) (Doelman et al., 2018). Irrigation efficiency increasesby0.1%peryearforallirrigatedareas,andfertilizeruseefficiencyis20%higherthan inthebaselinescenario;nevertheless,efficiencydecreasesincountrieswithnutrientmining Alternatively, the "Sharing the Planet" scenario proposes a combination of agriculture and natural habitat patches via agroforestry in tropical biomes and mixed cropland-nature patterns (70/30) in temperate biomes. When additional measures are added, productivity
16 Wildpollinatorsufficiencycorrespondstothe amount ofpollinator-friendlyhabitataroundfarmlands
increases moderately (10% higher than in the baseline scenario). Irrigation and fertilizer use efficiency follow similar trajectories to the "Half-Earth" scenario. Neither Leclère et al. (2020) nor Kok et al. (2020) mention which crops will be affected by these productivity increases andinwhatproportion. Moreover, the SSP1trajectories imply, among other things, thatSubSaharan Africa will double its crop yields between 2010 and 2050, which will require a lot of investment and innovation and be constrained by climate change's impact on crop productivity(Rosenzweiget al.,2013).
In addition, Obersteiner et al. (2016) calculated productivity trajectories for different crops and livestock products as a function of countries and SSP trajectories, based on an econometricanalysisofthehistoricalcorrelationbetweenGDPpercapitaandgrowthrates of crop and livestock productivities. Indeed, they assumed a "yield increase" of 30% or 50% withoutadditionalinputs(i.e.,fertilizerorwaste).Theproductivityincreaseisthelargestofall the studies; for example, in the SSP1 scenario, crop productivity in Latin America, Africa, and theMiddleEastwillincreaseby153%or173%between2010and2050,dependingonthepolicy adopted. As a result, these countries would then need to invest heavily in research and developmenttoachievethese trajectories.
In addition to these trajectories, authors quantify policies related to agricultural subsidies. Indeed, it is estimated that governments spend at least $500 billion per year on fiscal support to agricultural, forestry, and fisheries producers (including fossil fuels support), which is potentially harmful to biodiversity (OECD, 2020b). For example, in 2017, OECD countries paid $228 billion to support farmers, of which $116 billion is considered harmful to biodiversity (OECD, 2020a). Johnson et al. (2021) quantified the removal of all subsidies from theagriculturalsectorinfavorofasystemoflump-sumtransferstofarmers.Inaddition,one of their scenarios simulates the implementation of an R&D policy for the agricultural sector by removing all subsidies from agriculture and allocating these "savings": 20% are invested in R&D, and 80% become lump-sum transfers for landowners. Nevertheless, to quantify this path, the authors only adjusted ex-post GDP by an amount equivalent to the annualized estimate of R&D expendituresin 2030 instead of quantifying the impact of an R&D policy on theeconomy.ThemainreasonisthattheirgeneralequilibriummodeldoesnotconsiderR&D asasectoror acostlyexpenditure.
Koketal (2020)quantifiedtheintroductionofa10%importtaxonallagriculturalproductsby 2050. Once again, this policy requires the cooperation of all countries and raises questions aboutimplementingthismeasureindevelopingcountries.
● Somedemand-sidepoliciesareneverthelessmodeled.Theyarerelatedtochangesin food systems production, such as reducing food losses (from harvesting, processing, distribution, and final household consumption) and changes in the consumption of animal products. In Kok et al. (2020) and Leclère et al. (2020), the baseline scenario projects current levels of food loss (equivalent to the implementation of the SSP2 trajectory). The more ambitioustrajectories propose a50% reductionin currentfoodloss by2050relativetothe baselinescenario.These authors havealsosimulateddietshiftsin animal products and, as for food losses, their baseline scenario projects the current trends. In their most ambitiousscenarios, animal calorie consumption is reducedby 50%
comparedtothebaselinetrajectory.Nevertheless,thistrajectory isappliedtoallregions except those with low incomes and levels of animal calorie intake (North Africa, West Africa, East Africa, rest of South Africa, India, rest of South Asia, and Indonesia). Similarly, Obersteineretal.(2016)projectedtwodifferentdiettrajectories:meatdemandincreases in developed and developing countries or increases in developing economies but decreasesindeveloped regions.
● Land-usetrajectories
ExpansionofPAsis the mostwidelymodeled biodiversityconservationpolicy. A flagship measure of the CBD is the protection and conservation of species habitats through the expansion of PAs and Other Effective area-based Conservation Measures (OECMs)17 to protect at least 30% of the terrestrial and marine surface by 2030. In the "Post-2020 Biodiversity Framework", the CBD includes the need to select these areas based on their importance tobiodiversityandtheircontributiontopeoplesothatconservationiseffective andequitable. Currently, PAsandOECMscover only17% ofthe world'slandandinland water surface but depending on the country, the proportion can vary from 1% to 50%18 . It is worth noting here that the surface area parameter does not seem to be sufficient to act on land use pressures, since the effectiveness of current protected areas is often questioned in termsofbiodiversityoutcomes (Geldmannet al., 2019).
However, because no consensus exists globally on what percentage of land should be regulatedandwhere,researchersmaketheirowndecision,guidedbyexistingliterature anddesiredoutcomes.Forexample,Waldronetal.(2020)established20differentscenarios, intermsofPAsallocation,forconserving30%oftheplanet:somefocusonproduction,others on biodiversity conservation, and the rest represent a trade-off between the two (Table 2). Furthermore, within these three objectives, it is possible to allocate land differently dependingonthebiodiversityindicatorsanddatabasesused.
17 An Other Effective area-based Conservation Measure (OECM) represents "a geographically defined area other than a PA, whichisgovernedandmanagedinwaysthatachievepositiveandsustainedlong-termoutcomesforthein-situconservation ofbiodiversity,withassociatedecosystemfunctionsandservicesandwhereapplicable,cultural,spiritual,socio-economic,and otherlocallyrelevantvalues" (Definitionagreedatthe14th Conferenceof Parties ofthe CBDin2018).
18 Protected Planet https://www.protectedplanet.net/en
Tableau2. Waldron et al. (2020) scenarios for achieving the 30% land and/or sea area conservationtarget(adaptedfromWaldronetal.,2020).
T=terrestrialrealm,M=marinerealm.
REALM CATEGORY NAME DESCRIPTION
T Non-PAexpansion baseline
M Non-PAexpansion baseline
Reference Scenario(REF)
Reference Scenario(REF)
T Productionfocused Three Conditions (THC)
T Productionfocused HarshPolitical Reality(HPR)
Thecounterfactualforcomparisonofnotexpandingprotected areaspost-2020.Maintaintheprotectedareaestateatitscurrent coverage(as ofJuly2019).
Thecounterfactualforcomparisonofnotexpandingprotected areaspost-2020.Maintainthemarine protectedareaestateatits currentcoverage(asofJuly2019).
Protectall globalhabitatthatretainsastateofminimalhuman intervention(‘wilderness’),plusexistingPAs
Firstdisqualify fromprotectionanyareaneededfor agricultural productionupto2050,thenchoosetheareasofnon-disqualified landthatoptimallyminimizesglobalspeciesextinctions(plus existingPAs).
M Productionfocused HarshPolitical RealityMarine (HPR)
T Biodiversityfocused (hybrid)
Biodiversity/ Wilderness consensus(BIWI)
Marinereservesarenotallowedonanyareasofoceanthatare currentlyhigh-valuefishinggrounds.TheexistingMPAsystemis thenexpandedtothe next-bestsetofoceansitestopreserve marine biodiversity
"Protectall wilderness,KBAs19 andexistingPAs,plustheoptimalset ofallothersitesneededtomaintainglobalspeciesviabilities (basedonminimumrangecoverage).NB43%terrestrialcoverage, compensatedbylowercoverageinthe pairedmarinescenario
M Biodiversityfocused (hybrid)
T Biodiversity/ Production Compromise (BPC)
M Biodiversity/ Production Compromise
M Biodiversity/ Production Compromise
Biodiversity/ Wilderness consensus(BIWI)
Biodiversity/ Production Compromise
All existingMPAs andmarine wildernesses areprotected,thenthe optimalset ofareas neededtopreventmarinebiodiversitydecline (NBcover26%ofmarineglobalarea)
Add~5%moreofthelandsurfacetotheexistingPAnetwork(upto 20%planetary land),choosingsites tooptimallyreduceglobal speciesextinctions.Theremaining10%ofnewPAsarenotallowed togoonpotentialagriculturalland,butareplacedinthenext-best setofsitesinstead(usingthesamecriteria)
50:50EEZ (5050EEZ)
ExpandtheexistingMPAsystemtothe30%ofoceanthatoptimally reduce globalspeciesextinctions,but50%oftheprotectedarea inside ExclusiveEconomicZonespermitssustainablefishing,while the other50%bansalleconomic activity
50:50Coastal (5050COAST)
T Biodiversityfocused SaveSpecies fromExtinction (SSE)
ExpandtheexistingMPAsystemtothe30%ofoceanthatoptimally reduce globalspeciesextinctions,but50%oftheprotectedarea immediately adjacenttocoasts(wheresmallscalefisheriestend tooperate) permitssustainable fishing, whilethe other50%bans alleconomic activity
ExpandtheexistingPAsystemtothe30%oflandthatoptimally reduce globalspeciesextinctions
T Biodiversityfocused GlobalDealfor Nature (GDN) Conserveawiderange ofsitesthathavebiodiversityimportance under differentcriteria, includingcurrentPAs,siteswithrareor endemicspecies, areas neededforwide-rangingmammals,etc.
M Biodiversityfocused Top30(TOP30) ExpandtheexistingMPAsystemtothe30%ofoceanthatoptimally reduce globalspeciesextinctions
In addition, establishing a PA network and implementing an effective management system is costly, as it can include monitoring habitat health, enforcing regulations, and investing in research fees. Such costs are however rarely taken into account in the scenarios. Management is fundamental for preventing illegal activities in PAs, such as logging, poaching ofprotectedanimals, mining, andencroachmentbyhumansettlements and agriculture. Waldron et al. (2020) estimated that achieving the protection of 30% of the world'slandsandoceanswouldrequire anaverageannualinvestmentofabout$140billion by 2030. Johnson et al. (2021) estimated this cost at $115 billion, but if the benefit of avoided carbon emissions is considered, it is reduced to $13 billion. The world currently invests just over$24billionperyearinPAs(thebulkofthisamountcomesfromupper-middleandhighincome countries' national PA budgets). The necessary investment increase will likely be largely financed by the poorest and middle-income countries, as they have the richest biodiversity territories, requiring money transfers and cooperation between countries. However, shifting financial flows away from biodiversity-negative outcomes and toward biodiversity-positive outcomes can lower the pressures on biodiversity and the costs of theseland-use trajectories.
Nevertheless, PAs offer economic and social benefits and mitigate climate change's economic risks. However, only some countries will have the capacity to capture these economicbenefits,particularlyintermsoftourismdevelopment(Waldronetal.,2020).
At a local scale, equity and justice issues need to be considered. More than half of high conservation value lands are traditionally owned, used, or occupied by indigenous peoples andlocal communities, whoare the de facto managers (Brondizioet al., 2019). Puttingthese areas under protection can also affect the actors who use the resources as a livelihood or valuethemculturally.Attheglobalscale,itisnoteasytoconsideralltheseaspects,butwhat is essential to keep in mind is that depending on the scenarios and the choice of land allocation, futuresocio-economic andhumanwell-beingtrajectorieswillbedifferent.
Moreover, in the articles, the type of protection envisaged in PAs and whether or not humanactivitiescanbedevelopedwithinthemissometimesunclear.Indeed,thetypeof activity authorized within the PAs will not have the same impact on the degradation of biodiversity; it is thus necessary to dissociate the recreational activities of walking or gatheringnon-timberforestproducts,forexample,fromsilviculturalactivities.
In their baseline scenario, Kok et al. (2020) limited PAs to the Aichi target of protecting 17% of the land area. They also added the possibility of urban expansion as population and urbanizationincrease(basedonKleinGoldewijketal.,2011).
Alternatively, their "Sharing the Planet" and "Half-Earth" scenarios describe worlds where respectively,30%(seeFigure10)and50%(seeFigure11)oftheEarthwillbecomeregulatedby PAsby2050.
Specifically, in the "Sharing the Planet" scenario, high-carbon forests, riparian areas, water retention areas, peatlands, urban green spaces, and key biodiversity areas are added to currentPAstocover30%oftheEarth'splanetby2050.Expansionofurbandevelopmentand agricultureisnotallowedinconservationareas.Inaddition,aroundlarge(300mbuffer)and medium (150 m buffer) rivers, buffer zones of natural vegetation are created to reduce nutrientloadingtothewater.OnlyKoket al.(2020) considered theimpactofhumanactivity around PAs in the allocation of land to be protected. Finally, urban expansion trajectories followthebaselinescenario,butnoexpansionisallowedinareasidentifiedforconservation, includingexistingurbangreenspace.
In the "Half-Earth" scenario, PAs are expanded to cover at least 50% of all terrestrial and freshwater ecoregions by 2050. Encroaching activities are reduced over time. Urban development and agricultural expansion are not allowed in conservation areas, and urban expansionfollowsbaselinetrajectories inthe restofthe world.
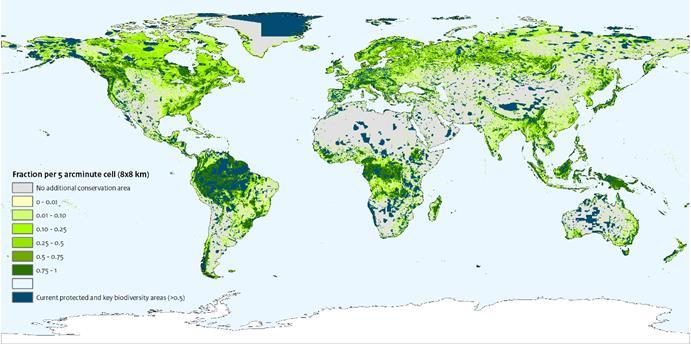 Figure10 Conservation areas for the “Sharing the Planet” scenario aim to conserve 30% of the world’slandandfreshwaterareaby2050(fromKoketal.,2020).
To prioritize conservation areas for their two scenarios, Kok et al. (2020) combined mainly KBA19 databases, current PAs20, important bird areas21, and a database of the most endangered species22. Then at the ecoregion scale, a land allocation model was used to determine which areas to protect to maximize policy effectiveness. For the “Sharing the Planet”scenario,landallocationrequiredamorecomplexprocesstoincorporateareasrich inESsintothe finaldecision.
Johnson et al. (2021) simulated the implementation of the "Great Deal for Nature" scenario illustrated in Waldron et al. (2020). This scenario involves retaining current PAs and expanding them so that each country unit retains 15.3% of its land area to meet the 30% target by 2030 (see Figure 12). Areas are selected based on indicators of biodiversity and carbonstorage.
19 Key Biodiversity Area Partnership World Database of Key Biodiversity Areas. (BirdLife International, accessed 5October2017).

https://www.keybiodiversityareas.org/
20 The World Database on Protected Areas. https://www.protectedplanet.net/en (UNEP-WCMC, accessedOctober 2017).
21 ImportantBirdandBiodiversityAreas. http://datazone.birdlife.org/site/ibacriteria
22 Alliance forZero-ExtinctionSites.https://zeroextinction.org/
Figure11. Conservation areas for the “Half-Earth” scenario aim to conserve 50% oftheworld’slandandfreshwaterareaby2050(fromKoketal.,2020).
Leclèreetal.(2020)alsoanalyzedtheexpansionofPAstocover40%ofthelandareaby2020 (see Fig 1.a from Leclère et al., 2020). This policy thus lacks credibility, given that only about 17% of the world's land area is currently protected or under OECMs. To simulate this intervention,theyoverlaidmapsofcurrentPAs,KBAs,andwildernessareas(Allanetal.,2017).
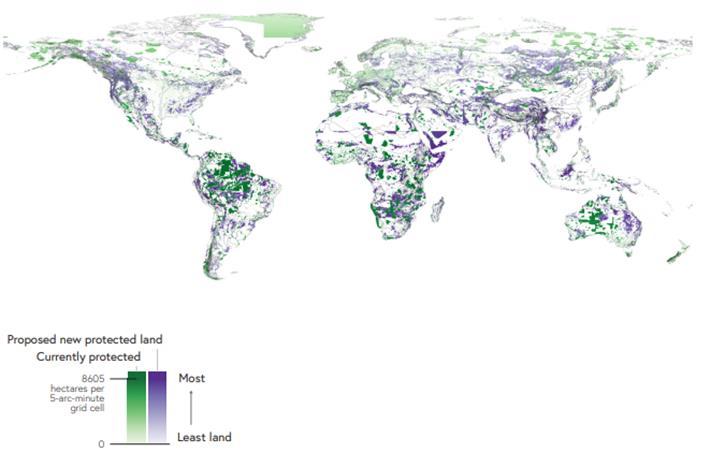
Inaddition,PAmanagementeffortsareaddedtothepolicy,meaningthatland-usechanges resultinginfurtherhabitatdegradationarenotallowedinexpandedPAsfrom2020.Another policy analyzed by Leclère et al. (2020) is the increasing restoration of degraded lands and theintegrationoflandscape-levelconservationplanningintoland-usedecisions,intending to increase biodiversity outside of extended PAs while considering spatial gradients of biodiversityandseekingsynergieswithagriculturaland forestproduction.
Overall,allthePAallocationmapsshowstronglydivergentassumptions.Forexample,we compare the 30% PA expansion policy of Kok et al. (2020), see Figure 10, with the 40% expansion policy designed by Leclère et al. (2020), see Fig 1.a from Leclère et al. (2020). We can see that the latter is "politically" easier to implement but not at all convincing from an ecologicalpointofview.Indeed,theconservationeffortshiftedtothenorthernborealzones andthedesertzonesofAustraliaandtheSaharainAfrica,whilenotprotecting,forexample, thetropical forests oftheCongoBasin,whichrepresentsakeyzoneintermsofbiodiversity.
● The high-seafishingsector& sea-use trajectories
The policies and trajectories implemented to improve marine biodiversity are diverse and creative. They may focus on sectoral subsidies, ex-vessel pricing, MPAs, or fisheries management techniques. At the global scale, however, they do not distinguish between different fishing sectors (i.e., recreational, subsistence, and commercial) and types of commercial fishing methods: whether industries are fishing with nets (e.g., purse seine, trawling, and bottom trawl), orwithline (e.g., longlines, pole, and line) or harvesting shellfish.
Figure12. PAstoachievethe30%landareaconservationtargetby2030 (fromJohnsonetal.,2021).
Nevertheless, all these parameters will have different consequences in terms of erosion of biodiversityandcapacityto satisfythe growingseafooddemand
Costello et al. (2016) constructed three scenarios that involve different fisheries management objectives. The first scenario forces all fisheries to equalize their catch rates at MSY indefinitely This is a trade-off between conservation and exploitation. The second scenariodescribesaworldwherefishingtrajectoriesmaximizethelong-termfishingprofit's Net Present Value (NPV). This policy implies that fish regeneration is optimal from an investment point of view. The ex-vessel price of fish increases by 31% and the variable cost of fishing decreases by 23%, in line with the literature. The last scenario corresponds to business-as-usual trajectories, although it is adapted to the types of current fisheries management: catch shares fisheries23 will follow the trajectory of the second scenario; fisheries under restrictedaccess management (RAM)24 will follow the currenttrajectories of fishmortality;andallothers,i.e.,neitherRAMsnorknowncatchsharesfisheries,areassumed tofollow openaccessdynamics.Thesepolicieswereevaluatedforallfisheries,thenonlyfor "overexploited" fisheries, and finally for "fully exploited" ones according to the FAO (2011) classification.
Cheung et al. (2019) quantified and adjusted three SSP narratives to reflect the societal considerationsofhighseasnarratives.IntheSSP1trajectory,theex-vesselpriceofhigh-seas harvested marine species is unchanged. The operating and capital cost of fishing will increase by 50% by 2050, and the rate of increase in catch remains unchanged. Fisheries subsidies are eliminated for poor and medium-rich countries; in rich countries, they are reducedby75%.Currently,morethanhalfofglobalfisheriessubsidies(mainlyfuelsubsidies), which are estimated at $35 billion per year, go to overfishing (Sumaila et al., 2016). The SSP2 implies that the ex-vessel price of marine species exploited in the high seas is low (25% decrease by 2050) due to the increase in supply. The operating and investment cost of fishing will decrease by 25% by 2050, and the rate of increase in catch is unchanged. Subsidies to the fishing sector increase by 25% for poor countries and 50% for medium-rich andrichcountries.TheSSP3trajectorydescribesaworldwheretheex-vesselpriceofmarine speciesexploitedonthehighseasishigh(i.e.,increasingby25%by2050).Theoperatingand investmentcostoffishingwilldecreaseby50%by2050,andtherateofincreaseincatchwill increase by 25% for the medium-rich and rich countries. This world experiences a 25% increase in fishing subsidies for all countries. Cheung et al. (2019) also added a baseline trajectory that matches current trends. For all of these scenarios, MPA constraints are simulatedfor2050,from0to50%expansionwithamediantargetof30%ofthetotalhighsea area,andradiative forcingtrajectories are defined(RCP2.6or RCP8.5).
23 Catch shares are fisheries management systems that allocate a catch privilege over a specific area or a percentageofthetotalcatchtoindividualfishermen,communities,orassociations.Catchsharesprovidelongterm secure privileges to participants and, in theory, an incentive for the efficient and sustainable use of fish stocks. Catch share programs fall into two categories: quota-based programs that establish a catch limit for theentirefishery;andarea-basedprograms thatallocate asecureandexclusive areatoparticipants.
24 Restricted Access Management (RAM) limits the number of people, vessels, or fishing gear that can be engagedincatchingaspecificspeciesoffishorshellfish.Restrictedaccesscanalsorestrictthecatchallocated toeachparticipantinthe fishery throughharvestingrightssuchasindividualorcommunityquotas.
For the 30% or 50% MPA expansion policy, Cheung et al. (2019) chose the cells closest to the EEZ boundaries (see Figure 13). To ensure that MPAs were evenly distributed across ocean basins,theyusedthestatisticsprovidedbytheFAOmajorfishingareasasgeographicunits andpro-ratedthehypotheticalPAsbasedonthesizeofeachFAOarea.However,areaswere not selected based on their importance in biodiversity or profitability, so this MPA policy is incomplete. Indeed, according to the global fishing watch maps25 fishing efforts are more concentrated in EEZs than in the high seas; the study thus did not necessarily target the priority areas to be protected to reduce biodiversity decline. In addition, current MPAs only cover about8.15%26 of the oceans, soestablishing 50% MPAsby 2050 will be challengingand willrequirealotofmonitoringandinvestmentthatisnot accounted forinthe scenarios.
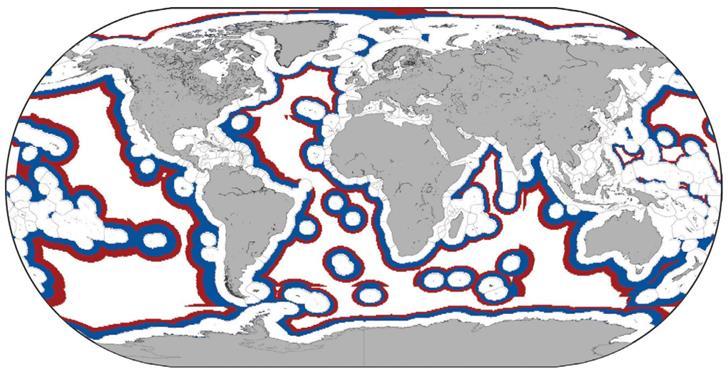
Finally,Johnsonet al.(2021)designed a suddencollapse ofmarine fisheries.Asaresult,they implemented a severe climate change scenario (RCP 8.5) to simulate drastic disruptions in fishmigrationthatwouldresultinareducedtotalcatchintermsofbiomass,whichregisters asatechnology-neutral productivitychange inthe fishingsector.
● The forestrysector
Measures to mitigate global warming by maintaining carbon storage through avoiding deforestation were explored in the scenarios. These policies assume that all countries implement payments in a coordinated manner, although the SSP narratives propose different degrees of coordination between countries. Indeed, Kok et al. (2020) developed twoReducingEmissionsfromDeforestationandforestDegradation(REDD)27 policies.Thefirst
25 Global Fishing Watch.
https://globalfishingwatch.org/map/?latitude=19&longitude=26&zoom=1.5&start=2022-06-09T00%3A00%3A00.000Z&end=202209-09T00%3A00%3A00.000Z
26 Protected Planet.
https://www.protectedplanet.net/en
27 Reducing Emissions from Deforestation and forest Degradation (REDD) is a mechanism that puts a financial value on the carbonstored inforeststoencourage developing countries toreducedeforestationand investinlowercarbonalternatives.
Figure13. ScenariosforexpandingMPAsinthehighseasto30%(blue)or50%(blueandred)in2050 (fromCheungetal.,2019).
aimstoimplementaREDDprogramprotectingallintactforestlandscapes,whilethesecond onlytargets forestswithacarbondensitygreaterthan100tC/ha. Thearticle,however,does notprovideanyinformationonwhichcountriesarelikelytopayorreceivefinancialsupport fromtheprogramandinwhatproportion.Intheirpolicy-screeningscenarios,Johnsonetal. (2021) identified two different trajectories depending on the type of scenario. In the former case, payment for forest carbon is made within each country by limiting the supply of land and compensating forest owners through increased land subsidies. In the second case, paymentforforestcarbonismadebyrichcountriesbasedontheirhistoricalGHGemissions, andpaymentisreceivedbypoorercountries basedonavoideddeforestation.
In addition, in the exploratory scenario designed by Johnson et al. (2021), a sudden collapse in timber production is quantified. They assumed an 88% decrease in forest cover for all tropical regions and suggested a reduction in the ability to expand forestry in the Amazon basin. The economy is impacted by a 90% reduction in wood supply from native forests in humidtropicalareaswithalongergrowthperiod.
● The energy sector
Onlysomestudieshaveimplementedtrajectoriesthattargettheenergysector.Contrary to the climate scenarios for which this sector is determinant, biodiversity dynamics is less impacted by a single sector. The main argument in favor of scenarios focusing on biodiversitychangeisthattheyprovideaclearerunderstandingofwhichpolicyintervention willbethe mosteffectiveinconservingbiodiversity.
Asaresult,studieshardlyimplementclimatechangemitigationandadaptationpolicies (e.g.,throughtheforestryortheenergysector),despitethegrowinginterest ofcountries intheseissues.Asanexampleofclimatemitigationtrajectory,Koketal.(2020)exploredthe reductionofenergycrops(wheat,sugarcane,corn,andoilseeds),i.e.,plantspeciesgrownto produce biomass for the creation of first-generation biofuels (ethanol and biodiesel). Moreover,Obersteineretal.(2016)simulatedtwodifferentpoliciestoreachthe2°Ctarget of globalwarmingbyimposingeitheramoderateshareofbioenergyandnuclearenergy ora highpercentage ofbioenergyand nonuclearenergyby2030.
Somemeasurestomitigateglobalwarmingdonotproduce"co-benefits"forbiodiversity orevendegradeitfurtherandviceversa.Theexpansionofhydropowerplants,forexample, is strongly simulated in the climate scenarios because it provides clean electricity with significantly lower GHG emissions than most other energy sources while degrading biodiversity(e.g.,byfragmentingwatercoursesanddisruptingcertainbiologicalcycles).Kok et al. (2020) added this pathway to preserve biodiversity, although it does not seem to mitigate climate change. In the "Half-Earth scenario", hydropower does not increase in conservationareas,and25%ofhydropowersitesareremovedtorestorenaturalwaterflow. In the "Sharing the Planet" scenario, hydroelectric infrastructures are prohibited until they meet ecological flow requirements. Although In the baseline scenario, hydropower will increaseby80% through2050
Cross-sectionally, Obersteiner et al. (2016) simulated two tax policies on GHG emissions for all major sources. Sinks of emissions apply to the energy sector, agriculture, and livestock, but also industries impacting peatlands and converting soils. The first represents a tax of $10/tCO2eq,andthe secondataxof$50/tCO2eq.
As there is currently little overlap between the climate and biodiversity scenarios, we therefore recommend bridging between them, especially to identify the potential for compoundingandcascadingimpactsontheeconomy.
3.4 Modelingtrajectories
3.4.1 Models ofchange of directandindirectdrivers ofbiodiversityloss
The first category of models commonly used to assess scenario trajectories are models of change of direct and indirect drivers of biodiversity loss. Given the quantified parameters and assumptions of a chosen scenario, they determine for multiple time horizons how socio-economic and environmental pressures may evolve (see Figure 4). Thiscategoryiscomposedofmanydifferentmodelsprovidingeitherspatialresults(e.g., crop distribution) or aggregate indicators (e.g., food prices). Table 3 shows the models28 forchange indirectandindirectdriversofbiodiversitylossusedbythe authors.
Koketal.(2020)
Johnsonetal.(2021)
IMAGE
GTAP
Leclèreetal.(2020) AIM, GLOBIOM,IMAGE,MagPIE
Cheunget al.(2019)
Obersteineretal.(2016)
Costelloetal.(2016)
Schipperetal.(2020)
Pereiraet al. (2010)
Bioeconomicmodel
GLOBIOM
Bioeconomicmodel
IMAGE
LPJ-GUESS,LPJ, CABLE-POP
28 SeethewebsiteofIAMconsortiumfor decriptionsofthesemodels. https://www.iamconsortium.org/
IntegratedAssessmentModel (IAM)
Generalequilibriummodel
Land-usemodules
Economicandbiophysical dynamics
Land-usemodule
Economicandbiophysical dynamics
IntegratedAssessmentModel (IAM)
DynamicGlobalVegetation Models(DGVMs)
ARTICLE MODELOFDIRECTANDINDIRECT DRIVERS TYPEOFMODEL
Tableau3. Modelsofchangeofdirectandindirectdriversofbiodiversityloss
TwoofthestudiesselectedforthisliteraturereviewusedIAM29 toquantitativelydescribe key processes in human and earth systems and their interactions. Kok et al. (2020) and Schipper et al. (2020) used IMAGE30 , which is a computable general equilibrium model. The modeling is "integrated," meaning it uses information from many scientific disciplines. The term "assessment" emphasizes generating valuable information for decision-making, even under large uncertainties. IAMs were developed to anticipate the evolution of climate trajectories and related issues, which implies, among other things, that when they are not designed to respond to research questions on biodiversity. As a result, they do not provide sufficiently precise information, particularly in sectors and sub-sectors impacting biodiversity.
In general, IAMs use GDP and demographic trajectories as inputs (often from the quantificationofSSP),policiesandtrajectories (e.g.,RCPtargetsand specificpoliciesfor biodiversity improvement), and other options such as agents' preferences or technological changes. Then, these inputs are implemented into different modules to exploreenergy,land,climatesystems,andtheeconomy,amongothers(seeFigure14).These modules are linked to assess certain cascading effects, "co-benefits" and unintended consequences,tracinghowchoicesinonedomainaffecttherestofthe modeledworld.For example,ifthedemandforfoodincreasesbecausethetotalpopulationisgrowing,theneed for agricultural land will rise. Therefore, deforestation, GHGs in the atmosphere, and food priceswillincrease.ThemainadvantageofIAMs,thus,istheirabilitytoexplorethetrade-offs andinteractionsbetweendifferentpartsofsociety.The modelsprovideinformationonnew allocations of pressures in the form of economic outcomes, emissions, energy trajectories, orland-use.
IAMs, however, are only tailored to explore terrestrial systems. It is thus not yet possible tousethemtoassessthedynamicsofthefisheriessector(notablyinthehighsea).
29 When we speak of IAMs, we are referring to the category of "complex" IAMs, i.e., those that describe future development paths in terms of technology change, energy mode choice, land-use change, or societal trends towards protecting or not protecting the biosphere, and that provide sectoral information on the processes being modeled (also known as "process-based models"). In addition, we refer to IAMs that determine global equilibriabyassumingpartialequilibriaoftheeconomy.
30 The IMAGE model, created by the PBL, allows the simulation of future global dynamics between societies, biosphere, and atmosphere and their interactions until 2100. For each of the 26 regions it covers, it can assess terrestrialdynamicsforsocio-economicindicatorswithaspatialscaleof0.5x0.5degreesoflatitude-longitude.
Figure14. Simplified representation of an IAM (note that interactions and modules may varybetweenIAMs).Thegraycolorrepresentsthemodelingprocessoftheearth systemmodule,andthebluereferstotheentireIAM.Thefigureisadaptedfrom CarbonBrief,byEvansS&HausfatherZ,2018.
https://www.carbonbrief.org/qa-how-integrated-assessment-models-are-usedto-study-climate-change/
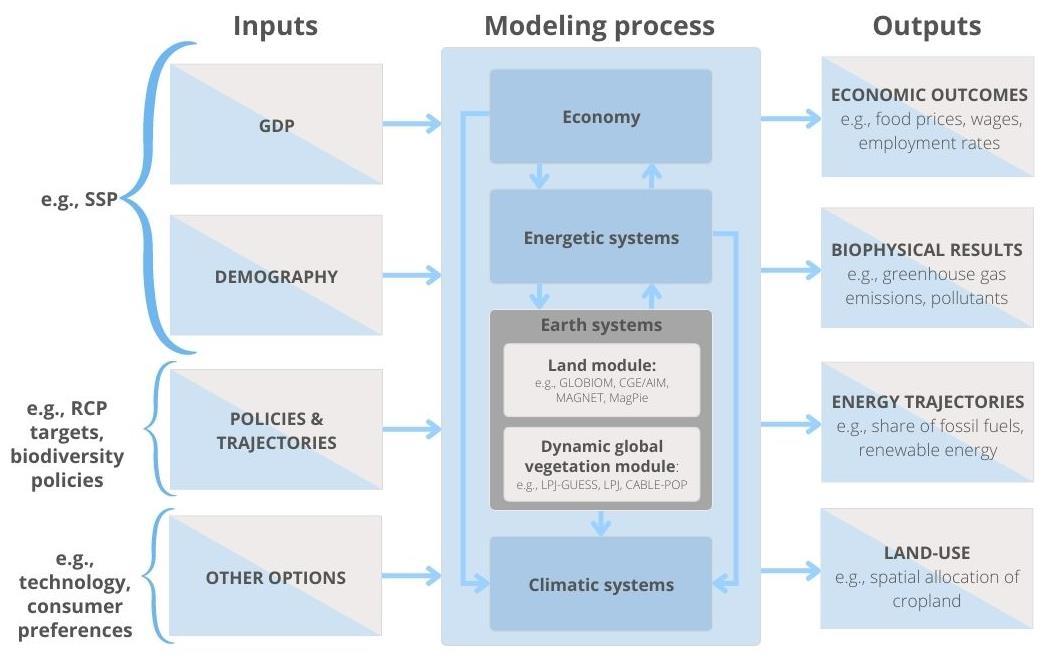
Leclèreetal.(2020) usedonlythelandsystemmodules ofsome IAMs:
The CGE/AIMmodule (fromtheAIM IAM);
MagPie(fromthe REMINDIAM);
GLOBIOM(fromtheMESSAGEIAM);and
MAGNET(fromthe IMAGE IAM).
Ontheotherhand,Obersteineretal.(2016)usedonlytheGLOBIOMmodeltoassesschanges indirectandindirectland-relatedpressures.Landmodules'processissimilartoIAMsasthey considerthe sameinputs(e.g., policiesandGDPtrajectories)andprovide thesame outputs (e.g.,land-useallocationandenergytrajectories)(seeFigure14).Themaindifferenceistheir inability to be as comprehensive as IAMs: they do not explore the dynamics of energy systems or the economy as a whole. Thus, they calculate only partial equilibria and are not "integrated".Forexample,GLOBIOMisadynamicpartialequilibriummodeloftheagricultural and forestry sector. It can be used alone or with the IAM MESSAGE to obtain computable general equilibria. It allocates land between production activities to maximize consumer and producer surplus by considering a dynamic set of demand, resources, technologies, andpolicies.
Surprisingly, IAMs and associated land system modules seek to know what economic structure (e.g., demand and exports) will give them the desired socio-economic trajectories (e.g., GDP, demographics, and policies). They take, for example, future GDP trajectories, and no matter what policies are modeled or how emissions are projected to change, these economic growth trajectories will remain unchanged. The main tool that allows them to make these trade-offs is the variation of relative prices. This modeling process considerably impacts the analysis of an ecological transition, as the SSP projects positive GDPs for all countries until 2100, even if a long-term structural change is modeled, e.g.,throughecologicaltransitionpoliciesandhypotheses.
Moreover,whetherusingaIAMoronlyanearthsystemmodule,thequantificationofSSP trajectories will depend on each model and the choices made by its team of modelers. Indeed, not all IAMs/land modules have the same structure and make the same tradeoffs: they differ in biochemical, biophysical, and socio-economic parameters. Land-use related assumptions such as agricultural productivity, the environmental impact of food consumption,international trade, globalization, andland-basedclimate change mitigation policies are different between IAMs (Popp et al., 2017). Because crop yields and livestock intensification strongly influence land-use dynamics, a lack of harmonization between models will lead to different results across IAMs for the same SSP. Nevertheless, proposing differentalternativeslimitsquantitativeharmonizationandexplorestheuncertaintiesofthe scenarios and models. The only two trajectories that are almost common to all IAMs are those foreconomic growth(Dellinket al.,2017;Dietrichet al.,2014)anddemographic growth (KC& Lutz,2017).
Becausethemodelsaredesignedonaglobalscale,theyseverelylackaccuracyatmany levels. For example, GLOBIOM distinguishes between eighteen crops and seven animal products. It can differentiate between six land-uses (cropland, grassland, short-rotation plantations, managed forest, unmanaged forest, and other naturally vegetated lands) and fourmanagementsystems(foodcrop,low-inputrainfed,high-inputrainfed,andhigh-input irrigated).Thus, these classifications remain verygeneral and do not allow forthe targeting of activities and practices likely to be the most impacted and/or those having the highest impactintheeventofanecologicaltransition.
Pereiraet al.(2020)usedonlythreeDynamicGlobalVegetationModels(DGVMs):LPJ-GUESS, LPJ, and CABLE-POP. DGVMs modeled the impact of climate change on vegetation and associatedbiogeochemical andhydrological cycles.They use climate time series datasets and, given the constraints of latitude, topography, and soil characteristics (input data). These models are often integrated into the land modules of IAMs (such as GLOBIOM, which uses LPJmL), but they can be used alone to calculate partial equilibria (see Figure 15). Nevertheless, they are not able to take into account a large number of dynamics, notably socio-economic.
Alternatively, Johnson et al. (2021) used the Global Trade Analysis Project (GTAP) model, a multi-regional,multi-sector(whichincludesthefisheriessector),andacomputablegeneral equilibrium model. They combined it with Agro-Ecological-Zones (GTAP-AEZ) to cover 137regions. The main advantage of this model over the IAMs is that it offers a broader
sectorial disaggregation of results, which, in the context of a transition risk assessment, improves the possibilityoflinkingtheimpactsofbiodiversityonsectors/industries.
Intheabsenceofintegratedmodelsadaptedtothehigh-seafishingsector,Cheungetal. (2019) and Costello et al. (2016) have used bioeconomic models, i.e., models that capture both economic and biophysical dynamics. Cheung et al. (2019) chose a biological model (i.e.,aDynamicBioclimateEnvelopeModel),whichtakesasinputspressuresrelatedtoocean conditions (sea surface, temperature, salinity, oxygen content, sea ice extent, and ocean relief) and species life history data. These data will allow them to explore, for each country, changesindistribution,speciesabundance,andpotentialfishcatchrateandthuscalculate theMaximumCatch Potential(MCP),whichisaproxyforMSY.
Then they used an economic model (i.e., an Effort Dynamic Model) that simulates changes in fishing effort (i.e., the number of fishing vessels) for fisheries to maximize their profit. This model considers both the results of the biological model (i.e., biomass and potential catch rate) and the policies developed by the authors (subsidies, ex-vessel price of fish, cost of fishing, andrate ofincreaseofcatches).
Cheung et al. (2019) did not model the socio-economic trajectories of SSP but used them to design policies related to the high-seas fishing sector. For example, the model does not assess country demographics or economic growth differences. Still, these factors will impactacountry'shighorlowex-vesselfishprices.Inaddition,thequantificationofpolicies and their incorporation into the models is only very briefly detailed in the study, which does notofferanyadditionalmaterialatthistimeandisintheprocessofbeingpublished.Itis,for example,notclearhowthemodelaccountsforthelinkbetweenthe30%MPAexpansionand theimpactonfishcatchrates
Similarly, Costello et al. (2016) used a bioeconomic model to analyze changes in fisheries management type on fish biomass and profits. They took several databases of fish farms worldwide, fish catch rates, fish resources, and fish life cycle parameters. They coupled this information with a biological model (i.e., the Pella-Tomlinson Surplus ProductionModel) and aneconomicmodeltocalculateMSYs,fishbiomasstrajectories,profitsforeachfishery,and fishmortalityrates.Theseresultsare measuredforeach fishery managementpolicies.
In terms of pressure, Cheung et al. (2019) were able to quantify the impact of resource extractionandclimatechangeonfisheries,and Costelloet al.(2016)onlyconsiderresource extraction as a direct driver for biodiversity decline. Climate change is not mentioned once in the study. These two representations of the possible futures of high-seas fisheries, nevertheless,incorporatefairlyaccuratepopulationdynamicsdata,andtheyconsiderthat biodiversityloss(intermsofbiomass) canimpacteconomicoutcomes (fisheries profit).
Finally,theintroductionanddevelopmentofinvasivespeciesisasignificantpressureon biodiversitylossthatis never takenintoaccountbyanydirect orindirectfactorchange models.
3.4.2 Biodiversity models
Biodiversity models allow direct and indirect drivers of biodiversity loss to be translated into biodiversity impacts. These impacts are measured through the biodiversity indicatorstheyprovide(seeFigure4).
The authors used various biodiversity models and indicators (Table 3). Some, such as Pereira et al. (2020), combined several models and indicators to assess the impact of a single scenario on biodiversity, while others chose a single pair. This choice will depend on thecompatibilitybetweenthemodelandthebiodiversityindicator.Thereisatrade-offhere between using many scenarios and indicators to be more transparent about the uncertainties associated with modeling and choosing a limited number to explore more specifichypothesesrelatedtobiodiversityissues.
Tableau4. Biodiversitymodelsandindicatorsfromarticlesidentifiedintheliteraturereview.The "biodiversityindicator"columndoesnotcorrespondtothemodelindicatorbutrather the indicator used in the articles (i.e., some articles have adapted the biodiversity modelindicator).
Koketal.(2020) GLOBIO
Birds,mammals,plants GLOBIO-Aquatic ?
GLOBIO-Species
Johnsonetal.(2021) ?
AIM-biodiversity
index ?
Amphibians,birds,plants,reptiles, mammals
Leclèreetal.(2020)
Cheunget al.(2019)
Schipperetal.(2020)
Costelloetal.(2016)
LPI-M
Birds,mammals,fish,reptiles, amphibians GLOBIO
PREDICTS
cSAR_CB17
cSAR_US16
mammals,plants
mammals,plants,fungi, insects
birds,amphibians
birds,amphibians, reptiles, plants
cSAR_CB17 Mammals,birds,amphibians
BILBI
model
Obersteineretal. (2016) ?
Birds,mammals,plants
Fish
index ?
ARTICLE BIODIVERSITY MODEL BIODIVERSITYINDICATOR SPECIES
MSA
RLI, LPI, AOH Mammals
Biodiversity
ESH
INSIGHTS Mammals
LPI
MSA Birds,
BII
Birds,
FRRS Mammals,
FGRS Mammals,
FGRS
Plants
Bioeconomic
MSA Fish,
model
invertebrates
GLOBIO MSA
Biomass
Bioeconomic
Environmental
AIM-biodiversity
InSIGHTS
Speciesrichness,meanspecies habitatscore
Amphibians,birds,plants,reptiles, mammals
Speciesrichness,meanspecies habitatscore Mammals
MOL Speciesrichness,meanspecies habitatscore
Amphibians,birds,mammals
BILBI Speciesrichness Plants
cSAR-IIASA-ETH
Speciesrichness
Amphibians,birds,plants,reptiles, mammals
cSAR-iDiv Speciesrichness Birds
PREDICTS
Speciesrichness,speciesabundancebasedbiodiversity intactness Birds,mammals,plants,fungi, insects
GLOBIO MSA Birds,mammals,plants
Biodiversity is multidimensional and cannot be summarized in a single indicator, unlike climate change with the proxy of CO2-equivalent. Indeed, biodiversity is a large concept that includes diversity within species (i.e., genetic diversity), between species (i.e., species diversity),andecosystemdiversity(i.e.,ecologicaldiversity).
Thearticlesweidentifiedmeasurebiodiversitybetweenspecies,andsomealsomeasure ecosystem diversity. None, however, explores genetic diversity, which is essential for analyzing the ability of species to adapt to future environmental changes. Climate change, for example, can alter genetic traits, which, in some cases, impact species resilience,suchasdecreasedbodysize(Gardneretal.,2011)ordispersalability(Hilletal.,2011). However,it mustbe recognized thatgeneticdataare scarceonaglobal scale.
There exist many biodiversity indicators; however, biodiversity models often influence the indicators that can be used. For example, the GLOBIO model calculates the Mean Species Abundance (MSA), PREDICTS measures the Biodiversity Intactness Index (BII), and INSIGHTSthe Extent ofSuitableHabitat(ESH).
The indicators identified in the studies measuring ecosystem integrity are the MSA and the BII. The predominant measure is the MSA, which was used by half of the authors. It represents the change in biodiversity caused by human pressures compared to a nondegradedecosystem.Itisdefinedastheaverageabundanceoforiginalspeciescompared to their abundance in intact ecosystems, i.e., undisturbed by human activity (reference situation). The indicator ranges from zero to one, where one represents an undisturbed ecosystem and zero a completely degraded ecosystem, i.e., as rich in biodiversity as a parking lot. For example, the MSA of a pasture with livestock might be 60%, 10% for an ecosystemwithintensiveagriculture,and5%foranurbanized area(Esch, 2016).
Thisindicator,however,raisesmanyquestionsaboutitsinterpretation.Indeed,whentheMSA is worth 0.5, does it indicate 100% destruction on 50% of the territory or 50% destruction on 100% of the territory? Moreover, the pressure-impact relationships of the GLOBIO model are the result of a meta-analysis whose information is not accessible from published articles, requiringreferencetothevoluminoustechnical documentationthatcouldnotbeanalyzed
Pereiraet al.(2020)
in the time allotted for this work. Furthermore, the so-called cause-effect relationships in GLOBIO are often correlational, and the context of the studies from the meta-analysis likely influences the results.
The second indicator of ecosystem integrity is the BII, which measures the average abundance ofspeciesinagivengeographicarearelative totheirreferencepopulations.
The main difference between both indicators is that each hectare has the same weight in the calculation of the MSA, whereas the BII gives more weight to the areas with the highest speciesrichness.Inaddition,theMSAnormalizesabundancetotheundisturbedsituationfor eachspecies,whiletheBIIdoessoatthespeciesgrouplevel.UnliketheBIIapproach,theMSA normalizes abundances to one, not more, which means that the undisturbed ecosystem is the richest in biodiversity, so adding new non-native species to the ecosystem does not increase biodiversity. An indicator similar to the MSAand BII, whichGLOBIO-Species and LPIM can also calculate, is the Living Planet Index (LPI). It measures changes in terrestrial populationsrelativetoaspecificyear(i.e.,1970).
Koketal.(2020)andLeclèreetal.(2020)usedtheGLOBIO-Species,AIM-B,orINSIGHTSmodels tocalculatetheAreaofHabitat(AOH)(alsoknownasESH).Thisindicatormapstheavailable habitat for each species to the base year 1970 or 2010, depending on the model, and it thus provides information on the risk of species extinction. To measure habitat availability, it considers the interaction between the species' geographic range and environmental preferences (e.g., vegetation cover, elevation, and proximity to the water). The indicator is settozerowhennomorespaceisavailableforthespecies,onewhentheareaisunchanged fromthe base yearand greaterthan one whennewspaceisavailable.
Thesametwoauthorsalsousedanothermeasurerelatedtospeciesextinctionrisk,theRedListIndex(RLI),whichmeasureschangesinoverallextinctionriskamongspeciesgroups.Itis based on historical changes in the number of species in the International Union for ConservationofNature (IUCN) redlistofthreatenedspecies.It gives alevel ofextinctionrisk foreachspecies.
There are other indicators to measure the extinction risk of a species, Leclère et al. (2020) used the Fraction of Regionally Remaining Species (FRRS) and the Fraction of Globally Remaining Species (FGRS), which cSAR_CB17 and BILBI, cSAR_CB17, cSAR_US16 can model respectively (see table 3). These indicators calculate the proportion of species that are not yet extinct or facing extinction in a region (or across all land areas) relative to 2010. If the indicatoris0, all species are extinct orthreatenedwithextinction;ifitis1, there are as many threatenedorextinctspeciesasin2010,andifitismore,therearefewerthreatenedorextinct speciescomparedto2010.
Obersteiner(2016)andJohnsonetal.(2021)combinedseveralbiodiversityindicatorsintoone measure.Indeed, Johnsonet al.(2021)mappedfourbiodiversityindicators:
Thetotalspeciesrichness,whichcorrespondstothenumberofspeciespresentinan areaasafunctionoflandtype, humanintensity, andhabitatage;
The endemicbiodiversity,representingthe amountofhabitatavailable forendemic species31;
The red-listed species biodiversity, mapping the amount of space available for threatenedorendangeredspecies; and
Key Biodiversity Areas, showing sites of importance for the global persistence of biodiversity, it includes different indicators such as the presence of threatened speciesorecosystems, geographicallyrestrictedspeciesandecologicalintegrity.
Thismethodallowsforthepossibilityofweightingbiodiversityindicatorsdifferently.Johnson et al. (2021) gave the same weight to each indicator, but some areas are likely favored over othersjustbecausetheyarecountedtwice.Forexample,theKBAalreadyconsiderstheIUCN red list criterion of extinction risk so that this criterion would have more weight in the biodiversityindex.
Obersteiner et al. (2016) calculate an environmental index that averages several indicators, such as a biodiversity measure, but also a measure of GHG emissions, food prices, or fertilizers.Thebiodiversitymeasurecorrespondstothechangeinland-useinkeybiodiversity areas, but it is difficult to identify how the key biodiversity areas were determined. Another problemwiththisapproachofcombiningindicatorsisthe interpretationofthe measure.
One aspect of interspecies diversity indicators that interested us is the type of species the modelscanassess.Indeed,welookedforthetypesofspeciesanalyzedinthe methodology of biodiversity models when the information was not present in the article. It can be seen thataround35%oftheindicatorstreatedbytheauthorstakeintoaccountmammals(see Figure 15). In comparison, wild mammals represent only 0.001% of the total biomass; the next most described taxa are birds, plants, and amphibians, while they represent 0.0003%,81.82%,and0.018%ofthetotalbiomass,respectively.Nevertheless,allpapersthat usedamammal biodiversityindicatoralsoused one thatincorporatedplantsandbirds.
31 Aspeciesisendemicwhenitispresentexclusivelyinadelimitedgeographicalregion.Theendemismofspecies is oneoftheproxies usedtodeterminetheriskofextinction.
Figure15. Share of biomass covered by biodiversity indicators in selected studies per species. Thetotalbiomassaccountedforinthestudiesrangesfrom82%forplants,followedby invertebrates and fungi at around 0.2% each, then fish at around 0.1% and other life formsarelessthan0.01%.
Fish
Amphibians
Birds
Total biomassofthespecies(%)
Biomassassessedbyindicatorsperspeciesintheidentifiedstudies(%)
3.4.3 EcosystemService(ES) models
OnlythreestudiesanalyzedchangesinspecificESsfollowingtheimplementationoftheir transition scenario. In general, these models used the results of models of change of direct and indirect drivers of biodiversity loss or biodiversity models to assess the evolutionofESsgiventhetransitionorexploratoryscenario(seeFigure4).
Kok et al. (2020) primarily used the GLOBIO-ES model, Johnson et al. (2021) used InVEST, and Pereira et al. (2020) predominantly used these two models. These are the most representedESmodelsattheglobalscale.Onthe other hand,authors sometimes onlyuse theoutputofmodelsofdirectandindirectdriversofchangethatcanbeusedasproxiesfor ESassessments(Table4).Forexample,IMAGEgivestotalcropproductionincaloriesperyear, whichisaproxyforthe food-providingESs.
InVEST is a suite of models that map ESs and assign a monetary value to them through a production function. It uses maps as a source of information and as a result. The model is quite complex and requires precise data, which implies that it is difficult to use all its components at the global scale. Indeed, Johnson et al. (2021) simplified some of the submodels of InVEST to use it globally, notably the pollination service. The model can assess twenty-one different ESs, but Johnson et al. (2021) and Pereira et al. (2020) only evaluated four andtwo,respectively(Table 4).
GLOBIO-ES is a complementary model to GLOBIO that calculates the current status, trends, and possible future scenarios of ESs at the global level. It allows for the analysis of eight cultural, material, or regulatory ESs, although Pereira et al. (2020) and Kok et al. (2020) only analyzed two and three regulatory services, respectively (Table 4). The methodology is
0 10 20 30 40 50 60 70 80 90
Mammals Reptiles
Invertebrates Plants Fungi
closely related to the IMAGE model. GLOBIO-ES takes as spatially explicit input data: direct pressures (i.e., land-use and management system and climate change), indirect pressures (e.g.,revenues andfood demand),andecosystemproperties(e.g.,relief, soilproperties,and climatevariables).
ThemainproblemwithexistingESmodelsisthattheydonotincorporatepossibletipping points and regime shifts in their analysis. Moreover, the interconnections between the different ESs are not or only marginally taken into account, models mainly analyze each service separately (Aguedo et al., 2020). The main reason is that data on the link between land-use andlandscape characteristics andESsare scarce and fragmented.Nevertheless, some ESsare muchbetterdocumentedthanothers,suchas pollination
Finally, in the studies identified, regulating ESs predominate over provisioning services, and cultural services (e.g. sources of aesthetic inspiration and spirituality, recreation and ecotourism) andsupportingservices(e.g. geochemical cycling of water or decomposition of organic matter that contributes to soil fertility) are completely absent. This means that the scenarios are not currently able to take into account the evolution of the major geochemical cycles that are important for the maintenance of life on the planet, nor the ecosystem services that underpin activities to the tertiary sector (e.g. leisure and tourism) butalsoculturalandspiritualactivitiesofhumansocieties.
Table5. ESsandassociatedmodelsthatwereusedintheselectedstudies
MATERIALESs Foodandfeed production IMAGE LPJ-GUESS Timber production InVEST CABLE-POP Marinefishproduction InVEST Bioenergy production LPJ-GUESS REGULATING ESs Croppestcontrol GLOBIO-ES GLOBIO-ES Nitrogenretention InVEST, GLOBIO-ES, LPJ-GUESS Pollination InVEST GLOBIO-ES InVEST Coastalresilience InVEST Climate regulation InVEST IMAGE CABLE-POP, LPJGUESS,LPJ Soilprotection GLOBIO-ES ? Healthylakes GLOBIO-Aquatic Naturalwater purification GLOBIO-Aquatic
JOHNSONETAL.(2021) KOKETAL.(2020) PEREIRAETAL.(2020)
3.5 Theevaluationofquantitativeresults
3.5.1 The comparisonofbiodiversityoutcomes
Unsurprisingly,allscenariosfoundabiodiversityindicatorthatonlydeclinedovertime. In the business-as-usual scenario of Leclère et al. (2020), the terrestrial biodiversity intactnessindicator(MSAorBII)declinesonaveragebyonly0.89% from2010to2050andby 5% from 2010 to 2100. Nevertheless, Kok et al. (2020) anticipate a much faster loss of MSA, as their terrestrial MSA declined by about 4.7%, and their aquatic MSA declined by 3% from 2015 to 2050. Furthermore, Kok et al. (2020) estimate a much broader decline than Leclère et al. (2020) for similar indicators: they found respectively a decline in the extent of suitable habitat within the range of species (AOH) of 12.5% and 2.6%, and a drop in population of vertebrate species (LPI) of 20% and 9.7% by 2050. At the marine scale, Cheung et al. (2019) found a 7-20% loss of MSA by 2050 and 15-55% by 2100, depending on the RCP trajectories. Moreover,Costelloetal.(2016)foundabiomassdeclineequivalentto37.6%from2012to2050.
Onlytwo studies have constructed scenariosaiming at reversingthe terrestrial biodiversity curve.InKoketal.(2020),twoscenariosreachthistargetby2050fortheLPIindicatorandby 2030 for the MSA. These scenarios require ambitious biodiversity conservation, climate change mitigation, and food security policies, including expanding PAs to 30% or 50% of the planet.The mostambitiousscenarioofLeclèreetal.(2020),whichincludesvariousdemand side, supply side, and 40% PA expansion policies, achieves biodiversity growth as early as 2050 for the LPI and AOH indicators (for all models). With this scenario, however, MSA trends becomepositiveonlyby2075onaverage.Theonlymodelthatdoesnotpredicttherecovery ofMSAsisIMAGE,even outto2100.
Inversely, the most ambitiousscenarios of Schipperet al. (2020) and Pereiraet al.(2020), i.e., the SSP1,do notachieve positive MSAorspeciesrichnesstrajectories by2050.
At the high-sea fishing sector level, only the SSP1 scenario of Cheung et al. (2019), coupled withan RCP2.6 trajectoryand a50% expansion ofMPAs, envisions apositive MSAchangefor 2100. In Costello et al. (2016), applying contrasting management regimes to global fisheries could drastically increase biomass. Indeed, the current biomass is estimated at 840 million metrictons.Incontrast,inthebest-performingscenario,thebiomassisprojectedtobeover 1,143millionmetrictons(about520 millionmetric tonsmore thantheirbaselinescenario).
Finally, the most ambitious scenario of Johnson et al. (2021) is the "Global Deal for Nature" scenario, which consists of expanding PAs to 30% of the land. It is the only one that significantlyimproves biodiversity(the biodiversityindicatorincreasesby29%).
3.5.2 The comparisonoffood securityoutcomes
In the Kok et al. (2020) business-as-usual scenario, the number of people at risk of hunger decreases until 2070 (reduction from 10.1 to 2.8 % between 2015 and 2070), although animal andplantfoodpricesincrease.Onthecontrary,thebaselinescenarioofLeclèreetal.(2020)
projects, on average (depending on the land system models), a slight decrease in the relative prices of crops that are not dedicated to energy between 2010 and 2050. Nevertheless, there are considerable differences between the models; for example, prices increase by about 10% with the IMAGE model, and with GLOBIOM and MAgPIE, they decrease byabout10%.
WhenKoketal.(2020)projecttheirscenariothatonlyincorporatesbiodiversityconservation measures, the risks of food insecurity are reduced, but not to the same extent as in the baseline scenario: about 1.5 to 2 times more people are likely to be at risk of hunger compared to the business-as-usual scenario by 2070. As land available for agriculture becomes scarcer, as a transition to agro-ecology takes place (for the "Sharing the Planet" scenario), and as agricultural intensification is implemented (for the "Half-Earth" scenario), priceswillincreaseandaccesstofoodwillberestricted.However,ifadditionalmeasuresare added, such as reducing meat consumption or food waste, food security loss can be compensatedfor.Indeed,these measureswillreducethe demand forfoodandfoodprices compared to the baseline scenario and thus improve food security. Moreover, Kok et al. (2020) are the only ones to have analyzed a food security indicator at the regional scale. Sub-Saharan Africa and South Asia remain the most critical regions for all their scenarios. Overall,the scenarioshavelittleimpactonthe distributionofinequalities.
InLeclère et al. (2020), almostall policies, on average, projectprice decreases.Like Kok et al. (2020),theonlyexceptionistheconservationscenario(whichconsistsofexpandingPAsand restoring environments). Moreover, on average, the scenarios that impact demand (reduction of animal calories and waste) project the most significant price decreases. Nevertheless,forallscenarios,GLOBIOMandMAgPIEprojectapricedecrease,and,ingeneral, AIM and IMAGE project a price increase, so it would seem that the parameterization of the modelswouldhave stronginfluences onthe results whateverthe policyevaluated.
Obersteineretal.(2016)foundapositiveandsignificantcorrelationbetweenfoodpricesand their environmental index (including a biodiversity indicator) for 2030. That is, the most effective conservation policies lead to higher prices. This correlation was calculated with GLOBIOM, whereasinthe Leclère et al.(2020) studyGLOBIOMtended to findprice decreases for all scenarios. Moreover, with an SSP2 trajectory, the policy that decreases the most (i.e., 14%reduction)pricesbetween2010and2030isthepolicyofreducingmeatconsumption,as inLeclèreetal.(2020),followedbypoliciesofincreasingagriculturalproductivitywithoutnew inputs. Conversely, policies that limit agricultural expansion and land-use intensify the trade-off between food security and prices; as a result, prices are projected to increase by about5%between2010 and2030
3.5.3 The comparisonofecosystemservice(ES) outcomes
InthereferencescenarioofKoketal.(2020),materialESsimprovefrom2015to2070withthe expansionofagriculturalland.Onthecontrary,inthestudybyJohnsonetal.(2021),material ESs will decrease by 2030, particularly timber production, which loses 0.3%, and fisheries production, which loses 2.8%. For regulating ESs, the authors find that the carbon sequestration service will vastly decrease. According to Johnson et al. (2021), new carbon
emissionswillhaveaneconomicimpactof$135billionby2030.Nevertheless,intheirbaseline scenario, the ES of pollination increases (i.e., the productivity of pollinator-dependent crops increases by 2.8% between 2021 and 2030). In contrast, in the Kok et al. (2020) scenario, it decreasesby2070.
In the studies of Pereira et al. (2020) and Kok et al. (2020), for any SSP or conservation policy scenario, respectively, material services will improve by 2050 or 2070. In addition, Kok et al. (2020) found an increase in terrestrial regulating services in both of their conservation scenarios, except for the carbon sequestration service, which only improves if additional measurestomitigateclimatechangeareadded.Pereiraetal.(2020)foundthesameresults except for the nitrogen retention service, which is projected to decrease for all their scenarios, and the carbon sequestration service, which increases slightly in all of their scenarios(includingSSP5).
3.5.4 The comparisonofeconomic outcomes
Only three studies provide an analysis of the economic trajectories of their scenario, either in terms of profit of a specific sector or GDP at a global scale or disaggregated by countriesorgroupsofcountriesaccordingtotheirwealth.
IntheJohnsonetal.(2021)study,thedeclineinESs(i.e.,timberproduction,marineproduction, andpollination)underthebusiness-as-usualpathwaytranslatesintoalossofglobalGDPin 2030 of between $90 billion and $225 billion, depending on whether or not climate-related costs are considered: from -0,4% to 0.2% of GDP depending on countries. According to their projections,thepoorestcountrieswillsufferthesmallestdropinGDP,andtheuppermiddleincomecountriesthemostimpressivedropinGDP.Nearlyalloftheglobalpopulationin2030 will live in countries that lose in terms of GDP if climate change damages are included. The most considerable impacts on GDP per capita are found in the poorest countries. Furthermore, all policy-screening scenarios allow for an increase in GDP while conserving natural ecosystems. All the single policies (i.e., decoupled agricultural support, local and global forest carbon mechanisms) will increase global GDP by $50 billion to $56 billion in 2030. In addition, the most ambitious policy (i.e., decoupled support to farmers and R&D investment and global forest carbon payment) will increase global GDP by $150 billion in 2030.
In Johnson et al. (2021) exploratory scenario, the partial collapse of the ESs of pollination, timber production, and marine productionwill leadto a global GDP decrease of only 2.3% ($2.7 trillion) between 2021 and 2030 compared to the baseline. The poorest countries will largelysufferthisdropinGDP(-10% ofGDPonaverage),notablybecause ofthe reductionin timber production. The wealthiest countries will experience a decline of 0.7% of GDP, explained in large part by the decrease in pollination. Regionally, Sub-Saharan Africa will experience the most significant reductions in GDP, including Madagascar and Angola–Democratic Republic of the Congo, which is projected to experience a 20% decline in GDP, mainly due to the collapse of timber production. The second most affected region is South Asia (notably Bangladesh and Pakistan), with a 6.5% loss of GDP primarily caused by the declineinpollination.
WithoutanyMPAsexpansion,Cheungetal.(2019)foundthatinSSP1,thehighseascontribute the least, on average, to income generation and livelihoods compared to the other two scenarios. Although catches will rise widely and incomes increase slightly for all country groups(i.e.,high,low,andmid-incomecountries).However,fishingcostswillincreaseby50% for all countries by 2050 and continue to grow because of rising fossil fuel prices coupled with declining subsidies, which will increase the cost of fishing and reduce fishing efforts. Overall, the fishing sector will be unprofitable. In SSP3, catches will increase, and fisheries revenueswillbemoreorlessstableastheincreasingsupplyofseafoodproductsdecreases prices. In addition, the unit cost of fishing decreases with unethical means (e.g., forced and underpaidlabor),butasfishingeffortincreasesbeyondtheeconomicallyoptimallevels,the total cost of fishing increases. Although subsidies will climb as demand for seafood increases,profitswilldecrease,especiallyforthepoorestcountries.InSSP5,revenueswillbe maintained as prices and fish catches increase. However, the increase in fishing efforts will raise the total cost of fishing. In the end, a decline in profit is expected in all income group countries.Inconclusion,fishinghasachanceofbeingorremainingmarginallyprofitableby 2100 only in rich countries and for the SSP1 and SSP5 scenarios, but in the SSP5 scenario, fishing is only profitable because there are subsidies to offset the high cost of fishing. For middle-income countries and poor countries, the study found that the declines in fishing profitswere mostremarkableintheSSP1andSSP3scenarios,respectively.
According to Costello et al. (2016), applying sound management reforms to the world's fisheries could generate an additional benefit of $53 billion by 2050. The countries that will benefit most from these management reforms are China, Indonesia, India, Japan, the Philippines, Thailand,Malaysia,the Republic ofKorea,Vietnam, andTaiwan.Policiesthataim to equalize fish catches at MSY offer fewer advantages in terms of profit and fish biomass than policies where fishing trajectories maximize the NPV. For example, with MSY policies, profitsreach$58billioncomparedto$80billion withNPV policies.
4. Discussion
4.1. Thelong-termprospects
Given the absence of physical risk scenarios, we encourage research to address this knowledgegapandtocontinueeffortstounderstandbetterthetimingandgeographical criteria of regime shifts and ecosystem tipping points. Scenarios such as the exploratory of Johnson et al. (2021) are interesting from a methodological point of view, but given their arbitrary construction, they will not be sufficient to assess BRFRs. As shown in Figure 17, once research has taken hold of this type of scenario, it will be easier to jointly evaluate physical and transition shocks. In the shorter term, it is, however, likely possible to make some improvements, such as integrating the planetary boundaries threshold to mark out the planetarysafeoperatingspaceforhumanactivitiesanddirectlyincludingtippingpoints andregimeshiftsinqualitativenarratives(Häyhäetal.,2016).
Moreover, among the major pressures that lead to biodiversity loss, the introduction of invasive species is still missing in the narratives. Invasive species, however, pose significantthreatstoecosystemsandeconomies,notablyforhumanandanimalhealth(e.g. some species are disease vectors), for the agricultural (e.g., lower yields, affect soil quality, andincreasepestcontrolcosts),theforestry(e.g.,theycanthreatentreesandinsomecases leadtotheirdeath)and fishsector(e.g., displacement andextinction of native fishspecies) (Andersenet al.,2004;Olson, 2006;Stohlgren& Schnase, 2006).
The quantification of narratives and modeling of biodiversity scenarios remain shaped like climate scenarios. In the medium- to long-term, many improvements need to be made. Indeed, quantitative trajectories and models of change of direct and indirect pressures, including IAMs, offer only a superficial representation of sectors. The main sectors represented are the energy, agricultural (for the IAMs or GTAP model), and fish (for bioeconomic models) sectors. Some activities are thus absent from the analysis, such as mining or high-sea fishing (for the IAMs), although these sectors considerably impact biodiversity.Moreover,manymodelingissuesremainevenwithinthesectorsaccountedfor. Indeed, if an industry is specialized in organic farming or agro-ecology, its impacts on biodiversity will be different from those that practice intensive agriculture. The same is true forthefishingandenergysectors.Thisdifferentiationofpracticeswithinindustrieswillallow for a better understanding of transition policies in terms of both positive and negative incentives. Furthermore, this will enable the financial system to manage better risks, assets, liquidity,andoperations relatedtobiodiversityloss.
Toimprovethemodelingprocessofbiodiversityscenarios,wewanttoalertthereaderto two damage feedback loops missing from existing models (i.e., the orange arrows in Figure16) The first one corresponds to the consequences of biodiversity loss on economic activity and hence on countries' economic growth. This link is missing as the dynamics emergingoutofthebiodiversitymodeldonotinfluencethemodeldeterminingthechanges in direct and indirect factors (i.e. the SSP scenarios used as input are not impacted by biodiversity outcomes). As a result, the analysis is highly biased because if a scenario
projects the extinction of all species on earth, GDP will continue to grow for all countries worldwide. The second arrow represents the same mechanism, but this time for the loss of ESs.
Furthermore,thedynamicsofbiodiversityandESsmustfeedbackintothenarratives(i.e., thevioletfeedbackloopinFigure16).Theexogeneityofmodelvariables(e.g.,GDPandRCP) mustthusbequestionedandputintoperspectiveinthenarrativestobetterunderstandthe interactionsbetweentheeconomyandbiodiversity
Figure16. Proposal to improvebiodiversity scenarios development for BRFR analysis. The blue objects represent the current biodiversity scenario process, and theredreferstotheknowledgegap.
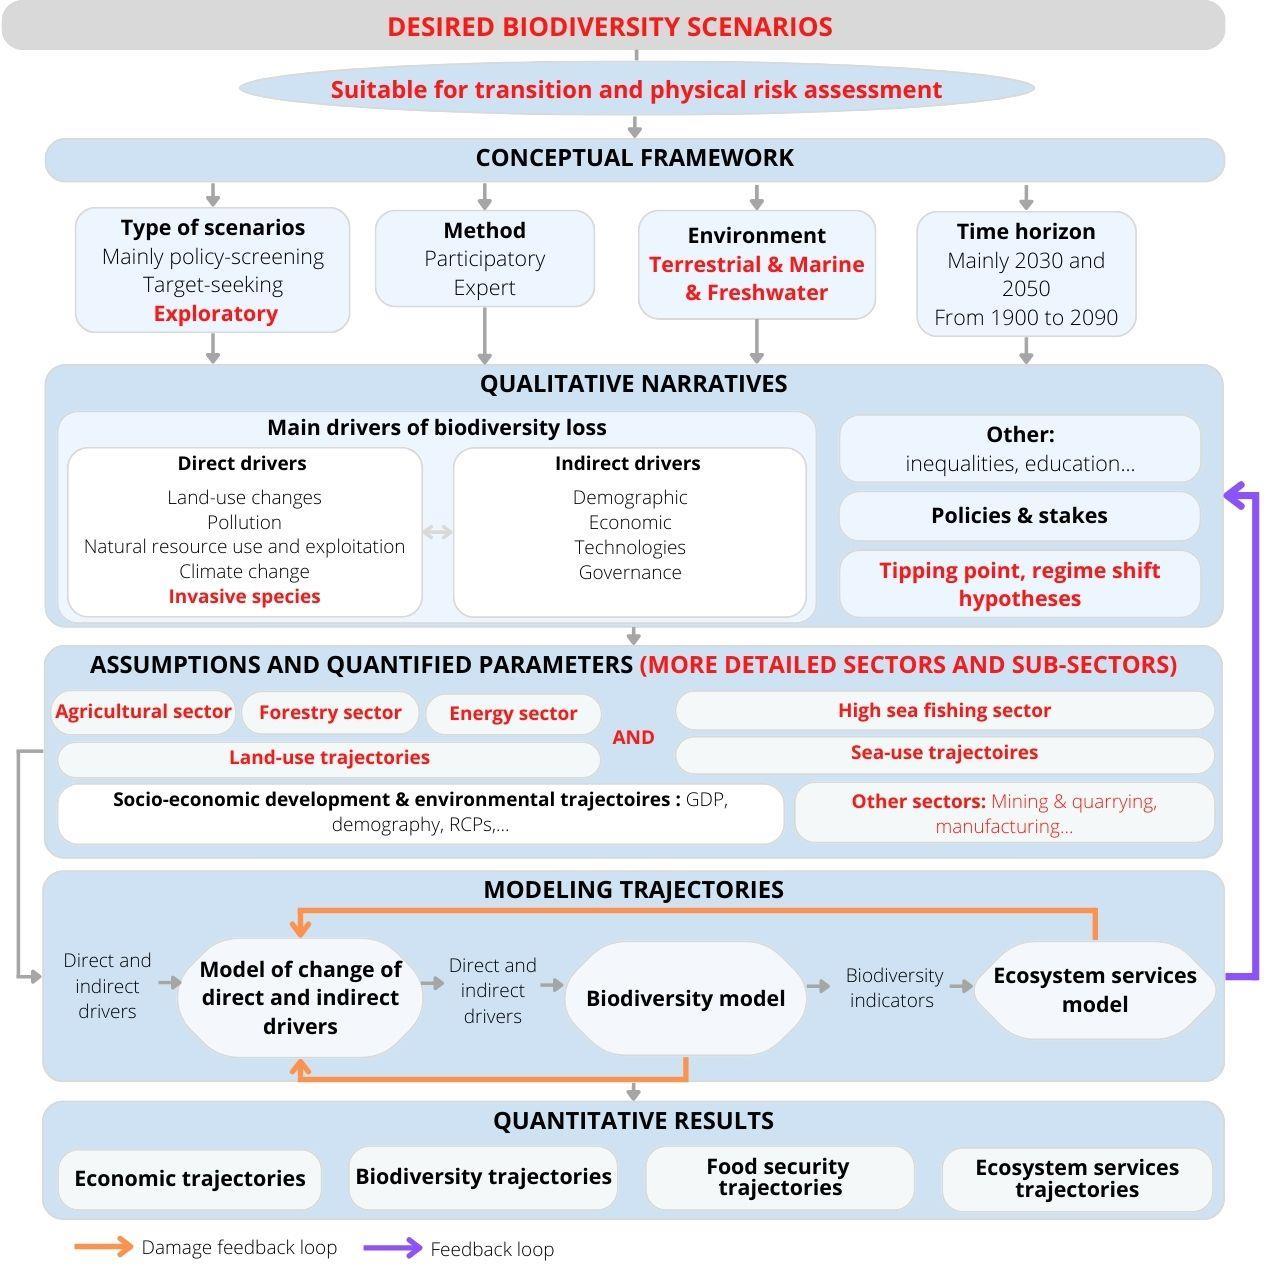
4.2. Shortrunandmediumrunresearchrecommendations
Wehavefoundonlyafewcomprehensiveandquantitativephysicalriskscenariosthatallow us to assess the risks of regime shifts in ESs. Well aware that building such comprehensive scenarios (and the model to simulate them) is a long-term process, we propose a solution to overcome this in the short term. These short-termrecommendations are intended forall entities likely to build biodiversity scenarios at national and international levels. It includes ministries of economy and finance to better target policies that can improve biodiversity, financial institutions/regulators to perform biodiversity stress tests, and the academic sphere to enhance our understanding of the interconnection between economic and biophysical dynamics
First, an alternative way of constructing physical risk scenarios would be to build methodologically on the Environmental Sustainability Gap (ESGAP) framework developed for European countries (Usubiaga-Liaño & Ekins, 2021a and 2021b) and being tested in other regions (ISPONRE & UCL, 2022; NEMA & UCL, 2022; WWF, 2020). The latest developments in Europe have led to the establishment of the Strong Environmental SustainabilityProgressIndex(SESPI), whichshowswhether countries are moving towards or away from good environmental state standards (Usubiaga-Liaño & Ekins, 2022). SESPI aggregate19indicatorsofcriticalenvironmentalfunctions.Foreachofthesesub-indicators, it measures whether, under current trends and under a targeted time horizon, the critical environmentalfunctionsareapproaching ormovingawayfromasafe operatingspace for theeconomyandthereforetheriskofencounteringatippingpoint
Based on the trends of the 19 environmental functions included in the European SESPI and withoutpredicting any tippingpoint,thismethodology allowstoconstructan"allelse being equal"biophysical risk scenario indicating which critical environmental functions are being degradedand whether aneconomyismovingtowards orawayfromtheprobabilitywhere some ES regime shifts are more likely to occur. However, to construct this, it would be necessary to specify the correspondence tables between ESGAP critical environmental functions and ENCORE ESs 32, which are unavailable yet and require further research. Research is also underway to conduct an economic assessment of the gap identified and translate itintoecologicaldebt.
Inaddition,oneapproachforassessingexpositiontotransitionriskswouldbetoworkon thecompatibilitybetweenIAMoutputsandEE-MRIOtablessuchasEXIOBASE33 orGLORIA (see Figure 17). As previously mentioned, the challenge is to offer a finer sectorial disaggregationoftheresultstoidentifyandlocatetheindustries/sectorsmostimpactedby anecological transition. Itisalready possible to obtain more precise resultson the different
32 ExploringNaturalCapitalOpportunities,Risks,andExposure(ENCORE) breaks downthe industry's direct and indirect dependence on ESs by business process. It also provides the level of dependence of an industry's activitiesonESs,fivescoresfromverylowtoveryhighare available.
33 The EE-MRIO EXIOBASE table offers informationon the valuechain(the value ofthe outputproduced, the value of intermediate consumption to produce it for each industry and region) of 163 industries in 49 world regions (189countries).
economic activities using the GTAP-AEZ model. Moreover, if scenario outputs are disaggregated at a fine sectorial level, it becomes possible to assess damages in terms of dependenciesofindustriesonESswithENCORE
If the link between IAM and EE-MRIO tables suggested above proves to be difficult, another alternativewouldbetoadaptrecentworkontransitionriskanalysisfortheclimatetothe case of biodiversity (Espagne et al., 2021). This alternative would consist of comparing the sectors dependent on and impacting biodiversity in a given country with its equivalents on the scale of equivalent biomes to identify possible innovation opportunities to reduce dependence orimpactonbiodiversityunderroughlyequal ecologicalconditions.
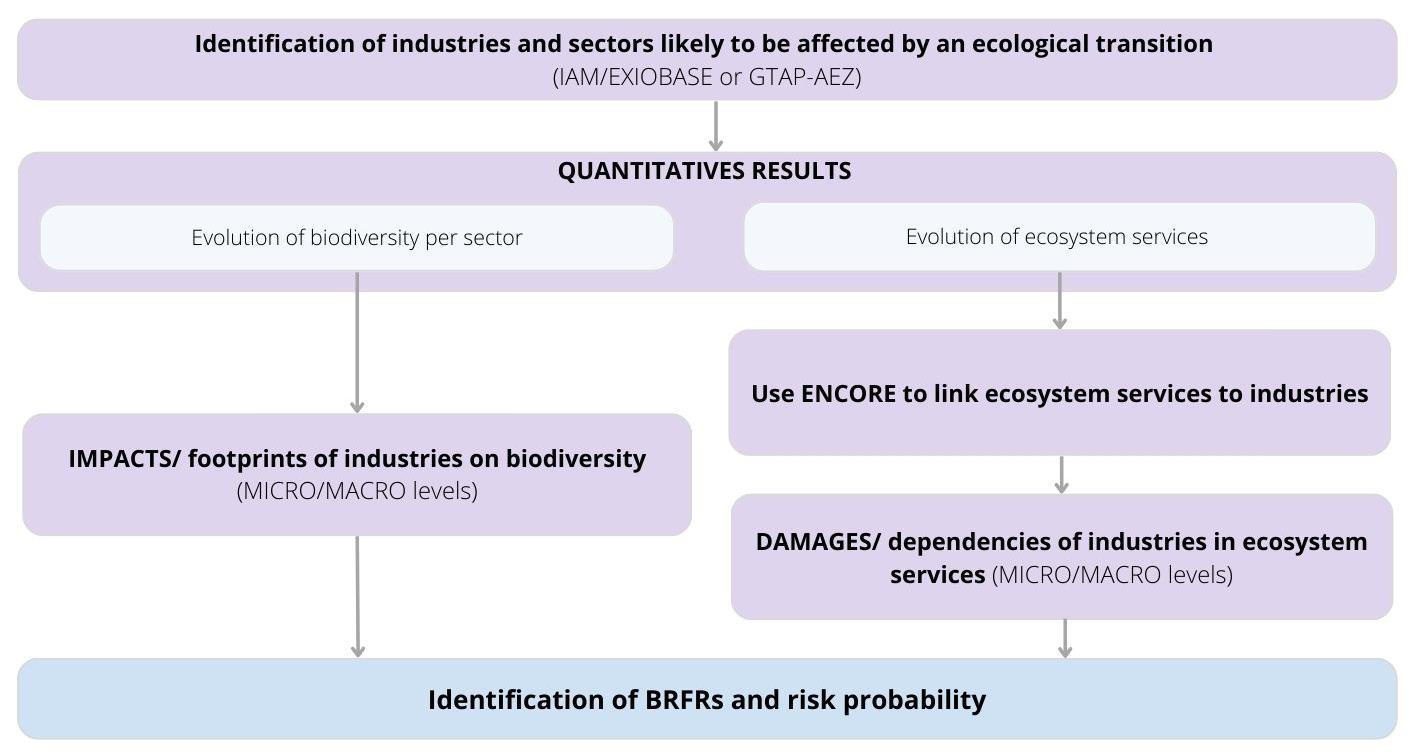 Figure17.Short-termpossibilitiesfortheassessmentoftransitionBRFR
Bibliography
ACPR-AMF.(2020). Les engagements climatiques des institutionsfinancièresfrançaises [Rapportcommun].Autoritéde contrôleprudentieletderésolution & Autoritédes MarchésFinanciers.
https://acpr.banquefrance.fr/sites/default/files/medias/ documents/20201218_rapport_vf.p
df
Agudelo,C.A.R.,Bustos,S.L.H. &Moreno,C.A.P.(2020).Modeling interactionsamongmultiple ecosystemservices.Acritical review.EcologicalModelling, 429, 109103.
Allan,J.R.,Venter,O. &Watson,J.E.M.(2017).Temporally inter-comparablemapsof terrestrialwilderness andthe Last ofthe Wild.ScientificData, 4(1), Article 1.
https://doi.org/10.1038/sdata.2017.187
Andersen,M.C.,Adams,H.,Hope,B. &Powell,M.(2004).Risk assessmentforinvasivespecies. RiskAnalysis: AnInternational Journal,24(4),787–793.
Appeltans,W.,Ahyong,S. T.,Anderson,G.,Angel,M.V.,Artois, T.,Bailly,N.,Bamber,R.,Barber,A., Bartsch,I.,Berta,A.,BłażewiczPaszkowycz,M.,Bock,P.,Boxshall, G.,Boyko,C.B.,Brandão,S.N.,Bray, R.A.,Bruce,N.L.,Cairns,S.D.,Chan, T.-Y.,…Costello,M.J.(2012).The MagnitudeofGlobalMarine SpeciesDiversity.Current Biology, 22(23),Article23.
https://doi.org/10.1016/j.cub.2012.09.0
Batten,S.,Sowerbutts,R., &Tanaka,M.(2016).Let’sTalkAbout the Weather:TheImpact of Climate Change onCentral Banks(SSRN ScholarlyPaper No.2783753).
https://doi.org/10.2139/ssrn.2783753
Battiston,S.,Mandel,A., Monasterolo,I.,Schütze,F., &Visentin,G.(2017). Aclimate stress-testofthefinancialsystem. Nature ClimateChange, 7(4),283
288.
Bolton,P.,Després,M.,Silva,L.A.P. da,Samama,F.&Svartzman,R. (2020).Thegreenswan.In BIS Books.Bankfor International Settlements.
https://ideas.repec.org/b/bis/bisbks /31.html
Bradshaw,C.J.A.,Ehrlich,P.R., Beattie,A.,Ceballos,G.,Crist,E., Diamond,J.,Dirzo,R.,Ehrlich,A.H., Harte,J.,Harte,M.E.,Pyke,G., Raven,P.H.,Ripple,W.J.,Saltré,F., Turnbull,C.,Wackernagel,M. &Blumstein,D.T.(2021). UnderestimatingtheChallengesof AvoidingaGhastlyFuture.Frontiers in ConservationScience, 1 https://doi.org/10.3389/fcosc.2020.61
5419
Brondizio,E.S.,Settele,J.,Díaz,S. &Ngo,H.T.(2019).Global assessmentreportonbiodiversity andecosystemservices
IntergovernmentalScience-Policy PlatformonBiodiversityand EcosystemServices(IPBES). IPBES secretariat, Bonn, Germany.1148 pages.
https://doi.org/10.5281/zenodo.38316
73
Büscher,B.,&Fletcher,R.(2020). The ConservationRevolution: RadicalIdeasforSavingNature BeyondtheAnthropocene.Verso Books.
Büscher,B.,Fletcher,R., Brockington,D.,Sandbrook,C., Adams,W.M.,Campbell,L., Corson,C.,Dressler,W.,Duffy,R., Gray,N.,Holmes,G.,Kelly,A., Lunstrum,E.,Ramutsindela,M. &Shanker,K.(2017).Half-Earthor WholeEarth?Radicalideas for conservation,andtheir implications.Oryx,51(3),Article3.
https://doi.org/10.1017/S00306053160
01228
Cahen-Fourot,L.,Campiglio,E., Godin,A.,Kemp-Benedict,E. &Trsek,S.(2021). Capitalstranding cascades:Theimpactof decarbonisationonproductive asset utilization. AFDResearch Papers 204, 1–32.
Calice,P.,DiazKalan,F.,&Miguel,F. (2021).Nature-RelatedFinancial RisksinBrazil [WorkingPaper]. WorldBank.
https://doi.org/10.1596/1813-94509759
Chenet,H.,Kedward,K.,RyanCollins,J.&vanLerven,F.(2022). Developingaprecautionary approachtofinancial policy:From climatetobiodiversity(Monograph No.2).GranthamResearchInstitute onClimateChange andthe Environment, LondonSchool of EconomicsandPoliticalScience.
https://www.inspiregreenfinance.or g/publications/
36
–
Cheung,W.W.L.,Jones,M.C.,Lam, V.W.Y.,Miller,D.,Ota,Y.,Teh,L. &Sumaila,U.R.(2017). Transform highseasmanagementtobuild climateresilienceinmarine seafoodsupply. FishandFisheries, 18(2),Article 2. https://doi.org/10.1111/faf.12177
Cheung,W.W.L.,Reygondeau,G. &Frölicher,T.L.(2016).Large benefitstomarinefisheriesof meetingthe1.5°Cglobalwarming target.Science, 354(6319), Article 6319.
https://doi.org/10.1126/science.aag2
331
Cheung,W.W.,Lam,V.W. &Wabnitz,C.C.(2019).Future scenariosandprojectionsfor fisheriesonthehighseasunder a changingclimate.IIED,London,43.
Costello,C.,Ovando,D.,Clavelle,T., Strauss,C.K.,Hilborn,R., Melnychuk,M.C.,Branch,T.A., Gaines,S.D.,Szuwalski,C.S., Cabral,R.B.,Rader,D.N.&Leland,A. (2016).Global fisheryprospects undercontrastingmanagement regimes.Proceedingsofthe National AcademyofSciences, 113(18), Article18.
https://doi.org/10.1073/pnas.15204201
13
Dasgupta,P.(2021). Theeconomics ofbiodiversity: TheDasgupta review:fullreport(Updated:18 February 2021).HMTreasury. https://www.researchgate.net/profi le/EmilyMckenzie/publication/353393358_T he_Economics_of_Biodiversity_The _Dasgupta_Review_Full_Report/lin ks/60f9eaf2169a1a0103aef136/TheEconomics-of-Biodiversity-TheDasgupta-Review-Full-Report.pdf
Daw,T.M.,Cinner,J.E., McClanahan,T.R.,Brown,K.,Stead, S.M.,Graham,N.A.J.,&Maina,J. (2012).ToFishor NottoFish:Factors atMultipleScalesAffecting Artisanal Fishers’Readiness toExita DecliningFishery.PLoSONE,7(2), Article2.
https://doi.org/10.1371/journal.pone.0 031460
Dellink,R.,Chateau,J.,Lanzi,E. &Magné,B.(2017). Long-term economic growthprojectionsin the SharedSocioeconomic Pathways.GlobalEnvironmental Change,42,200–214.
DGTreasury,F.(2017). Assessing climatechange-relatedrisksinthe bankingsector.Synthesisofthe ProjectReportSubmittedforPublic ConsultationwithRegardtoArticle, 173
Dietrich,J.P.,Schmitz,C.,LotzeCampen,H.,Popp,A.&Müller,C. (2014).Forecastingtechnological changeinagriculture. An endogenous implementationina globallandusemodel. TechnologicalForecastingand SocialChange,81,236–249. https://doi.org/10.1016/j.techfore.2013.
02.003
Doelman,J.C.,Stehfest,E.,Tabeau, A.,vanMeijl,H.,Lassaletta,L., Gernaat,D.E.H.J.,Hermans,K., Harmsen,M.,Daioglou,V., Biemans,H.,vanderSluis,S. &vanVuuren,D.P.(2018). Exploring SSPland-usedynamics usingthe IMAGEmodel: Regionalandgridded scenariosofland-usechangeand land-basedclimatechange mitigation.Global Environmental Change,48,119–135. https://doi.org/10.1016/j.gloenvcha.20
17.11.014
Esch,vanderS.(2016). THEGLOBIO MODEL-Atechnicaldescriptionof version3.5 PBLNetherlands EnvironmentalAssessmentAgency https://policycommons.net/artifact s/2187899/the-globiomodel/2943876/
Espagne,É.,Godin,A.,Guilherme Magacho,Mantes,A.&Yilmaz,D. (2021).Developingcountries’ macroeconomicexposure tothe low-carbontransition.AFD ResearchPapers,220, 1–42.
Ferrier,S.,Ninan,K.N.,Leadley,P., Alkemade,R.,Acosta-Michlik,L., Akçakaya,H.R.,Kabubo-Mariara, J.,Lundquist,C.,Obersteiner,M., Pereira,H.,Peterson,G.,PichsMadruga,R.,Ravindranath,N.H., Rondinini,C.&Wintle,B.(2016). Summaryforpolicymakersofthe assessmentreportofthe methodological assessmentof scenariosandmodelsof biodiversity andecosystem services(p.32).Intergovernmental Science-PolicyPlatformon BiodiversityandEcosystem Services(IPBES).
https://ipbes.net/sites/default/files/ downloads/pdf/SPM_Deliverable_3 c.pdf
FinanceWatch.(2022).Nature’s Return.Embeddingenvironmental goals atthe heartofeconomic and financial decision-making[Finance Watchreport].
https://www.financewatch.org/wpcontent/uploads/2020/05/NaturesReturn_Finance-WatchReport_May2020.pdf
Fisheries,F.A.O.,Aquaculture Department,M.,&Service,I.F. (2011).Reviewofthestate ofworld marine fishery resources.Foodand AgricultureOrganizationofthe UnitedNationsRome.
Folke,C.,Carpenter,S.,Walker,B., Scheffer,M.,Elmqvist,T., Gunderson,L.&Holling,C.S. (2004).Regimeshifts,resilience, andbiodiversityinecosystem management.Annual Reviewof Ecology,Evolution, andSystematics, 557–581.
Fujimori,S.,Hasegawa,T.,Masui,T. &Takahashi,K.(2014).Landuse representationinaglobalCGE modelforlong-termsimulation: CETvs.logitfunctions. Food Security, 6(5),Article 5. https://doi.org/10.1007/s12571-0140375-z
Fujimori,S.,Hasegawa,T.,Masui,T., Takahashi,K.,Herran,D.S.,Dai,H., Hijioka,Y.&Kainuma,M.(2017).
SSP3: AIMimplementationof SharedSocioeconomicPathways. GlobalEnvironmental Change,42, 268–283.
https://doi.org/10.1016/j.gloenvcha.20
16.06.009
G7ClimateandEnvironment. (2021).G7Climateand Environment:Ministers’ Communiqué,London,21May2021 GOV.UK.
https://www.gov.uk/government/pu blications/g7-climate-andenvironment-ministers-meetingmay-2021-communique/g7climate-and-environmentministers-communique-london-21may-2021
Gardner,J.L.,Peters,A.,Kearney, M.R.,Joseph,L.&Heinsohn,R.(2011).
Decliningbodysize:Athirduniversal response towarming? Trendsin Ecology&Evolution,26(6), Article6. https://doi.org/10.1016/j.tree.2011.03.005
Garnett,T.,Appleby,M.C., Balmford,A.,Bateman,I.J.,Benton, T.G.,Bloomer,P.,Burlingame,B., Dawkins,M.,Dolan,L.,Fraser,D., Herrero,M.,Hoffmann,I.,Smith,P., Thornton,P.K.,Toulmin,C., Vermeulen,S.J.,&Godfray,H.C.J. (2013).SustainableIntensificationin Agriculture:PremisesandPolicies. Science, 341(6141),Article6141. https://doi.org/10.1126/science.12344 85
Geldmann,J.,Barnes,M.,Coad,L., Craigie,I.D.,Hockings,M.& Burgess,N.D.(2013).Effectiveness ofterrestrialprotectedareasin reducinghabitatloss and populationdeclines.Biological Conservation,161, 230–238. https://doi.org/10.1016/j.biocon.2013.0
2.018
Godin,A.,&Hadji-Lazaro,P.(2022). Identificationdesvulnérabilités àla transitioninduitesparlademande : Applicationd’une approche systémique àl’AfriqueduSud. Revue Économique, 73(2), 267–301.
Halpern,B.S.,Lester,S.E.,&McLeod, K.L.(2010).Placingmarine protectedareasontothe ecosystem-basedmanagement seascape.Proceedingsofthe National AcademyofSciences, 107(43),Article43.
https://doi.org/10.1073/pnas.0908503
107
Havlík,P.,Valin,H.,Herrero,M., Obersteiner,M.,Schmid,E.,Rufino, M.C.,Mosnier,A.,Thornton,P.K., Böttcher,H.,Conant,R.T.,Frank,S., Fritz,S.,Fuss,S.,Kraxner,F.& Notenbaert,A.(2014). Climate changemitigationthrough livestocksystemtransitions.
Proceedings ofthe National Academy of Sciences,111(10), Article 10.
https://doi.org/10.1073/pnas.13080441 11
Häyhä,T.,Lucas,P.L.,vanVuuren, D.P.,Cornell,S.E.,&Hoff,H.(2016). FromPlanetaryBoundariesto nationalfairsharesoftheglobal safeoperatingspace.Howcanthe scalesbebridged? Global EnvironmentalChange,40,60–72.
Hinchliffe,S.,&Whatmore,S. (2006). Livingcities:Towards a politicsofconviviality. Scienceas Culture, 15(2), Article2.
https://doi.org/10.1080/09505430600 707988
Hirsch,T.,Mooney,K.,&Cooper,D. (2020). GlobalBiodiversity Outlook5.Secretariatofthe ConventiononBiologicalDiversity.
https://www.cbd.int/gbo/gbo5/publ ication/gbo-5-en.pdf
ISPONRE&UCL.(2021).Strong EnvironmentalSustainability in Vietnam.PilotingtheEnvironmental Sustainability GapFramework (ESGAP)andStrongEnvironmental SustainabilityIndex(SESI)[Report for Agence Française de Développement].
https://www.afd.fr/sites/afd/files/20 22-06-03-17-
23/S%C3%A9rie%20grise_ESGAP%20 Vietnam%20Report_March%202023. pdf
Johnson,J.A.,Ruta,G.,Baldos,U., Cervigni,R.,Chonabayashi,S., Corong,E.,Gavryliuk,O.,Gerber,J., Hertel,T.,Nootenboom,C.,& Polasky,S.(2021).TheEconomic CaseforNature: AGlobalEarthEconomyModel toAssess DevelopmentPolicyPathways WorldBank.
https://doi.org/10.1596/35882
KC,S.(2020). Updated demographicSSP4andSSP5 scenarioscomplementingthe SSP1-3scenariospublishedin2018
KC,S.&Lutz,W.(2017).The human core ofthesharedsocioeconomic pathways: Populationscenarios by age,sex andlevelofeducationfor allcountriesto2100.Global EnvironmentalChange,42, 181–192.
Kc,S.&Lutz,W.(2017).Thehuman core ofthesharedsocioeconomic pathways: Populationscenarios by age,sex andlevelofeducationfor allcountriesto2100.Global EnvironmentalChange,42, 181–192. https://doi.org/10.1016/j.gloenvcha.20
14.06.004
Kedward,K.,Ryan-Collins,J. &Buller,A.(2021). Quantitative EasingandNatureLoss:Exploring Nature-RelatedFinancial Risksand Impacts inthe EuropeanCentral Bank’s Corporate BondPortfolio (SSRNScholarlyPaper No.3922913). https://doi.org/10.2139/ssrn.3922913
Kedward,K.,Ryan-Collins,J.,& Chenet,H.(2020). Managing Nature-RelatedFinancial Risks:A Precautionary Policy Approachfor Central BanksandFinancial Supervisors(SSRNScholarlyPaper ID3726637;IssueID3726637).Social ScienceResearchNetwork. https://doi.org/10.2139/ssrn.3726637
Keen,S.(2021).The appallinglybad neoclassicaleconomicsofclimate change.Globalizations,18(7),1149–1177.
Kim,H.,Rosa,I.,Alkemade,R., Leadley,P.,Hurtt,G.,Popp,A.,Van Vuuren,D.P.,Anthoni,P.,Arneth,A., Baisero,D.,&others.(2018). A protocolforanintercomparisonof biodiversity andecosystem servicesmodelsusingharmonized land-useandclimatescenarios.
GeoscientificModelDevelopment 11(11),4537
4562.
Kindermann,G.E.,Obersteiner,M., Rametsteiner,E.&McCallum,I. (2006). Predictingthe deforestation-trendunder different carbon-prices.CarbonBalance andManagement,1(1),Article 1. https://doi.org/10.1186/1750-0680-115
Kok,M.T.J.,Kok,K.,Peterson,G.D., Hill,R.,Agard,J.&Carpenter,S.R. (2017). Biodiversity andecosystem servicesrequireIPBEStotakenovel approachtoscenarios.
SustainabilityScience, 12(1),Article1. https://doi.org/10.1007/s11625-0160354-8
Kok,M.T.J.,Meijer,J.R.,vanZeist, W.-J.,Hilbers,J.P.,Immovilli,M., Janse,J.H.,Stehfest,E., Bakkenes,M.,Tabeau,A., Schipper,A.M.,&Alkemade,R. (2020).Assessingambitiousnature conservationstrategieswithina2 degreewarmer andfood-secure world[Preprint].Ecology.
https://doi.org/10.1101/2020.08.04.236
489
Kremen,C.(2020).Ecological intensificationanddiversification approachestomaintain biodiversity,ecosystemservices andfoodproductioninachanging world.EmergingTopicsin Life Sciences,4(2),229–240.
Leclère,D.,Obersteiner,M.,Barrett, M.,Butchart,S.H.M.,Chaudhary,A., DePalma,A.,DeClerck,F.A.J.,Di Marco,M.,Doelman,J.C.,Dürauer, M.,Freeman,R.,Harfoot,M., Hasegawa,T.,Hellweg,S.,Hilbers, J.P.,Hill,S.L.L.,Humpenöder,F., Jennings,N.,Krisztin,T.,…Young,L. (2020).Bendingthecurveof terrestrialbiodiversityneedsan integratedstrategy. Nature 585(7826),Article 7826.
https://doi.org/10.1038/s41586-0202705-y
Martini,R.,&Lindberg,C.(2013). Fishingfor Tomorrow:Managing fisheries forsustainable development.OECD,2(4),Article4.
MillenniumEcosystem Assessment(Program)(Ed.). (2005). Ecosystems andhuman well-being:Synthesis.IslandPress.
NEMA&UCL.(2022). Strong EnvironmentalSustainability in Kenya.Acasestudy inthe EnvironmentalSustainability Gap Framework(ESGAP)andStrong EnvironmentalSustainability Index (SESI) [Reportfor AgenceFrançaise deDéveloppement].
https://www.afd.fr/sites/afd/files/2022 -06-03-0559/S%C3%A9rie%20grise_ESGAP%20Ke nya%20Report_March%202023.pdf
NGFS.(2019). Acallfor action
Climatechangeasasourceof financialrisk[Firstcomprehensive report].NetworkforGreeningthe FinancialSystem.
https://www.ngfs.net/en/firstcomprehensive-report-call-action
NGFS-INSPIREStudyGroup.(2022). Central bankingandsupervisionin the biosphere: Anagendafor actiononbiodiversityloss,financial riskandsystemstabilty (NGFS Occasional Paper) [NGFS Occasional Paper].NGFS-INSPIRE.
https://www.ngfs.net/sites/default/fi les/medias/documents/central_ba nking_and_supervision_in_the_bio sphere.pdf
Obersteiner,M.,Walsh,B.,Frank,S., Havlík,P.,Cantele,M.,Liu,J., Palazzo,A.,Herrero,M.,Lu,Y., Mosnier,A.,Valin,H.,Riahi,K., Kraxner,F.,Fritz,S.,&vanVuuren, D.(2016). Assessingthe land resource–foodpricenexus ofthe Sustainable DevelopmentGoals. ScienceAdvances,2(9), Article9. https://doi.org/10.1126/sciadv.1501499
–
OECD.(2019).Biodiversity:Finance andtheEconomicandBusiness CaseforAction.OECDPublishing Paris.
https://doi.org/10.1787/a3147942-en
OECD.(2020a).Towards SustainableLandUse:Aligning Biodiversity, Climate andFood Policies.OECDPublishing.
https://doi.org/10.1787/3809b6a1-en
OECD.(2020b).AComprehensive OverviewofGlobalBiodiversity Finance(p.41).Organisationfor EconomicCooperationand Development.
https://www.oecd.org/environment /resources/biodiversity/report-acomprehensive-overview-ofglobal-biodiversity-finance.pdf
Olson,L.J.(2006). Theeconomics ofterrestrialinvasivespecies:A reviewofthe literature. Agricultural andResourceEconomicsReview 35(1),178
194.
O’Neill,B.C.,Kriegler,E.,Ebi,K.L., Kemp-Benedict,E.,Riahi,K., Rothman,D.S.,vanRuijven,B.J., vanVuuren,D.P.,Birkmann,J., Kok,K.,Levy,M.,&Solecki,W. (2017).Theroadsahead:Narratives forsharedsocioeconomic pathwaysdescribingworldfutures inthe 21stcentury.Global EnvironmentalChange,42, 169–180.
https://doi.org/10.1016/j.gloenvcha.20 15.01.004
O’Neill,B.C.,Kriegler,E.,Riahi,K., Ebi,K.L.,Hallegatte,S.,Carter,T.R., Mathur,R.,&vanVuuren,D.P. (2014).Anewscenarioframework forclimatechangeresearch:The conceptofsharedsocioeconomic pathways.ClimaticChange,122(3), Article 3.
https://doi.org/10.1007/s10584-0130905-2
Otero,I.,Farrell,K.N.,Pueyo,S., Kallis,G.,Kehoe,L.,Haberl,H., Plutzar,C.,Hobson,P.,GarcíaMárquez,J.,Rodríguez-Labajos,B., &others.(2020).Biodiversity policy beyondeconomicgrowth. ConservationLetters, 13(4),e12713.
Pachauri,R.&Meyer,L.(2014). Climate Change2014:Synthesis Report.ContributionofWorking GroupsI,IIandIIItotheFifth AssessmentReportofthe IntergovernmentalPanel on Climate Change. [CoreWriting Team,R.K.Pachauri andL.A.Meyer (eds.)].IPCC,Geneva,Switzerland, 151pp.
Pereira,H.M.,Rosa,I.M.D., Martins,I.S.,Kim,H.,Leadley,P., Popp,A.,Vuuren,D.P.van,Hurtt,G., Anthoni,P.,Arneth,A.,Baisero,D., Chaplin-Kramer,R.,Chini,L., Fulvio,F.D.,Marco,M.D.,Ferrier,S., Fujimori,S.,Guerra,C.A.,Harfoot, M.,…Alkemade,R.(2020). Global trends inbiodiversity and ecosystemservicesfrom 1900to 2050(p.2020.04.14.031716).bioRxiv.
https://doi.org/10.1101/2020.04.14.03171 6
Phalan,B.,Green,R.E.,Dicks,L.V., Dotta,G.,Feniuk,C.,Lamb,A., Strassburg,B.B.N.,Williams,D.R., Ermgassen,E.K.H.J.zu,& Balmford,A.(2016). Howcan higher-yieldfarminghelptospare nature?Science, 351(6272),Article 6272.
https://doi.org/10.1126/science.aad0
055
Pompa,S.,Ehrlich,P.R.,&Ceballos,G. (2011).Global distributionand conservationofmarinemammals. Proceedings ofthe National Academy of Sciences 108(33),Article 33.
https://doi.org/10.1073/pnas.1101525108
Popp,A.,Calvin,K.,Fujimori,S., Havlik,P.,Humpenöder,F., Stehfest,E.,Bodirsky,B.L.,Dietrich, J.P.,Doelmann,J.C.,Gusti,M., Hasegawa,T.,Kyle,P., Obersteiner,M.,Tabeau,A., Takahashi,K.,Valin,H.,Waldhoff, S.,Weindl,I.,Wise,M.,…Vuuren,D. P.van.(2017).Land-usefuturesin thesharedsocio-economic pathways.GlobalEnvironmental Change,42, 331–345.
https://doi.org/10.1016/j.gloenvcha.20 16.10.002
Popp,A.,Dietrich,J.P.,LotzeCampen,H.,Klein,D.,Bauer,N., Krause,M.,Beringer,T.,Gerten,D.& Edenhofer,O.(2011). Theeconomic potentialofbioenergyforclimate changemitigationwithspecial attentiongiventoimplicationsfor the landsystem. Environmental ResearchLetters,6(3),Article 3.
https://doi.org/10.1088/17489326/6/3/034017
Popp,A.,Humpenöder,F.,Weindl,I., Bodirsky,B.L.,Bonsch,M.,LotzeCampen,H.,Müller,C.,Biewald,A., Rolinski,S.,Stevanovic,M. &Dietrich,J.P.(2014). Land-use protectionforclimatechange mitigation.NatureClimate Change, 4(12),Article 12.
https://doi.org/10.1038/nclimate2444
Pörtner,H.-O.,Scholes,R.J.,Agard, J.,Archer,E.,Bai,X.,Barnes,D., Burrows,M.,Chan,L.,Cheung,W.L. (William),Diamond,S.,Donatti,C., Duarte,C.,Eisenhauer,N.,Foden,W., Gasalla,M.A.,Handa,C.,Hickler,T., Hoegh-Guldberg,O.,Ichii,K.,…Ngo, H.(2021).IPBES-IPCCco-sponsored workshopreportonbiodiversity and climatechange.Zenodo.
https://doi.org/10.5281/zenodo.5101133
–
Regelink,M.,Reinders,H.J., Vleeschhouwer,M.&vandeWiel,I. (2017).Waterproof?Anexplorationof climate-relatedrisksforthe Dutch financialsector. DeNederlandsche Bank.
https://www.dnb. nl/en/binaries/Waterproof_tcm47363851.pdf
Riahi,K.,Bertram,C.,Huppmann, D.,Rogelj,J.,Bosetti,V.,Cabardos, A.-M.,Deppermann,A.,Drouet,L., Frank,S.,Fricko,O.,Fujimori,S., Harmsen,M.,Hasegawa,T.,Krey, V.,Luderer,G.,Paroussos,L., Schaeffer,R.,Weitzel,M.,vander Zwaan,B.,…Zakeri,B.(2021).Cost andattainability ofmeeting stringentclimate targets without overshoot.Nature ClimateChange, 11(12),Article12.
https://doi.org/10.1038/s41558-02101215-2
Riahi,K.,Dentener,F.,Gielen,D., Grubler,A.,Jewell,J.,Klimont,Z., Krey,V.,McCollum,D.L.,Pachauri, S.,Rao,S.,vanRuijven,B.,van Vuuren,D.P.,&Wilson,C.(2012). Energy pathwaysforsustainable development(G.W.Team,Ed.;p. pp.1203-1306).Cambridge UniversityPress andIIASA. http://www.globalenergyassessme nt.org
Riahi,K.,vanVuuren,D.P.,Kriegler, E.,Edmonds,J.,O’Neill,B.C., Fujimori,S.,Bauer,N.,Calvin,K., Dellink,R.,Fricko,O.,Lutz,W.,Popp, A.,Cuaresma,J.C.,Kc,S., Leimbach,M.,Jiang,L.,Kram,T., Rao,S.,Emmerling,J.,…Tavoni,M. (2017). TheSharedSocioeconomic Pathwaysandtheirenergy,land use,andgreenhouse gas emissionsimplications: An overview.Global Environmental Change,42, 153–168. https://doi.org/10.1016/j.gloenvcha.20 16.05.009
Rosenzweig,C.,Elliott,J.,Deryng, D.,Ruane,A.C.,Müller,C.,Arneth, A.,Boote,K.J.,Folberth,C.,Glotter, M.,Khabarov,N.,Neumann,K., Piontek,F.,Pugh,T.A.M.,Schmid, E.,Stehfest,E.,Yang,H.,&Jones,J. W.(2014).Assessingagricultural risks ofclimatechangeinthe21st century inaglobalgriddedcrop modelintercomparison.
Proceedings ofthe National Academy of Sciences,111(9), Article9. https://doi.org/10.1073/pnas.12224631
10
Schipper,A.M.,Hilbers,J.P.,Meijer, J.R.,Antão,L.H.,Benítez-López,A., deJonge,M.M.J.,Leemans,L.H., Scheper,E.,Alkemade,R., Doelman,J.C.,Mylius,S.,Stehfest, E.,vanVuuren,D.P.,vanZeist,W.-J. &Huijbregts,M.A.J.(2020).
Projectingterrestrial biodiversity intactness withGLOBIO4.Global Change Biology 26(2),Article 2. https://doi.org/10.1111/gcb.14848
Stehfest,Elke,vanVuuren,Detlef, Bouwman,L.&Kram,Tom.(2014). IntegratedAssessmentofGlobal EnvironmentalChangewithIMAGE
3.0: Model descriptionandpolicy applications.Netherlands Environmental AssessmentAgency (PBL).
https://dspace.library.uu.nl/handle/1 874/308545
Stohlgren,T.J.,&Schnase,J.L. (2006).Riskanalysisforbiological hazards: Whatwe needtoknow aboutinvasivespecies.Risk
Analysis:AnInternational Journal, 26(1), 163–173.
Sumaila,U.R.,Lam,V.,LeManach, F.,Swartz,W.&Pauly,D.(2016). Globalfisheriessubsidies:An updatedestimate.Marine Policy, 69, 189–193.
https://doi.org/10.1016/j.marpol.2015.1
2.026
Svartzman,R.,Espagne,E., Gauthey,J.,Hadji-Lazaro,P.,Salin, M.,Allen,T.,Berger,J.,Calas,J., Godin,A.,&Vallier,A.(2021). A “SilentSpring”fortheFinancial System?ExploringBiodiversityRelatedFinancialRisks inFrance.In Workingpapers(No.826;Working Papers, Issue826).Banquede France.
https://ideas.repec.org/p/bfr/banfr a/826.html
TCFD.(2017). TCFD
RecommendationsTechnical
Supplement:The Use of Scenario AnalysisinDisclosureofClimaterelated Risks andOpportunities
https://www.tcfdhub.org/resource/t cfd-recommendations-technicalsupplement-the-use-of-scenarioanalysis-in-disclosure-of-climaterelated-risks-and-opportunities/
Teh,L.,Lam,V.,Cheung,W.,Miller, D.,Teh,L.&Sumaila,U.R.(2017). Impactofhighseasclosureon foodsecurityinlow-incomefishdependentcountries.InHandbook ontheEconomicsand Management of Sustainable Oceans.EdwardElgar Publishing.
Titeux,N.,Henle,K.,Mihoub,J.-B., Regos,A.,Geijzendorffer,I.R., Cramer,W.,Verburg,P.H.& Brotons,L.(2016).Biodiversity scenariosneglectfuture land-use changes.GlobalChangeBiology, 22(7), Article7. https://doi.org/10.1111/gcb.13272
Tittonell,P.(2014).Ecological intensificationofagriculture Sustainable by nature. Current OpinioninEnvironmental Sustainability,8,53–61.
https://doi.org/10.1016/j.cosust.2014.0
8.006
TNFD.(2021). ProposedTechnical ScopeforTNFD.Taskforce on Nature-relatedFinancial Disclosures.
https://tnfd.global/wpcontent/uploads/2021/07/TNFD%E2%80%93-Technical-Scope-3.pdf
Turner,M.G.,Calder,W.J., Cumming,G.S.,Hughes,T.P., Jentsch,A.,LaDeau,S.L.,Lenton,T. M.,Shuman,B.N.,Turetsky,M.R., Ratajczak,Z.,Williams,J.W., Williams,A.P.,&Carpenter,S.R. (2020).Climatechange, ecosystemsandabruptchange: Sciencepriorities.Philosophical Transactions ofthe RoyalSocietyB: Biological Sciences,375(1794), Article 1794. https://doi.org/10.1098/rstb.2019.0105
Turnhout,E.,Waterton,C.,Neves, K.,&Buizer,M.(2013). Rethinking biodiversity:Fromgoodsand servicesto“livingwith.” ConservationLetters, 6(3),Article 3. https://doi.org/10.1111/j.1755263X.2012.00307.x
UN.(2022).WorldPopulation Prospects2022:Summary of Results.UnitedNationsDepartment ofEconomicandSocialAffairs, Population….
UNDPSustainableInsurance Forum.(2021). SIFScopingStudy: Nature-related Risksinthe Global InsuranceSector.UnitedNations DevelopmentProgramme. https://www.sustainableinsurancef orum.org/view_pdf.php?pdf_file=w p-content/uploads/2021/11/UNDPSIF-Scoping-Study_NatureRelated-Risks-in-the-GlobalInsurance-Sector.pdf
Usubiaga-Liaño,A.,&Ekins,P. (2022).Areweontherightpath? Measuringprogress towards environmentalsustainability in Europeancountries.Sustainability Science, 1–16.
Usubiaga-Liaño,A.,&Ekins,P. (2021a).Time forScience-Based National TargetsforEnvironmental Sustainability:AnAssessmentof ExistingMetrics andtheESGAP Framework.Frontiers in EnvironmentalScience,524.
Usubiaga-Liaño,A.,&Ekins,P. (2021b).Monitoringthe
environmentalsustainability of countriesthroughthestrong environmentalsustainability index. EcologicalIndicators,132,108281.
vanToor,J.,Piljic,D.,Schellekens, G.,vanOorschot,M.,&Kok,M. (2020).Indebtedtonature, Exploringbiodiversityrisksforthe Dutchfinancialsector. DeNederlandscheBank& PlanbureauVoor de Leefomgeving https://www.dnb.nl/media/4c3fqaw d/indebted-to-nature.pdf
vanVuuren,D.P.,Edmonds,J., Kainuma,M.,Riahi,K.,Thomson,A., Hibbard,K.,Hurtt,G.C.,Kram,T., Krey,V.,Lamarque,J.-F.,Masui,T., Meinshausen,M.,Nakicenovic,N., Smith,S.J.,&Rose,S.K.(2011).The representativeconcentration pathways: Anoverview.Climatic Change,109(1),Article 1.
https://doi.org/10.1007/s10584-0110148-z
vanVuuren,D.P.,Kriegler,E., O’Neill,B.C.,Ebi,K.L.,Riahi,K., Carter,T.R.,Edmonds,J., Hallegatte,S.,Kram,T.,Mathur,R., &Winkler,H.(2014).Anewscenario frameworkforClimateChange Research:Scenariomatrix architecture. ClimaticChange, 122(3),Article3. https://doi.org/10.1007/s10584-0130906-1
Waldron,A.,Adams,V.,Allan,J., Arnell,A.,Asner,G.,Atkinson,S., Baccini,A.,Baillie,E.,Balmford,A., Beau,J.A.,Brander,L.,Brondizio,E., Bruner,A.,Burgess,N.,Burkart,K., Butchart,S.,Button,R.,Carrasco, R.,Cheung,W.,…Zhang,Y.(2020). Protecting30%ofthe planetfor nature:Costs,benefits and economicimplications.58.
WEF.(2021). Theglobalrisksreport 2021insightreport(16thed).World EconomicForum.
https://www3.weforum.org/docs/W EF_The_Global_Risks_Report_2021.p df
Welsby,D.,Price,J.,Pye,S.&Ekins, P.(2021). Unextractablefossil fuels ina1.5°Cworld. Nature,597(7875), Article7875.
Wise,M.,Calvin,K.,Kyle,P., Luckow,P.&Edmonds,J.(2014). Economicandphysicalmodeling oflanduse ingcam3.0andan applicationtoagricultural productivity,land, andterrestrial carbon.ClimateChange Economics,05(02),Article 02. https://doi.org/10.1142/S201000781450 0031
WorldBank&Malaysia(BNM),B.N. (2022). AnExplorationof NatureRelatedFinancial RisksinMalaysia WorldBank.
https://openknowledge.worldbanko rg/handle/10986/37314
WWF.(2020). LivingPlanetReport 2020:BendingtheCurveof BiodiversityLoss(Almond,R.E.A., GrootenM.andPetersen, T.(Eds)). https://livingplanet.panda.org/enus/
Appendices
1. DetailedSharedSocio-economicPathways(SSPs)
SSP1 Sustainability - Taking the Green Road (few mitigation and adaptation challenges): Gradually, the worldis moving toward a more sustainable path within environmental limits. Management of the commons is slowly improving through cooperation and collaboration among nations and within countries, including the private sector and civil society. Governments are increasing their education and health investments, accentuating the demographic transition to a relatively low total population. Currently, wealthy countries focusonhumanwell-beingratherthaneconomicgrowth,whichislowerinthelong-run.The commitment of societies to meet development goals is accelerating, and this is beginning toreduceinequalitiesbetweenandwithincountries.Materialconsumptionisgrowingslowly, andresource andenergyintensitiesare decliningwhileimprovingtheenvironment.
This world strongly regulates land-use; for example, deforestation in tropical forests is drasticallyreduced.Cropyieldsareincreasingrapidlyinpoorandmiddle-incomecountries, allowing them to catch up with richer countries. Diets are becoming healthier, with fewer animal calories and food waste. As the world is globalized, food is traded freely. All GHG emissionsfromland-useare facing acarbonpriceequivalenttothe energysector.
SSP2 Middle of the Road (medium-high mitigation and adaptation challenges): This world corresponds to the projection of historical socio-economic and technological trends into the future. Inequalities persist between countries in terms of development and income growth. Although international and national institutions are working on development goals, progressis very slow. The biosphere isdegrading;however, on average, there isa decrease in natural resources and energy use. Countries' dependence on fossil fuels is decreasing despitenobarriertousingnon-conventionalfossilfuels.Populationgrowthismoderateand stabilizes in the second half of the 21st century. However, the less wealthy countries do not complete theirdemographictransitiondue toalackofinvestmentineducation.
Land-use change is not fully regulated, and deforestation of tropical forests continues, althoughitslightlydecreasesovertime.Theincreaseincropyieldsisslowlydecreasingover time, although the poorest countries are almost catching up with the richest. Calorie consumption and the share of animal food are gradually converging to high levels. International trade remains regionalized to a large extent. Moreover, international cooperation on climate mitigation is delayed due to the transition phase to a uniform carbon price by 2040. During this transition phase, the price of emissions from agricultural productionisalignedwithemissionsfromtheenergysectorandavoideddeforestationand afforestationare onlyconsideredin2030.
SP3 Regional Rivalry - A Rocky Road (high mitigation and adaptation challenges): Rising nationalism, increasing competitiveness and security issues, and regional conflicts cause countries to focus on national or regional issues (including security policy). At the regional level,governmentsarefocusingonfoodsecurityobjectives attheexpenseofdevelopment issues,andseveralregionsareadoptingauthoritariangovernance.Investmentineducation andtechnologyisdeclining.Economicgrowthislow,consumptionismaterial-intensive,and inequalitypersists overtime,especiallyindevelopingcountries.Populationgrowthishighin developingcountries andlow inindustrializedcountries.Theinternationalcommunitygives a low priority to environmental issues, and the lack of cooperation between societies is increasingthe erosionofthe biosphere.
Land-use changes are hardly regulated. The increase in crop yields is drastically reduced over time due to the limited transfer of new agricultural technologies to developing countries. Unhealthy diets rich in animal calories dominate, and food waste is high. The regionalized world does not favor trade flows of agricultural products. Forestry mitigation and GHG emission reduction face implementation barriers such as weak institutional capacity in developing countries. In 2020, the wealthiest countries implemented a uniform carbonprice,andthe poorestcountriesstartedin2030.
SSP4 Inequality - A Road divided (weak challenges for mitigation and strong for adaptation): Investment in human capital is uneven, and disparities in economic opportunityandpoliticalpowerincreaseinequalitybetweenandwithincountries.Societyis separated into two groups; internationally connected societies that contribute to knowledge- and capital-intensive economic sectors and a fragmented set of low-income societies composed of poorly educated populations that rely heavily on labor rather than technology. Conflicts are emerging more and more often, and social tensions are increasing.Technologicaldevelopmentishighinthehigh-techsectors.Theenergysectoris globally connected, diversifying its investments in carbon-intensive fuels such as coal and unconventionaloilandlow-emissionenergysources.Environmentalpoliciesarelocalizedin middleandhigh-incomeareas.
Land-use changes are highly regulated in rich countries, but deforestation continues to progressinpoorcountries.Richcountriesincreasetheiragriculturalyieldsstrongly,whilethe poorestcountriesremainunproductiveinagriculture.Calorieconsumptionandtheshareof animalcaloriesareconvergingtowardsaveragelevels.Foodtradeisglobalized,butmarket access is limited for poor countries, which become more vulnerable. International cooperation on climate change is starting rapidly (after 2020), but emissions from agriculture and land-use are not fully priced. In addition, avoiding deforestation and afforestationissuesare onlyincludedin2030.
SSP5 Fossil-fueled Development - Taking the Highway (strong mitigation challenges and weak adaptation challenges): This world relies on competitive markets, innovation, and participatory societies to produce technological advances, develop human capital, and move toward a sustainable development pathway. Investments in health, education, and institutions to improve human and social capital are increasing. The global economy is growing rapidly, coupled with the exploitation of abundant fossil fuel resources and resource- and energy-intensive lifestyles. The world population peaks and then declines
during the 21st century. Local environmental problems are successfully addressed, and the world is optimistic about its ability to manage ecological and social systems, including throughgeoengineeringifnecessary.
Land-useisnotfullyregulated,anddeforestationintropicalbiomescontinues,althoughitis declining slowly over time. Crop yields are increasing rapidly. Unhealthy diets composed of alargeshareofanimalcaloriesarethenorm,andfoodwasteishigh.Barrierstointernational tradearegreatlyreduced.AllGHGemissionsfromland-usearepricedandalignedwiththe energysectorcarbonprices.However,internationalcooperationtomitigateglobalwarming isdelayed,anduniform carbonpriceswillemergein2040.
2. DetailedscenarionarrativesofCheungetal.(2019)
In the SSP1 scenario, consumers demand more transparency on the source of the seafood they consume, the production conditions, and the catch rates, which leads to the implementation of certification and traceability programs (which are reflected in prices). Consumers are limiting their fish purchases from deep-sea fisheries and supporting sustainable fisheries. Less developed countries see their socio-economic situation (e.g., education, profits, investments, and welfare) improve thanks to economic incentives to process fishery products on their territory. With the help of coordination between the different private, public and civil society actors, PAs will be set up to conserve marine biodiversity.Theimplementationofacarbonpriceandtheeliminationofsubsidieslinkedto fishing activities will reduce fishing efforts on the high seas. Marine biodiversity will thus recover,andlessdevelopedcountrieswillcapturetheassociatedsocio-ecologicalbenefits.
TheSSP3describesaworldwhereindustrialfishingexpandstomeettheincreasingdemand for seafood. Depending on the Exclusive Economic Zone (EEZ), catch rates are either maintained at current levels or increased. Industrialized countries continue to heavily subsidize fishing, which increases fishing efforts without improving fishing efficiency, as countriesinvestlittleintechnologydevelopment.Thecostsoffishingarereducedduetothe exploitation of underpaid workers. The most developed countries capture the benefits of fishing. The fishing effort will increase due to high subsidies from industrialized countries, leadingtobiodiversitydegradation.Thesedeclineswillparticularlyaffectthelessdeveloped countries that are highly dependent on fish for food and are major exporters. The fishing activity aims at maximizing profit, which favors environmentally destructive fisheries. As fishingeffortisnotlimitedandcontrolled,catchesdecrease,andoverfishingdominates.
In the SSP5 trajectories, the fishing sector consolidates, and a few large companies own its activities. Developed countries promote technology transfer, which allows less developed countries to expand their fleets on the high seas. Developed countries are investing in technology, such asthe creation of automatic fishingrobots.Activities onthe highseas are increasing, including the exploration of genetic resources and the mining search. The massive use of fossil fuels is increasing CO2 emissions and ocean temperatures with disastrous effects on acidification. Geoengineering is being used to mitigate human impactsonfishabundanceanddistribution;however,theeffectivenessofthesetechniques
is uncertain. As fuel costs are low and technology is advanced, deep-sea fishing becomes more accessible and profitable. There are fewer fisheries monitoring and science-based managementsystems,whichleadstoadeclineintargetspecies,whichdecreasesthestock incountries'EEZsandtheassociatedcatches.
3. DetailedscenarionarrativesofKoketal.(2020)
The "Half-Earth" scenario aims to protect the intrinsic values of nature. It is based on the assumption that to halt biodiversity loss; it is necessary to promote wilderness areas separatefromareasunderhumaninfluence.Itisascenariobasedontheprinciplesof"land sparing" agriculture and ESs are considered as "co-benefits" and are not prioritized. It focusesonPAexpansion,conservationofnaturalareas,andrestoration.Thespaceavailable for agricultural production and forestry will thus be limited; as a result, a drastic improvement in agricultural productivity and sustainable intensification of agriculture will become necessary (Garnett et al., 2013; Phalan et al., 2016). This intensification will rely on technological developments and innovation (e.g., making irrigation and nutrient use systems more efficient, improving pest control, and crop genetics) while seeking to reduce negative externalities.
The "Sharing the Planet" scenario aims to "live in harmony with nature" by building on the instrumental and relational values of nature (Hinchliffe & Whatmore, 2006; Turnhout et al., 2013). Itreflects the "convivial conservation" approach, which aims at bridging social justice issues with conservation (Büscher et al., 2017; Büscher & Fletcher, 2020) and describes the principleof"landsharing".This scenarioisbasedonthe assumptionthattohaltbiodiversity loss; it is necessary to create value at the local level; not to seek to separate humans from nature, and to ensure that social inequalities and injustices are reduced. It prioritizes measures that support and increase the provision of ESs and nature's contributions to people,promotinglandscapesthatareamosaicofnaturalhabitatpatchesandagriculture ("agroecological matrix"). Biodiversity conservation is one of the benefits provided by this landscape. This scenario uses local ecological knowledge, labor-intensive and smart mechanization systems while optimizing other ecosystem benefits, as applied in agroecology, organic farming, agroforestry, and diversifiedfarmingsystems(Kremen 2020; Tittonel2014)toimplementan"ecologicalintensification".
Listofacronymsandabbreviations
AOH AreaofHabitat
BRFR Biodiversity-RelatedFinancialRisk
BII BiodiversityIntactnessIndex
CBD ConventiononBiologicalDiversity
CRFR Climate-RelatedFinancialRisk
DGVM DynamicGlobalVegetationModel
DNB DeNederlandsche Bank NV
EEZ ExclusiveEconomicZone
ES EcosystemService
ESH ExtentofSuitableHabitat
ESGAP EnvironmentalSustainabilityGap
FGRS FractionofGloballyRemainingSpecies
FRRS FractionofRegionallyRemainingSpecies
GDP GrossDomestic Product
GTAP GlobalTradeAnalysisProject
GTAP-AEZ GlobalTradeAnalysisProjectAgro-Ecological-Zones
IAM IntegratedAssessmentModel
IIASA International Institute forAppliedSystemsAnalysis
INSPIRE International Network for Sustainable Financial Policy Insights, Research, andExchange
LPI LivingPlanetIndex
MCP Maximum CatchPotential
MPA Marine Protected Area
MSA MeanSpeciesAbundance
MSY MaximumSustainable Yield
NGFS NetworkforGreeningtheFinancialSystem
NRFR Nature-RelatedFinancialRisk
OCDE OrganisationforEconomicCo-operationandDevelopment
PA Protected Area
PBL Planbureau voorde Leefomgeving
PIK PotsdamInstituteforClimate ImpactResearch
RCP Representative ConcentrationPathway
REDD ReducingEmissionsfromDeforestationandForestDegradation
RLI RedListIndex
SESPI StrongEnvironmental SustainabilityProgressIndex
SSP SharedSocio-economic Pathway
TNFD Taskforce onNature-relatedFinancialDisclosures
What is AFD?
Éditions Agence française de développement publishes analysis and research on sustainable development issues. Conducted with numerous partners in the Global North and South, these publications contribute to a better understanding of the challenges faced by our planet and to the implementation of concerted actions within the framework of the Sustainable Development Goals.
With a catalogue of more than 1,000 titles and an average of 80 new publications published every year, Éditions Agence française de développement promotes the dissemination of knowledge and expertise, both in AFD’s own publications and through key partnerships. Discover all our publications in open access at editions. afd.fr.
Towards a world in common.
Publication Director Rémy Rioux
Editor-in-Chief Thomas Melonio
Legal deposit 3rd quarter 2022
ISSN 2492 - 2846
Rights and permissions
Creative Commons license

Attribution - No commercialization - No modification https://creativecommons.org/licenses/by-nc-nd/4.0/
Graphic design MeMo, Juliegilles, D. Cazeils
Layout Denise Perrin, AFD
Printed by the AFD reprography service
To browse our publications: https://www.afd.fr/en/ressources-accueil
Agence française de développement
l France
5, rue Roland Barthes 75012 Paris
www.afd.fr
