Public bank lending in Africa in times of crisis


Research papers Author Florian Léon Coordination Jean-Baptiste Jacouton (AFD) Régis Marodon (AFD) SEPTEMBER 2022 No. 257

Les Papiers de Recherche de l’AFD ont pour but de diffuser rapidement les résultats de travaux en cours. Ils s’adressent principalement aux chercheurs, aux étudiants et au monde académique. Ils couvrent l’ensemble des sujets de travail de l’AFD : analyse économique, théorie économique, analyse des politiques publiques, sciences de l’ingénieur, sociologie, géographie et anthropologie. Une publication dans les Papiers de Recherche de l’AFD n’en exclut aucune autre.
Les opinions exprimées dans ce papier sont celles de son (ses) auteur(s) et ne reflètent pas nécessairement celles de l’AFD. Ce document est publié sous l’entière responsabilité de son (ses) auteur(s) ou des institutions partenaires.
AFD Research Papers are intended to rapidly disseminate findings of ongoing work and mainly target researchers, students and the wider academic community. They cover the full range of AFD work, including: economic analysis, economic theory, policy analysis, engineering sciences, sociology, geography and anthropology. AFD Research Papers and other publications are not mutually exclusive.
The opinions expressed in this paper are those of the author(s) and do not necessarily reflect the position of AFD. It is therefore published under the sole responsibility of its author(s) or its partner institutions.
AUTEUR Florian Léon Fondation pour les Etudes et Recherches sur le Développement International (FERDI) COORDINATION
Régis Marodon (AFD) Jean-Baptiste Jacouton (AFD)
This paper examines public bank lending in Africa in times of crisis. To do so, we exploit an original data set covering all banks operating in eight West African countries. The final sample considers 112 banks, including 24 public banks, over the period 2000 2019. We focus on how public banks react during and in the three years after macroeconomic shocks. Our empirical analysis provides the following results. First, lending activity is reduced in the wave of a crisis. Second, public and private banks do not differ in their lending decisions during a downturn. However, public banks do not reduce their activity in years following a crisis, contrary to domestic private banks. Third, the most probable explanation of the previous finding is the stability of the resources of public banks, especially deposits. Finally, the countercyclicality of public banks does not come at the expense of the degradation of public banks’ health.
Keywords Public banks, lending, countercyclicality, Africa
JEL codes
G21, H44, N17
Original version English Accepted July 2022
Acknowledgments
This research was supported by the Agence Française du Développement. We thank Alou Adessé Dama for his help with data collection and Jean Baptiste Jacouton, Régis Marodon, Laurent Weill, and Benjamin Williams for their insightful comments
Cet article examine les prêts des banques publiques en Afrique en période de crise. Pour ce faire, nous exploitons un ensemble de données original couvrant toutes les banques opérant dans huit pays d'Afrique de l'Ouest. L'échantillon final prend en compte 112 banques, dont 24 banques publiques, sur la période 2000 2019. Nous nous concentrons sur la façon dont les banques publiques réagissent pendant et dans les trois années qui suivent les chocs macroéconomiques. Notre analyse empirique fournit les résultats suivants.
Premièrement, l'activité de prêt est réduite dans la vague d'une crise. Deuxièmement, les banques publiques et privées ne diffèrent pas dans leurs décisions de prêt pendant une récession. Cependant, les banques publiques ne réduisent pas leur activité dans les années qui suivent une crise, contrairement aux banques privées nationales.
Troisièmement, 'explication la plus probable du résultat précédent est la stabilité des ressources des banques publiques, notamment des dépôts. Enfin, la contracyclicité des banques publiques ne se fait pas au détriment de la dégradation de la santé des banques publiques.
Mots clés
Banque publique, prêts, contracyclicité, Afrique
Codes JEL G21, H44, N17
Version originale Anglais
Accepté Juillet 2022
The COVID 19 pandemic has brought back to the forefront the importance of the State in maintaining economic activity in times of crisis. While Africa has not been the continent most affected by the pandemic, the economies of the continent continue to suffer from major booms and busts. They are highly vulnerable to external shocks, including economic events, such as commodity price booms and busts, and also many non economic shocks ranging from civil conflicts to natural disasters and epidemics. The high vulnerability is explained by a high exposure to these shocks for structural reasons (e.g., a lack of diversification for commodity price busts). African countries also suffer from a lack of resilience. Existing private mitigating instruments, such as insurance or credit, are underdeveloped on the continent. External resources, especially foreign aid and remittances, can help to absorb major shocks, but these flows are not in the hands of domestic actors in terms of amount and allocation.
In this context, the role of the State especially public banks 1 as a stabiliser of economic activity is particularly crucial in Africa. Among the tools at the disposal of governments, public banks play a crucial role in Africa. On the continent, public authorities have limited room to intervene
during a crisis because they struggle to mobilise internal resources and often have high debt levels. Contrary to the central State, public banks benefit from their own resources and are often able to borrow in the markets, even during a crisis. In addition, State owned banks are not marginal actors in Africa. For instance, our data reveal that public banks manage on average 15% of assets in the eight West African countries considered. Even if we lack a global view of public banks across the world, comparison with other papers indicates that these actors are more important in Africa than elsewhere (see Table A1 in the Appendix A). The role of public banks is even more important in the least (financially) developed countries, such as Niger and Mali.
The analysis of public bank lending in times of crisis in Africa is therefore of prime interest but is lacking. While several academic studies have empirically shown that banks owned by public authorities are less procyclical than private banks, these works have focused mainly on Latin America and Eastern Europe and neglect Africa, with one exception discussed below (see Table A1 in the Appendix A for a review of papers). In addition, evidence from other continents cannot be extrapolated to Africa due to the specific context explained above (the importance
1 In the rest of the paper, we employ interchangeably the terms public banks or State owned banks.This paper fills this gap by examining the lending of public banks in times of crisis in eight West African countries. To do so, first we hand collected data from the range of banks operating in the West African Economic and Monetary Union (WAEMU includes Benin, Burkina Faso, Côte d’Ivoire, Guinea Bissau, Mali, Niger, Senegal and Togo) from 2000 to 2019. Our final sample covered 112 banks. Among them, the State was the main shareholder in 24 banks and owned the absolute majority in ten of them. To examine how crises influence public banks’ lending, we should define macroeconomic shocks. We define a macroeconomic shock if a country's one year GDP per capita growth is significantly below the 1995 2019 average GDP per capita growth in the country. We therefore can identify 16 events across the eight countries.
The baseline analysis provides four main findings. First, lending tends to decrease more after a crisis than during a crisis. Second, public banks do not behave differently than private banks during a crisis. Third, we document that public banks maintain their lending in the wave
of a crisis, contrary to private banks that contract their loans. Finally, we document that banks in which the State owns the absolute majority of capital react more strongly than other public banks.
There are two remaining questions that we address sequentially in the rest of the paper. We first identify channels explaining why public banks act countercyclically. We document that public banks benefit from stable resources, notably deposits. This finding suggests that public banks benefit from an implicit insurance by the State (Brei and Schclarek, 2015). We also test the political view, arguing that public banks are more sensitive to the electoral calendar than to economic growth (Dinç, 2005); our results do not give support to this view. Public banks in Africa are not sensitive to the timing of (presidential) elections in these countries. Unfortunately, we cannot test two additional arguments often advanced to explain the countercyclicality of public banks. We cannot reject that public banks, in addition to stable resources, benefit from an implicit or explicit mandate to support economic activity during downturns (Brei and Schclarek, 2015; Behr et al., 2017). However, we do not believe that the positive role of public banks can be strongly explained by the composition of a portfolio oriented towards firms whose demand increases during crises, contrary to private banks that also serve households which contract their loan
demand (de Luna Martinez and Vicente, 2012). Almost all loans provided by public and private banks in the WAEMU are oriented towards firms rather than household in these countries (Léon, 2018).
Finally, we ask whether the counter cyclicality of public banks after a shock comes with shortcomings, such as the degradation of public banks’ health (Bertray et al., 2013; Coleman and Feler, 2015; Chen et al., 2016). To test this possibility, we examined the evolution of performance and the financial stability of public banks in the wave of a crisis. Contrary to expectations, State owned banks do not suffer more than private banks regarding a deterioration of their performance or their portfolio quality during and after a shock.
This paper adds to the literature on public bank lending in times of crisis in two ways. First, to our knowledge, this paper is the first to specifically investigate the role of public banks during crises in Africa. As explained above, results from studies on Latin America and Europe 2 cannot be extrapolated to Africa due differences in terms of economic instability, institutional frameworks or the weight of public banks. To our knowledge, only one paper has
2 Table A1 in the Appendix presents a review of major papers on the countercyclicality of public banks in the developing world. As indicated in Table A1 (panel B), African banks are sometimes included in other papers, but they account for a small number of banks considered, and they are not specifically investigated (Micco and Panizza, 2006; Bertray et al., 2015; Chen et al., 2016). In detail, we observe that existing studies often signal that public banks are countercyclical in Latin America (Brei and Schclarek, 2013, 2018; Cull and
indirectly examined public banks in Africa. Zins and Weill (2018) investigate the procyclicality of loans of foreign and public banks in 20 African countries. 3 Their results indicate that public banks are not less procyclical than private domestic banks. Our paper complements this paper in several ways. First, Zins and Weill (2018) assessed the sensitivity of lending to economic growth without distinguishing booms and busts. However, the role of public banks is particularly important during downturns when private financial flows dry up. Second, we exploited a sample of all banks operating in eight West African countries. International databases, such as those used by Zins and Weill (2018), are useful, but they miss many (small and local) banks in Africa, including many public banks. For instance, Zins and Weill (2018) considered only 24 banks and one public bank for countries investigated in our paper, while we have a sample of 112 banks, including 24 public banks. Our dataset allows us to provide a more complete picture.
The second contribution of this paper consists of extending the window beyond the contemporary effect of cyclicality. Existing works have limited their analysis
Martinez Peria, 2013), while evidence from European countries is less clear cut (Cull and Martinez Peria, 2013; Frigerio and Vandone, 2020).
3 Zins and Weill (2018) focused on the countercyclical behaviour of foreign banks in Africa and considered public banks as a control group. Their paper includes not only banks from sub Saharan Africa (as ours) but also banks from four North African countries. The latter group accounts for more than one third of the observations.
to the crisis years by studying banks’ behaviour only during a shock (e.g., 2008 global financial crisis). However, they ignore the behaviour of banks after a downturn. One exception is the study of Coleman and Feler (2015), which examined how public banks reacted to the 2008 09 global financial crisis (GFC) in Brazil by exploiting data from 2005 to 2013.
The authors document that public banks not only continued to lend during the GFC but also during the post crisis period. We extend this approach by considering other macroeconomic shocks. We do not focus specifically on the GFC because countries under investigation were not clearly impacted by this event and suffered from other major shocks, such as commodity price busts or civil conflicts.
Our findings indicate that public banks are not able to react immediately during a downturn but provide support after a crisis.
This work finally contributes to a scant analysis of recent changes in banking markets in Africa, especially in the WAEMU. Exploiting a rich bank level database as ours, several papers have focused on the emergence of pan African banks in the zone and their consequences for competition, stability and performance (Léon, 2016; Kanga et al., 2020, 2021; Saidane et al., 2021). However, there are no studies on the role of public banks in these countries, despite their importance in these banking systems. We provide a first investigation in this way.
The rest of the paper is organised as follows. Section 2 presents the data used. Section 3 describes our estimation approach. Section 4 discusses the results, and the final section concludes the study.
The primary data came from three main files published by the Banking Commission of WAEMU or the Central Bank (BCEAO). The WAEMU is made up of eight countries (Benin, Burkina Faso, Côte d'Ivoire, Guinea Bissau, Mali, Niger, Senegal and Togo), which share a common currency and banking regulatory and supervisory frameworks. These economies are among the least developed, with a strong heterogeneity across countries. The financial systems in the WAEMU are mainly bank based and have experienced both a rapid growth over the past two decades and the entry of new actors, notably pan African banks. For instance, the ratio of domestic credit to the private sector relative to GDP increased from +7 points in Niger to + 19 points in Burkina Faso between 2000 and 2019. 4 The number of active banks increased from 86 in 2000 to 136 in 2019. However, financial development and inclusion remain limited in all countries.
We first hand collected the annual balance sheets and income statement data for all banks operating from 2000 to 2019. Initial files are available online (in pdf format). We complemented financial data with information on bank ownership. In doing so, we extracted the name of the major owners of each bank displayed in the directories of banks provided by year. We finally collected additional information, such as the number of employees or branches, by extracting figures reported in the Appendix of Annual Reports of the Banking Commission. These documents also provide the share of capital owned by the State, domestic private individuals and foreigners. They allowed us to cross check information provided in directories. Information for all banks were combined using a unique code (“immatriculation”). This common identification number allows us to follow a bank over time despite name changes.
We identified 187 different institutions operating from 2000 to 2019 in eight countries. To construct the sample, we applied the following filters. We first excluded non bank financial intermediaries, removing 39 institutions (financial intermediaries are classified between banks and non bank FIs). We then dropped five banks 5 due to the difficulty of classifying them as State owned or private owned banks. Indeed, the State was a majority owner but only during a short period of time, rendering classification complex.
To avoid results driven by outliers, we excluded the bottom and top 1% of loan growth. We finally excluded 31 banks with a limited number of observations, i.e. with less than six consecutive years (because we consider at a minimum of five years of growth in the analysis). The final sample includes 112 banks (1,490 observations) distributed from four banks in Guinea Bissau to 26 in Côte d’Ivoire, as indicated in Table 1.
4 Data were extracted from World Development Indicators.
5 The list includes Banque internationale du Bénin, Banque Africaine pour l’Industrie et le Commerce, Coris Bank, Banque Internationale pour l’Afrique au Niger and Banque Internationale pour l’Afrique au Togo.
All banks Public banks
Nb. (obs.) Nb. (obs.) Asset Loan Deposit Staff Accounts Branch
Benin 11 (161) 1 (7) 1.0 1.1 1.2 2.5 1.2 1.8
Burkina 14 (167) 4 (45) 12.2 13.8 18.7 22.4 22.7 19.6
Côte d'Ivoire 26 (335) 5 (61) 9.4 8.8 9.1 17.2 22.1 21.9
Guinea Bissau 4 (49) 0 (0) 0.0 0.0 0.0 0.0 0.0 0.0
Mali 14 (209) 5 (72) 44.9 44.6 49.1 43.1 52.4 52.0
Niger 11 (148) 4 (42) 28.2 28.5 31.5 31.1 21.2 26.3
Senegal 21 (227) 2 (26) 6.4 8.0 2.8 8.9 9.7 10.1
Togo 11 (144) 3 (46) 32.0 33.8 43.3 43.1 37.0 40.6
TOTAL 112 (1440) 24 (299) 15.0 15.6 15.7 20.8 23.7 25.6
The dependent variable was credit growth, which is the annual growth rate of customer loans in local currency and deflated using the national GDP deflator (base 100 = 2015). The dependent variable therefore excludes interbank lending. We do not have information on the breakdown of customer loans into firm loans and household loans. However, more than 90% of loans in the WAEMU are allocated to firms (Léon, 2018).
As indicated in the summary statistics in Appendix, credit growth has been impressive in the WAEMU (+23%). The rapid credit growth reflects the development of the banking industry in the eight countries under consideration over the past two decades. It is therefore not surprising that credit growth was higher than in the sample, including in more financially developed countries, such as those in the study by Zins and Weill (2018), who reported an annual credit growth of 10%.
Our main interest variable was the public ownership of banks. We distinguished between public banks and private (domestic and foreign owned) banks. There are two main approaches to classifying a bank as a public bank. The first approach defines a bank as public if a public authority holds more than 50% of the bank’s equity capital (Brei and Schclarek, 2013, 2017; Cull and Martinez Peria, 2013). Some authors refer to lower thresholds as 20% (Chen et al., 2016) or even 10% (Iannotta et al., 2013). The second approach relies on the main ultimate owner (Bertay et al., 2015; Zins and Weill, 2018). Even if the State holds less than the absolute majority of a bank’s equity capital, it may influence decisions if other owners are minority holders.
We followed the second approach and classified a bank as public if the main shareholder was a public authority. We considered all public authorities, such as the central government, local government or other public entities. To define the main shareholder, we relied on directories that display the list of main shareholders for each bank year by year. According to this definition, 24 banks were classified as public banks, listed in Table 2. Five of them changed their status over the period, with one becoming a public bank (Versus bank in Côte d’Ivoire) and four became private banks (Continental Bank in Benin, BIB in Burkina Faso, BIM in Mali, BIN in Niger).
The analysis of ownership structure provided interesting features. The State holds between 25% and 100% of capital in public banks, as indicated in Table 2. Public ownership exceeded 50% in ten banks (with four of them being exclusively owned by the State). It should be noted that the State is a minority shareholder in 30 other private banks.
Public banks account for 21% of banks (24 out of 112), which is a large ratio in comparison with other studies on public banks (cf. Table A1). The number of public banks ranges from zero in Guinea Bissau to five in Côte d’Ivoire and in Mali. The importance of public banks in terms of activity is rather limited in Benin, Senegal and Côte d’Ivoire (less than 10% of assets), but they play an important role in Mali, Togo and Niger (accounting for more than a third of assets). In Mali, three public banks account for 10% or more of market share. The largest public bank in Niger holds almost one fifth of the assets of the banking system. In Togo, the two largest public banks account for 15% of the banking system assets.
Public banks are, on average, smaller than their private counterparts. However, they play a major role in terms of financial inclusion, as highlighted in Table 2. They account for one quarter of accounts and bank branches. In particular, public banks operate not only in primary cities, but they have often branches in remote areas, contrary to many private banks.
Name Country Perioda Current Creation Pub. Shareb Mkt Sharec
Continental Bank Benin 2000 08 Foreign 1992 44 5.83
Banque agricole et commerciale du Burkina Burkina 2000 08 Exit 1979 25
Banque internationale du Burkina Burkina 2000 07 Foreign 1974 48 6.49
Banque commerciale du Burkina Burkina 2000 19 Public 1988 44 3.12
International Business Bank Burkina 2006–19 Public 2005 39 2.32
Banque pour le financement de l'Agriculture
Côte d'Ivoire 2006 13 Exit 2004 78
Banque Nationale d'Investissement Côte d'Ivoire 2000 19 Public 1999 100 6.09
Banque de l'Habitat de Côte d'Ivoire Côte d'Ivoire 2000 19 Public 1993 40 0.76
Versus Bank Côte d'Ivoire 2009 19 Public 2003 100 0.71
Banque Populaire (ex CNCE) Côte d'Ivoire 2010 19 Public 2009 100 0.48
Banque de l'Habitat du Mali Mali 2000 13 Exit 1991 84
Banque de Développement du Mali Mali 2000 19 Public 1968 26 17.63
Banque Malienne de Solidarité Mali 2002 19 Public 2002 35 17.29
Banque Nationale de Développement Agricole Mali 2000 19 Public 1982 36 9.94
Banque internationale pour le Mali Mali 2000 08 Foreign 1980 62 6.87
Crédit du Niger Niger 2000 09 Exit 1967 65
Société Nigérienne de Banque Niger 2000 19 Public 1994 32 18.91
Banque Agricole du Niger Niger 2010 19 Public 2011 95 5.84
Banque islamique du Niger pour le Commerce et l'investissement Niger 2000 09 Foreign 1997 34 3.14
Banque Agricole (ex: CNCAS) Senegal 2000 19 Public 1984 25 4.37
Banque Nationale de Développement Economique Senegal 2013 19 Public 2013 33 2.82
Banque togolaise de développement Togo 2000 12 Exit 1974 61 Union Togolaise de Banque Togo 2000 19 Public 1977 100 8.97 Banque togolaise pour le commerce et l'industrie Togo 2000 19 Public 1974 57 7.74
a: Period under which the bank is classified as public. b: Average value of public ownership over the period (in %). b: National market share (in 2019, %). In italics, we report banks that had a change in status over the period. Banks changing status over the period are in italics.
We combined bank level data with information about the business cycle. Existing studies differ in the indicators of business cycles and therefore in the econometric model considered (cf. Table A1, panel A). On the one hand, several papers have assessed the sensitivity of credit growth to macroeconomic growth (Micco and Panizza, 2006; Bertay et al., 2015; Zins and Weill, 2018). The model therefore studied whether lending follows the business cycle, i.e. increased during expansion phases and decreases during slowdowns. Another approach consists of studying lending growth during a crisis. These papers often focus on a well established crisis, such as the global financial crisis in 2008 2009 (Cull and Martinez Peria, 2013; Coleman and Feler, 2015; Chen et al., 2016).
Our paper is rooted in the second approach. Contrary to existing studies, we did not focus specifically on the 2008 financial crisis because the countries under investigation were not clearly impacted by this event and suffer from other major shocks, such as commodity price busts or civil conflicts. As a result, shocks tend to be idiosyncratic and not common across all countries. We have developed a trackable method to identify country specific shocks. In doing so, we exploited the evolution of GDP per capita growth in each country over the period from 1995 to 2020. 6
We considered that a country experienced a major economic shock when the growth of GDP per capita is significantly lower than the average growth from 1995 to 2020. More specifically, we operated in two steps. First, we computed the average GDP per capita growth per country over the period 1995 2020. Second, we considered that a country experienced a crisis if the annual GDP per capita growth was below the mean minus one standard deviation. The crisis variable was therefore a dummy variable as follows:
where ��������,���� is the growth of GDP per capita in country c in year t, �������� is the mean of GDP per capita growth in country c over the period 1995 2020, and ����(����)���� is the standard deviation of GDP per capita growth in country c over the period 1995 2020.
An alternative would be to rely on a unique criterion, like episodes of negative growth. However, this approach does not allow us to consider the specificity of each country. Average growth rates, as well as their variability, differ a lot across the eight economies. Our approach permitted to detect only the most significant downturn episodes with regard for the macroeconomic history of the country. In countries experiencing a rapid growth (such as Burkina Faso), we detected a crisis even when growth remain positive but close to zero. In contrast, in countries with a lower growth rate of GDP per capita (as in Côte d’Ivoire or in Niger), we only selected episodes with a strong decline in growth. Second,
6 We began the analysis in 1995 due to the devaluation of the franc in 1994. GDP per capita figures indicate a structural break in 1994 due to this major event. We test the stationarity of GDP per capita and GDP per capita growth for all countries. For all of them, GDP and GDP per capita have a unit root. However, GDP growth and GDP per capita growth were stationary between 1995 2020 in all countries (tests available upon request).
contrary to a filter approach, we were able to precisely detect crisis years. The precise identification of crisis years was crucial for our analysis, which consisted of examining lending during and after a shock.
We plot in Figures A1 and A2 the evolution of GDP per capita growth (blue line), the threshold retained defined by mean minus standard errors (red line) and periods of crises (in grey) for each country. From 2000 to 2019, we can identify 16 macroeconomic shocks: Benin (2005, 2009 10, 2015), Burkina Faso (2000, 2009), Côte d’Ivoire (2000 03, 2011), Mali (2000, 2012), Niger (1999 2000, 2004), Senegal (2002, 2011), Togo (2000, 2004 05, 2007). We confirm that shocks are often country specific.
Based on the identification of crisis years, we then created variables for post crisis years. If a shock occurred in t, we created three variables for post crisis in t+1, t+2 and t+3 (we consider the last year of a shock if it occurred over several years, as in Côte d’Ivoire from 2000 to 2003). The post crisis variable takes a value 0 if there is a shock in the same year. 7
We first considered a model which took into account only crisis periods versus non crisis periods, in line with existing papers (Brei and Schclarek, 2013, 2017; Cull and Martinez Peria, 2013), as follows 8: ������������������������ ������������ ,����,���� = �������� + ����1 ���������������������������� ,���� + ����2 ���������������������������� ,���� ∗ ���������������������������� + ∇�������� ,����,���� 1 + �������� + ��������,����,���� (1)
where ����������������������������,���� is a dummy variable equal to 1 if there is a macroeconomic shock in country c at year t (as defined in Section 2.5) A major difference from existing works consists of the definition of crisis dummy based on country GDP per capita growth evolution (and not on the 2008 financial crisis). We added bank fixed effects (�������� ), allowing us to control for all unobserved time constant characteristics of the bank and time fixed effects (�������� ) to control for common shocks (such as a change in monetary policy, which is common in the WAEMU). We finally added several bank level control variables (��������,����,���� 1 ). The log of total assets (in constant local currency) controls for bank size. The ratio of equity to total assets was added to control for bank soundness. We also included the ratio of loans to assets that represents the relative importance of lending in a bank’s activities. The liquidity ratio, constructed as the ratio of liquid assets to total assets, allowed us to measure bank soundness and its ability to sustain lending. We finally included deposits over total liabilities as a measure of the stability of a bank’s funding (non deposit funding tends to disappear quickly during periods of instability). In line with previous works, all bank level control variables were one year lagged. Finally, we also controlled for interactions between a crisis and a dummy for foreign bank ownership (defined using the same
7 Consider the example of Togo. There were two major economic shocks in 2004 05 and in 2007. The years 2004 and 2005 are classified as crisis year (t0). The year 2006 is considered as post crisis+1 (one year after the crisis). But, classifying 2007 is a challenge because 2007 is two years after the first crisis, but it is also the year of a major macroeconomic shock. We therefore consider 2007 as a new shock. Therefore, year dummies are equal to one in 2004, 2005 and 2007. Post crisis+1 dummy is equal to one in 2006 and 2008. However, post crisis+2 dummy is equal to 1 only in 2009.
8 Another approach, adopted by Zins and Weill (2018) for African banks, consists of assessing the sensitivity of credit growth to economic growth (cf. Table A1 in the Appendix). This approach does not allow us to consider crisis and post crisis years explicitly. For the sake of comparison, we present in Appendix B the results from using this approach by mimicking existing works (Bertay et al., 2015; Zins and Weill, 2018). We provide very similar findings to those of Zins and Weill (2018).
methodology as public banks). 9 The description of variables is displayed in Table A2. We expected that ����1 < 0, indicating that loan growth would be reduced during a crisis. We expected that public banks would be less procyclical if ����2 > 0 and even countercyclical if ����1 + ����2 > 0
We then extended Eq. (1) by adding post crisis years to the model, in line with Coleman and Feler (2015). To do so, we added post crisis dummy variables as follows: + + �������� + (2)
where ���������������������������� ����+���� is a dummy variable if a major macroeconomic shock occurs in period (t k), with k taking a value of 0 in the year of the crisis and 1, 2 and 3 in the first, second and third year after the crisis, respectively. Coefficient ����1 signals the contemporaneous effect of macroeconomic shocks on credit growth (expected to be negative). Coefficients ����1, ����1 and ����1, provide an indication of lending growth one year, two years and three years after a bust. We are agnostic about their sign. On the one hand, we could observe a rapid recovery after a shock and a higher credit growth (positive coefficients). On the other hand, it may take time to bounce back, and recovery may be slow (negative coefficients), as in Brazil after the GFC, as highlighted by Coleman and Feler (2015).
The coefficients associated with interaction between crisis and post crisis dummies and public ownership give information about the role of public banks during and after a downturn. 10 We expected that ����2 > 0 if public banks acted less procyclically during a crisis (and even countercyclically if ����1 0). If public banks spur recovery, we should observe positive signs for coefficients ����2
We studied how banks react during a major macroeconomic shock. We first presented a model with only crisis dummies in columns 1 and 2 of Table 3 (Eq. 1). In the first column, we ignored the interaction with public ownership to present the impact of crises on lending growth. Contrary to expectations, we did not see a decline in lending growth during crises. In the following column, we added an interaction between public ownership and the crisis dummy. Results indicate that public banks did not differ in their behavior in comparison with private banks (����2 = 0). 11
9 It should be noted that foreign ownership is very common in the WAEMU. We identified 83 foreign owned banks. The importance of foreign banks is explained by the historical weight of European banks, notably from France, combined with the rapid expansion of pan African banks over the last two decades (Léon, 2016).
10 As previously, we also added interaction with foreign dummies.
11 It should be noted that this finding is in line with the analysis of the sensitivity of loan growth to macroeconomic growth displayed in Appendix B, as well as the results published by Zins and Weill (2018), indicating that public banks do not seem to differ from private banks.
Table 3 Lending behaviour during and after a crisis
(1) (2) (3) (4)
Crisis(t0) 0.0672 0.283 0.0228 0.0773 (0.82) (0.70) (0.26) (0.21)
Public*Crisis(t0) 0.265 0.0621 ( 0.62) ( 0.15)
Crisis(t+1)
0.101* 0.538** ( 1.66) ( 2.30)
Public*Crisis(t+1) 0.448* (1.89)
Crisis(t+2) 0.105* 0.393** ( 1.78) ( 2.15)
Public*Crisis(t+2) 0.245 (1.08)
Crisis(t+3) 0.0195 0.245** ( 0.35) ( 2.02)
Public*Crisis(t+3) 0.508** (2.25)
Obs. 1,237 1,237 1,237 1,237
# banks 108 108 108 108
Bank FE Yes Yes Yes Yes
Year FE Yes Yes Yes Yes
CV Yes Yes Yes Yes R2 0.41 0.41 0.41 0.41
The dependent variable is credit growth, which is the growth rate of loans in real franc CFA. We regress credit growth on crisis and post crisis dummies, bank ownership and bank level variables in the period 2000 2019. Crisis is a dummy equal to 1 if GDP per capita growth is below the country’s 1995 2020 average minus one standard error. Post crisis dummies refer to the year after the crisis event. Public is a dummy equal to 1 if the bank is a domestic state owned bank (majority holder is the State). The omitted category is privately owned banks. Public dummy is interacted with crisis dummies and post crisis dummies. Year and bank dummies are incorporated in all specifications. Bank level controls (unreported) are the log of total assets, the ratio of equity to total assets, the ratio of loans to assets, the ratio of deposits to total liabilities and the ratio of liquid assets over total assets. All control variables entered with one lag. Models also include interaction between foreign banks and crisis and post crisis years. Models are estimated using an OLS estimator. The p values for clustered standard errors at the bank level are given in parentheses, and ***, **, * correspond to the 1%, 5%, and 10% levels of significance, respectively.
However, we extended the analysis to consider the post crisis periods. In the Brazilian case, Coleman and Feler (2015) indicate that private banks continued to contract their lending after the global financial crisis, contrary to public banks. We therefore considered post crisis years in the rest of Table 3 by running Eq. (2). As before, we first considered crisis and post crisis dummies without interactions in column (3). Interestingly, we document that lending growth was not reduced during a crisis, but loan growth decreased afterwards. In the two years after a macroeconomic shock, lending growth was reduced by 10 percentage points. It is a strong contraction insofar as the mean of loan growth is 23%. This result is in line with raw data indicating that credit growth is 23% in normal times but 15% one year after a crisis and 18% two year after a shock.
In the last column, we then added the interaction between public banks’ dummies and crisis and post crisis years. Results indicate that public banks attenuated the contraction of loans in the wave of a crisis as indicated by the positive and significative coefficients associated with interactions. The contraction of credit growth is particularly important for private banks after a crisis ( 54% after a year,
40% after two years and 25% after three years). In opposition to this, we observed almost an absence of effect for public banks.
In the following table, we consider the degree of State involvement in banks. To do so, we classified banks with public participation in three groups. We first break down the group of public banks (i.e. banks where the State is the majority shareholder) into two subgroups. The first group concerns banks where the State owns more than 50% of the total equity (absolute majority). The second group comprises public banks where the State is the main shareholder but holds less than 50% of the capital (not absolute majority). Finally, we consider a third group, in which the public authority is a minority shareholder. There are 30 private banks in which the State has equity but is not the main shareholder. In these banks, the share of capital owned by the State ranges from 1% to 37% (median = 10%).
Based on the breakdown presented above, we reran our baseline model displayed in Eq. (2), but we included a different definition of “public banks”. Results are presented in Table 4. We first considered a model including as “public” all banks in which the State owns a share of capital (irrespective of its status of majority or minority shareholder). Results indicate that when we encapsulated public minority banks as public banks, the countercyclical effect of public banks vanished. In column (2) of Table 4, we document that this finding was due to the behaviour of banks where the State is only a minority investor. Indeed, we document that private banks with the State as an investor behaved as other private banks in times of crisis. The presence of the government as an equity holder is not enough to shape the lending activity of these actors. In the third column, we focused only on public banks defined as banks where the State is the majority shareholder. However, we broke them down into banks in which the State owns more than 50% of capital and other banks in which the State holds less than half of the share. In the latter group, the State is more likely to bargain with other shareholders because it does not own the absolute majority. Interestingly, the results, displayed in column 3 of Table 4, indicate that the countercyclicality of public banks was largely due to public banks where the State owned the absolute majority of shares. The effect was not only stronger in econometric significance but also in economic terms. Finally, we considered a complete model with the three categories in column 4 and confirmed previous findings, notably the absence of effect for private banks with State participation and an increased effect for public banks where the State holds more than 50% of equity.
We ran several robustness checks, displayed in the Appendix A, to confirm our main findings. Table A3 presents the baseline model but with alternative definitions of crisis periods in the first two columns. In the first column, we considered there to have been a crisis if a country experienced a negative GDP per capita growth (28 events). In the second column of the table, we applied the baseline approach described in Section 2.5 but we relied on GDP growth instead of GDP per capita growth. In a nutshell, econometric results were unaffected by these changes.
In the third column of Table A3, we ran a falsification test by relying on interbank loans instead of customer loans. We see that public banks did not change their behaviour of lending to other financial institutions during and after a crisis. This result points out that the observed relationship was only valid for credit to customers (firms and households).
One might argue that a positive effect for the post crisis period for public banks can be induced by rapid growth during the recovery phase. We therefore controlled for GDP per capita growth as a control variable without altering our conclusion.
We then replicated existing works that consider the 2008 global financial crisis. Figures A1 and A2 in the Appendix A highlight that the countries under investigation were not sensitive to this crisis. However, one might expect that public banks behaved differently during the 2008 global financial crisis. Results displayed in the last column of Table A3 do not support this view. In addition, controlling for interactions between public bank dummies and the global financial crisis did not alter our main findings.
In an unreported analysis (available upon request), we excluded countries one by one. We observed similar findings. We noted that statistical significance was reduced when we excluded Côte d’Ivoire (which accounts for a large number of observations).
Table 5 The role of public participation (1) (2) (3) (4)
Coef. Std Dev. Coef. Std Dev. Coef. Std Dev. Coef. Std Dev.
Crisis(t0) 0.038 (0.188) 0.028 (0.340) 0.076 (0.367) 0.027 (0.341)
Public (maj + min)*Crisis(t0) 0.106 (0.148)
Public (min)*Crisis(t0) 0.123 (0.172) 0.124 (0.173)
Public (maj)*Crisis(t0) 0.011 (0.374)
Public (maj > 50%)*Crisis(t0) 0.122 (0.428) 0.071 (0.402)
Public (maj < 50%)*Crisis(t0) 0.002 (0.412) 0.053 (0.385)
Crisis(t+1)
0.364** (0.182) 0.564** (0.249) 0.537** (0.234) 0.564** (0.249)
Public (maj + min)*Crisis(t+1) 0.147 (0.112)
Public (min)*Crisis(t+1) 0.072 (0.091) 0.072 (0.092)
Public (maj)*Crisis(t+1) 0.475** (0.215)
Public (maj > 50%)*Crisis(t+1) 0.503* (0.267) 0.530** (0.180)
Public (maj < 50%)*Crisis(t+1) 0.395* (0.243) 0.421* (0.257)
Crisis(t+2) 0.320** (0.151) 0.0417** (0.193) 0.391** (0.182) 0.416** (0.194)
Public (maj + min)*Crisis(t+2) 0.116 (0.099)
Public (min)*Crisis(t+2) 0.071 (0.087) 0.071 (0.087)
Public (maj)*Crisis(t+2) 0.269 (0.236)
Public (maj > 50%)*Crisis(t+2) 0.459** (0.229) 0.485** (0.238)
Public (maj < 50%)*Crisis(t+2) 0.086 (0.288) 0.108 (0.294)
Crisis(t+3) 0.038 (0.124) 0.0291** (0.125) 0.248** (0.121) 0.294** (0.126)
Public (maj + min)*Crisis(t+3) 0.177* (0.092)
Public (min)*Crisis(t+3) 0.100 (0.086) 0.100 (0.087)
Public (maj)*Crisis(t+3) 0.555** (0.230)
Public (maj > 50%)*Crisis(t+3) 0.381** (0.180) 0.430*** (0.177)
Public (maj < 50%)*Crisis(t+3) 0.583* (0.301) 0.431* (0.306)
Obs. 1,237 1,237 1,237 1,237
#
Bank
Year
CV
R2 0.41 0.42 0.41 0.42
The dependent variable is credit growth, which is the growth rate of loans in real franc CFA. We regress credit growth on crisis and post crisis dummies, bank ownership and bank level variables in the period 2000 2019. Crisis is a dummy equal to 1 if GDP per capita growth is below the country’s 1995 2020 average minus one standard error. Post crisis dummies refer to the year after the crisis event. Public (maj + min) is a dummy equal to 1 if the State is an investor is the bank, Public (min) is equal to 1 if the State is a minority shareholder, Public (maj) if the State is a majority shareholder, Public (maj > 50%) if the State owns more than 50% of equity and Public (maj < 50%) if the State is a majority shareholder but holds less than 50% of capital. The omitted category is privately owned banks. Public dummies are interacted with crisis dummies and post crisis dummies. Year and bank dummies are incorporated in all specifications. Bank level controls (unreported) are the log of total assets, the ratio of equity to total assets, the ratio of loans to assets, the ratio of deposits to total liabilities and the ratio of liquid assets over total assets. All control variables entered with one lag. Models also include interaction between foreign banks and crisis and post crisis years. Models are estimated using an OLS estimator. The p values for clustered standard errors at the bank level are given in parentheses, and ***, **, * correspond to the 1%, 5%, and 10% levels of significance, respectively.
To sum up, econometric results illustrate that public banks continued to lend in the wave of a shock, especially those with a greater State involvement, contrary to private banks. Several arguments can be advanced to explain the public banks’ ability to lend in times of crisis. First, public banks have a mandate (implicit or explicit) to stabilise economic activity (Brei and Schclarek, 2015; Behr et al., 2017). As such, they will consciously increase their credit lines in times of recession even if this implies taking greater risk. Second, the model of public banks is more conducive to maintaining their activities in times of crisis. On the supply side, public banks’ resources are more stable because they rely primarily on their own resources or on debt raised in the financial markets (de Luna Martinez and Vicente, 2012) and because they benefit from a state guarantee, which reassures their creditors and depositors (Brei and Schclarek, 2015). On the demand side, the loan portfolio of public banks is an additional source of stability. Their loans are primarily oriented towards long term corporate loans (de Luna Martinez and Vicente, 2012). While household demand for credit tends to shrink in times of crisis (a fall in housing loans), firms most often need access to additional funds in difficult times when other sources of financing (e.g. commercial loans) dry up. Finally, according to the political view, public bank lending decisions are politically motivated to favour re election (Dinç, 2005) or rent extraction by connected firms (Khwaja and Mian, 2005). As a result, public banks’ lending is less sensitive to macroeconomic evolution than political calendars.
In the following section, we provide tests for two main hypotheses: stability of resources and political view. Indeed, due to a lack of information, we cannot investigate hypotheses based on mandates and loan portfolio composition (demand channel). 12
We considered the hypothesis of stable resources by testing whether the sensitivity of funding during a crisis differed between public banks and private banks. According to this hypothesis, public banks benefit from stable resources because public banks rely primarily on their own resources or on long
12 Papers often ignore the mandate channel due to a lack of information. There are two exceptions. Behr et al. (2017) directly tested this channel and showed that banks with a public mandate are less procyclical than banks without such a mandate. In a recent work, Brei and Schclarek (2018) studied the differences between "commercial" public banks and public development banks. The latter have an explicit developmental mandate. In the case of Latin America, they showed that the two types of public banks act countercyclically without revealing any real difference between the two types of public banks. In the remainder of studies, the mandate hypothesis is often seen as an explanation when other arguments are not sufficient to explain the observed facts. As in previous papers, we lack information on the mandate. Testing the demand side hypothesis implies getting access to the investment portfolio, which was missing from our dataset.
term debt raised on the financial markets (de Luna Martinez and Vicente, 2012), and they usually benefit from a state guarantee, which avoids bank runs (Brei and Schclarek, 2015).
We first examined whether public banks’ resources were more stable than those of private banks in times of crisis. In doing so, we applied regressions analogous to column (4) in Table 3, but we replaced credit growth with the growth in total liabilities. Results, displayed in column (1) of Table 5, indicate that private banks suffered from a contraction of funding during and after a crisis. In contrast, public banks’ resources were insensitive to business cycles.
(1) (2) (3) (4)
Crisis(t0)
0.178 0.237 0.181 0.0451 ( 1.46) ( 0.95) ( 1.22) ( 0.90)
Public*Crisis(t0) 0.248* 0.252 0.431 0.136 (1.97) (0.91) (0.62) (1.36)
Crisis(t+1)
0.227** 0.306* 0.085 0.0992 ( 2.12) ( 1.75) ( 0.39) ( 1.46)
Public*Crisis(t+1) 0.234** 0.329* 0.294 0.154 (2.17) (1.89) (1.02) (1.62)
Crisis(t+2)
0.160** 0.195 0.408 0.100 ( 2.08) ( 1.36) (0.87) ( 1.52)
Public*Crisis(t+2) 0.213** 0.234* 0.500 0.354 (2.62) (1.67) ( 0.98) (1.38)
Crisis(t+3)
0.087 0.188 0.133 0.0533** ( 1.49) ( 1.15) (0.65) ( 2.17)
Public*Crisis(t+3) 0.217** 0.987 0.0356 0.167* (2.47) (1.40) (0.10) (1.84)
Obs. 1236 1236 1236 1236 banks 108 108 108 108 Yes Yes Yes 0.20 0.21 0.03 0.18
The dependent variable is the growth of liabilities in column (1), of deposits in column (2), of non deposit liabilities in column (3) and the transformation ratio in column (4). We regress dependent variables on crisis and post crisis dummies, bank ownership and bank level variables in the period 2000 2019. Crisis is a dummy equal to 1 if GDP per capita growth is below the country’s 1995 2020 average minus one standard error. Post crisis dummies refer to the year after the crisis event. Public is a dummy equal to 1 if the bank is a domestic state owned bank (majority holder is the State). The omitted category is privately owned banks. Public dummy is interacted with crisis dummies and post crisis dummies. Year and bank dummies are incorporated in all specifications. Bank level controls (unreported) are the log of total assets, the ratio of equity to total assets, the ratio of loans to assets, the ratio of deposits to total liabilities and the ratio of liquid assets over total assets. All control variables entered with one lag. Models also include interaction between foreign banks and crisis and post crisis years. Models are estimated using an OLS estimator. The p values for clustered standard errors at the bank level are given in parentheses, and ***, **, * correspond to the 1%, 5%, and 10% levels of significance, respectively.
We then examined which type of State bank funding retracted relatively less than that of private banks during a downswing in the business cycle. We distinguished between deposits and non deposit liabilities. This distinction between deposits (column 2) and non deposit liabilities (column 3) shed lights on two possible explanations for the stability of public banks’ resources. Results in column (2) of Table 5 indicate that the difference between private banks and public banks was driven by an evolution of deposits in the wave of the crisis. This result indicates that public banks benefitted from stable resources because depositors were less likely to withdraw their deposits from public banks. In the short run, we did not see a clear difference in terms of other liabilities, as indicated in column (3) of Table 5
In the fourth column of Table 5, we confirmed the importance of resources’ stability channel by scrutinising the transformation ratio in times of crisis. We computed the transformation ratio as the ratio of loans to deposits. If results were driven by a change in lending behaviour, we should have observed a contraction of the transformation ratio during a crisis. In other words, for a given level of deposits, a bank will contract its lending. However, if the explanation is based on resource availability, the contraction in lending can be explained by the contraction in deposits, and the ratio of loans to deposits remains unchanged. Results displayed in the last column of Table 5 are in line with the latter explanation and the resources stability channel.
In the Appendix A, we followed the previous approach consisting of distinguishing within public banks between banks where the State holds more than 50% of capital and other public banks (defined as banks where the State is the major shareholder but owns less than 50% of the equity). We may expect that the former group would benefit from a large implicit insurance and therefore deposit liabilities would be less sensitive to macroeconomic growth. Results confirmed the prediction. The stability of resources was stronger among banks having a larger share of public ownership.
We then studied the impact of political cycles. Lending behaviour can be driven by the electoral calendar, as stated by the political view. According to this view, lending by State owned banks increases in electoral periods (Dinç, 2005). The risk for our analysis was that macroeconomic cycles could be (positively or negatively) related to the political calendar. On the positive side, incumbents may stimulate economic activity notably by favouring loan approval by public banks to favour their re election. On the other side, elections can trigger conflicts and therefore downturns, as illustrated by the Côte d’Ivoire in 2000 03 and 2011. To sum up, private banks can be reluctant to lend in election times, while public banks continue to lend and even increase their lending activity. If the election calendar is related to macroeconomic conditions, we can simply capture the relationship between public bank lending during election cycles rather than their response to macroeconomic events.
To test this hypothesis, we extended the model described in Eq. 2 by adding interactions between election year dummies and public bank dummies. We identified the election years in the eight countries. Not all elections are of the same importance; in the countries under investigation,
presidential elections played a major role because the political regimes are presidential regimes or because the president dominates the political life (as in Togo). We considered the following 34 presidential elections: Benin (2001, 2006, 2011, 2016), Burkina Faso (2005, 2010, 2015, 2020), Côte d’Ivoire (2000, 2010, 2015, 2020), Guinea Bissau (2005, 2009, 2012, 2014, 2019), Mali (2002, 2007, 2013, 2018), Niger (2004, 2011, 2016, 2020), Senegal (2000, 2007, 2012, 2019) and Togo (2005, 2010, 2015, 2020). For each election, we created a dummy equal to one in the year of the election in the country. We also created a dummy for the pre election year and a dummy for the post election year.
Table 6. Testing the political view (1) (2) Coef. Std Dev. Coef. Std Dev.
Crisis(t0) 0.058 (0.359) 0.099 (0.271)
Public*Crisis(t0) 0.037 (0.395) 0.113 (0.311)
Crisis(t+1)
0.513** (0.249) 0.521* (0.279)
Public*Crisis(t+1) 0.435* (0.252) 0.457* (0.280)
Crisis(t+2) 0.415** (0.194) 0.427** (0.216)
Public*Crisis(t+2) 0.262 (0.237) 0.254 (0.254)
Crisis(t+3) 0.262* (0.135) 0.39*** (0.73)
Public*Crisis(t+3) 0.523** (0.233) 0.648** (0.259)
Election(t 1) 0.374 (0.255)
Public*Election(t 1) 0.352 (0.259)
Election(t0) 0.128 (0.181) 0.094 (0.312)
Public*Election(t0) 0.072 (0.187) 0.073 (0.222)
Election(t+1) 0.211* (0.111)
Public*Election(t+1) 0.288* (0.146)
Obs. 1237 1237 banks 108 108
Bank FE Yes Yes FE R2 0.32 0.34
The dependent variable is credit growth. We regress dependent variables on crisis and post crisis dummies, election dummies, bank ownership and bank level variables in the period 2000 2019. Crisis is a dummy equal to 1 if GDP per capita growth is below the country’s 1995 2020 average minus one standard error. Post crisis dummies refer to the year after the crisis event. Public is a dummy equal to 1 if the bank is a domestic state owned bank (majority holder is the State). The omitted category is privately owned banks. Public dummy is interacted with crisis dummies and post crisis dummies. Year and bank dummies are incorporated in all specifications. Bank level controls (unreported) are the log of total assets, the ratio of equity to total assets, the ratio of loans to assets, the ratio of deposits to total liabilities and the ratio of liquid assets over total assets. All control variables enter with one lag. Models also include interaction between foreign banks and crisis and post crisis years. Models are estimated using an OLS estimator. The p values for clustered standard errors at the bank level are given in parentheses, and ***, **, * correspond to the 1%, 5%, and 10% levels of significance, respectively.
If the political view is confirmed, we should observe that lending by public banks increased in election and pre election years. In addition, if our main results are explained by the omission of the political view, we could see a reduction in the coefficients associated with the interaction between crisis and public dummies.
Results, presented in Table 6, do not support the political view. They indicate that the inclusion of dummies for electoral cycles did not influence our main results. Public banks did not react to electoral cycles. This result contradicts some evidence that suggests that State owned banks are politically captured, especially in countries with weak institution levels (Shleifer and Vishny, 1994; La Porta et al., 2002; Dinç, 2005). This finding proves that the countercyclicality was not due to the political view hypothesis.
To sum up, regressions presented in this subsection document that public banks act countercyclically because their resources, especially deposits, are more stable than those of private banks. Public banks benefit from an implicit insurance, and this effect is stronger when the State owns a larger share of the capital. Our results did not offer support for the political view. Unfortunately, we cannot test two other possible channels: mandate and loan portfolio composition. We cannot reject that public banks, in addition to stable resources, benefit from an implicit or explicit mandate to support economic activity during downturns. However, we do not believe that the positive role of public banks can be strongly explained by the portfolio composition because almost all loans in the WAEMU are oriented towards firms rather than households in these countries (Léon, 2018).
We concluded the analysis by evaluating the possible side effects of the countercyclicality of public banks on performance and portfolio quality. While a substantial number of papers document that government banks stabilise economies during downturns, increased lending does not necessarily benefit the economy, especially in countries with low levels of institutional development (Bertray et al., 2013; Coleman and Feler, 2015; Chen et al., 2016). Public banks can allocate their funds to connected firms (Khwaja and Mian, 2005, Sapienza, 2005), and this support can be increased during downturns due to limited scrutiny of banks’ lending strategies (Coleman and Feler, 2015). In addition, during a crisis, public support including lending by public banks can help to maintain zombie firms above the waterline (Zoller Rydzek and Keller, 2020; Huneeus et al., 2022). However, these firms will fail to repay their loans in the long run. As a result, the countercyclicality of public banks can have an adverse effect by inducing a degradation of public banks’ balance sheets.
In the final part of the article, we scrutinize the impact of crisis and post crisis episodes on public banks’ health. To do so, we investigate the evolution of the financial performance and risk profile of public banks in times of crisis. In doing so, we replicated the model run in the last column of Table 3, but we changed the dependent variables by considering proxies of performances and risk profile.
We considered two customary indicators of financial performances, namely return on assets and return on equity. If public banks misallocate their funds during downturns, we should observe a degradation of performance (lower RoA and RoE). Results, presented in Table 7, do not lend support to this hypothesis. Econometric results indicated that public banks outperformed private banks during and after a crisis, as indicated by coefficients associated with interactions in columns (1) and (2) of Table 7. However, differences were not statistically significant, indicating an absence of strong heterogeneity between private and public banks. In any case, public banks did not underperform in times of crisis.
(1) (2) (3) (4)
Crisis(t0) 0.010 0.011 0.001 37.67** (0.87) (0.11) ( 0.12) ( 2.12)
Public*Crisis(t0) 0.031 0.531** 0.021** 7.578 (1.54) (2.09) (2.05) (0.28)
Crisis(t+1)
0.005 0.061 0.002 15.90 ( 0.39) ( 0.57) (0.30) ( 0.70)
Public*Crisis(t+1) 0.030* 0.235 0.015 22.93 (1.74) (1.47) (1.35) ( 0.63)
Crisis(t+2)
0.017 0.201 0.004 9.561 ( 0.77) ( 0.77) ( 1.18) (0.51)
Public*Crisis(t+2) 0.034 0.412 0.025 29.65 (1.36) (1.49) (1.56) ( 1.20)
Crisis(t+3)
0.006 0.127 0.003 73.43 (0.43) (0.93) ( 1.05) (0.77)
Public*Crisis(t+3) 0.019 0.0458 0.003 91.20 (1.07) (0.28) (0.62) ( 0.95)
Obs. 1137 1133 1230 1003 banks 108 108 108 0.061 0.181 0.029
The dependent variable is the return on assets in column (1), return on equity in column (2), loan loss provisions in column (3) and the Z score in column (4). We regress dependent variables on crisis and post crisis dummies, bank ownership and bank level variables in the period 2000 2019. Crisis is a dummy equal to 1 if GDP per capita growth is below the country’s 1995 2020 average minus one standard error. Post crisis dummies refer to the year after the crisis event. Public is a dummy equal to 1 if the bank is a domestic state owned bank (majority holder is the State). The omitted category is privately owned banks. Public dummy is interacted with crisis dummies and post crisis dummies. Year and bank dummies are incorporated in all specifications. Bank level controls (unreported) are the log of total assets, the ratio of equity to total assets, the ratio of loans to assets, the ratio of deposits to total liabilities and the ratio of liquid assets over total assets. All control variables enter with one lag. Models also include interaction between foreign banks and crisis and post crisis years. Models are estimated using an OLS estimator. The p values for clustered standard errors at the bank level are given in parentheses, and ***, **, * correspond to the 1%, 5%, and 10% levels of significance, respectively.
We then tested the deterioration of portfolio quality by considering two proxies of risk profile. A common indicator in addition to provisions is non performing loans (NPLs). Unfortunately, we could not get access to the share of NPLs by bank year. We therefore exploited information on the loan loss provisions over loans. In the presence of a deterioration in the loan portfolio, banks will increase their risk provisions. We also computed a measure of bank soundness by computing the Z score. The Z score measures the solvency of a bank and is the sum of the average return on assets and average equity to assets divided by the standard deviation of the return on assets. A decrease in the Z score indicates a deterioration in bank soundness. Results displayed in columns (3) and (4) do not indicate a statistical difference between private and public banks during and after a crisis. In detail, we saw a slight degradation in banks’ portfolio quality in crisis years (column 3) but not after a crisis. We also documented a reduction in bank soundness, proxied by the Z score, but differences between public and private banks were not statistically significant.
To sum up, econometric results displayed in Table 7 do not support the view that the countercyclical activity of public banks caused their performance and health to deteriorate.
The COVID 19 crisis has reignited the debate about the role of public banks in times of crisis. Despite the reduced impact of the current pandemic, African countries are among the most unstable economies due to their high exposure to external shocks and low capacity to mitigate them. African States have few tools at their disposal because of the difficulty of mobilising fiscal resources. Public banks are nevertheless a useful instrument due to their ability to raise their own resources and their importance in banking financial markets.
In spite of a rich literature on the countercyclicality of public banks in the developing world, we know little about the role of public banks in times of crisis in Africa. This paper fills this gap by exploring data on the range of banks operating in eight West African countries (Benin, Burkina Faso, Côte d’Ivoire, Guinea Bissau, Mali, Niger, Senegal and Togo) from 2000 to 2019. Our final sample included 112 banks, including 24 public banks defined as banks where the State is the main shareholder. We tested whether public banks maintained their lending during and three years after a crisis. To define crisis, we relied on country GDP per capita evolution. We identified 16 crisis episodes during this period in the eight countries.
The empirical analysis provided four main findings. First, lending tended to decrease more after a crisis than during a crisis. Second, public banks did not behave differently than private banks during a crisis. Third, we document that public banks maintained their lending in the wave of a crisis, contrary to private banks that contract their loans. Finally, we document that banks in which the State owns the absolute majority of the capital reacted more strongly than other public banks.
We then tried to understand what explains the positive impact of public banks. Empirical results document that public banks acted countercyclically because their resources, especially deposits, are more stable than the funds of private banks. This finding is in line with the argument that public banks benefit from an implicit insurance (Brei and Schclarek, 2015). Our results do not lend support to the political view, arguing that public banks are impacted more by elections than an economic crisis. Our data do not allow to reject that public banks, in addition to stable resources, benefit from a mandate to support economic activity during downturns. However, we do not believe that our results can be explained by a difference in portfolio composition between public and private banks insofar as the majority of loans in the WAEMU are allocated to firms (Léon, 2018).
We finally scrutinised whether countercyclicality comes with costs in the final part of the article. To do so, we studied whether the health of public banks deteriorated more than that of their counterparts during and after a crisis. Contrary to previous works (Bertray et al., 2013; Coleman and Feler, 2015; Chen et al., 2016), we did not observe that the countercyclicality of public banks was detrimental to the performance and stability of public banks.
The results of this work, together with those provided by other research, highlight a clear role for public banks following the occurrence of a crisis (with possibly a small short term delay). This was confirmed during the COVID 19 pandemic. If public banks, and the State in general, are able to react to crises, the question of anticipating future crises arises. In particular, it is now recognised that many countries, particularly in Africa, are suffering and will continue to suffer more and more intensely from the climate crisis. Therefore, it is important to question the role of public banks in coping with this future shock.
Behr, P., Foos, D., Norden, L. (2017)
Cyclicality of SME lending and government involvement in banks. Journal of Banking & Finance 77, 64 77.
Bertray, A.C., Demirgüç-Kunt, A., Huizinga, H. (2015)
Bank ownership and credit over the business cycle: Is lending by state banks less procyclical? Journal of Banking & Finance 50, 326 339.
Brei, M., Schclarek, A. (2013)
Public bank lending in times of crisis. Journal of Financial Stability 9, 820 830.
Brei, M., Schclarek, A. (2015)
A theoretical model of bank lending: Does ownership matter in times of crisis ? Journal of Banking & Finance 50, 298 307.
Brei, M., Schclarek, A. (2018)
The countercyclical behaviour of national development banks in Latin America and the Caribbean. In Griffith Jones, S., Ocampo, J.A., Rezende, F., Schclarek, A., Brei, M. (eds.). The Future of National Development Banks, Chapter 11, 278 301.
Chen, Y-S., Chen, Y., Lin C-Y., Sharma, Z. (2016)
Is there a bright side to government banks? Evidence from the global financial crisis. Journal of Financial Stability 26, 128 143.
Coleman, N., Feler, L. (2015)
Bank ownership, lending, and local economic performance during the 2008 2009 financial crisis. Journal of Monetary Economics 71, 50 66.
Cull, R., Martinez Peria, M.S. (2013)
Bank ownership and lending patterns during the 2008 2009 financial crisis: Evidence from Latin America and Eastern Europe. Journal of Banking & Finance 37, 4861 4878.
Dinç, I.S. (2005)
Politicians and banks: Political influences on government owned banks in emerging markets. Journal of Financial Economics 77, 453 479.
de Luna-Martinez, J., Vicente, C.L. (2012)
Global survey of development banks. World Bank Policy Research Working Paper 5669.
Frigerio, M., Vandone, D. (2020)
European development banks and the political cycle. European Journal of Political Economy 62, 101852.
Huneeus, F., Kaboski, J.P., Larrain, M., Schmukler, S.L., Vera, M. (2022)
The distribution of crisis credit: Effects on firm indebtedness and aggregate risk. NBER Working Papers 29774.
Iannotta, G., Nocera, G., Sironi, A. (2013)
The impact of government ownership on bank risk. Journal of Financial Intermediation 22, 152 176.
Kanga, D., Murinde, V., Soumaré, I. (2020)
Capital, risk and profitability of WAEMU banks: Does bank ownership matter? Journal of Banking & Finance 114, 105814.
Kanga, D., Murinde, V., Soumaré, I. (2021)
How has the rise of pan African banks impacted bank stability in WAEMU? Journal of International Financial Markets, Institutions and Money 73, 101364.
Khwaja, A.I., Mian, A. (2005)
Do lenders favor politically connected firms? Rent provisions in an emerging financial market. Quarterly Journal of Economics 120(4), 1371 1411.
La Porta, R., Lopez-De-Silanes, F., Shleifer, A. (2002)
Government ownership of banks. Journal of Finance 62(1), 265 301.
Léon, F. (2016)
Does the expansion of regional cross border banks affect competition in Africa? Indirect evidence. Research in International Business and Finance 37, 66 77.
Léon, F. (2018)
The credit structure database. CREA Discussion Papers 2018 07, data available at: https://sites.google.com/site/flori anleon/publications
Micco, A., Panizza, U. (2006)
Bank ownership and lending behavior. Economics Letters 93, 248 254.
Saidane, D., Sène, B. Kanga, D. (2021)
Pan African banks, banking interconnectivity: A new systemic risk measure in the WAEMU. Journal of International Financial Markets, Institutions and Money 74, 101405.
Sapienza, P. (2004)
The effects of government ownership on bank lending. Journal of Financial Economics 72, 357 384.
Shleifer, A., Vishny, R. (1994) Politicians and firms. Quarterly Journal of Economics 109, 995 1025.
Zins, A., Weill, L. (2018) Cyclicality of lending in Africa: The influence of bank ownership. Emerging Markets Review 37, 164 180.
Zoller Rydzek, B. Keller, F. (2020) Covid 19: Guaranteed loans and zombie firms. CESifo Economic Studies 66(4), 322 364.
Figure A1. GDP per capita growth and busts (Benin, Burkina, Côte d’Ivoire, Guinea-Bissau)
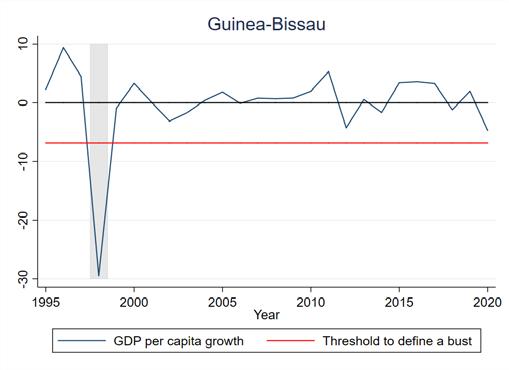
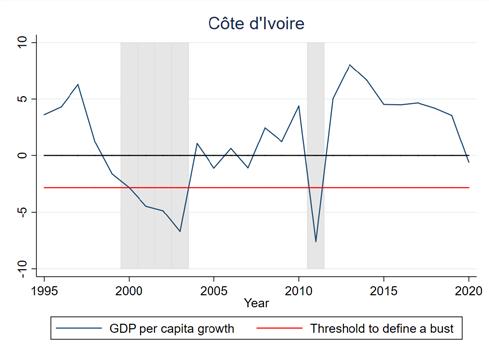
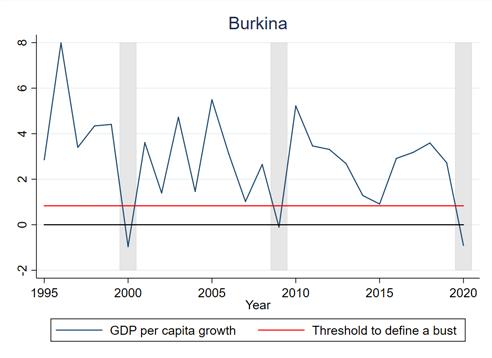
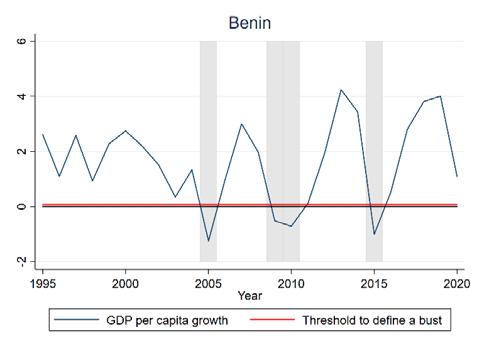
Figure A2. GDP per capita growth and busts (Mali, Niger, Senegal, Togo)
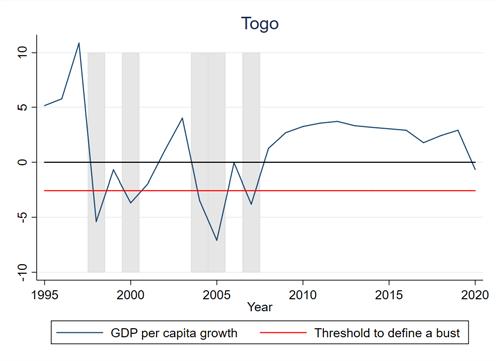
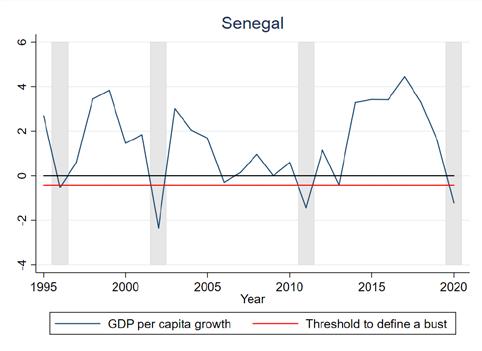
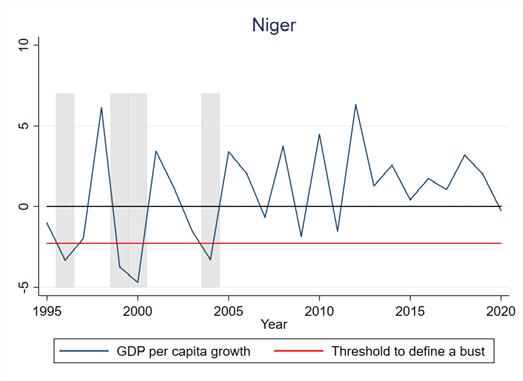
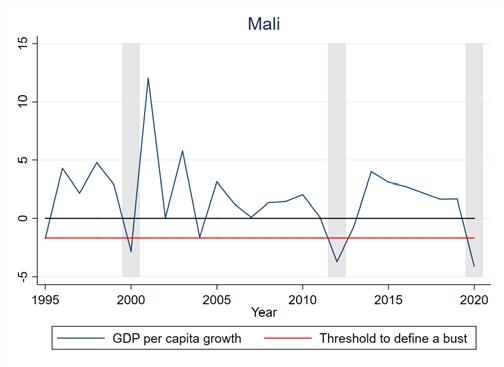
Table A1. A synthesis of literature on the cyclicality of public banks in developing countries
Authors Public ownership Business cycle Econometric model
Micco & Panizza (2006) > 50% GDP growth FE Static
Brei & Schclarek (2013) > 50% Banking crisis Dynamic panel
Cull & Martinez Peria (2013) > 50% Dummy (2008 09) FE Static
Betray et al. (2015) Majority owner Per capita income growth Dynamic panel
Chen et al. (2016) > 20% Dummy (2009) Pre post model
Brei & Schclarek (2017) > 50% (NDBs: no deposit) Banking crisis Dynamic panel
Zins & Weill (2018) Majority owner GDP per capita growth Dynamic panel
Authors Decription Geography (SS Africa) % of PBs
Micco & Panizza (2006) 25323 obs (1995 2002) Unknown Unknown
Brei & Schclarek (2013) 764 banks from 50 countries (1994 2009) Latin America and Europe 8%
Cull & Martinez Peria (2013) 403 banks from 14 countries (2004 2009) Latin America and Europe 8%
Bertay et al. (2015) 1633 banks from 111 countries (1999 2010) International (69 banks from 16 SSA countries) 17%
Chen et al. (2016) 2547 banks from 56 countries (2004 2010) International (9 banks from 2 African countries) 4%
Brei & Schclarek (2017) 336 banks from 31 countries (1995 2014) Latin America 14%
Zins & Weill (2018) 190 banks from 20 countries (2002-2015) North Africa (59 banks) and SSA (131) 12%
Authors (Impact of public banks)
Micco & Panizza (2006) Procyclical (but less than private); Stronger effect in developing countries
Brei & Schclarek (2013) Counter cyclical
Cull & Martinez Peria (2013) Counter cyclical only in Latin America but not in Eastern Europe
Bertay et al. (2015) Procyclical (but less than private); Stronger in high income countries and countries with good governance
Chen et al. (2016) Procyclical (but less than private); In countries with high corruption, there is a degradation of portfolio quality.
Brei & Schclarek (2017) Counter cyclical
Zins & Weill (2018) No lending difference between domestic private banks and State owned banks (procyclical)
Variable Obs. Mean Std Dev. Min. Max. Credit growth 1,490 0.23 0.69 0.54 9.46
Public 1,490 0.20 0.40 0.00 1.00
Foreign 1,490 0.71 0.45 0.00 1.00
GDPpc growth 1,490 0.02 0.03 0.08 0.08
Crisis 1,490 0.11 0.31 0.00 1.00
Total assets 1,490 216,612 252,139 1,025 2,221,183
Equity 1,489 0.13 0.20 0.00 1.93
Loan/TA 1,490 0.55 0.15 0.07 0.91
Deposit 1,487 0.69 0.19 0.00 2.58
Liquidity 1,207 0.24 0.13 0.01 0.72
Credit growth Annual change in total customer loans in real terms (in %) %
Public Dummy equal to 1 if the main shareholder is the State Y/N Foreign Dummy equal to 1 if the main shareholder is a foreigner Y/N
GDPpc growth Annual percentage growth of GDP per capita %
Crisis
Post crisis(+1)
Post crisis(+2)
Post crisis(+3)
Total assets
Dummy equal to 1 if a country experienced a major economic shock (growth of GDP per capita below the mean minus one standard deviation) Y/N
Dummy equal to 1 if a country experienced a major economic shock (growth of GDP per capita below the mean minus one standard deviation) in the previous year Y/N
Dummy equal to 1 if a country experienced a major economic shock (growth of GDP per capita below the mean minus one standard deviation) in two years before Y/N
Dummy equal to 1 if a country experienced a major economic shock (growth of GDP per capita below the mean minus one standard deviation) in three years before Y/N
Total assets in constant FCFA (one lag) Value
Equity Ratio of equity to total assets %
Loan/Ta Ratio of loan to total assets %
Deposit Ratio of deposits over total liabilities %
Liquidity Ratio of liquid assets to total assets %
Crisis(t0)
Public*Crisis(t0)
(1) (2) (3) (4) (5)
0.152 0.459* 0.0375 0.136 0 .178 (0.54) ( 1.73) (0.11) (0.38) (0.34)
0.294 0.450 0.133 0.054 0.175 ( 0.97) (1.53) ( 0.35) ( 0.14) ( 0.31)
Public*GFC(t0) 0.190 (0.96)
Crisis(t+1)
Public*Crisis(t+1)
0.594* 0.653** 0.0473 0.537** 0.568** ( 1.89) ( 2.22) (0.20) ( 2.33) (2.07)
0.634* 0.699** 0.286 0.444* 0.482** (1.96) (2.18) ( 0.87) (1.90) ( 2.42)
Public*GFC(t+1) 0.306 (1.51)
Crisis(t+2)
Public*Crisis(t+2)
0.464 0.347 0.533 0.400** 0.430** ( 1.35) ( 1.20) (1.29) ( 2.18) ( 2.42)
0.616* 0.460 0.716 0.237 0.269 (1.70) (1.48) ( 1.61) (1.04) (1.19)
Public*GFC(t+2) 0.205 (0.93)
Crisis(t+3)
Public*Crisis(t+3)
0.392* 0.474** 0.440 0.257** 0.280** ( 1.77) ( 2.24) (1.45) ( 2.13) ( 2.38)
0.436* 0.547** 0.879* 0.506** 0.551** (1.79) (2.34) ( 1.74) (2.24) (2.41)
Public*GFC(t+3) 0.304 (0.71)
GDPpc growth 1.125* (1.71) 1237 1146 1237
The dependent variable is Credit growth, which is the growth rate of loans in real Franc CFA in columns (1) to (4) and interbank loans in columns (5) and (6). We regress Credit growth on crisis and post crisis dummies, bank ownership and bank level variables in the period 2000 2019. Crisis is a dummy equal to one if GDP per capita growth is negative in columns (1) and (2) and equal to one if GDP growth is below the 1995 2020 country mean minus standard errors in columns (3) and (4) and equal to one if GDP per capita growth is below the 1995 2020 country mean minus standard errors in columns (5) and (6). Post crisis dummies refer to year after crisis event. Public is a dummy equal to 1 if the bank is a state owned bank. Public dummy is interacted with crisis dummies and post crisis dummies. Year and bank dummies are incorporated in all specifications. Bank level controls (unreported) are the log of total assets, the ratio of equity to total assets, the ratio of loans to assets, the ratio of deposits to total liabilities, and the ratio of liquid assets over total assets. Models also include interaction between foreign banks and crisis and post crisis years. All control variables enter with on lag. Models is estimated using OLS estimator. The p values for clustered standard errors at the bank level are given in parentheses and ***, **, * correspond to the 1%, 5%, and 10% levels of significance, respectively.
Crisis(t0)
Table A5. Stability of resources, by share of public ownership (1) (2) (3) (4)
0.177 0.231 0.173 0.0463 ( 1.44) ( 0.93) ( 1.15) ( 0.93)
Public (majority > 50%)*Crisis(t0) 0.327** 0.242 0.871 0.134 (2.37) (0.87) (0.60) (0.76)
Public (majority < 50%)*Crisis(t0) 0.187 0.217 0.115 0.144 (1.46) (0.76) (0.49) (1.48)
Crisis(t+1)
0.226** 0.304* 0.0782 0.0984 ( 2.11) ( 1.78) ( 0.35) ( 1.44)
Public (majority > 50%)*Crisis(t+1) 0.278** 0.258* 0.854 0.214 (2.28) (1.66) (0.98) (1.47)
Public (majority < 50%)*Crisis(t+1) 0.157 0.311 0.210 0.0976 (1.31) (1.37) ( 0.69) (1.15)
Crisis(t+2)
0.159** 0.186 0.417 0.103 ( 2.04) ( 1.32) (0.85) ( 1.54)
Public (majority > 50%)*Crisis(t+2) 0.209** 0.219** 0.275 0.165 (2.23) (2.15) ( 0.67) (1.59)
Public (majority < 50%)*Crisis(t+2) 0.0900 0.322 0.694 0.498 (0.94) ( 0.67) ( 1.37) (1.22)
Crisis(t+3) 0.0874 0.190 0.134 0.0510** ( 1.48) ( 1.16) (0.64) ( 2.04)
Public (majority > 50%)*Crisis(t+3) 0.178** 0.265** 0.0235 0.350 (2.31) (2.19) ( 0.07) (1.57)
Public (majority < 50%)*Crisis(t+3) 0.242** 1.407 0.0813 0.0582 (2.20) (1.38) (0.19) (1.28)
Obs. 1236 1236 1236 1236 # banks 108 108 108 108
Bank FE Yes Yes Yes Yes
Year FE Yes Yes Yes Yes
CV Yes Yes Yes Yes R2 0.20 0.21 0.03 0.18
The dependent variable is the growth of liabilities in column (1), of deposits in column (2), of non deposit liabilities in column (3), the transformation ratio in column (4). We regress dependent variables on crisis and post crisis dummies, bank ownership and bank level variables in the period 2000 2019. Crisis is a dummy equal to one if GDP per capita growth is below the country 1995 2020 average minus one standard errors. Post crisis dummies refer to year after crisis event. Public (maj > 50%) if the State owns more than 50% of equity and Public (maj < 50%) is the State is a majority shareholder but holds less than 50% of capital. The omitted category is privately owned banks. Public dummy is interacted with crisis dummies and post crisis dummies. Year and bank dummies are incorporated in all specifications. Bank level controls (unreported) are the log of total assets, the ratio of equity to total assets, the ratio of loans to assets, the ratio of deposits to total liabilities, and the ratio of liquid assets over total assets. All control variables enter with on lag. Models also include interaction between foreign banks and crisis and post crisis years. Models is estimated using OLS estimator. The p values for clustered standard errors at the bank level are given in parentheses and ***, **, * correspond to the 1%, 5%, and 10% levels of significance, respectively.
The baseline model consists on analyzing how public banks behave during and after a crisis. As explained in the manuscript, another approach has been developed to assess countercyclacility of public banks: the sensitivity of credit growth to macroeconomic growth. For sake of transparency, we present results using this model. We show that our findings are closed to those provided by Zins and Weill (2018).
We follow approach adopted by previous works (Bertay et al., 2015; Zins and Weill, 2018) by running the following equation:
Where ������������������������ ������������ is the consumer credit growth of bank i operating in country c at year t, �������������������� ������������, is the annual growth of GDP per capita in country c at year t, ���������������������������� and �������������������������������� are dummy variables equals to one if the firm is a public or a foreign bank, respectively. We add bank fixed effects (�������� ) 13 allowing us to control for all unobserved time constant characteristics of the bank and time fixed effects (�������� ) to control for common shocks (as change in monetary policy, which is common in WAEMU).
We finally add several bank level control variables (��������,����,���� 1 ). The log of total assets (in constant local currency) controls for bank size. The ratio of equity to total assets is added to control for bank soundness. We also include the ratio of loans over assets that represents the relative importance of lending in a bank’s activities. The liquidity ratio, constructed as the ratio of liquid assets to total assets, allows us to measure bank soundness and its ability to sustain lending. We finally include deposits over total liabilities as a measure of the stability of bank’s funding (non deposit funding tends to flee quickly during periods of instability). In line with previous works, all bank level control variables are one year lagged. Description of variables are displayed in Table A2.
Eq. (1) is first estimated using a static model. We then consider a dynamic model, by including the lagged dependent variable in regressions (������������������������ ������������,����,���� 1 ). For the latter specification, we do not longer rely on OLS and employ a dynamic GMM System estimator developed by Blundell and Bond (1998) using two step GMM estimation and the Windmeijer (2005) correction to minimize the downward bias in standard errors.
13 Contrary to existing works (Bertray et al., 2015; Zins and Weill, 2018) that rely on country dummies, we prefer to incorporate bank fixed effects that encapsulate country time invariant factors. In addition, the bank status in level is taken into consideration by the inclusion of bank dummies. Results are not sensitive to this choice.
According to the hypothesis of procyclicality of banks, we expect that ����1 > 0 indicating that banks increase lending in periods of booms and reduces them during slowdowns. Public banks are less procyclical than domestic private banks if: ����2 < 0. Public banks act counter cyclicality if (����1 + ����2 ) < 0 14
We first replicate a model of sensitivity of loan growth to macroeconomic growth to study whether public banks differ from their counterparts in West Africa. Table B1 displays econometric results for the static model. The first column only incorporates GDP per capita growth without interactions. The second column adds interactions with ownership variables (Public and Foreign). The third column incorporates bank level control variables. The last two columns decompose analysis between periods of positive (column 4) and negative (column 5) growth to investigate whether public banks react differently in the two phases.
Result displayed in the first column of Table B1 indicates that banks are procyclical in WAEMU as indicated by the positive coefficient associated to the GDP per capita growth (����1 ). In economic terms, a one percent point increase of GDP per capita growth raises lending by 1.3 pp. We then interact GDP per capita growth with indicators for public ownership in the rest of the Table B1. While interactions are negative, they are not statistically significant at the usual thresholds. The results are therefore in line with those reported by Zins and Weill (2018) for a sample of North and sub Saharan African banks but challenge results from other continents (cf. Table A1). Finally, we decompose between periods of positive and negative growth. We highlight that public banks do not differ from domestic private banks in periods of growth (procyclical). However, they tend to maintain their lending during slowdowns (column 5). This result should be treated with caution due to the sharp reduction in the number of observations.
Table B4 replicates the same model by using a dynamic panel data as often implemented in the literature (Bertay et al., 2015; Zins and Weill, 2018). The intuition between dynamic model is that dependent variable presents an inertia. We employ the System GMM estimators due to bias induced by OLS in dynamic panel model. We first validate the model specifications by reporting the usual tests displayed at the bottom of the Table B2. 15 Findings regarding interest variable (GDP per capita growth and interactions with ownership) are in line with static model, even if statistical significance is reduced. The loss of efficiency can be explained by the nature of the estimator (instrumental variable
14
The same analysis can be done for foreign owned banks by referring to ����3 instead of ����2
15 As expected AR(1) is significant contrary to AR(2) validating the lag structure retained. In addition, instruments set is not endogenous as indicated by the Hansen over identification test.
approach). We do not longer rely on dynamic panel because credit growth does not present a strong inertia. Coefficient associated with lagged credit growth is almost never statistically significant and its size is rather limited. As a result, the rest of analysis is based on a static model.
We check whether our main findings are still observed when replacing GDP per capita growth with GDP growth rate as a measure of the business cycle. Results, available upon request point out that this change does not alter our conclusion.
To sum up, the first analysis of the sensibility of lending to economic growth point out that (i) banks in WEAMU are procyclical, (ii) public banks do not strongly differ from domestic private banks, except during downturns.
Table B1. Sensitivity of lending to GDP per capita growth, static model (1) (2) (3) (4) (5)
GDPpc growth 1.305*** 2.243** 2.169* 1.731 8.225** (3.00) (2.18) (1.83) (0.50) (2.43)
Public*GDPpc growth 1.594 1.429 0.0585 7.863** ( 1.32) ( 1.04) ( 0.01) ( 2.25)
Total Assets (log) 0.146** 0.142** 0.205** ( 2.35) ( 2.01) ( 2.35)
Equity 0.108 0.179 0.214 ( 0.41) ( 0.61) ( 0.62)
Loan/TA 1.120*** 1.373** 0.842** ( 3.00) ( 2.24) ( 2.13)
Deposit 0.124 0.0465 0.0252 (0.61) ( 0.16) ( 0.08)
Liquidity 0.0762 0.227 0.440 (0.20) ( 0.37) (0.91)
b1+b2 0.648 0.741 1.672 0.362 b1+b3 1.411** 0.806 0.953 3.619* Obs. 1490 1490 1237 915 264 # banks 112 112 108 108 92
Bank FE Yes Yes Yes Yes Yes Year FE Yes Yes Yes Yes Yes R² 0.17 0.17 0.32 0.35 0.52
The dependent variable is Credit growth, which is the growth rate of loans in real Franc CFA. We regress Credit growth on bank ownership and bank level variables in the period 2000 2019. GDP per capita growth is the annual percentage growth rate of GDP per capita. Public are dummies respectively equal to 1 if the bank is a domestic state owned bank. The omitted category is privately owned banks. Public bank category is interacted with GDP per capita growth in order to capture the different lending cyclicality relative to domestic private banks' lending cyclicality. Year and bank dummies are incorporated in all specifications. All control variables enter with on lag. Models is estimated using OLS estimator. The p values for clustered standard errors at the bank level are given in parentheses and ***, **, * correspond to the 1%, 5%, and 10% levels of significance, respectively.
Table B2. Sensitivity of lending to GDP per capita growth, dynamic model
(1) (2) (3) (4) (5)
Lag(credit growth) 0.058 0.0614 0.0701** 0.0777 0.175 (1.43) (1.65) (2.12) (1.53) (1.55)
GDPpc growth 0.723 2.029 2.522 0.969 0.264 (1.46) (1.46) (0.91) ( 0.33) ( 0.11)
Public*GDPpc growth 1.419 1.787 0.455 0.386 ( 0.80) ( 0.60) (0.11) (0.16)
Total Assets (log) 0.159* 0.180 0.0469 ( 1.93) ( 1.48) ( 0.37)
Equity 0.664 0.733 0.353 ( 1.37) ( 1.09) ( 0.86)
Loan/TA 0.727 1.431** 0.867 ( 1.46) ( 2.54) ( 0.97)
Deposit 0.0118 0.0501 0.429 (0.05) (0.13) (0.77)
Liquidity 0.622 0.690 1.040 (1.45) (1.39) (1.43)
b1+b2 0.610 0.735 0.514 0.122 b1+b3 1.003* 1.155 0.520 1.082
Obs. 1424 1424 1179 915 264
# banks 111 111 108 108 92
Bank FE Yes Yes Yes Yes Yes
Year FE Yes Yes Yes Yes Yes
# instruments 56 94 166 166 135
AR(1) 0.011 0.011 0.016 0.064 0.099
AR(2) 0.319 0.323 0.859 0.970 0.301
Hansen OIT 0.187 0.225 0.999 0.999 0.994
The dependent variable is Credit growth, which is the growth rate of loans in real Franc CFA. We regress Credit growth on bank ownership and bank level variables in the period 2000 2019. GDP per capita growth is the annual percentage growth rate of GDP per capita. Public are dummies respectively equal to 1 if the bank is a domestic state owned bank. The omitted category is privately owned banks. Public bank category is interacted with GDP per capita growth in order to capture the different lending cyclicality relative to domestic private banks' lending cyclicality. Year and bank dummies are incorporated in all specifications. All control variables enter with on lag. Models is estimated using GMM System estimator (Blundell Bond, 1998). The p values for robust standard errors following the Windjmeier correction are given in parentheses and ***, **, * correspond to the 1%, 5%, and 10% levels of significance, respectively.
Bertay, A.C., Demirgüç Kunt, A., Huizinga, H. (2015)
Bank ownership and credit over the business cycle: Is lending by state banks less procyclical? Journal of Banking & Finance 50, 326 339.
Blundell, R., Bond, S. (1998)
Initial conditions and moment restrictions in dynamic panel data models. Journal of Econometrics 87, 115 143.
Zins, A., Weill, L. (2018)
Cyclicality of lending in Africa: The influence of bank ownership. Emerging Markets Review 37, 164 180.
Windmeijer, F. (2005)
A finite sample correction for the variance of linear efficient two step GMM estimators. Journal of Econometrics 126, 25 51.
What is AFD? Éditions Agence française de développement publishes analysis and research on sustainable development issues. Conducted with numerous partners in the Global North and South, these publications contribute to a better understanding of the challenges faced by our planet and to the implementation of concerted actions within the framework of the Sustainable Development Goals.
With a catalogue of more than 1,000 titles and an average of 80 new publications published every year, Éditions Agence française de développement promotes the dissemination of knowledge and expertise, both in AFD’s own publications and through key partnerships. Discover all our publications in open access at editions. afd.fr.
Towards a world in common.