Transitionof theEuropean powersystem within planetary boundaries


Les Papiers de Recherche de l’AFD ont pour but de diffuser rapidement les résultats de travaux en cours. Ils s’adressent principalement aux chercheurs, aux étudiants et au monde académique. Ils couvrent l’ensemble des sujets de travail de l’AFD : analyse économique, théorie économique, analyse des politiques publiques, sciences de l’ingénieur, sociologie, géographie et anthropologie. Une publication dans les Papiers de Recherche de l’AFD n’en exclut aucune autre.
Les opinions exprimées dans ce papier sont celles de son (ses) auteur(s) et ne reflètent pas nécessairement celles de l’AFD. Ce document est publié sous l’entière responsabilité de son (ses) auteur(s) ou des institutions partenaires.
AFD Research Papers are intended to rapidly disseminate findings of ongoing work and mainly target researchers, students and the wider academic community. They cover the full range of AFD work, including: economic analysis, economic theory, policy analysis, engineering sciences, sociology, geography and anthropology. AFD Research Papers and other publications are not mutually exclusive.
The opinions expressed in this paper are those of the author(s) and do not necessarily reflect the position of AFD. It is therefore published under the sole responsibility of its author(s) or its partner institutions.
Paper issued from the International Research Conference: “Strong Sustainability: How sustainable are Net Zero trajectories?”
Victor Guillot Researcher, MINES Paris - PSL University, Centre for Applied Mathematics (CMA)
Edi Assoumou
Senior Research Fellow, MINES Paris - PSL University, Centre for Applied Mathematics (CMA)
Abstract
Keywords
Antoine Godin (AFD)
Annabelle Moreau Santos (AFD)
Planetary boundaries define a formal framework for a more "integrated" analysis of human activities' impacts on various environmental categories. Their application to energy systems allows assessing the sustainability of different mixes and transition trajectories beyond direct CO2 emissions. In this study, we propose to evaluate the environmental impacts of a carbon neutrality trajectory, expressed in direct CO2 emissions, of the European electricity system on life cycle greenhouse gas emissions, water consumption, land use, and eutrophication. The impact on the consumption of various materials is also assessed. From this neutrality scenario, several transition trajectories, including an explicit constraint on the various impact categories, are then proposed to assess the effect of a broader understanding of sustainability on technology choices. The methodology proposed should be taken as a proof-of-concept of an environmental impact assessment of the European power system with the planetary boundary framework. The method is based on the extension of an intertemporal optimization model of the European electricity system, eTIMES-EU, to highlight possible transfers or convergences between impact categories. The results show that a rapid phaseout of fossil fuels allows a reduction of greenhouse gas emissions as well as other pollutions. However, respecting the planetary boundaries at the European scale requires limiting the demand for electricity and improving industrial processes to reduce the environmental impacts of technologies
Power system, Europe, TIMES, Energy planning, Planetary boundaries
JEL codes
O13, N74, Q47
Original version
English
Accepted
March 2023
This paper was selected following a competitive screening process and was presented at the AFD research international research conference on strong sustainability held on December 2022.
Les limites planétaires définissent un cadre formel pour une analyse plus "intégrée" des impacts des activités humaines sur les différentes composantes environnementales. Leur application aux systèmes énergétiques permet d'analyser la soutenabilité de divers mix et trajectoires de transition au-delà des émissions directes de CO2 Dans cette étude, nous proposons d'évaluer les impacts environnementaux d'une trajectoire de neutre en carbone, exprimée en émissions directes de CO2, du système électrique européen sur le cycle de vie des émissions de gaz à effet de serre, la consommation d'eau, l'utilisation des sols et l'eutrophisation. L'impact sur la consommation de divers matériaux est également analysé. À partir de ce scénario de neutralité carbone, plusieurs trajectoires de transition, incluant une contrainte explicite sur les différentes catégories d'impact, sont ensuite proposées pour analyser les effets de cette compréhension plus large de la soutenabilité sur les choix technologiques. La méthodologie exposée doit être considérée comme une preuve de concept d'une évaluation de l'impact environnemental du système électrique européen dans le cadre des limites planétaires. La méthode est basée sur l'extension d'un modèle d'optimisation intertemporelle du système électrique européen, eTIMES-EU, afin de mettre en évidence les transferts ou convergences possibles entre les catégories d'impact.
Les résultats montrent qu'une élimination rapide des combustibles fossiles permet de réduire les émissions de gaz à effet de serre ainsi que d'autres pollutions. Cependant, le respect des limites planétaires à l'échelle européenne requiert de limiter la demande d'électricité et d'améliorer les processus industriels pour réduire les impacts environnementaux des technologies.
Mots-clés
Réseau électrique, Europe, TIMES, Planification énergétique, Limites planétaires
Codes JEL
O13 N74 Q47
Version originale
Anglais
Accepté Mars 2023
Ce papier a été retenu suite à un processus de sélection compétitif et présenté à la conférence internationale de recherche de l'AFD sur la soutenabilité forte qui s'est tenue en décembre 2022.
The concept of planetary boundaries (PB) introduced by [1] provides a conceptual framework for assessing the environmental impacts of energy systems. Until recently, efforts on models have been concentrated on the design of transition trajectories that reach carbon neutrality. This approach has the disadvantage of neglecting other environmental impacts, some of which may be detrimental to the sustainability of the power system. Some recent studies have assessed the sustainability of economic sectors using the PB framework. For example, [2] looks at the dairy sector, [3] at a water utility company or [4] at a retailer. More specifically, on energy systems, [5] on hydrogen production, [6] on the European heating sector. On electricity production, [7] propose to evaluate the development of the US power system in 2030 using the concept of PB This study considers the different environmental impacts individually, without substitution between them and constraints are set specifically This approach is part of the strong sustainability framework and allows to go further than the respect of greenhouse gas (GHG) emission objectives linked to the Paris Agreement.
While this paper represents an advance in modeling the power system transition, the study is limited to optimizing a power system for one year and one country. This choice of modeling does not allow to consider trajectories over time and the sharing of constraints between countries with interconnections. Our study proposes to consider these two dimensions by focusing on the European power system between 2016 and 2050 within the framework of global limits. Research questions that structure this paper are:
• To what extent does taking into account PB in a strong sustainability approach for developing the European power system modify the current approach of reaching carbon neutrality?
• What are the ways to reduce the environmental impact of the power system and policies they imply ?
The evolution of the power system is assessed using the eTIMES-EU linear optimization model [8] It covers all EU countries, except Cyprus and Malta, plus Norway, Iceland, the United Kingdom and Switzerland. The period considered is from 2016 to 2050. The model minimizes the total discounted cost with respect of constraints related to electricity production. Cost assumptions are taken from the IEA and interconnection levels from the TYNDP2020 [9]
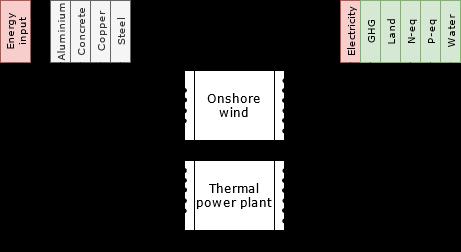
The structure of the model has been modified to consider environmental impacts. For each technology, material requirements per installed capacity and the environmental impacts per unit of electricity produced are considered. Materials covered are aluminum, concrete, copper and steel The data are taken from [10]. The environmental impacts are direct CO2 emissions and life cycle GHG emissions, land occupation, Nitrogen (N) flow, Phosphorus (P) flow and water consumption. Life cycle data are mainly taken from [11] The changes made on the model are illustrated by Figure 1. The original structure of the model contains basic inputs and outputs in red. Materials in grey and environmental impacts have been added for all technologies.
Emissions related to climate change are covered at two levels. The first is to consider direct CO2 emissions and apply a carbon neutrality constraint. This method is the most widespread in energy system models GHG emissions are life cycle. It is then possible to set constraints on the cumulative emissions over the entire time horizon. This method is less used in models but allows to treat more precisely the impact of the power system on climate.
Note: Green and grey boxes represent the addition to the original structure limited to red boxes.
In order to compare the performance of the different scenarios, we used PB values downscaled to the European power system. Global values for N and P flows and water are taken from [12]. The global value for land occupation comes from [13] and the global GHG emissions correspond to the CO2 emission quota to guarantee a 50% chance of reaching a 1.5°C trajectory[14]. These global values are then downscaled to Europe. The share allocated to Europe is calculated according to the principle of equality by considering the European population in 2016 compared to the world population of the same year. This share is fixed for all scenarios. Finally, the share allocated to the power system is calculated differently. The first one, the most ambitious, is based on the utilitarian principle. The allowed emissions for the power system are calculated according to the share of the value added of the sector in the GDP. This share for the power system in 2016 corresponds to about 2% of the European quota. The other method is based on the grandfathering principle. The share of the European quota allocated to the power system is equal to the share of GHG emissions of the power system in relation to total European emissions. It was around 24% in 2016.
Values are set for the entire zone, countries do not have individual constraint on PB.
Our reference scenario is the NEUTRALITY case. It is built to reach carbon neutrality in 2050, other environmental impacts are not constrained. Electricity exchanges are allowed. The carbon neutrality is set for the entire zone.
A set of additional scenarios is considered to explore environmental impact reductions. REDUCTION_20%, 30%, 40% and 50% scenarios are variants of the NEUTRALITY scenario where constraints are added on environmental impacts in addition to carbon neutrality in 2050. Percentages refer to levels of environmental impact reduction. For example, the 20% reduction refers to constraint values corresponding to the environmental impacts of the NEUTRALITY case multiplied by 0.8. For the GHG, the constraint applies to cumulative emissions between 2020 and 2050. For the other impacts, the constraints are set by a linear interpolation between level in 2020 in the NEUTRALITY case and the value fixed in 2050 after the reduction is applied.
All scenarios have the same level of electricity demand corresponding to a moderate level of electrification in Europe in 2050[12].
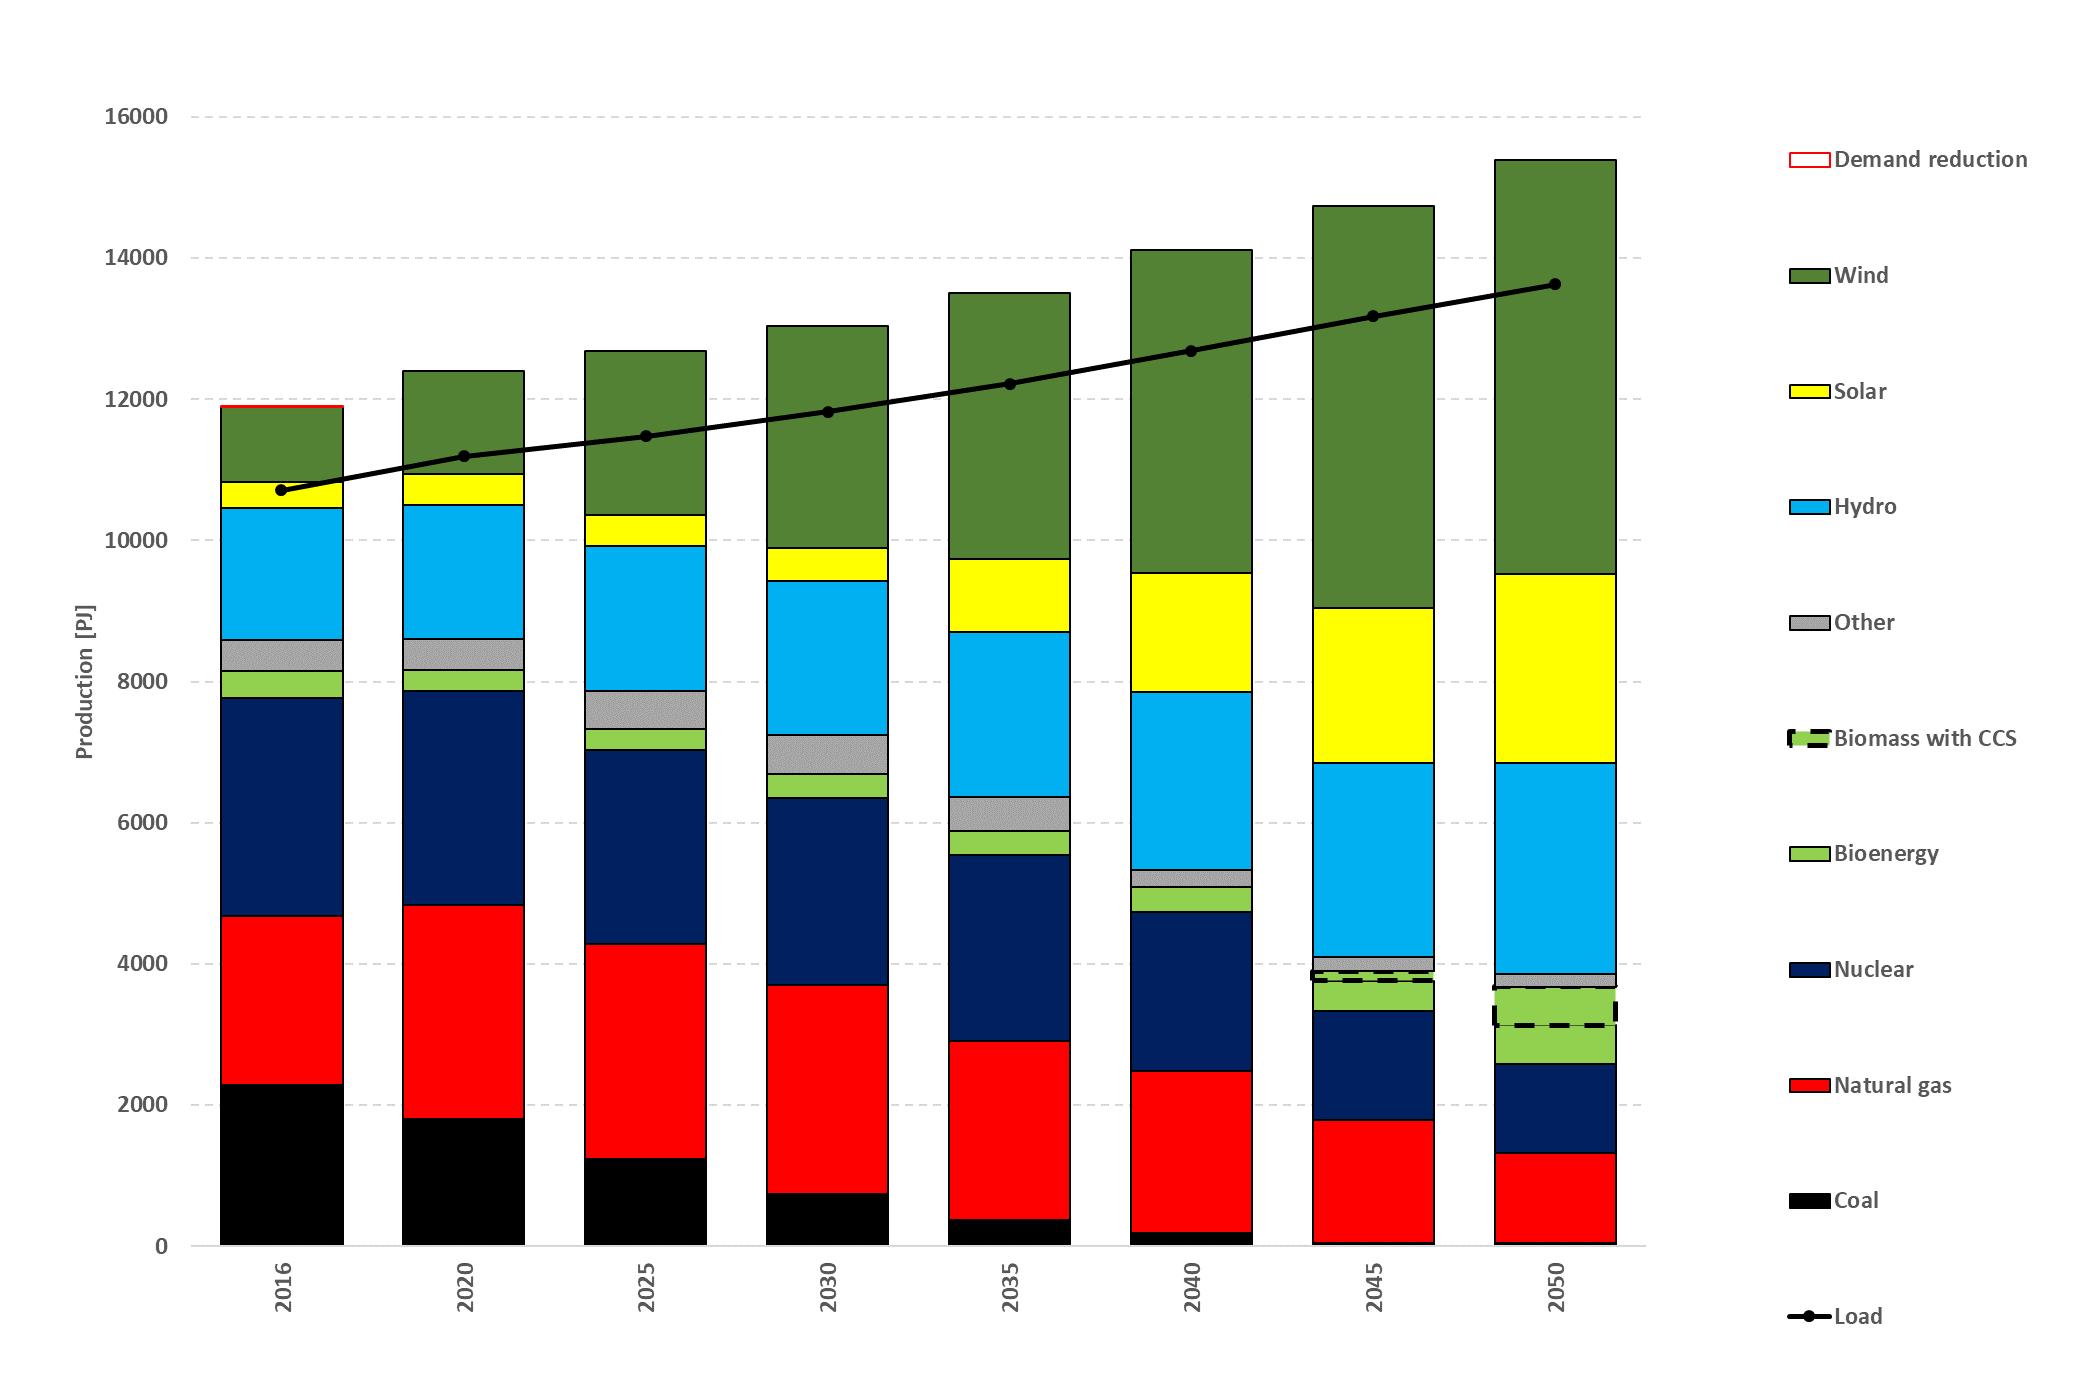
Figure 2 shows that achieving carbon neutrality in 2050 in the NEUTRALITY scenario requires a gradual phase-out of fossil fuels, replaced in majority by wind, PV and hydro. The system also uses a small amount of bioenergy in 2050 to offset the remaining direct CO2 emissions.
Figure 3 displays the environmental impacts of the NEUTRALITY scenario. It shows that the fossil fuel phaseout is globally beneficial for non-GHG environmental externalities. We observe approximately a division by 2 for N and P flows and water. This decrease related to the fact that fossil fuels are the most polluting technologies per kWh for most categories
Note: Values are normalized with respect to each time series maximum.
While the fossil fuel phase-out tends to reduce other pollutions, gains are smaller and smaller when the total share of fossil fuels in the overall mix decreases. In other words, environmental pollution linked to nonfossil technologies is secondary at the beginning of the horizon, but remains non-negligible and accounts for the majority in 2050. For example, N and P flows slightly increase between 2045 and 2050 due to the greater use of bioenergy. There is an exception for the land system change category that has a constant impact between 2016 and 2050.
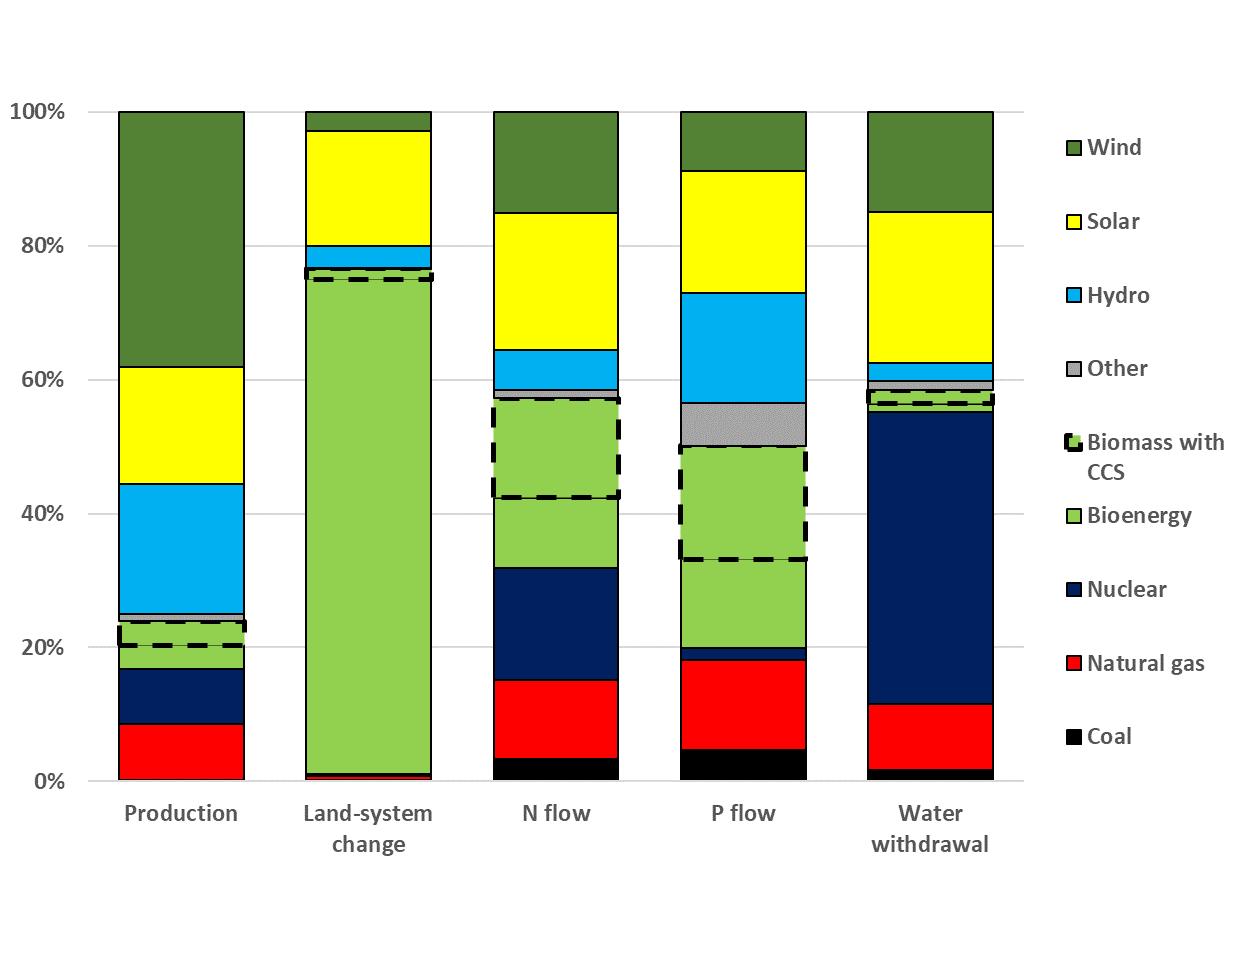
Figure 4 details each technology's contribution to the generation mix and four environmental impacts. The graph shows a disparity according to the category considered. For example, nuclear power contributes little to P flow but almost half the water needs. It is interesting to note the disproportion between some technologies' environmental impacts and their production share. Wind power contributes to more than one-third of the production, while its contribution to each externality is around 10%. Similarly, bioenergy is responsible for most land occupation, even though it represents only about 5% of production.
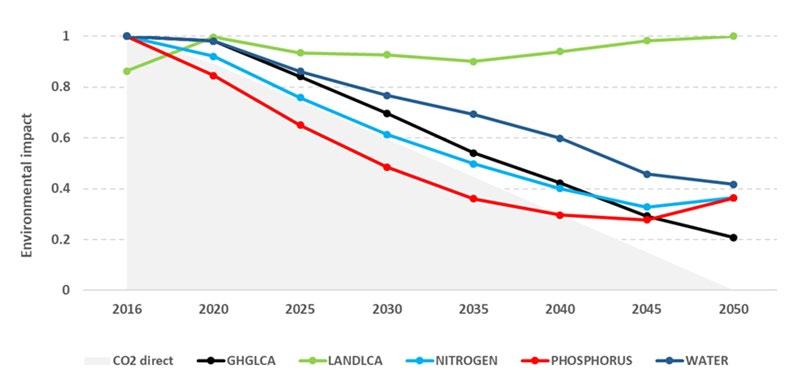
Figure 5 displays material consumption in the NEUTRALITY scenario. An increase in resource consumption accompanies the substitution of fossil fuels by renewables. In the NEUTRALITY case, the demand for concrete and copper is multiplied by 1.5 and 2 approximately between 2016 and 2050. It is multiplied by 2.5 and 5 for steel and aluminum respectively.


Note: Values are normalized with respect to 2016 values.
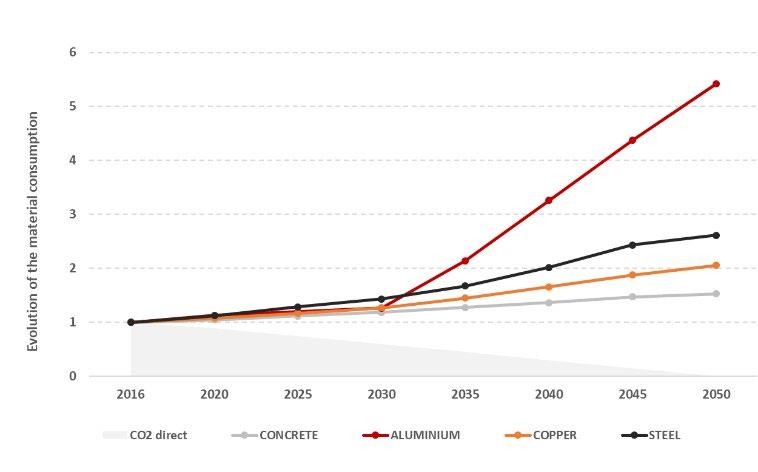
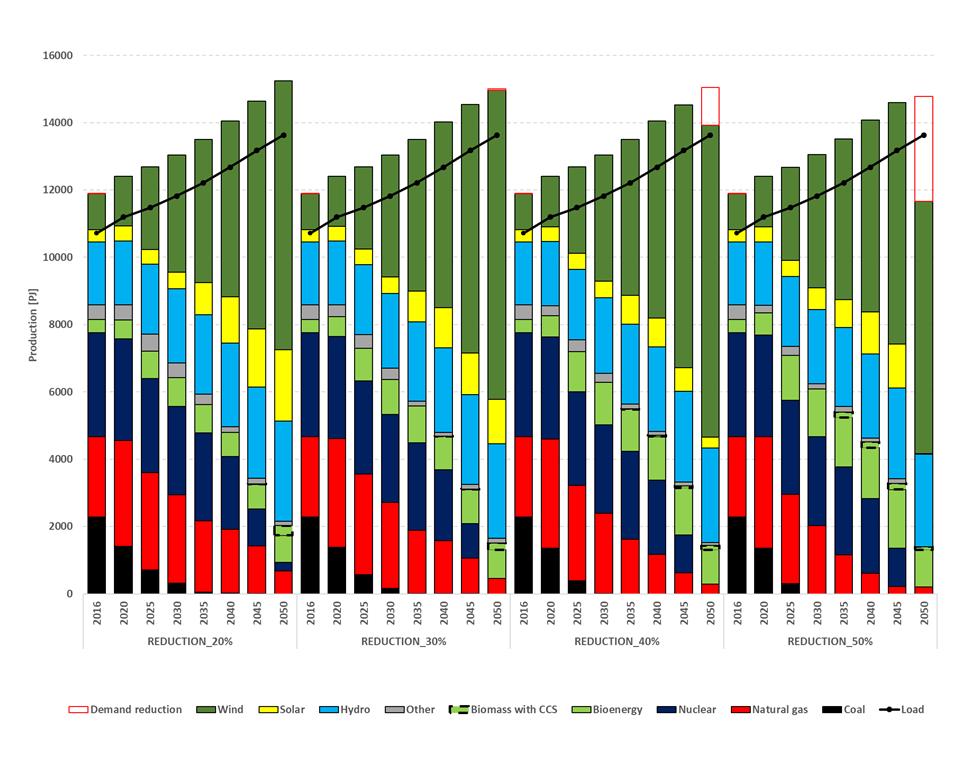
Figure 6 gives the generation mix for the four alternative scenarios. It shows that the more the constraints increase, the more the nature of the mix changes compared to the NEUTRALITY scenario. The GHG budget constraint applied from 2020 to 2050 changes the generation mix over all periods. Constraints on other dimensions become more restrictive at the end of the horizon. The most important impact of the GHG constraint is the speed of exit from coal and natural gas. In the REDUCTION_40% & 50% scenarios, the constraint is so strong that coal plants are shut down as early as 2025 In the NEUTRALITY scenario, coal and natural gas shares in the production are respectively 10 and 24% The fact coal has a high GHG emission rate and that almost all technologies have residual emissions force the model to limit the most polluting technologies in order to keep some flexibility close to 2050. In the REDUCTION_20%, 30% and 50%, the constraints in 2050 become to stringent and the model has no other other possibility than forced demand reduction
In a less pronounced way, solar is disadvantaged for all periods with a share in the production, which decreases with the constraint. It accounts for roughly 17% of the production in 2050 in NEUTRALITY, 14% in REDUCTION_20%, 9% in REDUCTION_30%, 2% in REDUCTION_40% and zero in REDUCTION_50%.
In 2050 the environmental constraints, especially N and P flows, become restrictive. The limited presence of fossils, important sources of pollution, in 2050 in the NEUTRALITY scenario limits the possibilities to reduce pollution more significantly. When the constraint increases, land occupation can be reduced by limiting biogas production, which consumes agricultural land N flow is lowered by gradually reducing nuclear, PV, remaining oil turbines and gas cogeneration. Phosphorus flows are reduced by limiting bioenergy, PV, oil turbines, and cogeneration. Virtual imports in 2050 show the strong impact of the constraints on the system. The optimal solution provides only about 80% of the demand in the REDUCTION_50% case.
Note: The y-axis gives the number of times the 2% PB is transgressed.
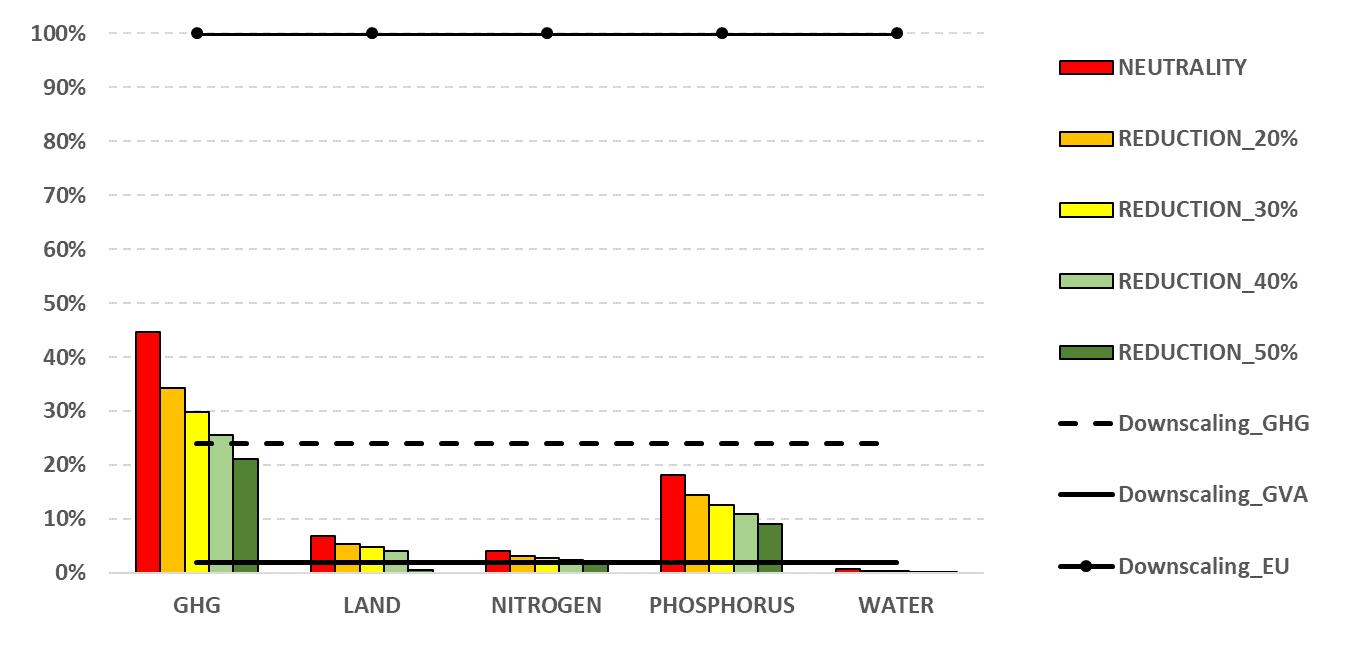
Figure 7 compares the environmental impacts to the downscaled PB with the two allocations principle. It shows that the NEUTRALITY scenario is often above the limits assigned to the European power system, especially for GHG emissions, with the allocation rule based on added value. The GHG emissions of the REDUCTION_50% scenario are still ten times above the downscaled GHG quota. These large differences highlight the shortcomings of the carbon neutrality objectives compared to a quota-based approach.
For non-GHG emissions, all scenarios are below the limits set by the allocation rule based on the grandfathering of the GHG emission in 2016. This observation invites to consider each environmental impact in a specific way. The cost of the efforts must be compared to the expected gains and to the values of other economic sectors.
Similarly, to the cost comparison, it is difficult to compare the scenarios with each other because the service provided is not the same. Virtual imports allow the models to install less capacity than in the NEUTRALITY case. However, the consumption of materials is linked to the infrastructure and the values may be underestimated in the case of virtual imports.
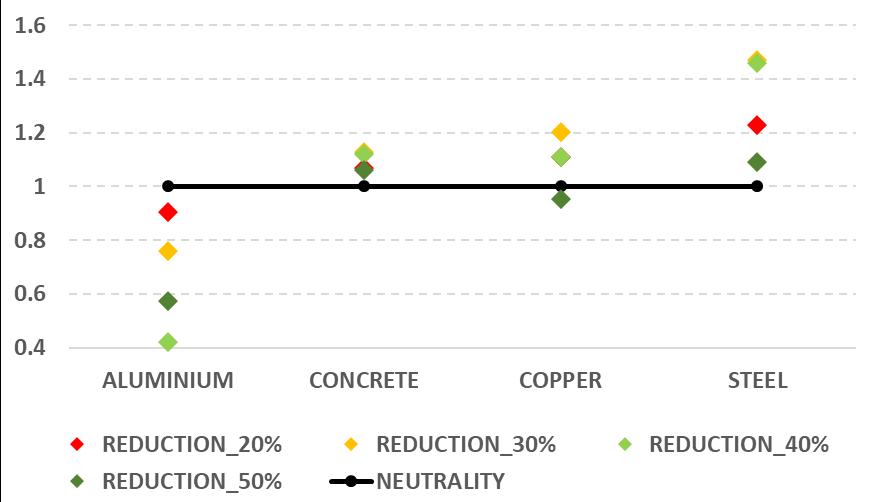
Figure 8 shows the material consumption in variant scenarios compared to the NEUTRALITY scenario. We observe that the consumption of concrete and steel in 2050 is slightly higher in all variants than in the NEUTRALITY case. The consumption of aluminum is lower in variants than in the NEUTRALITY case. This decrease is related to the lower share of PV in variants.
Note: The consumption of materials in the NEUTRALITY scenario is set to one
This study makes it possible to rethink the development of the interconnected EU power system by going beyond the objective of carbon neutrality. Environmental impacts are endogenously considered in a long term optimization model to study trade-offs between environmental impact categories
Results can have several policy implications:
• Levels of environmental impacts in the reference case significantly exceed the thresholds allowed in most cases, especially for GHG We showed that reducing these impacts by 20% to 50% is possible. However, this will imply a rapid phase-out of fossil fuels. It should be immediate for coal and the share of natural gas has to be reduced to 9% of the production after 2035 Such decommissioning rates are much more ambitious in comparison to a neutrality case. Finding a consensus between all European countries might be difficult.
• The results show that a 50% reduction of all impact categories would not be sufficient to respect a PB limitation defined as a 2% share of the European quota with known technologies. The policy implication is that it is important to anticipate the environmental impacts of future technologies by adapting industrial processes to limit environmental pollution. Doing so will lower the impact of the manufacturing and construction phases.
• Our results also call for a broader discussion on the distribution of efforts for the various sectors is needed. A value-added-based allocation only gives a 2% share of the European quota, which is difficult to achieve. However, a higher share would imply that other sectors with potentially higher contribution to GDP will be allocated a lower share of the European quota.
• Finally, as an extension of this analysis, the anticipated massive electrification of uses seems difficult at this stage in view of the associated impacts, which brings the question of electricity demand reduction
[1] J. Rockström et al., “A safe operating space for humanity,” Nature, vol. 461, no. 7263, pp. 472–475, Sep. 2009, doi: 10.1038/461472a.
[2] A. W. Hjalsted, A. Laurent, M. M. Andersen, K. H. Olsen, M. Ryberg, and M. Hauschild, “Sharing the safe operating space: Exploring ethical allocation principles to operationalize the planetary boundaries and assess absolute sustainability at individual and industrial sector levels,” Journal of Industrial Ecology, vol. 25, no. 1, pp. 6–19, 2021, doi: 10.1111/jiec.13050.
[3] M. W. Ryberg, T. K. Bjerre, P. H. Nielsen, and M. Hauschild, “Absolute environmental sustainability assessment of a Danish utility company relative to the Planetary Boundaries,” Journal of Industrial Ecology, vol. 25, no. 3, pp. 765–777, 2021, doi: 10.1111/jiec.13075.
[4] A. Wolff, N. Gondran, and C. Brodhag, “Detecting unsustainable pressures exerted on biodiversity by a company. Application to the food portfolio of a retailer,” Journal of Cleaner Production, vol. 166, pp. 784–797, Nov. 2017, doi: 10.1016/j.jclepro.2017.08.057.
[5] T. Weidner, V. Tulus, and G. Guillén-Gosálbez, “Environmental sustainability assessment of large-scale hydrogen production using prospective life cycle analysis,” International Journal of Hydrogen Energy, Dec. 2022, doi: 10.1016/j.ijhydene.2022.11.044.
[6] T. Weidner and G. Guillén-Gosálbez, “Planetary boundaries assessment of deep decarbonisation options for building heating in the European Union,” Energy Conversion and Management, vol. 278, p. 116602, Feb. 2023, doi: 10.1016/j.enconman.2022.116602.
[7] I. M. Algunaibet, C. Pozo, Á. Galán-Martín, M. A. J. Huijbregts, N. Mac Dowell, and G. Guillén-Gosálbez, “Powering sustainable development within planetary boundaries,” Energy Environ. Sci., vol. 12, no. 6, pp. 1890–1900, 2019, doi: 10.1039/C8EE03423K.
[8] G. Siggini, “Approche intégrée pour l’analyse prospective de la décarbonisation profonde du système électrique européen à l’horizon 2050 face à la variabilité climatique,” http://www.theses.fr, Mar. 15, 2021. http://www.theses.fr/s207283 (accessed May 28, 2021).
[9] ENTSO-E, “TYNDP2020 Completing the map – Power system needs in 2030 and 2040,” p. 70, Aug. 2021.
[10] G. Kalt, P. Thunshirn, D. Wiedenhofer, F. Krausmann, W. Haas, and H. Haberl, “Material stocks in global electricity infrastructures – An empirical analysis of the power sector’s stock-flow-service nexus,” Resources, Conservation and Recycling, vol. 173, p. 105723, Oct. 2021, doi: 10.1016/j.resconrec.2021.105723.
[11] UNECE, “Life Cycle Assessment of Electricity Generation Options,” 2022. https://unece.org/sed/documents/2021/10/reports/life-cycle-assessment-electricity-generationoptions (accessed Apr. 04, 2022).
[12] W. Steffen et al., “Planetary boundaries: Guiding human development on a changing planet,” Science, vol. 347, no. 6223, p. 1259855, Feb. 2015, doi: 10.1126/science.1259855.
[13] EEA and FOEN, Is Europe living within the limits of our planet?: an assessment of Europe’s environmental footprints in relation to planetary boundaries. LU: Publications Office, 2020. Accessed: Mar. 22, 2022. [Online]. Available: https://data.europa.eu/doi/10.2800/890673
[14] J. Rogelj et al., “Mitigation Pathways Compatible with 1.5°C in the Context of Sustainable Development,” p. 82, 2018.
What is AFD?
Éditions Agence française de développement publishes analysis and research on sustainable development issues. Conducted with numerous partners in the Global North and South, these publications contribute to a better understanding of the challenges faced by our planet and to the implementation of concerted actions within the framework of the Sustainable Development Goals.
With a catalogue of more than 1,000 titles and an average of 80 new publications published every year, Éditions Agence française de développement promotes the dissemination of knowledge and expertise, both in AFD’s own publications and through key partnerships. Discover all our publications in open access at editions. afd.fr.
Towards a world in common.
Publication Director Rémy Rioux
Editor-in-Chief Thomas Melonio
Legal deposit 1st quarter 2023
ISSN 2492 - 2846
Rights and permissions
Creative Commons license

Attribution - No commercialization - No modification https://creativecommons.org/licenses/by-nc-nd/4.0/
Graphic design MeMo, Juliegilles, D. Cazeils
Layout Denise Perrin, AFD
Printed by the AFD reprography service
To browse our publications: https://www.afd.fr/en/ressources-accueil