6 minute read
Using the recovery to accelerate the decarbonisation of surface transport


COM/ENV/EPOC/IEA/SLT(2020)4/REV2 27
3Overview of recovery measures in surface transport according to the three pathways
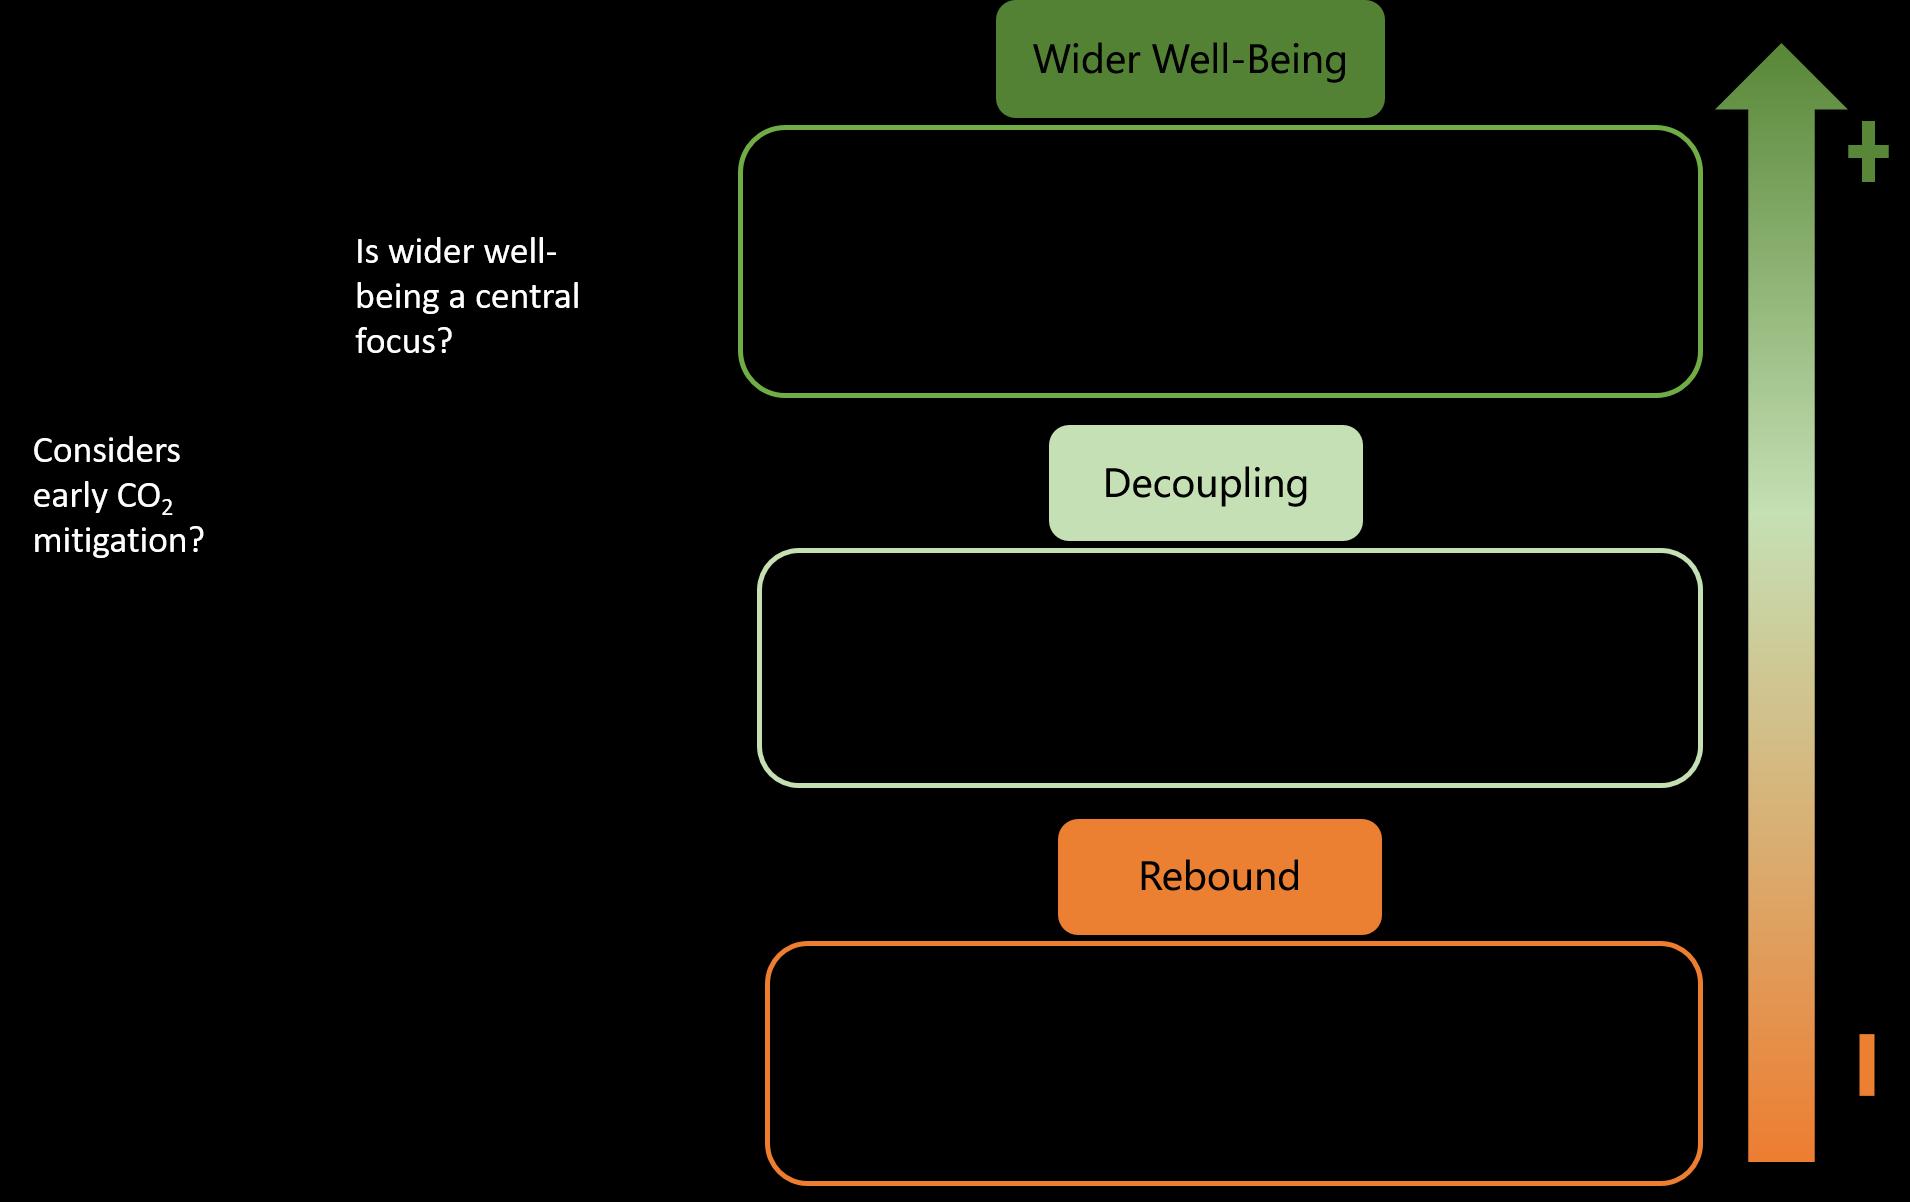
The three stylised recovery pathways introduced in section 2, namely Rebound, Decoupling and Wider well-being, can inform analysis and assessment of specific sectoral recovery measures. This section maps recovery measures for the surface transport sector into the three stylised recovery pathways. This sector was selected as it is a major source of direct and indirect GHG emissions and relates intimately to a range of well-being outcomes, as highlighted below. Transport is essential to connect people and places and to move goods. It therefore adds huge social and economic value to societies. Surface transport is important to job creation. For example, car manufacturing accounts for around 14 million jobs globally (ILO, 2020[40]) and already in 2013 public transport accounted for 13 million (UITP, 2013[41]). However, energy related CO2 emissions from the transport sector have grown faster than those from any other sector in the last 50 years (OECD, 2019[8]). Indeed, direct CO2 emissions from the transport sector increased by 75% between 1990 and 2017 to an estimated 8 gigatonnes (Gt CO2), and represent 24% of global energy-related CO2 emissions (emissions (IEA, 2020[42])). In 2015, around half of transport emissions came from surface passenger transport, with urbanpassenger transport making up 32% of total sectoral emissions. Surface (road and rail) freight made 28% of sectoral emissions in the same year (ITF, 2019[43]). The transport sector has historically been considered a difficult sector to decarbonise (IPCC, 2014[44]) (Gota et al., 2019[45]). The International Transport Forum (ITF) has estimated that in a scenario where the negative economic impact from the COVID-19 crisis is long-lasting, 14 even if countries maintain in place policies implemented and announced before the crisis, global emissions from the transport sector would only be 2% lower than those in 2015 by 2030, and would increase by 8% by 2050 (ITF, 2021[46]). A similar scenario modelled by the IEA, which includes existing policy frameworks and announced policy intentions (STEPS), estimates that emissions could be 5% higher by 2030 than those in 2019 (IEA, 2020). Beyond CO2 emissions, mobility systems have large impacts on well-being through air pollution, road crashes and noise, and may entrench social inequalities where segments of the population have limited or no access to economic (e.g. jobs), social (e.g., health, education) and environmental (e.g., green space areas) opportunities (OECD, 2019[8]).
Using the recovery to accelerate the decarbonisation of surface transport
The policy landscape in the transport sector has changed significantly following the COVID-19 crisis, because of the social distancing measures put in place by governments to stem the pandemic and the economic fall-out caused by lock-down measures. In April 2020, daily global activity in passenger surface-
14 Assuming economic impacts linger in the form of a five-year GDP and trade projection “step back” (ITF, 2021[46])
28 COM/ENV/EPOC/IEA/SLT(2020)4/REV2
transport was reduced by 50% on average in comparison to average activity in 2019 (Le Quéré et al., 2020[47]). The extent and rate of recovery of transport activity levels after confinement is uncertain. It will depend on local circumstances and behaviours, as well as policies and actions implemented and the transport mode in question. Nonetheless, some general factors of relevance for the sector can be identified. Confinement resulted in oil-price volatility and to some extent these were reflected in lower fuel prices, which could tend to boost demand for travel and transport fuels as countries lift confinement measures. In addition, the use and provision of public transport has fallen and may not quickly return because of perceived risks of contagion. Increased demand for transport as economies begin to return to normal may therefore lead to higher levels of car use than pre-COVID (ITF-OECD, 2020[48]). Any drop in public transport use also puts further pressure on already-constrained public transport budgets through the loss of fare box revenues, jeopardising the long-term financial health of many public transport systems and the jobs that depend on them. For instance, the expected loss of revenue from fares by the end of 2020 in European public transport systems is EUR 40 billion (UITP, 2020[49])]. At the same time, the COVID-19 situation has interesting lessons and opens new possibilities for the transport sector. For instance, many cities have rapidly re-allocated road space to active transport modes (walking and cycling) and powered micro-mobility, such as e-scooters and e-bikes. Temporary protected lanes provide a safe environment for such alternatives to public transport alongside car use, helping manage capacity and providing conditions for social distancing. 15 The result has been a large increase in the volume of cycling (BBC, 2020[50]). This demonstrates that these “sustainable” modes can effectively contribute to increasing the resilience of transport systems (Schwedhelm, 2020[51]) (Julien Bert, 2020[52]). Several cities have decided to make many of these temporary facilities permanent. More generally, the reductions in car traffic and the need for social distancing have prompted governments to reassess the current allocation of road space between different modes of transport (e.g. space for car travel and parking versus space for walking and cycling), as well as between transport and alternative uses (e.g. space for car parking vs. space for commercial activity). Travel by active and micro-mobility modes has continued to be crucial for some cities as they prepare plans for adapting public transport services for social distancing (Bloomberg City Lab, 2020[53]). The continued and increased role of public transport will be crucial in many cities to avoid exacerbated private car use, but increasing the role of active and micro-mobility is key to ease crowding and address safety (see case studies in Box 3). Nonetheless, while individual bicycle and micro-mobility use have increased, shared services using these modes have in many cities been temporarily closed down or demand for these services has also been reduced (Julien Bert, 2020[52]). Shared e-scooter services, which in contrast to many bike and e-bikes shared schemes in different cities are not supported by public funds, have been hit the hardest (Hawkins, 2020[54]). Reduction in traffic (and in other polluting activities such as industry) due to the COVID-19 crisis led to a sharp drop in pollutants including and particulates such as NOx, NO2 and PM2.5 and PM10 during lockdown (Vincendon, 2020[55]) (University of Melbourne, 2020[56]) (Mahato, Pal and Ghosh, 2020[57]). For instance, NO2 levels in China during January and February 2020 were between 10-30% lower than those experienced over the same period in 2019 (Earth Observatory, 2020[58]). In Paris NOx concentration were as low as 25% of pre-confinement levels for central Paris and 30% down in peripheral areas (Vincendon, 2020[55]), while in Delhi PM2.5 and PM10 concentrations fell up to 50% reduction (Mahato, Pal and Ghosh,
15 Micro-mobility is a term used for light-weight modes of transport. According to the Society of Automotive Engineers, micro-mobility has to be low speed. Most are 20 miles (32 km) per hour but could reach a maximum of 30 miles -48 km- per hour). They also need to be of small size (maximum of 500 pounds- 226 kg, but most are less than 100 pounds -45 kg). Thus in principle, the term includes regular bicycles. Among micro mobility vehicles, powered ones, such as e-scooters or e-bikes are in general associated with the term. These be fully motorised or use some human power as source of energy.