30 minute read
4. Challenges to and rationale for carbon pricing due to COVID-19

from Carbon pricing and COVID-19: Policy changes, challenges and design options in OECD and G20 countries
by OECD

ENV/WKP(2022)3 47
4.1. Additional challenges to carbon pricing related to COVID-19
COVID-19 has brought new challenges for countries to implement new or strengthen existing carbon prices. The pandemic added to already existing challenges as it led i.a. to a global recession, increased inequality and it increased the number of vulnerable households and businesses. However, the benefits of carbon pricing mean that it can still play a significant role in countries’ economic recovery by generating revenue for national deficits as seen during the Global Financial Crisis (GFC), it can shape investment decisions in the short and medium-term which can impact GHG emissions prospectively, and it can contribute to addressing increasing inequalities. This section displays the potential economic effects of carbon pricing, outline its challenges but also the potential solutions and the increased impetus for carbon pricing.
COVID-19 lockdown measures restricted the movement of people as well as goods and services across the globe. These restrictions – whose duration varied by country - have led to decreased income for many businesses resulting in a spike in unemployment rates and reduced global economic activity. GDP contracted by 3.1% in G20 economies, 4.8% in OECD economies, while world GDP shrank by 3.5% in 2020 as compared to 2019 (OECD, 2021[143]). The contraction of global GDP after the GFC in 2007-09 was approximately just below 0.1% for 2009, yet no negative GDP on a global level was observed for 2007 or 2008 (IMF, 2020[144]). The pandemic also impacted unemployment levels which for OECD countries increased 2.7 pp in 2020, compared to 2019 levels (5.4%) (OECD, 2021[143]) and increased 2.6 pp in 2009 during the GFC compared to 2007 levels (5.6%) (OECD, 2010[145]) (OECD, 2011[146]). The pandemic, furthermore, had differentiated impacts on different countries, sectors, and income groups (see Exacerbated inequality, increased vulnerability, and energy poverty). The economic impact of the pandemic in 2020 on countries have been shaped by the number of COVID19 outbreaks, the composition of country sectors, and the COVID-19 policy response measures. Countries who had more extensive COVID-19 impacts, have mostly seen more frequent and longer lockdowns leading to extended periods of decreased economic activity (IMF, 2021[147]). This has for instance been seen in the UK which experienced three extensive lockdown periods (Brown and Kirk-Wade, 2021[148]), that impacted supply and demand contributing to a 9.8% GDP contraction in 2020 compared to 2019 (OECD, 2021[149]) (Stephens, Wright and Luckwell, 2021[150]). Italy also experienced extensive COVID-19 lockdowns in 2020, impacting the Italian GDP which fell by 8.9% in 2020 compared to 2019 (OECD, 2021[149]). In countries heavily reliant on tourism and the service sector, economic impacts have also been severe. Spain, for instance, received 72.4% fewer tourists from January to July 2020 as compared to 2019 (Moreno-Luna et al., 2021[151]), and the economy, therefore, contracted by 10.8% (OECD, 2021[152]). Lastly, countries’ COVID-19 policy response measures, being their ability to implement
48 ENV/WKP(2022)3
economic support measures have also impacted national economies (UN, 2020[153]). In many European countries, income support for more than 50% of lost salaries have been provided, whereas other countries e.g. most African countries, and Mexico had no income support (Our World in Data, 2021[154]). The impacts induced by the COVID-19 recession have been deep and extensive, and COVID-19 is considered the worst economic crisis experienced since the 1930s’ Great Depression (OECD, 2020[155]). Carbon pricing is perceived to further aggravate the negative short-term economic impacts and/or to slow down the economic recovery from crises (Driscoll, 2020[156]) (House of Representatives, 2011[157]) (Murphy, Michaels and Knappenberger, 2016[158]). However, implementing carbon pricing does not need to come at the expense of economic performance. Indeed, carbon pricing has previously played a role in countries’ recovery from economic recessions, such as seen in Iceland and Ireland in the aftermath of the GFC. Both countries had accumulated large national debts after the crisis and decided to introduce carbon pricing in 2010 to reduce national deficits. The Icelandic government introduced a temporary carbon tax on liquid fossil fuels, yet exempting international aviation, shipping, and certain industries27 at the time of introduction, equivalent to approximately 50% of total domestic GHG emissions (World Bank, 2014[159]). To ensure a smooth implementation, the tax rate was initially set low: at 50% of the EU ETS price in 2010 (around EUR 7/tCO2), 75% in 2011 (around EUR 13/tCO2) and reached 100% in 2014 (around EUR 15/tCO2) (OECD, 2021[160]). Iceland initially established the tax as a temporary measure, set to expire at the end of 2012. However, on advice from the IMF, the tax became permanent (Partnership for Market Readiness, 2017[161]). Ireland implemented a permanent carbon tax in 2010 of EUR 15/tCO2. The tax covered mainly combustion from residential and commercial heating, as well as industry and transport emissions not covered by the EU ETS, equivalent to 38.5% Ireland’s total emissions in 2011 (Convery, Dunne and Joyce, 2013[162]). In the year of its introduction, it raised EUR 246 million, equivalent to less than 1% of Ireland’s total tax revenue from that year, yet during 2011 the revenue grew to EUR 329 million and EUR 344 million in 2012, but it still remained less than 1% of tax revenue for the specific years28 (Convery, Dunne and Joyce, 2013[162]) (OECD Stat, 2021[163]). After the GFC, Ireland, and Iceland both performed better in several indicators compared to other European countries, which were also heavily impacted by the GFC (e.g. Portugal, Spain, and Greece). In contrast to Ireland and Iceland, these countries did not implement a national carbon tax shortly after the GFC, although they were covered by the EU ETS. In fact, Ireland and Iceland both seemed to have performed better in economic (GDP per capita and Government Debt-to-GDP ratio), social (unemployment rate and income inequality), and environmental (air pollution mortality and carbon emissions per USD) indicators after the GFC (Figure 4.1). Yet, this analysis does not establish a causal relationship. Carbon pricing is often perceived to negatively impact economic growth or other economic dimensions (e.g. competitiveness) compared to a business-as-usual scenario (Driscoll, 2020[156]) (House of Representatives, 2011[157]) (Murphy, Michaels and Knappenberger, 2016[158]) However, evidence on this is not supported by the literature, although the evidence found is for historical price levels which have been low and where free allocation have been used extensively (Ellis, Nachtigall and Venmans, 2019[164]) (OECD, 2021[165]). In fact, scientific studies find little to no statistically significant evidence of a negative GDP impact of a carbon price compared to a counterfactual without carbon pricing (Metcalf and Stock, 2020[166]) (Elgie and McClay, 2013[167]).
27 E.g. cement and aluminium 28 Calculated on 24th November 2021 using number from OECD on Ireland’s tax revenue (OECD Stat, 2021[163]).
ENV/WKP(2022)3 49
Figure 4.1. Economic, social and environmental performance for countries with and without national carbon taxes in the recovery from the Global Financial Crisis
Note: The y-axis uses the year 2009 as the Index year (equal 100) for each data indicator. The x-axis presents the time range from 2009 to 2019 (2017 for income inequality due to data availability). For Government Debt-to-GDP ratio, data is only available for Iceland until 2013. On the Income inequality figure a higher number (y-axis) equals more inequality. For the air pollution mortality graph, the link to CO2 is connected to fossil fuel-based transport usage. This type of transport emits CO2, particulate matter and NOx, of which the latter two increases the risk of air pollution morbidity and mortality (OECD, 2014[168]). A carbon tax can help decrease fossil fuel-based transportation, lowering air pollutants and, thereby, mortality rates. Source: Authors based on (OECD Stat, 2021[169]), (OECD, 2021[170]), (OECD Stat, 2021[171]), (OECD Stat, 2021[172]), (OECD Stat, 2020[173]) and (OECD, 2021[174]).
The evidence on the short-term impact of carbon pricing on GDP is limited to ex-ante studies, varies with policy design, and is overall inconclusive. For short-term impacts, a study in France with a simulated carbon tax found that it could speed up the economic recovery from COVID-19 while it could reduce CO2 emissions (Malliet et al., 2020[175]). Another ex-ante study found that a projected carbon price increase in the EU ETS of USD 40/tCO2 (EUR 34.3/tCO2), covering 30% of domestic emissions, in 31 European countries could lead to a relative increase in the GDP growth rate of 0.48 to 0.53% for the first and second year, and a
50 ENV/WKP(2022)3
0.38% relative increase for year three to five, though none of these were statistically significant (Metcalf and Stock (2020[166]). Despite the statistical insignificance, positive impacts could also be seen for employment for year one and two where a relative increase of 0.42 to 0.44% is estimated, while the estimated increase for year three to five is more mixed as it ranges from -0.08% to 0.10% (Metcalf and Stock (2020[166]). An ex-ante study by Diamond and Zodrow (2018[176]) investigated several carbon tax designs on a federal level in the US, and found that economic effects depend on the revenue recycling mechanism, yet all results were statistically insignificant. If revenues were used to reduce income (payroll) taxes, this would result in a relative negative GDP (-0.12%) impact, a relative positive employment (0.11%) and investment (0.36%) impact in the first year. If it was used for debt reduction, it resulted in a relative negative GDP (-0.43%) and employment (-0.30%) impact in the first year, but a relative positive investment impact (0.40%). Thus, the short-term impacts are inconclusive and all from ex-ante studies. Although the results are statistical insignificant, a slight majority point towards a positive impact of carbon pricing on GDP and employment. In the medium to long-term several ex-ante and ex-post studies found no statistically significant GDP impacts of carbon pricing. Yet, as above, the examined studies found positive impacts but these varied with policy design (see section 5. ). In the aforementioned ex-ante study by Diamond and Zodrow (2018[176]), a carbon tax which uses the revenue for income tax reductions continues to have a positive GDP (0.18%), employment (0.12%), and investment (1.03%) impact after nine years and remains positive hereafter. Whereas the relative GDP impact (0.07%) turns positive when using the revenue for debt reduction after 19 years and remains positive henceforth. Two ex-post studies in British Columbia, Canada, did not find statistically significant impacts of carbon pricing on GDP over a longer period. However, some of the effect which was found, was attributed to the revenue-neutral policy design of the carbon tax (Metcalf, 2019[177]) (Bernard, Kichian and Islam, 2018[178]). Metcalf (2019[177]) also investigated the ex-post EU ETS impact on the 31 participating countries, by analyzing their GDP before and after the ETS implementation in the time period of 1985-2017 and found a statistical insignificant GDP increase of 3.89% in European countries. Overall, the medium to long-term economic impact of carbon pricing displays no statically significant results. Despite this, the generated results displays mainly positive impacts, yet the extent of this is related to policy design. Carbon pricing is also perceived to be detrimental to firms’ competitiveness (EC, 2021[179]) (CPLC, 2016[180]) (Chatham House, 2009[181]). As COVID-19 impacted different countries to different degrees (see above), leading to reduced competitiveness of some firms, and carbon pricing could exacerbate competitiveness concerns. However, the anticipated negative effects of carbon pricing have not materialised as feared so far, as shown in earlier analysis for the Carbon Market Platform (Ellis, Nachtigall and Venmans, 2019[164]). In fact, in most studies carbon pricing was even found to improve some dimensions of competitiveness, including increased labour productivity and innovation. However, the absence of negative short-term effects are to be interpreted with caution as carbon prices have been low in general and even more so for industries that benefited from tax breaks or free allowances. There is to date no studies on how the competitiveness of EITE industries could be impacted if free allowance allocation is removed or a higher carbon price is applied, although ex-ante studies indicate a significant negative competitiveness effect in the form of carbon leakage (Ellis, Nachtigall and Venmans, 2019[164]). Importantly, market-based policies, including carbon pricing, are more effective in terms of mitigating negative effects and enhancing positive ones compared to non-pricing policies (OECD, 2021[165]). For example, using market-based policies instead of command-and-control policies would help offset potentially negative productivity effects associated with environmental policy (Albrizio, Kozluk and Zipperer, 2017[182]). However, for countries whose energy costs are relatively higher than in other countries, carbon pricing can still pose negative competitiveness impacts on an international level, despite the potential return of carbon pricing revenue (see section 5.1) or a prospective carbon price reduction. Due to these differences and in the absence of a global carbon price, it is equally important to avoid the double pricing of CO2 emissions (ICC, 2021[183]).
ENV/WKP(2022)3 51
Exacerbated inequality, increased vulnerability, and energy poverty
The economic and health effects of COVID-19 have exacerbated pre-existing inequalities both across and within countries (OECD, 2020[11]). Vulnerable groups such as the poor within countries have been disproportionately affected by COVID-19, unemployment rates have sharply increased across the world, and 119-124 million people have fallen back to extreme poverty in 2020, undoing several years of progress on this front (UN, 2021[184]). COVID-19 mainly affected the already disadvantaged societal groups, worsening the pre-existing inequality gaps. Unemployment, inactivity, and reduced working hours increased globally in 2020 compared to the fourth quarter of 2019. Collectively, this loss amounts to 255 million full-time jobs equivalent to an 8.8 % reduction of global working hours and a 2.2 % reduction of global labour force participation, which mostly occurred in lower-middle-income countries in Latin America, the Caribbean, Southern Europe, and Southern Asia (ILO, 2021[185]). For OECD countries, unemployment rates peaked at almost 9% in April 2020, while it fell to almost 6% after one year (April 2021), still higher than prepandemic levels at around 5% (OECD, 2021[186]). The industries most affected were the service sectors such as leisure, transport, and retail, while the most affected employment types have been the informal and self-employed, who often do not have social protection measures, increasing their vulnerabilities (OECD, 2021[187]) (The World Bank, 2020[188]). In addition to this, women, youth and low-educated people have been mostly affected on the global job market. Women experienced a 5% job loss in 2020 compared to a 3.9% job loss for men, while the 2020 unemployment rate for youth were 8.7% versus 3.7% for adults (ILO, 2021[185]). Lower-educated people, who often have low-skilled jobs, also faced a greater risk of unemployment as compared to higher-educated people, with high-skilled jobs (OECD, 2021[186]). Besides the temporary or permanent employment loss induced by COVID-19, the confinement measures also caused the energy needs of residential consumers to grow. This was both due to a rise in conventional demand (e.g. space heating, hot water, and cooking) and new energy demands (e.g. teleworking-related). This combination of factors aggravated energy poverty problems and increased the amount of people unable to pay their energy bills as seen in Spain and Italy, but also in Sub-Saharan Africa where 30 million people became energy poor in 2020 (Buckle et al., 2020[3]) (Mastropietro, Rodilla and Batlle, 2020[189]) (IEA, 2020[190]). The increased energy poverty rates and the increased unemployment rates have contributed to increasing the inequality gap globally. Carbon pricing can exacerbate pre-existing inequalities globally, but the distributional impacts of carbon pricing also differ between developed and developing countries. In addition, the distributional effects also differ within countries and depend on the carbon intensity of products consumed by various income groups and on the revenue recycle design (see section 5. ). In developing countries, carbon pricing mainly has proportional or progressive impacts, meaning that the tax affects people equally or affects high-income earners proportionately more (Wang et al., 2016[191]) (Dorband et al., 2019[192]). This is because low-income groups have, in general, a relatively smaller share of energy products on total household expenditure, whereas high-income groups spend a higher share of their income on energy products. For example, low-income households generally have lower levels of car ownership and, thus, lower transport fuel consumption, meaning that a carbon price on fuel would have a smaller impact on these households. However, even small carbon price increases still raises consumer prices, which elevates the risk of poverty for low-income households. This could, nevertheless, be offset by revenue recycling to low-income households (Ohlendorf et al., 2020[31]). In developed countries, carbon pricing mainly has regressive impacts, meaning that it disproportionately impacts low-income households (Ohlendorf et al., 2020[31]) (Flues and Thomas, 2015[193]). Although lowincome households consume less carbon intensive products compared to high-income households within a country, the proportion of income spent on carbon intensive products decreases with rising income levels. Wealthier households are, therefore, less affected (Wang et al., 2016[191]). For instance, the carbon tax in
52 ENV/WKP(2022)3
Paris, France, accounted for 6.3% of poorer households’ income compared to 1.9% for richer households (Bureau, 2011[194]). Similar findings were also reported in the US and Ireland, however, also here revenue recycling could mitigate the effect (Hassett, Mathur and Metcalf, 2009[195]). In developed and developing countries, a carbon tax is not only regressive and progressive according to the income distribution, but also according to spatial distribution, meaning that the vulnerability of lowincome households differs according to whether they are located in rural or urban areas. For developed countries, rural areas often have decreased public transport availability compared to urban areas, and rural people are, therefore, more dependent on vehicles, thus, more vulnerable to an increase in fuel prices (Mattioli et al., 2019[196]). In developing countries, rural households have decreased access to public transport and lower levels of car ownership compared to urban households. A fuel price increase would, therefore, mainly impact urban households in developing countries (Zhao and Bai, 2019[197]) (Gwilliam, 2013[198]). There are, nevertheless, still car ownership amongst rural households, and as these most often have lower income levels, a price increase in fuel will, as mentioned above, also affect rural households and raise the risk of poverty for low-income households (Ohlendorf et al., 2020[31]). The distributional effects of carbon pricing also depend on other factors such as the social security system, the type of fuel already taxed in countries, and the adaptive capacity (e.g. the availability of public transport, or energy efficient buildings to keep heating costs low) (Klenert et al., 2018[199]) (Pizer and Sexton, 2019[200]). For example, taxes on electricity and heating fuels are typically highly regressive, whereas kerosene taxes are progressive because it is predominantly rich households who fly (Marten and van Dender, 2019[201]). Carbon prices may not be regressive if energy price increases are automatically reflected in social security payments as seen in Finland (SITRA, 2020). In addition, carbon pricing design options, such as those for revenue recycling and means tested welfare systems, could make carbon pricing progressive, including in developed countries (see section 5. ).
4.2. Rationale for carbon pricing
Although COVID-19 has brought about new challenges, it has also been an element which has contributed to increasing the rationale for ambitious climate policy, including the implementation of carbon pricing. The year 2020 was not only the start of the COVID-19 pandemic, but also the year in which many governments submitted updated short-term national climate targets, i.e. Nationally Determined Contributions (NDCs). Many countries have also announced long-term net-zero goals as well, and it remains important that countries’ short-term plans take these long-term goals into account, to ensure that short-term policy packages become stepping stones to achieve the long-term goals (Falduto and Rocha, 2020[202]). In addition, public pressure for ambitious climate action and environmental protection could be observed in many countries during the crisis (The Guardian, 2020[203]) (AA, 2020[204]) (Verkuijl and Shawoo, 2020[205]). Finally, countries’ spending for emergency and recovery packages have had large effects on governments’ budgets, elevated their debt levels, increasing the need for new revenue sources. Carbon pricing can respond to public support for climate mitigation and help countries progress towards their climate goals while generating revenues.
Increased number of net-zero goals and enhanced Nationally Determined Contributions
Countries’ medium-term targets and carbon pricing trajectories continue to fall far short of what is needed to meet the goals of the Paris Agreement (UNEP, 2014[206]). By mid-October 2021, 116 new or updated NDCs (representing 143 Parties) had been recorded in the interim NDC registry, collectively covering 94% of global GHG emissions in 2019, excluding land-use change and forestry emissions (UNFCCC, 2021[207]). These new or updated NDCs together represent an 11% reduction of total GHG emissions by 2030 as compared to the previous commitments of these NDCs. Furthermore, if these NDCs are implemented,
ENV/WKP(2022)3 53
along with their conditional elements, then there is the opportunity of global emissions peaking before 2030. Yet, despite the new or updated NDCs, all countries’ short-term mitigation targets would collectively lead to increased GHG emissions that are almost 16% higher in 2030 than 2010 levels (UNFCCC, 2021[207]). The NDC commitments are, therefore, far short of the 45% emission reductions from 2010 levels needed to limit global warming to 1.5°C. Moreover, this emissions trajectory would use up the vast majority (89%) of the emissions budget estimated to be compatible with a 50% chance of keeping warming to below 1.5°C (UNFCCC, 2021[207]). Despite the global pandemic, the momentum toward adopting net-zero targets has not stopped but accelerated, of which most countries with such targets announced these in 2020 or 2021. As of October 2021, 51 countries have enshrined net-zero targets in laws or policy documents, or have proposed legislation to do so, and several more have such targets under discussion (Jeudy-Hugo, Lo Re and Falduto, 2021[208]) (ECIU, 2021[45]). The list of countries with net-zero targets is increasingly diverse, with at least one target on each continent. The majority of targets aim for achieving net-zero by 2050, though China and Kazakhstan are aiming for 2060 and a handful of European nations (e.g. Finland and Germany) are targeting earlier dates. Bhutan, which in 2009 was one of the first countries to adopt a carbon neutrality goal, has already achieved net-zero (Kingdom of Bhutan, 2020[209]) (ECIU, 2021[45]). Although, this is an impressive achievement, Bhutan is a low-income country, and its total emissions may change when it develops further. The increased number of net-zero targets is a promising sign; but strategies and plans are needed to put them into operation. Approximately 40 countries have submitted a long-term low emissions development strategy (LT-LEDS) to the UNFCCC - and some of these countries specifically link their LT-LEDS to carbon neutrality or net-zero (UNFCCC, 2021[210]). The UK has, for instance, laid out sector-specific strategies and policies that they will pursue in order to get to net-zero (HM Government, 2021[211]). However, other countries with similar targets do not yet have such strategies in place to meet these targets (Jeudy-Hugo, Lo Re and Falduto, 2021[208]). Despite the increased short and long-term ambitions in the form of updated or new NDCs and net-zero targets, medium-term strategies connecting the two, such as through carbon pricing, are lagging. Some countries’ updated NDCs (e.g. Indonesia, South Africa) explicitly link their increased mitigation ambition with an increased role for carbon pricing (Republic of Indonesia, 2021[212]) (Republic of South Africa, 2021[213]). Other countries (e.g. Pakistan) indicate that they will explore the use of carbon pricing instruments, while several NDCs do not mention carbon pricing at all (Government of Pakistan, 2021[214]). However, some updated NDCs (e.g. Barbados) specifically indicate that the country is not planning to use a carbon price to meet its targets because of the perceived regressive nature of carbon pricing (Government of Barbados, 2021[215]). Furthermore, of the 51 countries that have adopted net-zero targets in current or planned legislation (Jeudy-Hugo, Lo Re and Falduto, 2021[208]), 34 mention the actual or potential use of carbon pricing in their latest NDCs. 29 Although, these are positive developments, most of the carbon pricing systems do not have price levels sufficiently high enough to reach the goals included in the Paris Agreement, 30 despite carbon pricing’s efficacy.
Carbon pricing has demonstrated effectiveness at reducing GHG emissions (EC, 2001[216]) (EC, 2006[217]) (Laing et al., 2013[218]). Evidence for a positive – but limited – effect has been found across different types of carbon pricing instruments (Green, 2021[219]). For example, studies of the impact of the EU ETS have highlighted that it resulted in a reduction of overall EU emissions by 3.8% between 2008-16 compared to
29 The number of ETS counted includes the EU itself and the relevant member states included in the 51 countries, and the latest NDC’s refer to NDCs from the end of October 2021.
30 Calculated on 02 April 2021 based on information from (UNFCCC, 2021) and price data presented earlier in this chapter. This calculation counts the European Union as one country since its Member States submit one collective NDC.
54 ENV/WKP(2022)3
a situation without the EU ETS (Bayer and Aklin, 2020[220]). An OECD paper even found this effect of the EU ETS to have been a 10% reduction in carbon emissions from 2005-12 (Dechezleprêtre, Nachtigall and Venmans, 2018[221]). There is also evidence that carbon taxes work in reducing GHG emissions. For example, the Swedish carbon tax on road transport fuels was estimated to have reduced transport emissions by 6% in an average year (Andersson, 2019[222]). The effectiveness of carbon pricing, nevertheless, also depends on the sector and the availability of alternatives within it, and thereby also on the price elasticity of energy products (Labandeira, Labeaga and López-Otero, 2017[223]). The impact of carbon pricing instruments can also be weakened if the price signal is dampened, e.g. through exemptions (for carbon taxes (Bruvoll and Larsen, 2004[224])) or free allocation (for ETS) (Flues and van Dender, 2020[225]). Such a dampened price signal was commonplace in individual carbon pricing systems, particularly in the initial years of operation (Ellis, Nachtigall and Venmans, 2019[164]). Carbon pricing is, therefore, still an underutilised tool in countries’ NDC and net-zero targets.
Public support for climate action has continued through the pandemic. In fact, public support for a “green recovery” from the COVID-19 pandemic is high globally (65%), with the most extensive support found in India (81%), Mexico (80%), and China (80%) (Long, Gordon and Townend, 2020[226]). Globally 71% sees climate change as big of a problem as COVID-19, and 65% globally feel that their government will be failing them by not acting on climate change (Townend and Skinner, 2021[227]). In a survey conducted in Europe in 2021, 93% view climate change as a serious problem, while 90% agree that GHG emissions should be reduced to make the EU climate neutral by 2050 (EC, 2021[228]). While public support for climate action is currently high, support for the introduction or expansion of concrete measures such as carbon pricing is generally lower (Klenert et al., 2020[229]). An OECD study in Denmark conducted in 2021 showed that a carbon tax on fossil fuels received the most opposition compared to other climate policies (e.g. subsidies for low-carbon technologies) (Figure 4.2) (OECD, 2021[230]). In the US, a carbon tax on corporations’ emissions was the fourth most popular climate change solution (73% in favour) out of five, whereas planting trees to absorb CO2 was the most popular (90% in favour), and tougher fuel standards the least (71% in favour) (Pew Research Center, 2020[231]). Prior to the pandemic, this decreased support was also visible as the public in several countries reacted to carbon pricing increases or implementations. In France, an increase in carbon prices on fuel in 2019 sparked the Yellow Vest Movement, leading the French government to eventually abolish the increase and freeze the tax rate (Douenne et al., 2020[232]). In Switzerland, a proposal of an increased carbon tax and the introduction of an aviation tickets tax were narrowly rejected by 51.6% of voters in June 2021 - a proposal which would have helped cut Swiss emissions in half by 2030 as compared to 1990 levels. The proposal would have increased the maximum carbon tax rate from CHF 120/tCO2 (EUR 110/tCO2) in 2022 to CHF 210/tCO2 (EUR 195/tCO2) until 2030, resulting in the increase of the tax if the emissions reduction target was not reached (Carbon Pulse, 2021[233]). In Mexico, the government’s introduction of gazolinazo in 2017 – a 20% increase in fuel prices - led to citizen protests and blocked streets (The Guardian, 2017[234]). In Australia, the announced plan to implement a carbon tax in 2011, resulted in big demonstrations in several cities (BBC, 2011[235]). The carbon tax was, nevertheless, implemented in 2012, however, it was only operational for two years before it was repealed in 2014 (The Guardian, 2014[236]).
ENV/WKP(2022)3 55
Figure 4.2. Stated support to climate policies in Denmark during the pandemic (2021)
Source: (OECD, 2021[230]).
Nevertheless, experience has demonstrated that governments can increase public support for carbon pricing (Klenert et al., 2018[199]) (Maestre-Andrés, Drews and van den Bergh, 2019[237]). This includes carbon pricing design options, such as putting in place revenue recycling mechanisms (see section 5. ). Political aspects are also important, as countries with higher political trust have been associated with stronger climate policies and lower amounts of GHG emissions than countries with low political trust. This is exemplified in countries such as Sweden, where a positive relationship exists between higher trust in politicians and higher carbon tax support (Fairbrother, Johansson Sevä and Kulin, 2019[238]). Introducing a carbon tax with revenue recycling mechanisms (e.g. lump sum rebates) can, nevertheless, increase public support (Klenert et al., 2018[199]). A gradual phase-in of carbon pricing may, furthermore, help overcome opposition because the initial resistance seems to decline over time. This was the case in British Columbia, Canada, where a carbon tax covering 75% of GHG emissions in the province was gradually introduced at a rate of CAD 10/tCO2 (EUR 6.78/tCO2) in 2008 to CAD 30/tCO2 (EUR 20.3/tCO2) in 2012. The tax featured a lump-sum revenue recycling mechanism, which returned up to CAD 116 (EUR 77.9) per adult and CAD 34.5 (EUR 23.3) per child through quarterly payments to households with annual incomes of less than CAD 31,700 (EUR 21,384) for singles or CAD 37,000 (EUR 21,959) for couples. Since the implementation of the tax, polls have been conducted regularly from 2008-14 in British Columbia and in the rest of Canada to follow the public support of the tax in areas with and without it. Results displayed that the public support for the carbon tax increased from 39% in 2008 to 57% in 2014 within British Columbia. Similar results were shown in the rest of Canada, where support increased from 41% in 2008 to 56% in 2014 (Murray and Rivers, 2015[240]). Other elements increasing public support includes relabelling carbon taxes as e.g. climate contribution, as the term tax has negative associations (Baranzini et al., 2016[239]). Moreover, a good communication strategy for governments considering a carbon tax can increase public support (CPLC, 2018[240]). Such a communication strategy entails addressing voters’ concerns and it should be used before and after a carbon tax introduction (Carattini, Carvalho and Fankhauser, 2017[241]). Although public support for carbon pricing is often contextual, there are, nevertheless, various opportunities and challenges related to different design elements (see section 5. ).
56 ENV/WKP(2022)3
Raising revenues to respond to COVID-19 and potential reduction of public debt levels
COVID-19 has reduced public tax revenues and increased expenditures of governments. As of July 2021, recovery spending in the 50 leading economies amounted to almost USD 17 trillion (EUR 14.6 trillion), equivalent to almost 20% of global GDP (GRO, 2021[19]). In the years to come, countries are expected to need tax revenues to respond to the social and economic ramifications of COVID-19. At the same time, countries have accumulated large amounts of public debt due to the recession caused by the pandemic and the cost of the rescue and recovery packages already put in place. In 2020, OECD countries issued debt securities worth EUR 18 trillion – 60% more than in 2019 (OECD, 2021[242]). The debt-to-GDP ratio of OECD countries increased by 16 percentage points (pp) in 2020, a sharper increase than that observed during the GFC (12pp).31 GDP-to-debt ratios are projected to further increase by 4pp in 2021 (OECD, 2021[242]). As a result of the increasing debt, 36 developing countries have been downgraded by one or more of the four largest credit rating agencies (Dooley and Kharas, 2020[243]), increasing the costs of financing capital-intensive public infrastructure and hampering the recovery of the most vulnerable countries.
Some countries are considering carbon pricing to boost government revenues that have fallen during the pandemic. For example, both India and Costa Rica increased pre-existing fuel excise taxes on transport fuels and have explicitly linked the increases to raising public revenue to respond to COVID-19 (IISD, 2020[244]). In 2021, Indonesia’s Ministry of Finance put forward a major plan to overhaul the current tax system, including increasing the value added tax, introducing an excise tax on plastic products and introducing a carbon tax which would amount to IDR 30,000/tCO2e (EUR 1.83/tCO2e) (Reuters, 2021[55]) (Jakarta Globe, 2021[56]). If implemented, Indonesia would be the second Southeast Asian country after Singapore to implement a carbon tax. Carbon pricing generates revenues for governments that can be used for multiple purposes, including financing recovery packages or reducing public debt. A uniform global EUR 30 or EUR 60/tCO2 carbon price on energy-related CO2 emissions would generate annual revenues worth more than 1% or 2% of global GDP in 2019. Extending pricing towards all sectors (e.g. agriculture, LULUCF) and all GHGs (e.g. methane, nitrous oxide) would increase these figures to 1.7 or 3.4% of global GDP. 32 Governments could use revenues in multiple ways, including public debt service, support for low-carbon technologies or vulnerable households, each of which has its advantages and drawbacks (section 5. ). Revenues from carbon or GHG taxes are, however, expected to decline once countries start decarbonising. Based on the first round of NDCs submitted to the UNFCCC, a global EUR 30/tCO2 carbon price on all GHG emissions would generate annual revenues worth 1.3% of expected global GDP in 2030. This is almost 25% lower than the revenue potential in 2019. For pathways compatible with limiting global warming to ‘well-below 2°C’, the revenue raising potential of a EUR 30 carbon price would decrease to 0.9-1.1% of global GDP (UNEP, 2019[245]). For 1.5°C pathways, the potential would further drop to 0.50.7%.33 Despite this decline, carbon pricing revenues could provide governments a much needed source of finance in the medium term.
31 Note that the interest rate during the GFC was substantially higher than the interest rate in 2020/2021, implying that countries ability to repay the debts might be relatively greater for debts accumulated during the pandemic. 32 These figures assume no behavioural change due to carbon pricing and global energy-related CO2 emissions of 33 GtCO2 (IEA, 2021[296]), global GHG emissions of 55.6 GtCO2e (Olivier and Peters, 2020[297]) and a global GDP of USD 87 trillion (WBG, 2021[298]). 33 Numbers are based on a global GDP of USD 121 trillion in 2030. Expected GHG emissions are taken from UNEP Emissions Gap report, amounting to 59GtCO2e for the conditional NDCs, 38-45GtCO2e for 2°C pathways and 2230GtCO2e for 1.5°C pathways in 2030 (UNEP, 2019[245]).
ENV/WKP(2022)3 57
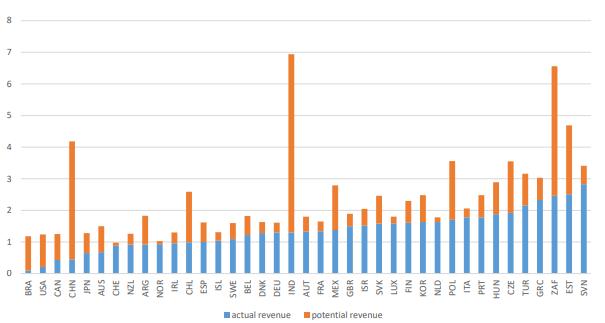
The revenue potential, i.e. the sum of actual and potential revenue, from pricing energy-related CO2 emissions as share of GDP differs widely across countries (Figure 4.3). This reflects mainly the GHG intensity of the economy. For example, the revenue potential of a EUR 30/tCO2 carbon price in Switzerland or Norway is around 1% of the countries’ GDP, mainly because both countries have an almost 100% decarbonised power sector and limited industrial activities. In contrast, for countries that heavily rely on coal in power generation, the revenue potential from the same carbon price could be as high as 4.2% (China), 6.5% (South Africa) and 6.9% (India). Most countries have significant scope to increase the revenue from carbon pricing compared to actual revenue levels (Figure 4.3). This is particularly true for emerging economies like China, India and South Africa. If those countries implemented a EUR 30t/CO2 carbon price on all energy-related CO2 emissions, their revenues would increase by between 100% (South Africa) and 500% (India). In other countries, there is less scope for raising the revenue, notably in European OECD countries, which have already relatively high levels of carbon prices.
Figure 4.3. Actual and potential revenues from pricing energy-related CO2 emissions in 2018
EUR 30t/CO2 benchmark, as a share of GDP (%)
Note: Actual revenue estimates are based on the sum of fuel excise taxes, carbon taxes and ETS auction proceeds. Source: (Marten and van Dender, 2019[201]).


