
ANNUAL REPORT 2022

Highlights 2022 3 Group summary 4 Chief Executive's Review 6 Vision, business concept, goals and strategies 8 Acquisitions 10 Value-adding link 12 Business model 13 Product areas 14 Region Sweden 16 Region Finland, the Baltic states and China 18 Region Denmark, Norway, the British Isles and East Central Europe 20 Employees 22 Sustainability and quality management 24 ANNUAL REPORT Five-year Group Summary 29 KPIs for the last five years 30 Directors' Report including the Corporate Governance Statement 31 Board of Directors 38 Senior Executives 39 Financial Statements of the Group Statement of Income 40 Statement of Comprehensive Income 41 Statement of Financial Position 42 Statement of Changes in Equity 44 Statement of Cash Flows 45 Financial Statements of the Parent Company Income Statement 46 Balance Sheet 47 Statement of Changes in Equity 49 Cash Flow Statement 50 Accounting Policies and Notes to the Financial Statements 51 Signatures 85 Auditor's Report 86 OTHER OEM shares 89 Definitions 92 Annual General Meeting 93 Real estate 94 Addresses 96 Contents
Another year of record highs for sales and earnings
The combination of strong demand, major acquisitions and positive currency movement effects resulted in another year of record performance, with sales rising 25% to sek 4,731 million. Operating profit rose 27% to sek 735 million giving an operating margin of 16%.
A 6 percentage point impact on growth from currency movements and 7 percentage point impact from acquisitions resulted in organic growth of 12 percentage points.
Demand was good despite challenges in the supply chain during the first six months. The supply chain situation was managed successfully and sales increased by 23% and incoming orders were up 25%. Customers continued to place orders with long lead times because of long delivery times.
The disruptions in the supply chain eased during the second half of the year and sales continued a positive trajectory with 27% growth. Incoming orders did not reach the level of sales, but saw a 9% increase on the same period last year.
Long delivery times have required a long-term approach when placing orders with subcontractors, which resulted in a gradual build-up of inventory and generally
higher inventory levels in the operations. The inventory level will gradually return to normal in 2023.
The performance in 2022 means that oem has exceeded all of its financial targets.
One acquisition was completed
The Irish company Demesne Electrical Sales Ltd was acquired in January 2022. The company is Ireland's leading independent importer and distributor of electrical control, energy-saving and installation products. Demesne Electrical's business model aligns well with oem and the acquisition opens up new opportunities in a new, interesting market. In 2022, the company's sales grew 20% to just over eur 23 million with good profitability.
Dividend
The Board of Directors of oem is proposing an increase in the dividend payment from sek 1.38 to sek 1.50 per share, which corresponds to sek 208 million. Except for 2009 and 2020, the dividend payment has remained the same or increased each year since 1983 when oem was launched on the stock market.
SUMMARY 2022 2021 % Net sales SEK million 4,731 3,774 25 EBITA SEK million 763 590 29 Profit before tax SEK million 724 576 26 Profit/loss for the year SEK million 576 457 26 Earnings per share SEK 4.14 3.29* 26 Shareholders' equity per share SEK 11.43 9.89* 16 Average no. of employees 968 886 9 Equity/assets ratio % 57 67 Share price at year-end SEK 72.30 92.70* -22 Dividend SEK 1.50** 1.38* 9 * The key performance indicator for 2021 has been adjusted to reflect the 3:1 share split and automatic redemption of every third share in Q2 2022. ** Proposed dividend 2022
OEM 2022 3 2,000 1,500 4,000 2,500 NET SALES (SEK MILLION) 3,500 3,000 22 19 18 17 16 21 13 14 15 20 200 300 600 500 EBITA (SEK MILLION) 400 700 22 19 18 17 16 21 13 14 15 20 5,000 800 100
OEM is a link that creates value between customers and suppliers
4.7
OEM brings value to its customers by offering a wide and diverse range of products, coupled with far-reaching technical product competence and applications know-how. The products come from leading manufacturers of products and systems for industrial applications. OEM serves as the extended arm of the suppliers in their respective markets and, with a strong marketing and sales organisation, aims to make them a leading player in their niche. This makes OEM the best distribution channel for its suppliers in OEM's markets and one of Europe's leading technology trading groups.
CUSTOMERS
400 SUPPLIERS 998 EMPLOYEES
oem has a portfolio of more than 60,000 products from over 400 suppliers who, with strong brands, are among the leading players in their respective niches. oem's extensive product know-how, years of experience and outstanding applications expertise offer customers a strong partner all along the supply chain, from product development and design to purchasing and production.
Market
oem has 33 operating business units in 15 countries in northern Europe, East Central Europe, the British Isles and China. Its domestic market is Sweden, where oem holds a market leading position in most of its
product areas. In other regions, the company's position varies from market to market. oem's goal is to be one of the largest players in all its chosen markets.
Customers
The majority of oem's customers operate in various segments of the manufacturing industry. Many of them are so-called Original Equipment Manufacturers (OEM), which means that they manufacture various kinds of machinery and equipment using constituent components from subcontractors. Other customers include installation companies, wholesalers and retailers for the professional and consumer markets.
GROUP SUMMARY
4 OEM 2022 1974 OEM Automatic AB is set up by the Franzén and Svenberg families. 1982 Set up in Norway. 1986 First acquisition Industri AB Reflex. 1989 Set up in the UK. 1997 OEM and Cyncrona merge. Acquisition of Internordic Bearings. 1981 Set up in Finland. 1974 1983 Listed on the Stockholm Stock Exchange. Set up in Denmark. 1991 OEM International is formed and becomes the parent company. 1998 Set up in Poland. 2005 Acquisition of Telfa. 2000 Jörgen Zahlin is appointed as Managing Director. Acquisition of Ernström Hydraulik. Acquisition of Indoma. 2001 Telecom crisis. 2002 Sales declined by 30 %. 2007 Acquisition of Klitsø. 2006 Set up in the Czech Republic. Offering
BILLION IN TURNOVER ENTITIES IN 15 COUNTRIES 33 30,000
2008 Acquisition of Elektro Elco. Set up in Slovakia.
2009 Set up in China.
2010 New logistics centre in Sweden. Sale of Cyncrona.
2011
2012
Acquisition of Akkupojat. New logistics centre in Finland.
Acquisition of Svenska Batteripoolen, Svenska Helag and Flexitron. Set up in Hungary.
2015 Acquisition of Rydahls, ATC Tape Converting and Scannotec.
2014 Acquisition of Nexa and Scanding.
2017 Acquisition of Rauheat and Candelux.
2016 Acquisition of Sitek-Palvelu.
Regions:
Sweden
Finland, the Baltic states and China
Denmark, Norway, the British Isles and East Central Europe
2019 Acquisition of Cabavo and the pumping division of Finisterra. Extension of Tranås logistics centre
2020
2018
Acquisition of ATB Drivtech.
Acquisition of Zoedale.
2021 Acquisition of jump starter business of Norwegian Export Import.
2022
Acquisition of Demesne Electrical.
2022
Pärnu Riga
Warszawa Trnava Prag Haag Malmö Nässjö Göteborg TRANÅS Karlstad Stockholm Drammen Allerød Björneborg Åbo
Esbo Vilnius
Rauma Jönköping
Jyväskylä Leicester
Budapest
Shanghai Cixi
CHINA
Dungannon Dublin Cork
OEM 2022 5
20% 58 % 22% Sales 15 % 67 % 18 % EBITA 19 % 55 % Employees 26 %
Another year of record performance
The strong demand experienced in 2021 continued into 2022 and the supply chain challenges have been successfully managed, resulting in organic growth of 12 percentage points. The weakening of the Swedish krona, especially against the Euro and the US dollar, helped increase sales by 6 percentage points, and Demesne Electrical in Ireland, acquired in January, posted positive growth of 7 percentage points. This results in a total annual turnover of SEK 4,731 million, which is 25% growth and means yet another record-breaking year.
Incoming orders have been strong during the year, especially in the first six months, and the total order book grew by sek 140 million
Thanks to close collaboration with suppliers and the ability to find alternative supply routes, it was possible to maintain the quality of deliveries to customers during the spring. Long delivery times have required a long-term approach for orders with subcontractors. This has resulted in a gradual build-up of inventory, which accelerated during the autumn following a general improvement in the supply chain situation. The risk associated with the increased levels of inventory is considered to be relatively low and inventory is expected to gradually get back to more normal levels during 2023.
The acquisition along with a raft of initiatives has boosted employee numbers by 100 to a total of 998. Marketing and travel activities have also increased, but have still not reached pre-pandemic levels. The cost increases are on a par with the increase in sales, and gross margin remained largely the same as the previous year. Profit before tax rose 26% to reach a new record level of sek 724 million. The EBITA margin also hit a new record high at 16.1% (15.6%).
Growth across the regions
All regions achieved new records in sales and earnings. The companies have generally
experienced good demand and the majority of them reported over 10% growth. The operations have also seen stronger profitability during the year, with most of them achieving operating margins above 10%.
In Sweden, the largest region, sales increased by 18% and incoming orders were up 11%. The operations reporting strongest growth were Svenska Batteripoolen, whose sales were up by 28%, and ATC Tape Converting with a 23% increase. Following a successful year, the Group's largest company, oem Automatic, generated growth of just over 20%. Operating profit (EBITA) for the region rose 27% as a result of growth and a stronger gross margin.
In Region Finland, the Baltic states and China, sales increased by 22% and incoming orders were up 10%. Most of the operations have delivered strong performances with oem Automatic and oem Electronics reporting sales growth of 23% and 21% respectively. Operating profit (EBITA) for the region rose 16% as a result of strong sales growth and an improvement in the gross margin.
In Region Denmark, Norway, the British Isles and East Central Europe, sales increased by 55% and incoming orders were up 39%. Growth reached 17%, excluding the acquisition. The operations in Denmark and Ireland reported the strongest performance with growth of just over 20%.
CHIEF EXECUTIVE'S REVIEW
6 OEM 2022
“ The ability of the organisation to adapt and be creative has been the key to OEM's success during this period.
Profitability and operating profit (EBITA) for the region rose 111% as a result of the acquisition and growth in other operations.
Acquisitions
At the beginning of January 2022, Demesne Electrical in Ireland was acquired. The company is a leading distributor of electrical control, energy-saving and installation products. The company uses several of the same suppliers as other oem companies and runs a similar business model. It has been exciting to start working with Demesne, which has integrated well into the Group. The acquired business is an excellent complement to the Group, and establishing a presence in a new, interesting market will open up new opportunities. The company delivered a strong performance during the year, with a sales increase of 22% to sek 247 million and an improvement in profitability.
A number of other companies have been identified during the year and we are currently in talks with several potential acquisition targets.
Dividend
oem's philosophy is to pay dividends to the extent considered reasonable, taking into account the financial position and any investment needs in the business or acquisition. A dividend of sek 1.50 per share is proposed for the 2022 financial year. This is an increase
of 9% on last year's ordinary dividend. This is equivalent to 36% of earnings per share after tax and a direct return of 2.1% based on oem's year-end share price.
oem has increased its dividend payouts since its stock market debut in 1983, apart from five years when the dividend was held flat, 2009 when it was lowered by 33%, and the pandemic year of 2020 when no dividend was paid.
Market situation made uncertain by the current global backdrop
Geopolitical tensions and the pandemic have presented major challenges in the last few years. Changes in demand and availability, rising prices and inflation have all made planning difficult. The ability of the organisation to adapt and be creative has been the key to oem's success during this period. The
role of a trading company is to work closely alongside customers and suppliers, and adapt its strategies as circumstances change to enable it to give the best possible service to its customers while remaining vigilant for new business opportunities. I am proud to work in an organisation that offers high levels of expertise and service to the market, with a consistent commitment to building a long-term business with stable growth and good profitability.
Tranås, March 2023
Jörgen Zahlin Managing Director and CEO OEM International AB
OEM 2022 7
Vision, business concept, goals and strategies
VISION
OEM shall be a leading technology trading group in components and systems for sustainable growth.
BUSINESS CONCEPT
oem offers an extensive and detailed range of components and systems from leading suppliers in selected markets in Europe. A well-structured local market organisation and efficient logistics make oem a better alternative to the suppliers' own sales organisations. oem provides a high level of expertise and service and markets the products according to the specific conditions of each market.
GOALS
oem's overall business objective is to be one of the leading technology trading companies in the company's chosen geographic markets. Profitability shall be on par with, or better than, that of the largest players in their respective market.
Financial targets
oem shall deliver sustainable profitable growth coupled with a good return on shareholders' equity and with minimal financial risk.
In 2022, the company's four financial targets were:
• Minimum sales growth of 10% per annum through a business cycle.
• A minimum EBITA margin of 10% per annum through a business cycle.
• A minimum return on equity of 20% per annum through a business cycle.
• A minimum equity/assets ratio of 35%.
In February 2023, new targets were approved by the Board of Directors, and the four financial targets thereafter are:
• Minimum sales growth of 10% per annum through a business cycle.
• A minimum EBITA margin of 12% per annum through a business cycle.
• A minimum return on equity of 25% per annum through a business cycle.
• oem shall prioritise a strong financial position to ensure operational stability and enable business acquisitions regardless of economic conditions. The debt/equity ratio shall be below 100%.
VISION, BUSINESS CONCEPT, GOALS AND STRATEGIES 8 OEM 2022 EBITA MARGIN (%) 10% The result for 2022 was 16.1% compared with the minimum target of 10 %. 16.1 15.6 12.9 11.0 11.7 21 22 20 19 18 RETURN ON EQUITY (%) The result for 2022 was 39 % compared with the minimum target of 20 %. 20 % 39 33 26 29 29 21 22 20 19 18 EQUITY/ASSETS RATIO (%) The result for 2022 was 57 % compared with the minimum target of 35 %. 35 % 57 67 69 62 59 21 22 20 19 18 SALES GROWTH (%) The result for 2022 was 25 % compared with the minimum target of 10 %. 10 % 21 22 20 19 18 25 0 6 14 15
STRATEGY
oem has defined five strategic areas that are important to its future development and success and for achieving its financial targets.
Growth
oem will create growth organically, through acquisitions and geographic expansion. These three together will generate growth that meets the growth target.
1) Organic growth
oem gives priority to organic growth. oem achieves organic growth by increasing its market share and expanding the range that the company offers its customers. oem's operations are expected to outpace the underlying market growth in those areas where the company is well established. In markets where oem has yet to achieve a position among the five largest players, the aim is to achieve considerably higher growth.
2) Acquisitions
Business combinations are a priority in oem's growth strategy. oem acquires companies and product ranges that strengthen its market position within current product areas in existing markets, and companies that add a brand-new range or give oem access to a new geographic market.
3) Geographic expansion
Geographic expansion into new markets will take place when it is possible for oem to become a prominent player by representing several of the company's suppliers.
Product range
oem shall offer a product range consisting of components and systems from leading suppliers. The range is adapted to the local markets in which oem operates. oem' s key strategy is ongoing development of its
range and it implements this strategy through partnerships with existing and new suppliers. Each local marketing organisation is also tasked with finding new products that will further enhance the competitive edge of the portfolio of offerings.
Marketing activities
oem shall have strong marketing activities based largely on face-to-face selling combined with the website as a hub in the sales process. Personal meetings are crucial to understanding customer needs, and a practical way for oem to communicate its experience and technical expertise. Faceto-face selling is supported by digital and printed marketing communication.
Logistics
oem shall develop logistics solutions that deliver excellent customer service, high quality and significant cost-efficiency. Most of the properties belonging to the 15 logistics units within the Group are owned by oem. Each unit adapts its range
to current operations and works towards greater coordination of the stockholding with other warehouses. In connection with many of oem's logistics units there are processing units that effectively provide unique adjustments for specific customers and the installation of products.
Employees and management
There should be a familial culture with a focus on entrepreneurship in all operations. oem shall give its employees opportunities to develop within the company, taking account of business goals and strategies as well as the employees' ambitions. Recruitment and employee strategies will lead to a significant number of leadership positions being filled internally.
oem's in-depth expertise and extensive range give customers access to high-quality products and the best possible support when choosing products for each particular application
OEM 2022 9
Acquisitions –play a key part in creating growth
Acquisitions are central to growth creation and business
development. Acquired businesses add new products, new expertise and extend the customer base within the Group. The aim is to add sales of approximately SEK 250 million each year through acquisitions.
oem primarily strives for three kinds of acquisitions. The first two described here are the most common:
• Operations with products that complement oem's portfolio in an existing market.
• Operations that give access to a new geographic market for one of oem's existing product areas.
• Operations of product-owning companies in one of the markets where oem has an established position.
Identifying companies for acquisition
The main responsibility for seeking and identifying potential takeover targets lies with the managers in oem's operations. The Group also works with brokers, audit firms and banks to ensure an inflow of interesting acquisition targets. oem strives to engage in dialogue at an early stage with the owners of potential targets. This builds trusting relationships and gives oem an opportunity to present itself as a long-term owner that can help the acquired businesses to continue to expand and evolve. The ideal acquisition targets have a number of common features:
• Trading company or product-owning company with annual sales of sek 30 - 250 million.
• Represents manufacturers or has its own brands.
• May have processing or simpler production facilities.
• The selling entity sees it as advantageous to have a new owner that is strongly committed to and interested in taking the business to the next stage of development.
Focus on the business
Central to oem's culture is a strong commitment to the operations and business. When analysing acquisition targets, there is therefore a strong focus on the business and areas such as the organisation, company culture, portfolio of offerings and future potential. In addition, an appraisal is performed to determine the effects of the acquisition on oem's other operations and what synergies could be achieved. oem makes acquisitions either by purchasing companies (with or without the previous owner remaining with the company) or by purchasing a company's assets.
Moving the acquired company to the next level of development
Based on its philosophy to be an active and long-term owner, oem creates a development plan during the acquisition process for the business it is acquiring. oem can, for example, make existing operations work to the advantage of the acquired company by opening up new markets and customer groups, and develop the range through its extensive network of manufacturing contacts. The acquired company can continue to operate as a separate company or can be integrated into one of the existing operations. The basis for these considerations is what is best for the current business and where are the greatest opportunities for growth.
ACQUISITIONS
10 OEM 2022
Acquisitions during the year
At the beginning of January 2022, Demesne Electrical Sales Ltd in Ireland was acquired. The company is a leading distributor of electrical control, energy-saving and installation products. The company uses several of the same suppliers as other oem companies and runs a similar business model.


The head office is in Dublin and it has branches in Cork in the south of Ireland and in Dungannon in Northern Ireland. The company has a strong product offering based on long-standing partnerships with most of the leading European manufacturers.
The acquired business is an excellent complement to the Group, and establishing a presence in a new, interesting market will open up new opportunities. The company delivered a strong performance
during the year, with a sales increase of 22% to SEK 247 million and an improvement in profitability.
Reason for the acquisition: Its business model aligns well with oem and the acquisition gives the oem Group a presence in a new and interesting market.
Type of acquisition: It operates as a separate company.
Acquisitions completed 2002-2022
2022 Demesne Electrical Sales Ltd Ireland
2021 Jump starter trading operations of Norwegian Export Import AS Norway
2020 Zoedale Ltd United Kingdom
2019 The pumping division of Finisterra AS Norway
2019 Cabavo AB Sweden
2018 ATB Drivtech AB Sweden
2017 RauHeat OY Finland
2017 Candelux Sp.z o.o. Poland
2016 Sitek-Palvelu OY Finland
2016 RF Partner AB and Ranatec Instrument AB Sweden
2015 AB Ernst Hj Rydahl Bromsbandfabrik Sweden
2015 Scannotec OY Finland
2015 ATC Tape Converting AB Sweden
2014 Kübler Svenska AB Sweden
2014 Scanding A/S Denmark
2014 ASE/Conta-Clip Poland
2014 Mytrade OY Finland
2014 Nexa Trading AB Sweden
2012 Datasensor Ltd United Kingdom
2012 TemFlow Control AB Sweden
2012 Vanlid Transmission AB Sweden
2012 Akkupojat OY Finland
2011 Flexitron AB Sweden
2011 Svenska Batteripoolen AB Sweden
2011 Scapro AB Sweden
2011 Svenska Helag AB Sweden
2011 Echobeach Ltd United Kingdom
2010 All Motion Technology AB Sweden
2009 Lasa Maskin AS Norway
2008 Elektro Elco AB Sweden
2008 OK Kaapelit OY Finland
2007 Klitsø Processtechnic A/S Denmark
2007 MPX Elektra ApS Denmark
2007 Crouzet AB Sweden
2006 EIG spol s r.o. Czech Republic
2005 Telfa AB Sweden
OEM 2022 11
Demesne supplies panel builders, one of its main customer groups, with a range of products from a large number of suppliers. Here is an example from a Motor Control Center.
Leading technology trading group
OEM's business model is based on creating value for customers and suppliers. A steadfast commitment to improving and developing its offerings to customers results in a unique range of products and systems which, along with the technical expertise of its employees, create value for its customers' products and processes. With a local presence, OEM markets its products effectively and reaches out to customers that the suppliers would otherwise find it difficult to reach.
Value for the customers
Knowledge, service and quality are some of oem's guiding values and set the tone for its relationship and interactions with its customers. oem's employees have considerable knowledge of the operations' product ranges and the areas of application for the products. Customers benefit financially and technically from the experience and expertise to which they have access when choosing components.
Access to high-quality products from leading suppliers is an important element of the offering, which in many cases is delivered in bespoke solutions designed to meet specific customer needs. Customised solutions are produced either at one of the operations' departments for bespoke products or directly at oem's suppliers if the volumes are large. Bespoke solutions that meet the specifications of customers can range from delivery of a pre-assembled series of components to adaptation of the length of a product's cable with plug attached. The fact that oem works closely with its customers and suppliers creates creativity that results in unique product solutions for the customers. Today, it is common that oem progressively becomes a supplier that customers turn to for the coordination of an increasingly large amount of their purchases.
Value for the suppliers
Strong sales organisations, high availability, modern marketing and efficient logistics form the foundation of oem's operations and are reasons why it is entrusted to represent the leading suppliers. The goal is always to be the suppliers' best sales channel in their respective market and make them the leading players in their respective niches. Serving as the extended arm of the manufacturers in their respective market means
that oem takes total responsibility for the customer relationship. By establishing close, long-standing relationships based on loyalty with its suppliers, oem avoids marketing rival products. The organisation has built up a wealth of expertise and know-how on the suppliers' products and how they can be used. It also means that oem engages in regular dialogue with the suppliers on product development, enabling them to develop products that meet market needs and wishes and thus sharpen the competitive edge.
Website is the hub for customer communications
The operations' websites present the ranges of products and all the specifications and product details, and thus serve as an information base for customers. It should be easy for customers to navigate oem's websites to find product information, inspiration and knowledge, making them a natural tool for customers to use in their daily activities. The e-commerce feature enables a smoother flow and facilitates the customers' purchasing process.
Logistics as a competitive advantage
Coordinating the work to larger logistics centres increases efficiency and automates the flow of goods, thereby improving cost-efficiency, quality and service. For major customers, logistics operations are tailored to meet their requirements and needs, for example delivery methods, packaging design and delivery frequency. This creates clear advantages for the customers. There is continuous focus on making the flow of goods a streamlined and seamless process that will lead to enhanced availability, quality and service over time.
VALUE-ADDING LINK 12 OEM 2022
OEM's business model
The business model is based on being a link between manufacturers and customers with the intent of creating value.
MANUFACTURERS
What this means for our manufacturers:
Assistance with marketing in local markets. Can have their products marketed with complementary products. Reach markets and customers that are difficult to reach when acting alone. Help with product customisation. Logistics solutions that meet customer demands. Feedback for their own product development.
processes Market communication OEM creates modern marketing communication that supports its sales. Sales process OEM runs an efficient sales process based on personal selling and extensive product knowledge. OEM offers a unique and extensive range of products from leading manufacturers. Logistics OEM has an efficient logistics process with high service standards. OEM 2022 13 Product range development
Access to components from more than 400 manufacturers. In-depth component knowledge. End-to-end solutions with complementary components. Possibility to reduce the number of manufacturers. Deliveries to the right place at the right time. Assurance of high product quality.
BUSINESS MODEL
What this means for our customers: CUSTOMERS
The development
of
our business operations is based on four central
Extensive product range from market-leading suppliers
OEM's product range comes from market-leading suppliers, primarily in Europe and Asia. It intends to continue developing its offerings to customers and works with leading suppliers to ensure the range comprises high-quality and competitive products.
At Group level, the products are divided into six main product areas, but other product groupings are used within each company.
oem's extensive offering of products and systems combined with its in-depth product and application expertise give customers access to high-quality products and the best possible support when choosing products for each particular application.
oem's offering comprises standard products and systems and bespoke solutions, developed in collaboration between the customer, supplier and oem.
Product range development
Extension and improvement of the range is an ongoing process which generally takes place in three ways.
• Work with existing suppliers to expand the collaboration to much of their range and work together on new product development.
• Start up partnerships with new suppliers of products that complement an existing range.
• Acquire operations that provide access to new ranges or products that complement an existing range.
Local market adaptation
oem's offering differs across the various geographic markets, which is a natural consequence of each market having its own features and requirements. oem has also been established in the markets for varying lengths of time which influences development and growth. Each operation has to align its offering to local market demand and according to which suppliers are available as partners.
Electrical components
Machinery components & cables
Pressure & flow components
Motors, ball bearings & brakes
Appliance components
Installation components
PRODUCT AREAS
14 OEM 2022
Sweden PRODUCT AREAS Finland China Balticstates Poland Norway Denmark CzechRepublic SlovakiaUnitedKingdom Hungary Ireland
ELECTRICAL COMPONENTS
The product area comprises products supplied by oem Automatic, oem Automatic Klitsø, Svenska Batteripoolen, Akkupojat and Demesne Electrical.
Products include:
Relays, terminal blocks, sensors, machine safety products and batteries.
Areas of application:
The products are used inside or around control cabinets. Sensors and safety components are used in machinery, automated production lines, etc. Batteries are used as starter batteries or industrial batteries for power backup, etc.
Examples of customers:
Komatsu Forrest, Epiroc, ABB and electrical wholesalers.
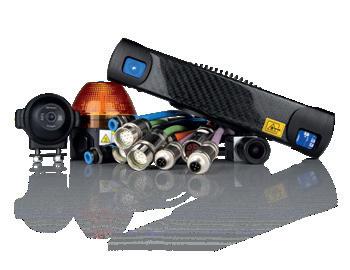
MACHINERY COMPONENTS & CABLES
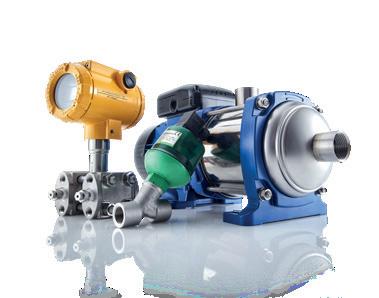
PRESSURE & FLOW COMPONENTS
The product area comprises products supplied by oem Automatic and oem Automatic Klitsø.
Products include:
Energy chains, machine cables, vehicle products, warning devices and cameras for 2D and 3D applications.
Areas of application: Most of the products are targeted at original equipment manufacturers for use in the machinery that they produce, for example fork-lift trucks and construction equipment. Parts of the range also target medical equipment and consumer-oriented applications where camera technology is required.
Examples of customers: Toyota Material Handling Manufacturing, Epiroc, Sandvik, Cellavision and Flir.
The product area comprises products supplied by oem Automatic, Telfa, SitekPalvelu and oem Automatic Klitsø.
Products include:
Valves, gauges, sensors and pumps.
Areas of application:
The products primarily target original equipment manufacturers for use in the machinery that they produce and processing industries in Sweden, Finland and Denmark. They cover a wide range of applications, from mobile hydraulics to food and medicine.
Examples of customers: Tetra Pak, Epiroc, Delaval, Volvo and Getinge.
MOTORS, BALL BEARINGS & BRAKES
APPLIANCE COMPONENTS
INSTALLATION COMPONENTS
The product area comprises products supplied by oem Motor, Internordic, Ernst Hj Rydahl Bromsbandfabrik, oem Automatic and oem Automatic Klitsø.
Products include:
Drive electronics, motors, gears, ball bearings, seals, transmission products, brake and friction systems.
Areas of application:
The products are targeted at original equipment manufacturers for use in the machinery and equipment that they produce and they are used for food industry equipment, medical equipment and park and garden equipment. Brake and friction products also target the automotive industry.
Examples of customers:
Tetra Pak, Cytiva, Öhlins, Husqvarna, Toyota Material Handling Manufacturing, Nobina, Getinge Disinfection.
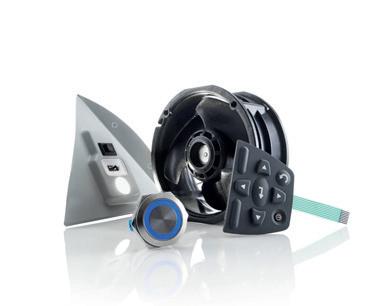
The product area comprises products supplied by oem Electronics, Svenska Helag, ATC Tape Converting, Agolux and oem Automatic.
Products include: Displays, keyboards, cooling fans, tapes, LED lighting, cables and power components.
Areas of application:
The products target original equipment manufacturers, high-volume manufacturers and contract manufacturers for use in the electronic equipment and devices that they produce. The products are used in devices in a variety of areas, e.g. medical technology, consumer products, heating technology and industrial computers.
Examples of customers: Husqvarna, Nibe, Franke and Axis.
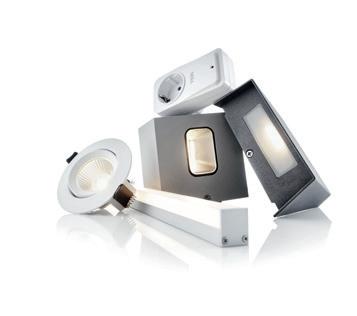
The product area comprises products supplied by Elektro Elco, Agolux and Nexa Trading.
Products include:
Lighting and products for wireless control in the home.
Areas of application:
Indoor and outdoor lighting for the home with LED technology. Wireless control of lights, sunshades and doors in the home.
Examples of customers:
Electrical wholesalers that target professional installers, such as Rexel and Elektroskandia. Building and DIY stores such as Bauhaus and Clas Ohlson.
OEM 2022 15
New sales and earnings record
Region Sweden continued to see strong demand throughout the year and achieved 18% sales growth. The companies have been able to serve their customers and continue developing their business well despite the supply chain disruptions. The region delivered a record earnings performance with a 27% increase.
Offering
Sweden is the Group's largest region and accounts for 58% of total sales. The region is made up of 11 companies, each specialising in a particular area of expertise with in-depth knowledge of their products and applications.
oem offers the Swedish market more than 60,000 industrial components and system products. The product range is marketed as individual components and as assembled solutions tailored to customer requirements for various applications for the manufacture of equipment and appliances.
oem has a tradition of working closely with customers and is frequently involved in their development activities. The product and application expertise of its sales staff and product specialists plays an important part and helps optimise the customers' products and manufacturing processes. Good supply capacity, a high level of service and flexible logistics solutions are other areas where oem creates added value for its customers.
Market
In 2022, the market continued to be characterised by strong demand, rising prices and supply chain disruptions, especially during the spring. This led to customers
placing orders with longer than usual lead times in the spring and then orders with shorter turnaround times in the autumn. As a result of this, incoming orders were weaker during the autumn.
oem is a market leader with a generally strong position in several segments in Sweden. It is a mature market with normal underlying growth of a couple of percent per year, and where the performance of Swedish export companies plays a huge role. Its customers are primarily equipment and appliance manufacturers, along with manufacturing companies in the automotive, forestry, telecommunications, IT and medical technology industries. In certain segments, customers also include wholesale companies, builders merchants and DIY stores.
Swedish industrial companies have manufacturing facilities in Sweden and around the world. Development and design units are often located in Sweden and, thanks to close working relationships with its customers, oem normally follows the customer to wherever the end products are produced. Globalisation and digitalisation are creating greater transparency, which in turn leads to price competition particularly for standard products. oem ensures competitive pricing through close partnerships with manufacturers and efficient
REGION SWEDEN
NUMBER OF EMPLOYEES % OF GROUP NET SALES 58 OPERATING PROFIT EBITA ( SEK MILLION ) 506 533
16 OEM 2022
Sweden
Examples of customers: Toyota Material Handling Manufacturing, Rexel, Elektroskandia, ABB, Tetra Pak AB, Husqvarna, Epiroc and Delaval International AB
Competitors include: Subsidiaries of trading companies like Addtech and Indutrade, subsidiaries of manufacturers like Schneider and Omron, and lighting companies like Fagerhult.
Operations are conducted through the following companies:
OEM Automatic AB, Elektro Elco AB, OEM Electronics AB, OEM Motor AB, Internordic Bearings AB, AB Ernst Hj Rydahl Bromsbandfabrik, Nexa Trading AB, Svenska Batteripoolen AB, Telfa AB, Agolux AB and ATC Tape Converting AB.
and effective internal processes. Delivering optimal solutions is an important aspect of value creation for customers. Working collaboratively with customers often produces unique solutions for components, supplies and business arrangements.
In-depth knowledge of products and applications is one of oem's major competitive advantages. This knowledge is communicated via the iNSPO customer magazine, produced by oem Automatic AB, with articles about products, customer cases and reports.

As a result of the long-standing customer relationships that this creates, oem continues to supply its customers even if they relocate their production abroad.
Performance in 2022
A combination of generally strong demand and price increases produced 18% sales growth. Foreign exchange movements had a positive 7% impact which meant that organic growth landed at 11%. Incoming
orders were strong during the spring and weaker during the autumn when the supply chain disruptions eased. This meant that incoming orders for the full year were up 11% on the previous year and 3% higher than sales.
Operating profit (EBITA) rose 27% as a result of growth, an improvement in the gross margin and because increases in expenses for travel and marketing activities have remained low. The EBITA margin rose from 17.1% to a record high of 18.4%.
Svenska Batteripoolen, which markets starter batteries and industrial batteries, delivered the strongest growth during the year. The 28% increase in sales comes from improved sales volumes to existing customers and from several new, interesting customers. ATC Tape Converting, specialists in the supply and conversion of adhesive tapes and materials, has performed strongly in recent years with an average annual growth rate of over 20%. It proved to be yet another successful year with several new customers, resulting in an increase in sales of 23%. The Group's largest company, oem Automatic, reported that sales grew by a record 20%.
SALES (SEK million)) 2,400 2,500 2,900 2,300 2,200 2,100 2,800 2,700 1,800 1,900 2,000 20 19 18 22 21
Electrical components Machinery components & cables Pressure & flow components Motors, ball bearings & brakes Appliance components Installation components PRODUCT AREAS OEM 2022 17
OPERATING PROFIT EBITA (SEK million) 425 400 375 350 325 450 250 300 20 19 18 22 21 500 475 525
Demand remains strong
Demand remained robust throughout 2022 and growth landed at 22%. Although the market has been impacted by higher prices, material shortages and supply issues, particularly from Asia, it has been possible to maintain a high level of service which has helped underpin the strong performance. The region delivered a record earnings performance with a 16% increase.
Offering
oem's second region comprises the operations in Finland, the operations in the Baltic states of Estonia, Latvia and Lithuania, and in China. The region accounts for 20% of oem's total sales.
Finland was the first country in which oem established operations outside of Sweden and is the second largest market for the oem Group. The operations are conducted in six entities, each with extensive knowledge of their products and areas of application. The customer offering comprises a comprehensive range of industrial components and systems, spread across the Group's six product areas. The offering comprises both standard products and bespoke products and systems. The product range has been developed over the years based on local demand and availability, which means the range differs slightly from that in Sweden.
oem originally established operations in the Baltic states and China to follow Swedish and Finnish customers that outsourced their production to these markets. The product offering in these markets is largely based on what is available from the Swedish and Finnish logistics units, but most sales are generated in the areas of Electrical components, Appliance components and Flow technology.
Market
Demand remained strong and was characterised by rising prices, material shortages and supply chain disruptions, which particularly affected supplies from Asia. The recovery that was seen in 2021 after a few years of unremarkable performance has continued and Finnish industry has enjoyed strong growth.
The war in Ukraine and the subsequent trade sanctions have had a minor effect on the market. The dependence of the Finnish industry on Russia has declined significantly over the years, and new trade partners were quickly found elsewhere when the sanctions were levied against Russia.
In Finland, oem holds a strong position in many segments. The combination of a strong product offering and a robust and effective marketing organisation has created sustainable partnerships with customers. Close collaboration with customers and suppliers also lays the foundation for the successful development of product offerings. oem's customers in Finland are major manufacturers of equipment and appliances, and industrial manufacturing companies producing forest and construction equipment, mining machinery, lifting equipment and energy solutions. Other key customer segments are the plumbing,
REGION FINLAND, THE BALTIC STATES AND CHINA
% OF GROUP NET SALES 20 OPERATING PROFIT EBITA ( SEK MILLION ) 137 NUMBER OF EMPLOYEES 180
18 OEM 2022
MARKET
PRODUCT AREAS Finland
China Balticstates
Electrical components
Machinery components & cables
Pressure & flow components
Motors, ball bearings & brakes
Appliance components
Installation components
heating and electrical wholesale industry and the construction trade sector.
Although the operations in the Baltic states and China largely serve Swedish and Finnish customers that are established there, products are sold to local customers too. Demand is mainly affected by the strategic decisions of the Swedish and Finnish customers rather than any general market trend.
Performance in 2022
Demand has been good throughout the year and the region closed the year with a record quarter that gave 22% growth for the full year.
There was a positive impact of 5 percentage points from changes in exchange rates on sales, which resulted in 17% organic growth.
Incoming orders, which were strong during the spring and weaker during the autumn, were up 10% on the previous year and were in line with full-year sales.
The gross margin was down 1 percentage point due to changes in the customer mix. Operating profit (EBITA) rose 16% and the EBITA margin slid from 14.9% to 14.1%.
Strongest growth was achieved by oem Automatic, the region's largest operations, which generated growth of 23%. oem
Electronics delivered the second-highest growth at 21%, while sales turnover in the motor and ball bearing sales operations increased by 10%. RauHeat, which markets HVAC & plumbing products, reported a 9% increase in sales. Hide-a-lite, which sells LED lighting, reported a 9% increase.
The operations in the Baltic states reported an 11% increase, whilst sales remained unchanged for the operations in China, which were affected by lockdowns during the pandemic. The operations in
Examples of customers: Arnon, Sandvik Mining, Onninen, Ponsse, Raute, Valmet.
Competitors include:
Subsidiaries of trading companies like Addtech and Indutrade, and Lapp Automaatio and Wexon.

Operations are conducted through the following companies:
OEM Finland OY with the business areas OEM Automatic, OEM Electronics, OEM Motor and Hide-a-lite. Akkupojat Oy, RauHeat Oy, OEM Automatic OU, OEM Automatic UAB, OEM Automatic SIA, OEM Automatic (Shanghai) Co.Ltd.
Baltic states and China are still relatively small and only have limited impact on total growth in the region.
the
Professional development of employees is crucial to the ability to offer the best service in the market. Personal development also raises oem ' s profile as an attractive employer.
OEM 2022 19
SALES (SEK million) 850 900 1,000 800 700 950 550 750 600 650 20 19 18 22 21 OPERATING PROFIT EBITA (SEK million) 140 50 130 120 110 100 60 80 70 90 20 19 18 22 21
Robust growth for the region
A combination of good demand, positive currency effects and a major acquisition led to an overall sales increase of 55%.
In particular, the Danish company and the newly-acquired company in Ireland achieved the highest rates of growth. Profitability rose 111% as a result of growth and an improvement in the gross margin.
Offering
oem's third region now has operations in eight countries having acquired a business in Ireland. The operations in the region are conducted, apart from through the newly-acquired company, through seven oem Automatic companies. Oem Electronics is established in Poland, the Czech Republic, Slovakia and Denmark, and lighting products are marketed in Denmark and Norway under the Hide-a-lite brand.
The operations are diversified due to the geographic spread providing variation in customers and offerings. There are also country-specific customer types that are unique to the Group. In some cases, the local product portfolio is specially tailored to these customers. The region accounts for 22% of oem's total sales.
The offering in the region mainly comprises standard products plus a number of bespoke products and systems. Over the years, each company has gradually expanded its offering, and the major companies in Denmark, the UK, Norway, Poland and the Czech Republic now have extensive product portfolios. The recently acquired company in Ireland specialises primarily in electrical components, which offers strong potential for expansion in other segments.
Market
oem's markets in the region differ in terms of economic development. The wind turbine and processing industries are key customer groups in Denmark. In Norway, the customer base primarily comprises small-scale industrial businesses and electric vehicle developments have given rise to new collaborative alliances. In the UK, the customer base is relatively broad and comprises both OEM customers and end users. Local distributors that supply components to production companies are also an important customer group. The largest customer groups in Ireland are wholesalers and building contractors for data centres.
The railway industry is generally a key customer group for East Central Europe. The domestic mining and minerals industries are important customers in Poland, and subcontractors in the automotive industry are a key customer segment in the Czech Republic, Slovakia and Hungary. Operations in Slovakia and Hungary are relatively small, which also restricts the product offering.
REGION DENMARK, NORWAY, THE BRITISH ISLES AND EAST CENTRAL EUROPE
% OF GROUP NET SALES 22 OPERATING PROFIT EBITA ( SEK MILLION ) 118 NUMBER OF EMPLOYEES 255
20 OEM 2022
Performance in 2022
In 2022, the region's net sales rose 55%. The acquisition of Demesne Electrical Sales and changes in exchange rates had favourable impacts of 38% and 5% respectively, giving a total organic increase of 12%. All companies have seen their product
An effective sales process and good business acumen create opportunities for identifying and seizing upon potential new business.
In combination with the expansion of the product offerings, this generates growth for new and existing customers.
offerings continuing to evolve well, which has generated growth for new and existing customers. Supply chain disruptions have adversely impacted supply capacity, however, which has affected growth.
Incoming orders, which were strong during the first six months and weaker during the last six months, were up 39% on the previous year and were 2% higher than full-year sales.
Operating profit (EBITA) rose 111% due primarily to sales growth. The EBITA margin increased from 8.5% to 11.6%.
Examples of customers: RS Components, Turf Tank, Westcontrol, Stadler Polska.
Competitors include: Sick, Dacpol, Omron, Festo.
Operations are conducted through the following companies:
Demesne Electrical Sales Ltd, OEM Automatic Klitsø A/S, OEM Automatic Ltd, OEM Automatic Sp z o. o., OEM Automatic AS, OEM Automatic spol. s.r.o., OEM Automatic s.r.o. and OEM Automatic Kft.
Demesne in Ireland saw strong demand and handled the supply chain disruptions in a praiseworthy way. As a result, it posted 22% growth and a clear rise in profitability.

The UK operations reported 2% sales growth as well as lower demand, due in part to several major projects from previous years not returning. Zoedale was acquired in 2020 and has been merged with oem Automatic during the year.
The company in Denmark reported 24% sales growth and healthy demand, particularly from the processing sector. Demand remained stable for the company in Norway, resulting in a sales increase of 11%.
The operations in East Central Europe have experienced positive growth over several years and 2022 was no exception. The operations in Hungary posted sales growth of 15%, followed by Poland and the Czech Republic with a 14% increase. Slovakia, a relatively small market for oem, saw negative sales growth for two major customers, resulting in growth of just 2%.
SALES (SEK million) 1100 500 650 600 550 OEM 2022 21 OPERATING PROFIT EBITA (SEK million) 40 10 30 20 80 70 60 50 0 20 19 18 22 21 20 19 18 22 21 PRODUCT AREAS Electrical components Machinery components & cables Pressure & flow components Motors, ball bearings & brakes Appliance components Installation components Norway Poland Denmark SlovakiaCzechRepublic HungaryUnitedKingdom Ireland 700 750 800 950 900 850 90 100 110
Continuous employee development
OEM's long-term competitiveness is built on employee development and an influx of young talent. The expertise and commitment of employees are what make the difference in an increasingly competitive market. A healthy company culture, equality in organisations and good health and safety practices are prioritised areas that make an employer attractive to both existing and future employees.
Professional development of sales staff and product specialists is crucial to the ability to offer the best service in the market. Strong teams and continuous skills development enable oem to meet the increasing demands of the market for in-depth product and application expertise. While also creating good opportunities for employees to enjoy career progression within oem
Corporate culture enhances the competitive edge
oem's corporate culture is based on the watchwords –positive attitude, commitment, modesty, tenacity and openness. The strong corporate culture makes oem an attractive employer and is essential to enhancing oem's competitive advantage through its employees.
Best service in the market
With a business model based on trust and long-standing relationships with customers and suppliers, it is important to exceed expectations all the time. The sales professionals therefore work closely alongside the customers with the goal of providing the best service in the market. A highly effective sales process and good business acumen also increase opportunities for identifying and seizing upon potential new business. The sales professionals have multi-year development plans that are an important resource for improving the sales process.
Focus on skills development
The main responsibility for employee skills development rests with the companies themselves. Complementing this are central initiatives, such as Group-wide development programmes aimed at improving skills and building networks among the employees.
Strong teams with clear targets, for both the team and each individual, are a success factor and an integral part of oem's management culture. To meet the organisation's requirements for development, it is important that all managers work actively to identify and provide training for individuals with leadership qualities who can become future leaders. Since the majority of management recruitment is from within oem, this is given high priority.
Showing interest, being creative and goal-oriented are all traits that are encouraged by oem. These qualities are important to an employee's career success and help drive oem's growth. Experience from the sales and product organisations is highly valued and mobility between different operations and countries is encouraged.
Individual development plans
oem is continuously committed to improving its position as an attractive employer for both existing and future employees. Personal development is important to employee satisfaction and happiness. Annual performance appraisals and individual development plans play an important role in the ongoing skills develop-
EMPLOYEES
22 OEM 2022
Strong teams and continuous skills development enable oem to meet the increasing demands of the market for in-depth product and application expertise.
ment taking place in all areas. Development plans are tailored to the individual based on a review of the past year's activities, the goals of the employee and the objectives and needs of the business. It is important to have efficient and effective processes for working with employee development to assist in the identification of candidates for management and leadership positions.
Strengthening the organisation with young employees
An important part of building a strong, competitive organisation is to continuously hire young employees. An interest in technology and sales is a plus when hiring and are assets that bring dynamism and drive to the organisation. Well-designed induction programmes and individual development plans enable new employees at oem to get up to speed quickly with their job tasks. In the long run, this also supports the employee's own career progression with opportunities to gradually advance into more responsible positions. OEM has a trainee programme for newly-graduated employees with degrees in engineering or economics and the potential to assume leadership responsibilities in the future. oem also works collaboratively with several educational institutions, offering
internship opportunities, guidance in thesis research projects and other assistance. This is a means of attracting future personnel and reaching out with information about oem's business and operations.
Equal organisations
One of oem's overall sustainable development goals is to increase the percentage of women with the aim of increasing the number of women in senior positions. Organisations where every individual has equal opportunities are more dynamic and have a stronger competitive advantage. Management positions are often filled from within the organisation and many of the senior executive positions are held today by individuals who have worked in the sales and product organisations. It is therefore particularly important to increase the number of women within these areas in order to achieve this goal. oem operates in a male-dominated sector where there is an over-representation of men among job applicants. The focus is therefore on increasing the number of female applicants, especially within services that work closely with customers and suppliers. A series of activities are in place to maximise the chances of succeeding with this, including posing requirements on those conducting
the recruitment process and giving female candidates the opportunity to meet female employees during the recruitment processes.
Employee well-being
Happiness and health are essential for enabling employees to perform and develop throughout their career, both individually and as part of a team. Workplaces must provide an attractive, safe and healthy environment and regular investments are made to ensure this is so for those who work there. Activities designed to create good cohesion, strong teams and group dynamics are often conducted in conjunction with conferences, workplace meetings and other gatherings. oem offers employees support for physical activities to encourage a healthy lifestyle.
Employee numbers increased
Growth and new ventures resulted in an increase from 898 to 998 employees in 2022. oem is continuously strengthening its organisation through recruitment, in particular within the sales and marketing area.
250 200 150 100 50 300 - 25 26-35 36-45 46-55 56AGE SPLIT (No./age)
886 898 21 7 2 1 2022 2021 Average no. of employees 968 998 21 7 4 1 Employees at year-end Women (%) Sick leave person / yr (DAYS) Training costs / employee (SEK 000) Wellness costs / employee (SEK 000) OEM 2022 23 -1 1-3 4-7 8-11 12300 200 150 100 0 LENGTH OF EMPLOYMENT (No./years) 250 50
The business model drives the sustainability agenda forward
The strength of OEM's sustainability agenda is that it is incorporated in the business model. The organisations' extensive product and application expertise also includes sustainability aspects and thus forms a natural part of the business. Effective sustainability practices are also a competitive advantage and help safeguard OEM's future growth and financial stability. The Group's overall sustainable development goals are in line with prioritised components of Agenda 2030 and embrace the three fundamental pillars of sustainable development; economic, environmental and social. OEM also enhances its competitive advantage and position as an attractive employer by working proactively to reduce negative environmental impacts, uphold high ethical standards, promote equal opportunities and create financial stability.
Focus on the customer
An important part of the sustainability agenda is to help customers make the right choices when it comes to components and solutions. oem offers sustainable solutions through low-energy and high-efficiency products, reduced need for travel, smart products that help streamline production and enhance operations or simply contain fewer raw materials. Products with a long life, that can be repaired and are made of recyclable materials are a good fit for the circular economy. Aiming to offer the right sustainable solutions is positive not only for the transition to a sustainable society, it is also a competitive advantage that creates business opportunities.
Sustainable products and solutions
oem offers an extensive range of sustainable products and solutions. Here are some examples:
Remote connectivity reduces travel oem provides products of the future for IIOT solutions. One example of this is Tosibox, which produces industrial routers that help customers remotely control and monitor devices. Creating a secure VPN tunnel in a matter of minutes to, for example, their PLCs, operator panels, cameras or computers. Remotely-connected devices streamline work processes, reduce the risk of disruptions and cut down on travel time and expenses.
Reuse increases product life
oem's performance enhancement service can help its customers extend the life of products. Bespoke prod-
ucts that can be repaired instead of discarded are one example of this. Only a small part of a worn product is discarded, while the rest is repaired and returned to the customer. This not only extends the life of the product, it uses fewer materials, produces less waste and provides a cost saving for the customer.
Energy savings and safe environments
In its range, oem offers energy-saving Tostås street lights from Exolöf with light control and night dimming functions. Dimming the lights during certain hours makes it possible to save energy while still keeping streets and other outdoor spaces illuminated during the evenings and at night. Using the Zhaga socket, Tostås can be connected to the internet to enable remote control and monitoring. This saves time and cuts down on travel.

SUSTAINABILITY AND QUALITY MANAGEMENT PROGRAMME
24 OEM 2021
OEM and Agenda 2030
Agenda 2030 and the Global Goals have provided direction in defining the main Sustainable Development Goals. oem has chosen to focus on 4 of the 17 goals. To optimise and drive the sustainability agenda forward, the subsidiaries' own sustainable development goals should be linked to the Group's main goals. Depending on the specific circumstances of the companies, they can also have other goals linked to any of the other global goals.
4 prioritised goals
The 4 Global Goals being prioritised have been chosen based on the focal points and risk areas identified as having most significance to both oem and the Group's stakeholders.
The choice of goals also ensures that oem's sustainable development agenda includes all three aspects of sustainability.
Environmental responsibility
The environmental impact from the Group's product and passenger transport, heating of premises, and products and packaging materials.
Economic and ethical responsibility
Financial stability and strength is essential for investment in sustainable business development. Ensure responsible business practices that respect human rights and oppose corruption.
Social responsibility
As a responsible employer, be able to offer employees skills development, a positive working environment, good health and safety, and oppose and prevent all forms of discrimination and harassment in the workplace.
OEM's Code Of Conduct
The Code of Conduct is based on the ten principles set forth in the United Nation's Global Compact in the areas of human rights, labour, the environment and anti-corruption. These areas encompass essential components of the responsibility that it is natural to take for all of the Group's companies.
Focus on sustainability at every stage
oem's Board of Directors has, through the Group management, the ultimate responsibility for the Group's sustainability-related activities. Through a decentralised corporate culture, the operational responsibility lies with the companies, whose goals and activity plans are in line with the overall sustainable development goals.
To optimise and drive the sustainability agenda
OEM's Code Of Conduct
Human rights
1) oem supports and respects international human rights within the company's sphere of influence.
2) oem shall not be complicit in human rights abuses.
Working rights
3) oem upholds freedom of association and recognises the right to collective bargaining.
4) oem has a zero-tolerance policy towards any type of forced or compulsory labour.
5) oem has a zero-tolerance policy towards any type of child labour.
6) oem is against all discrimination with regard to recruitment and the performance of work.
The environment
7) oem supports the precautionary approach with regard to environmental hazards.
8) oem undertakes initiatives to promote greater environmental awareness.
9) oem encourages the development of environmentally-friendly technologies.
Anti-corruption
10) oem is committed to countering corruption in all forms, including extortion and bribery.
forward, oem has a sustainability committee with representatives from the major companies. The mission of the sustainability committee is to create a coordinated approach, a high level of quality and focus on the sustainability performance of the whole Group. If necessary, the Parent Company can further support these activities with tools and processes.
The Group has a whistleblowing system in place that is an important tool for maintaining high ethical standards and a culture of openness. This provides a channel for employees to report any violations or suspected wrongdoing or misconduct.
This working model ensures the right focus, quality and responsibility in sustainability practices at every stage.
Reduce greenhouse gas emissions
oem has the long-term goal of reducing greenhouse gas emissions. Greenhouse gas emissions are measured, monitored and reported in line with the GHG Protocol. Emissions are reported in 3 scopes. oem's current focus is on scopes 1 and 2, and also goods transport and business travel in scope 3. A pilot has been launched by
OEM 2021 25
OEM Automatic AB to work on more comprehensive reporting for scope 3.
This report will then be implemented in stages through the rest of the organisation.
Scope 1 Direct greenhouse gas emissions over which the business has control.
Scope 2 Indirect greenhouse gas emissions from electricity, district heating, district cooling and steam.
Scope 3 Other indirect greenhouse gas emissions arising in the value chain.
Goods transport and business travel are the two areas that have the greatest impact on oem's emissions. Supply and delivery issues in 2022 have led to an increase in transportation of products by air. At the same time, more companies are engaging in activities to reduce the impact of freight operations. For example, switching
to sustainable, bio-based fuels for cargo ships. Business travel was on a very low level during the pandemic but has now increased. The results of the report are an important tool for the sustainability agenda and form a basis for further activities linked to the companies' sustainable development goals.
Sustainable transportation by sea
The area in which oem has the greatest environmental impact is the transportation of goods. Measures are being taken to reduce this impact. For example, oem Electronics AB purchases sustainable, bio-based fuels, produced from waste materials, via the GEODIS Sustainable Marine Fuel Insetting programme, for all of its sea freight. This has led to a reduction in carbon emissions and 100% reduction of sulphur emissions. More carbon is added to the carbon cycle every time fossil fuels are used. Sustainable fuels do not add more carbon to the carbon cycle. Combustion of sustainable fuels releases CO2 which is already a part of the natural carbon cycle, which results in a step towards net-zero emissions.
Activities that promote sustainability
• Choosing sustainable shipping fuel.

Effect: Reduced emissions.
• Greater focus on supplier assessments, including health and safety and sustainability aspects.
Effect: Decent working conditions and reduced environmental impact.
• Installation of solar panels.
Effect: Reduced electricity consumption and reduced emissions.
• Renewable electricity tariffs.
Effect: Reduced emissions.
• Focus on sustainability in product development.
Effect: Extend product life, minimise use of natural resources and reduce waste.
• Introduce and market partly recycled materials.
Effect: Minimise use of natural resources and reduce waste.
• Focus on energy-saving solutions in the sales process.
Effect: Reduced electricity consumption.
• Focus on equality when recruiting new employees.
Effect: More equal organisations.
• Inhouse training.
Effect: Increased knowledge and commitment.
• Sustainable sales materials.
Effect: Competitive advantage to offer sustainable solutions.
• Focus on sustainability in communications.
Effect: Competitive advantage to offer sustainable solutions.
Solar panels on all properties owned
All of oem's properties in Tranås now have solar panels and more are being installed elsewhere. The solar panels fitted to the properties in Tranås in 2022 cover over 50% of annual electricity requirements. The plans are to continue installing solar panels on other properties owned by oem in Sweden and abroad.
Eco labelling makes it easy for customers
Elektro Elco's eco label “A Hide-a-lite Choice” makes it easy for customers to make choices that are good for the environment. Products that carry this label meet criteria for replaceable LEDs and drivers, and that the product is made of recycled material, e.g. plastics from the oceans. LED lights help customers save energy. Replaceable parts extend the life of the product and use fewer materials. Recycling of worn products creates a circular flow of resources, a necessary step towards a more sustainable society.
Certified companies
choice
In Sweden, oem Automatic, oem Electronics, Svenska Batteripoolen, Internordic Bearings, Telfa, Ernst Hj Rydahl Bromsbandfabrik, Svenska Helag, Agolux, ATC Tape Converting, oem Motor and Elektro Elco have been awarded ISO 14001 environmental management system certification and ISO 9001 quality management system certification. In Poland, oem Automatic has been awarded ISO 9001 quality management system certification.
Sustainability report
oem's full Sustainability report is available for viewing at www.oem.se.
SCOPE 1
Business travel by car 1,285 tonnes of CO2 948 tonnes of CO2 Energy own premises 68 tonnes of CO2 28 tonnes of CO2 TOTAL 1,354 tonnes of CO2 976 tonnes of CO2 SCOPE 2 Energy own premises 148 tonnes of CO2 130 tonnes of CO2 TOTAL 148 tonnes of CO2 130 tonnes of CO2 SCOPE 3 Energy leased premises 162 tonnes of CO2 190 tonnes of CO2 Goods transport 3,112 tonnes of CO2 2,881 tonnes of CO2 Business travel 183 tonnes of CO2 35 tonnes of CO2 TOTAL 3,457 tonnes of CO2 3,106 tonnes of CO2
2022 2021
26 OEM 2021 SUSTAINABILITY AND QUALITY MANAGEMENT PROGRAMME
oem will ensure sustainable economic growth and decent working conditions for employees of oem and its suppliers.
• Minimum sales growth of 10% per annum through a business cycle. result 25%
• 100% of all employees shall have a performance appraisal during the year. result >95%
• The Employee Satisfaction Index shall be over 4.0 when the ESI survey is conducted.
result 4.1
• There will be an increased number of supplier assessments compared with 2021. result 476 (140)
• Assessments carried out will evaluate workplace health & safety and CSR. result 295
oem is committed to reducing environmental impacts by lowering its carbon emissions.
• oem will measure, set targets and reduce emissions based on the GHG Protocol. Reference point: Tonnes of CO2 / Turnover sek million. reference point : 1.0 (0.9)
result Scope 1: 1,354 tonnes of CO2 (976 tonnes of CO2)
Scope 2: 148 tonnes of CO2 (130 tonnes of CO2)
Scope 3: 3,457 tonnes of CO2 (3,106 tonnes of CO2)
• 100% renewable energy purchased through 2030.
result The companies are already purchasing a significant amount of renewable energy and make this a priority when entering into new agreements.


• Fossil fuel-free vehicle fleet by 2030.
result The transition to fossil fuel-free vehicles has begun, but the percentage of all-electric vehicles is low at present.
• Increase knowledge, awareness and commitment right across the organisation. result A wide range of activities aimed at increasing knowledge and commitment was implemented at company level in 2022.
oem shall have an inclusive work environment where everyone has equal opportunities based on their qualifications for the job, without regard to gender.
oem will apply its extensive knowledge of products and applications to help customers make sustainably-sound choices of components and solutions.
• oem shall increase the percentage of women as new hires with the aim of increasing the number of women in senior positions. result 21% (21%) of employees are women and 16% (18%) of managers are women.
• 100% of the supplier assessments performed shall evaluate the supplier's and products' most significant environmental aspects and the quality performance of products. result 50%.
• Communicate products that are good from a sustainability perspective more clearly in marketing communications and sales processes. result This is already a natural part of the sales process and marketing communications today.
Sustainable Development Goals 2022
OEM 2021 27
All of oem's properties in Tranås now have solar panels and more are being installed on oem properties in other locations. In 2022, they produced 364 MWh.
Five-year Group Summary 29 KPIs for the last five years 30 ANNUAL REPORT Directors' Report including the Corporate Governance Statement 31 Board of Directors 38 Senior Executives 39 Financial Statements of the Group Statement of Income 40 Statement of Comprehensive Income 41 Statement of Financial Position 42 Statement of Changes in Equity 44 Statement of Cash Flows 45 Financial Statements of the Parent Company Income Statement 46 Balance Sheet 47 Statement of Changes in Equity 49 Cash Flow Statement 50 Accounting Policies and Notes to the Financial Statements 51 Signatures 85 Auditor's Report 86 OTHER OEM shares 89 Definitions 92 Annual General Meeting 93 Real estate 94 Addresses 96
28 OEM 2022
ANNUAL REPORT 2022
Five-year Group summary
In the table above, IFRS 16 Leases is applied for 2019 - 2022. IAS 17 Leases is applied for the comparative figures for 2018.
Definitions can be found on page 92.
SEK million FROM THE STATEMENT OF INCOME 2022 2021 2020 2019 2018 Sweden 2,745 2,322 2,010 1,992 1,866 Overseas 1,986 1,452 1,273 1,306 1,246 Net sales 4,731 3,774 3,283 3,299 3,112 Operating income before depreciation and amortisation 824 648 483 444 376 Amortisation/depreciation -89 -69 -74 -73 -53 Profit/loss from financial items -11 -2 -8 -4 -6 Profit before tax 724 576 401 367 317 Tax -148 -119 -84 -78 -69 PROFIT/LOSS FOR THE YEAR 576 457 317 289 248 EBITA 763 590 422 385 343 FROM THE STATEMENT OF FINANCIAL POSITION 2022 2021 2020 2019 2018 Intangible fixed assets 344 177 187 195 193 Property, plant and equipment 356 344 324 342 260 Financial assets and deferred tax assets 8 7 9 4 3 Inventories 1,183 738 579 629 569 Current receivables 805 644 517 512 501 Cash and cash equivalents 109 145 376 42 38 TOTAL ASSETS 2,804 2,054 1,992 1,725 1,563 Equity 1,590 1,374 1,366 1,066 926 Non-current liabilities 229 139 145 144 135 Current liabilities 985 541 481 514 502 TOTAL EQUITY AND LIABILITIES 2,804 2,054 1,992 1,725 1,563
OEM 2022 29
KPIs for the last five years
In the table above, IFRS 16 Leases is applied for 2019 - 2022. IAS 17 Leases is applied for the comparative figures for 2018. Definitions can be found on page 92.
* The key performance indicators for 2018-2021 have been adjusted following the 3:1 share split and automatic redemption of every third share in Q2 2022. Earlier periods have been adjusted by a factor of 2, since the financial implication is a 2:1 split combined with an extraordinary dividend.
OEM GROUP 2022 2021 2020 2019 2018 Net sales SEK million 4,731 3,774 3,283 3,299 3,112 of which overseas % 42.0 38.5 38.8 40.0 40.0 Group's profit before tax SEK million 724 576 401 367 317 Consolidated profit for the year SEK million 576 457 317 289 248 EBITA SEK million 763 590 422 385 343 Return on total capital % 31.5 29.2 22.7 22.9 22.5 Return on capital employed % 45.1 41.1 31.9 33.3 33.0 Return on equity % 38.9 33.4 26.1 29 28.7 Debt/equity ratio times 0.24 0.07 0.08 0.16 0.16 Interest coverage ratio times 86.5 191.5 123.6 94.1 85.1 EBITA margin % 16.1 15.6 12.9 11.7 11.0 Operating margin % 15.5 15.3 12.4 11.3 10.4 Profit margin % 15.3 15.2 12.2 11.1 10.2 Capital turnover rate times/yr 1.69 1.84 1.65 1.91 1.99 Net sales/employee SEK million 4.9 4.3 3.7 3.7 3.5 Equity/assets ratio % 56.7 66.9 68.6 61.8 59.2 Operating cash flows SEK million 262 319 469 291 217 Quick ratio % 93 137 186 108 107 Average number of shares outstanding* thousands 138,645 138,645 138,645 138,645 138,645 Earnings per share* SEK 4.15 3.30 2.29 2.09 1.79 Average total number of shares* thousands 139,016 139,016 139,016 139,016 139,016 Earnings per share* SEK 4.14 3.29 2.28 2.08 1.79 Shareholders' equity per share* SEK 11.43 9.89 9.83 7.67 6.66 Proposed dividend* SEK 1.50 1.38 1.25 - 1.13 Quoted price as per 31 December* SEK 72.30 92.70 51.50 41.67 31.75 P/E ratio times 17.5 28.2 22.6 20.0 17.8 Direct return % 2.1 1.5 2.4 - 3.5 Average no. of employees No. 968 886 894 887 882 Salaries and remuneration SEK million 496 423 396 393 377
30 OEM 2022
The Board of Directors and the Managing Director of OEM International AB (publ.), CRN 556184-6691, with its headquarters in Tranås, Sweden, hereby present the Annual Report and the consolidated financial statements for the 2022 financial year. The Annual Report and the Consolidated Financial Statements, including the Auditor's Report, are given on pages 31-88. Figures for 2021 are given in brackets.
THE GROUP Business operations
OEM is a leading technology trading group operating in 15 selected markets in northern Europe, East Central Europe, the British Isles and China. Operations are conducted in subsidiaries in the Nordic countries, the UK, Ireland, Poland, the Czech Republic, Slovakia, the Netherlands, Hungary, Estonia, Latvia, Lithuania and China.
OEM is a value-adding link between its customers and leading manufacturers of products and systems for industrial applications. As one of Europe's leading technology trading groups, OEM brings value to its customers by offering an extensive range of products coupled with considerable technical product and applications expertise. With a strong marketing and sales organisation, OEM serves as the extended arm of the suppliers in each market and aims to make them a leading player in their niche. This makes OEM the best distribution channel for its suppliers in OEM's markets.
Its extensive range of industrial components comprises products in the areas of electrical components, flow technology, installation components, ball bearings and seals, motors, transmissions, brakes and appliance components. The range is constantly evolving with the addition of new products and the replacement or discontinuation of unprofitable products.
The clearly-defined product range that is marketed in each region and the added values created by the organisation form a distinct brand concept. The brand concepts are launched on new geographic markets as they grow in strength.
The Group is organised and primarily managed as three market regions;
• Sweden,
• Finland, the Baltic states and China,
• Denmark, Norway, the British Isles and East Central Europe.
The objective of this organisation is to consolidate OEM's long-term competitive edge and increase growth outside of Sweden.
OEM's Class B share is listed on NASDAQ Nordic Mid Cap in Stockholm.
Incoming orders, net sales and profit
During the year, incoming orders increased by 16% to SEK 4,832 million (4,177). At SEK 1,088 million, the order book was 17% up on the corresponding date of the previous year.
Net sales reached SEK 4,731 million (3,774), which is a 25% rise on the previous year. Currency movements and revenue from acquisitions boosted net sales by 6% and 7% respectively, resulting in organic growth of 12%. Sales reached new record levels in 2022, with all-time highs in turnover, incoming orders and earnings. The Swedish operations with the strongest growth included Svenska Batteripoolen, ATC Tape Converting and Agolux. The entities with the highest percentage sales growth in the year were the Finnish operations of OEM Automatic and OEM Electronics, and the operations in Denmark, Hungary, Poland and the acquired business in Ireland.
Operating profit before amortisation of acquisition-related intangible fixed assets (EBITA) increased 29% during the year to SEK 763 million (590). The increase is predominantly due to the growth in sales which improved the gross margin. The operating margin before amortisation of acquisition-related intangible fixed assets (EBITA margin) was 16.1% (15.6%).
Profit before tax was SEK 724 million (576) and profit after tax rose 26% to SEK 576 million (457).
The year's profit after tax corresponds to SEK 4.15 (3.30) per share outstanding.
Region Sweden
Sales are conducted under the names of OEM Automatic, OEM Electronics, OEM Motor, Internordic Bearings, Telfa, Elektro Elco, Nexa Trading, Svenska Batteripoolen, Agolux, Ernst Hj Rydahl Bromsbandfabrik and ATC Tape Converting.
Net sales rose 18% to SEK 2,745 million (2,325). Foreign exchange movements had a positive 7% impact on net sales, which means organic growth in the region was 11%. The operations reporting strongest growth are Svenska Batteripoolen, ATC Tape Converting and Agolux, with an increase in sales turnover of 28%, 23% and 22% respectively in the period. OEM Automatic, the Group's largest company, reported a 20% rise in sales turnover year-on-year.
Incoming orders increased by 11% to SEK 2,835 million (2,559). In 2022, incoming orders were 3% higher than net sales.
EBITA rose 27% to SEK 506 million (398). The increase in revenue is predominantly due to the growth in sales.
Region Finland, the Baltic states and China
Sales are conducted under the names of OEM Automatic, Akkupojat, Hide-a-lite, OEM Electronics, Motor/Bearings and Rauheat.
Net sales for the region increased in 2022 by 22% to SEK 969 million (791). Foreign exchange movements had a positive 5% impact on net sales, which means organic growth in the region was 17%. The operations reporting strongest growth are OEM Automatic and OEM Electronics, with an increase in sales turnover of 23% and 21% respectively, plus strong growth of 11% in the Baltic states.
Incoming orders for the region increased by 10% to SEK 963 million (874). Incoming orders were in line with net sales.
EBITA rose 16% to SEK 137 million (118), due primarily to increased sales.
Region Denmark, Norway, the British Isles and East Central Europe
Sales are conducted under the names of OEM Automatic, OEM Automatic Klitsø, OEM Electronics, Zoedale and Demesne.
Net sales rose in the full-year 2022 by 55% to SEK 1,017 million (655). Net sales were favourably impacted by acquisitions and foreign exchange movements by 38% and 5% respectively, which means organic growth in the region was 12%. The operations reporting strongest growth are OEM Automatic Klitsø in Denmark and Demesne Electrical in Ireland, with an increase in sales turnover of 24% and 22% respectively.
Incoming orders increased by 39% to SEK 1,034 million (744), 6% of which came from the above acquisition. In 2022, incoming orders were 2% higher than net sales.
During 2022, EBITA rose 111% to SEK 118 million (56), mainly due to an increase in net sales on a like-for-like basis, as well as an increase due to acquired sales.
Directors' Report
4,500 5,000 2,250 4,000 3,500 3,000 16 17 9 10 11 2,500 12 SEK million % 13 Net sales SEK million, EBITA margin %. 2021 2,750 14 3,250 15 2022 2019 2018 2020 OEM 2022 31
Profitability and financial position
Return on capital employed was 45.1% (41.1%). Return on equity was 38.9% (33.4%) which exceeds the Group's financial target of 20% through a business cycle. The Group's equity/assets ratio at year-end was 56.7% (66.9%). Shareholders' equity per share calculated on the aggregate number of shares was SEK 11.43 (9.89). Cash and cash equivalents, comprising cash and bank balances, amounted to SEK 109 million (145). The Group's cash and cash equivalents, together with committed undrawn credit facilities, amounted to SEK 474 million (549) at year-end.
office in Dublin. The company became part of Region Denmark, Norway, the British Isles and East Central Europe on 1 January 2022.
A Group-wide programme is in progress aimed at achieving a simpler, more distinct legal Group structure through mergers and voluntary liquidations.
Employees
At year-end, the headcount was 998 (898), an increase of 100 employees. The average number of employees during the year was 968, compared with 886 in the previous financial year. 21% (21%) of the employees are women. Absence due to illness stands, on average, at 8 days per person, which is 1 day more than last year. OEM encourages a healthy lifestyle through various forms of exercise and preventive healthcare. The average cost of training per employee is SEK 4,000 (2,000). Further information is provided in Note 5.
Risks and risk management
OEM's results, financial position and strategic position are affected by a number of internal factors over which OEM has control and a number of external factors where the opportunity to influence the chain of events is limited.
The most important risk factors include the economic situation in combination with structural changes, the competitive situation and the dependence on suppliers and customers. The main financial risks are currency risk in purchase transactions and translation risk in net investment in foreign operations. A description of the financial instruments, and how OEM manages financial risks, is presented in Note 24.
Economy
Cash flow
Operating cash flow was SEK 263 million (319). The year's cash flow was SEK -43 million (-233) after net investments of SEK -153 million (-54) and amortisation, new loans and paid dividends and redemption totalling SEK -153 million (-498). Investments
The Group's gross investment for the year, excluding acquisitions, was SEK 17.9 million (7.7) in machinery and equipment, SEK 0.7 million (43.2) in buildings and land, and SEK 2.8 million (2.8) in other intangible fixed assets comprising software.
Group changes
On 13 January 2022, all of the shares in Demesne Electrical Sales Ltd were acquired through the transfer of the entire shareholding in the parent company Balfe Securities Ltd. Demesne Electrical Sales is Ireland's leading independent importer and distributor of electrical control, switch-gear, energy-saving and installation products. It has 48 employees and an annual turnover of approximately SEK 250 million. The company has its head
OEM is affected by the general development of the economy, which is usually measured in terms of GDP growth. The Group operates in a wide range of sectors and geographic areas which lessens the impact of economic fluctuations in specific industries and geographic markets on its business.
Structural changes
OEM is affected by structural changes in the market, for example, customers want fewer suppliers, rapid developments in technology or competition from lower-cost countries.
OEM works actively to increase the value of its product offering, regardless of customer group. This has clearly contributed to the Group's performance and to the fact that it continues to be a priority supplier for many customers. By working alongside the customers, it is possible to capture trends and know when it is commercially justifiable to enter a new product area in order to keep abreast of advances in technology. OEM offers a high level of service and expert technical advice to offset the effects of competition from lower-cost countries. OEM also strives to establish close links with customers by becoming involved during planning and development stages when OEM's employees are able to help customers by providing expert input for different processes.
Dependence on suppliers and customers
Its dependence on individual suppliers is one of the key operational risks to which a single subsidiary can be exposed. In order to minimise this risk, the subsidiaries work close to their suppliers in order to create strong relationships on several levels. Furthermore, the majority of the suppliers are represented on several markets, which strengthens the relationships. The relationships are based on long-term, close collaborative partnerships. The Group has more than 400 suppliers in total. No supplier accounts for more than 4% of total Group sales. The expiration and addition of a number of supplier agreements each year is a normal part of the business.
OEM has a broad customer structure, with approximately 30,000 customers spread across several industrial segments and geographic markets. No customer accounts for more than 4% of total Group sales, which remains unchanged from last year.
Competitive situation
Restructuring and consolidations in the industrial trading sector are continuously changing the competitive situation. Economies of scale can lead
100 500 200 0 400 SEK million 300 Operating cash flow, SEK million. 2022 2019 2018 2020 2021 2021 200 550 500 450 400 250 SEK million 300 Profit after tax SEK million, Return on equity %. 2022 2019 2018 2020 350 10 15 20 25 30 % 35 5 40 32 OEM 2022
to a price squeeze, but OEM's strategy includes reaching market-leading positions with a portfolio of products and services where the price is not the decisive factor.
The impact of COVID-19 on the OEM Group
Covid-19 is no longer considered to pose a risk of impact on the OEM Group.
The impact of the war in Ukraine on the OEM Group
Russia's invasion of Ukraine continues to affect world trade and is creating uncertainty about economic developments. Since the Group's sales volumes to Ukraine, Belarus and Russia have been negligible, the direct impact of the situation on OEM is low. However, some of OEM's customers have customers of their own in the region in question, which has reduced demand to some degree. However, total OEM turnover is expected to be marginally affected.
Events after the close of the reporting period
There are no significant events to report after the close of the reporting period.
Expectations of future development
The most important tasks for the Group are to focus on growth and to continue improving the profitability of existing operations. Added to this are the sales and earnings resulting from successful acquisitions. The Group continues with the aim to increase its sales share outside of Sweden.
OEM's objective is to achieve a good return on shareholders' equity with limited financial risks, supported by stable growth.
The targets for one business cycle are (set in February 2023):
• at least 10 % annual sales growth,
• a minimum EBITA margin of 12 %,
• at least 25% return on equity,
• debt/equity ratio below 100%.
OEM is well placed for further expansion with its strong market position, financial performance and organisation. However, amid the current global state of affairs, there is general uncertainty about economic developments. The Group has not issued a forecast for 2023.
Research and development
OEM conducts research and development activities of its own on a limited scale. Development is mainly conducted by the suppliers themselves using market demand data provided by the companies.
Environmental impact
In 2022, OEM had a Swedish subsidiary whose operations require licensing or registration under the Swedish Environmental Code. The operations requiring registration represent an insignificant portion of the company's total operations. None of the Group's companies are involved in any environment-related disputes. OEM's focus on trade means that the greatest environmental impact comes from transportation, environmentally harmful substances, printed materials, packaging materials and heating. OEM takes a structured approach in all of these areas to find the best environmental solutions and support development initiatives in these areas.
The OEM Group's environmental policy dictates continuous efforts to minimise its external environmental impact in the short term and long term.
Sustainability report
In compliance with Chapter 6, Section 11 of the Swedish Annual Accounts Act (ÅRL), the company has decided to publish its sustainability report, which is required by law, separately from its Annual Report. The sustainability report is available for viewing at www.oem.se.
PARENT COMPANY
The Parent Company is to be an active owner and develop the subsidiaries. In addition to clear management-by-objectives, this means contributing expertise and resources in the fields of IT, financial control, HR admin-
istration, market communication, and quality and environmental control.
The Parent Company's net sales were SEK 91 million (83). Net sales relate entirely to services to subsidiary companies. Profit before year-end appropriations and tax amounted to SEK 153 million (106).
With regard to non-financial information, the Group's information also includes the Parent Company, where applicable. The financial position of the Parent Company is dependent on the financial position and growth of the subsidiaries. The Parent Company is therefore indirectly affected by the risks that are described in the section Risks and Risk Management
Guidelines for remuneration of senior executives
The policies for remuneration of senior executives adopted at the 2022 Annual General Meeting are presented in Note 5.
The remuneration of the Chairman and Members of the Board of Directors is paid in accordance with the resolution of the Annual General Meeting. The chairperson of the Audit Committee will receive remuneration of SEK 60,000. No other special fees are paid for work on committees.
The Board proposes that the 2023 Annual General Meeting adopts the following guidelines for remuneration of senior executives within the OEM Group. The guidelines cover remuneration of the Managing Director, Group management and other managers who report directly to the Managing Director.
OEM's vision is that the company shall be a leading technology trading group in industrial components and systems in selected markets in Northern, Central and East Central Europe. To realise this vision, the company has defined five strategic areas; growth, product range, marketing activities, logistics, and employees and leaders. These are important to the company's future development and success and to the achievement of its financial targets. It is important that OEM has senior executives with a focus on business acumen, a strong commitment to the company, and a sustainable leadership that promotes the long-term interests of the company. The level of remuneration of senior executives shall enable the company to retain qualified leaders within the organisation in the long term and also ensure it is able to recruit qualified leaders both externally and internally.
Market-competitive salaries and other remuneration terms shall apply for senior executives. Share-based compensation, so-called incentive schemes, shall be presented for approval at the Annual General Meeting.
Variable remuneration may be provided, capped at the equivalent of eight monthly salaries. The variable remuneration shall be linked to the company's financial targets and based on performance during a calendar year.
Senior executives shall have premium-based pension schemes, capped at 30% of fixed pay.
The maximum period of notice given by the company shall be 24 months and shall also include the obligation to work during the period of notice. Employment agreements shall not contain provisions for severance pay.
The Board of Directors may waive these guidelines in individual instances should there be special reasons for doing so. Any deviation from the guidelines by the Board of Directors shall be reported in the remuneration report for the next Annual General Meeting.
Shares
OEM shares
The share capital of the company consists of 139,015,854 shares divided among 28,462,176 Class A shares and 110,553,678 Class B shares. One Class A share entitles its holder to ten voting rights and one Class B share to one voting right. The face value per share is SEK 0.28.
Repurchase of treasury shares
With the objective to improve the Group's return on shareholder's equity and earnings per share, the Board of Directors obtains shareholder approval at the Annual General Meeting to grant OEM International AB the authority to repurchase its own shares. The share repurchase mandate approved at the Annual General Meeting is for up to 10% of the number of shares, which is 13,901,585 shares.
In 2011, the company repurchased 185,541 shares at an average price of SEK 17.75. No shares have been repurchased in the period 20122022. The company had a total holding of 371,082 shares on 31 December 2022. The holding corresponds to 0.3% of the total number of shares.
OEM 2022 33
The 2022 Annual General Meeting will propose that shareholders resolve to renew the mandate for the repurchase of up to 10% of the number of shares.
Share split and redemption procedure
Given OEM International's strong financial position and as a step in the process of changing the company's capital structure, a 3:1 share split combined with an automatic redemption procedure was carried out in 2022. This process gave each shareholder two new shares and one redemption share, which was redeemed for SEK 3.25 per share. This amounts to a transfer of SEK 226 million to the shareholders.
Key indicators are adjusted by a factor of 2, since the financial implication of the transaction is a 2:1 split combined with an extraordinary dividend.
Incentive programme
At the Annual General Meeting on 26 April 2022, shareholders approved the proposal to issue 160,000 call options that entitle holders to purchase one bought-back Class B share in the period 1 March 2025 through 15 June 2025. In total, 152,500 call options were subscribed for, 51,000 of which are held by the Group's senior executives. The exercise price of a subscribed for option is SEK 86.60. Further information is provided in Note 26.
Other information
The Board of Directors is appointed by the Annual General Meeting. The Articles of Association contain a preemption clause which states that if Class A shares are transferred from one shareholder to another shareholder in the company, or to someone not previously a shareholder in the company, the shares shall be offered immediately to the other holders of Class A shares for redemption through a written application to the company's Board of Directors. The Articles of Association also include a conversion provision enabling holders of Class A shares to convert all or part of their holding of Class A shares into Class B shares. If the company decides to issue new shares of Class A and B, through cash issue or set-off, owners of Class A and B shares shall have preferential rights to subscribe for new shares of the same type.
Proposed dividends
The Board of Directors is proposing a dividend payment of SEK 1.50 (1.38) per share, which represents a payout of SEK 208 million. The complete proposal for profit allocation is presented in Note 31.
CORPORATE GOVERNANCE STATEMENT
Introduction
OEM International AB (the company) applies the Swedish Code of Corporate Governance (the Code) in accordance with the NASDAQ Stockholm's rules for issuers. The Code is aimed at creating good prerequisites for an active and conscientious owner role and constitutes an element in the self-regulation of Swedish enterprise. It is based on the "comply or explain" rule, which means that non-compliance with a term of the Code is not a breach provided there is an acceptable reason that can be explained. OEM International has noted a non-conformance with the rules of the Code concerning the Nomination Committee. The non-conformance is explained in detail under the heading Nomination Committee.
Division of responsibilities
The purpose of corporate governance is to create a clear division of roles and responsibilities between the owners, the Board of Directors and the executive management. Corporate governance in OEM is based on the Swedish Companies Act and other legislation and regulations, the rules applicable to companies listed on the stock exchange, the Articles of Association of the company, the internal governing instruments of the Board of Directors, the Swedish Code of Corporate Governance and other internal guidelines and regulations.
Shareholders
OEM International AB is a public company and was listed on the Stockholm Stock Exchange in December 1983. OEM International AB had 6,609
shareholders at the end of 2022. The ten largest shareholders controlled 69% of the share capital and 89% of the voting rights at year-end. The following shareholders had, directly or indirectly, shareholdings representing at least one-tenth of the number of voting rights for all shares in the company: Orvaus AB 27.7%, Siv Franzén 21.3% and Agne Svenberg 18.3%.
Articles of Association
The Articles of Association stipulate that OEM International AB is a public company whose business is to "engage in sales of automatic components and carry on any and all activities compatible therewith".
The share capital amounts to SEK 38,615,515 and the number of shares to 139,015,854 divided into 28,462,176 Class A shares which carry 10 voting rights, and 110,553,678 Class B shares which carry one voting right each.
The company's Board of Directors is to consist of not less than four and not more than seven members. The company shall have at least one auditor appointed by the Annual General Meeting and a deputy auditor if the elected auditor is not an auditing firm.
Notice of annual general meetings and extraordinary general meetings convened for the purpose of amending Articles of Association must be issued between six and four weeks before the meeting and resolutions must be supported by shareholders with at least two-thirds of both the voting rights and the shares represented at the meeting. Notice of an extraordinary general meeting convened for other purposes shall be issued no later than three weeks prior to the meeting. Notice of an annual general meeting shall be published in the "Post- och Inrikes Tidningar" newspaper and on the company's website. It must be announced in Svenska Dagbladet that notice has been issued.
No limitation to the number of voting rights for represented shares applies to voting at the general meeting.
There is a pre-emptive clause regarding the A Class shares and a priority clause in connection with a cash or set-off issue. The current Articles of Association were adopted at the 2022 Annual General Meeting and can be viewed on the company's website, www.oem.se (see under For Investors/ Corporate Governance/Articles of Association).
Annual General Meeting
The Annual General Meeting is the highest decision-making body in OEM International AB where the shareholders exercise their voting rights. The Annual General Meeting passes resolutions concerning the adoption of the Statement of Income for the Group, the Statement of Comprehensive Income for the Group, the Statement of Financial Position for the Group and the Income Statement and Balance Sheet for the Parent Company, distribution of dividends, election of Board of Directors and, where applicable, election of auditors, remuneration of Board Members and other senior executives, remuneration of auditors and other business in accordance with the Swedish Companies Act and the Articles of Association of the Company. The Annual General Meeting is to be held in the municipality of Tranås within six months of the end of the financial year. All shareholders entered in the share register prior to the meeting who have registered their participation are entitled to participate and vote for their total shareholding.
In order to be able to exercise their voting rights at the Annual General Meeting, shareholders who have registered their shares in the name of an authorised agent must temporarily re-register their shares in their own name in accordance with what follows from the notice to the Annual General Meeting. Shareholders can be represented by agents. Minutes of the Annual General Meeting are available for viewing on the company's website, www.oem.se (see under For Investors/Corporate Governance/ Annual General Meeting).
Shareholders who represented 66.4% of the total number of shares and 88.2% of the voting rights attended the 2022 Annual General Meeting held on 26 April 2022. Petter Stillström was appointed to chair the Annual General Meeting. The annual report and the Auditor's Report were presented at the Meeting. In connection therewith, the Chairman of the Board Petter Stillström submitted information about the work of the Board. Petter Stillström, member of the Audit Committee, reported on the work of the Audit Committee and its cooperation with the auditors. The auditor submitted the Auditors' Report and an oral account of the work during the year. The company's Managing Director and Chief Executive Officer, Jörgen Zahlin, presented comments on the Group's operations, the 2021 financial year
34 OEM 2022
and developments during the first quarter of 2022.
The 2022 Annual General Meeting decided:
• to approve a dividend of SEK 2.75 per share.
• to elect Petter Stillström, Ulf Barkman, Mattias Franzén, Richard Pantzar, Jörgen Rosengren, Per Svenberg and Åsa Söderström Winberg as members of the Board of Directors
• to elect Petter Stillström as Chairman of the Board
• to adopt the proposal of the Nomination Committee that the Nomination Committee should be made up of representatives of not less than three and no more than four of the largest shareholders and that the Chairman of the Board should act as Chairman of the Nomination Committee
• to adopt the proposal of the Board of Directors that remuneration received by senior executives from OEM International AB is mainly comprised of fixed and variable components. The remuneration shall be market-competitive and the variable amount shall be capped at eight monthly salaries. The company's management shall have market-competitive, premium-based pension schemes, capped at 30% of fixed remuneration.
• to implement an automatic redemption procedure to split each share into three shares (a 3:1 share split), one of which will be a redemption share. Each redemption share is automatically redeemed for SEK 3.25. The automatic redemption procedure included the following decisions:
a) Amend the Articles of Association that relate to limits on the number of shares.
b) Implementation of a share split
c) Reduction of the share capital through redemption of shares
d) Increase of the share capital through a bonus issue
• to be allowed to issue up to 10,800,000 new Class B shares in connection with business combinations, in line with the proposal of the Board of Directors.
• to adopt the proposal of the Board of Directors to repurchase a maximum of 10% of the company's shares.
• to issue call options for bought-back shares and transfer bought-back shares to senior executives, in line with the proposal of the Board of Directors.
The 2023 Annual General Meeting will be held on 18 April 2023 in Tranås.
Nomination Committee
At the Annual General Meeting held on 26 April 2022, it was decided that the Nomination Committee shall comprise one representative from each one of no less than three and no more than four of the company's largest shareholders and the Chairman of the Board, unless he/she is a member as a shareholder representative. If a shareholder does not exercise his/her right to appoint a member, the next largest shareholder in terms of voting rights is entitled to appoint a member in the Nomination Committee. The names of the members and the names of the shareholders they represent shall be published at least six months before the 2023 Annual General Meeting and shall be based on the known number of votes immediately before publication. The term of office of the Nomination Committee shall run until a new Nomination Committee is appointed. The Chairman of the Nomination Committee shall be the Chairman of the Board.
Should there be any significant changes in the company's ownership structure after the appointment of the Nomination Committee, the composition of the Nomination Committee shall also be changed in line with the principles above. Shareholders who appointed a representative to be a member of the Nomination Committee shall be entitled to dismiss such a member and appoint a new one and also appoint a new representative if the member appointed by the shareholder chooses to withdraw from the Nomination Committee. Changes to the composition of the Nomination Committee shall be published as soon as such changes are made. The composition of the Nomination Committee was published on 7 October 2022. The composition of the Nomination Committee is available for viewing on OEM's website, www.oem.se, under For Investors/Corporate Governance/Nomination Committee. The Nomination Committee shall prepare proposals for the following items of business to be presented for resolution at the 2023 Annual General Meeting:
• proposal for a Chairman for the Meeting
• proposal for members of the Board of Directors
• proposal for Chairman of the Board of Directors
• proposal for remuneration of the Board of Directors
• proposal for remuneration for any committee work
• proposal for auditors
• proposal for auditors' fees
• proposal for a resolution regarding the Nomination Committee
The Nomination Committee shall discharge its duties as required by the Swedish Code of Corporate Governance and may, if necessary, take independent professional advice at the company's expense in the furtherance of its work.
The Nomination Committee for the 2023 Annual General Meeting is composed of:
• Petter Stillström (AB Traction), Chair
• Richard Pantzar (Orvaus AB)
• Mattias Franzén (Siv Franzén)
• Agne Svenberg
Ongoing dialogue is conducted within the Nomination Committee which held a minuted meeting where it acquainted itself with the assessment of the work of the Board of Directors during the past year and it discussed the composition of the Board of Directors.
The Nomination Committee's proposals to the Annual General Meeting will be presented in the notice of the Annual General Meeting and on the company's website.
The composition of the Nomination Committee above deviates from the regulations of the Code, which stipulate that the majority are members of the Board, that not more than one of the Board Members on the Committee may be dependent on large shareholders and that a Board Member should not be a Chairman of the Nomination Committee. It is deemed that it is reasonable for a company of this size to have a Nomination Committee that is represented by the largest shareholders and that these also serve as Board Members.
BOARD OF DIRECTORS Composition of the Board of Directors
The Articles of Association require that the Board of Directors shall comprise not less than four and not more than seven members elected by the Annual General Meeting for the period until the end of the next Annual General Meeting. Since the 2022 Annual General Meeting, the Board has consisted of the following members, all of them elected by the Annual General Meeting: Petter Stillström (Chair), Ulf Barkman, Mattias Franzén, Richard Pantzar, Jörgen Rosengren, Per Svenberg and Åsa Söderström Winberg. All Board Members are independent with regard to the company and the company's management. Board members Ulf Barkman, Jörgen Rosengren and Åsa Söderström Winberg are independent from the company and the company's management, and also from the company's major shareholders. Additional information about the members of the Board elected by the General Meeting is given in the section about the Board of Directors on page 38 in this Annual Report and on the company's website, under For Investors/Corporate Governance/Board of Directors.
The Nomination Committee takes age, gender, education, professional background and other aspects of diversity into consideration when nominating candidates to fill Board vacancies. The composition of the Board should be appropriate for the company's business operations, stage of development and conditions in general, characterised by diversity and a breadth of skills, experience and backgrounds among its members. The above provides the Nomination Committee with a good basis on which to appraise whether the composition of the Board is satisfactory and whether the requirement for skills, breadth and experience has been met.
OEM 2022 35
Chairman of the Board
It is the duty of the Chairman of the Board, Petter Stillström, who was re-elected as Chair at the 2022 Annual General Meeting, to ensure that the work of the Board is conducted efficiently and that the Board discharges its duties as required by the Swedish Companies Act, other legislation and regulations, rules applicable to companies listed on the stock exchange (including the Code) and the Board’s internal governing instruments. It is the Chairman’s task to ensure that the Board continuously updates and deepens its knowledge about the company and receives satisfactory data and decision-making information for its work, to establish the agenda for the meetings of the Board in consultation with the Managing Director, to verify that the decisions of the Board are implemented and ensure that the work of the Board is assessed annually. The Chairman of the Board represents the company in ownership issues.
Duties of the Board
Each year, the Board establishes written rules of procedure that regulate the Board’s work and its mutual division of responsibilities, including its committees, the decision-making procedure in the Board, the Board’s meeting procedure and the Chairman’s duties. The Board has also issued an instruction for the Managing Director, which regulates his duties and reporting obligation to the Board of Directors. As necessary, the Board also reviews and approves policies concerning the Group, such as the treasury policy. The Board monitors the work of the Managing Director by regularly reviewing operations during the year. It is responsible for purposefully structuring the organisation, and the procedures and guidelines for the management of the company's business. It is also responsible for ensuring that there is a satisfactory system of internal control. The Board is also responsible for the development and follow-up of the company's strategies, decisions concerning acquisition and sale of operations, major investments, appointments and remuneration of the Managing Director and other senior executives as stated in the guidelines adopted by the Annual General Meeting. The Board of Directors and the Managing Director present the annual report to the Annual General Meeting.
Work of the Board
In accordance with the adopted rules of procedure, the Board of Directors holds at least six ordinary meetings per year plus an inaugural meeting after the Annual General Meeting and whenever necessitated by the situation.
During 2022, the Board had a total of 9 meetings, including the inaugural meeting.
The Board members have attended all Board meetings with the exception of Åsa Söderström Winberg, who was absent on one occasion. When unable to attend, the member presented opinions and views on the items of business to the Chairman of the Board prior to the meeting. All resolutions have been passed unanimously by the Board of Directors.
The secretary of the Board is the company's CFO. Other company employees take part in the meetings of the Board in connection with the presentation of specific issues or when otherwise deemed appropriate.
The work of the Board during the year has covered a range of matters, including issues concerning the strategic development of the Group, operating activities, trends in earnings and profits, business combinations, purchase of properties, organisation, the Group's financial position and funding of the Group's capital structure.
The work of the Board is subject to an annual assessment. This is done by each Board member rating a number of relevant issues with the opportunity to provide comments. The results are compiled and presented to the Nomination Committee.
Remuneration of the Board
The remuneration of the members of the Board elected by the Annual General Meeting is decided by the Meeting in accordance with the proposal of the Nomination Committee. The 2022 Annual General Meeting approved the proposal that fees of SEK 500,000 be paid to the Chairman of the Board and SEK 250,000 to each of the Board members elected at the Meeting, for the period until the 2023 Annual General Meeting. The total remuneration of Board members, in accordance with the approval of the Annual General Meeting, is thus SEK 2,000,000. The chairperson of
the Audit Committee will receive remuneration of SEK 60,000. No additional remuneration has been paid to any Board Member.
Remuneration Committee
The Board has appointed a Remuneration Committee, which consists of the Chair, Petter Stillström, and the Board member Ulf Barkman. The Remuneration Committee prepares "the Board's proposals for policies for senior executives' remuneration" and the application of these. The proposal is discussed by the Board and is subsequently presented to the Annual General Meeting for adoption. Based on the resolution of the Annual General Meeting, the Board decides on the remuneration of the Managing Director. Based on the proposal of the Managing Director, the Remuneration Committee passes a resolution on the remuneration of other members of the Group management. The Board is informed of the decisions of the Remuneration Committee. Salaries and other terms of appointment for Group management shall be set at competitive levels. In addition to base salary, Group management may also receive variable remuneration, which is capped at 8 monthly salaries (8 monthly salaries). Senior executives in the OEM Group shall have market-competitive, premium-based pension schemes, capped at 30% of fixed remuneration. The pension scheme level is the same as for 2021. All share-related incentive schemes are to be decided by the Annual General Meeting. The maximum term of notice is 24 months and shall also include the obligation to work during the term of notice.
The Remuneration Committee met once in the year to review and approve the above policy proposals.
Guidelines for the remuneration of senior executives will be proposed for approval and adoption at the 2023 Annual General Meeting and are presented on page 33 of this report.
Audit Committee
During the year, the Board has had a special Audit Committee consisting of Chairman Ulf Barkman and Petter Stillström.
The Audit Committee shall, without it otherwise affecting the Board's responsibilities and duties, oversee the company's financial reporting and the efficiency of the company's internal control activities and risk management relating to the financial reporting, keep itself informed about the audit of the Annual Report and consolidated financial statements, examine and monitor the objectivity and independence of the auditor and specifically pre-approve any services that the auditor provides the company with other than audit-related services. The Audit Committee evaluates the audit work that has been carried out and informs the company's Nomination Committee of the results of the evaluation and assists the Nomination Committee in preparing proposals for auditors and remuneration of the auditors' work.
The Audit Committee has convened on four occasions and has met with an external auditor on three of them. The Board and the Audit Committee have held a review meeting with and received a report from the company's external auditor in connection with the Board meeting in February 2023 at which the Board approved the annual financial statements.
Managing Director and Group Executive Team
The Managing Director, Jörgen Zahlin, manages the operations in accordance with the Swedish Companies Act, other acts and regulations, the rules applicable to companies listed on the stock exchange, the Articles of Association of the Company, the internal governing instruments of the Board of Directors and the goals and strategies set by the Board.
The Managing Director prepares the necessary information and basis for decisions prior to the Board meetings, in consultation with the Chairman of the Board, presents the items and justifies proposals for resolutions. The Managing Director leads the work of the Group's executive team and makes decisions in consultation with the members of the executive team.
In 2022, the members were Jörgen Zahlin, Andreas Andersson, Johan Broman, Fredrik Falkenström, Jens Kjellsson, Urban Malm, Björn Pettersson, Carl Reuthammar and Marko Salovaara. The Group management holds regular business reviews under the leadership of the Managing Director. The Managing Director and members of Group management are presented on page 39 of this Annual Report and on the company's website (under About OEM/Senior Executives).
36 OEM 2022
Auditors
As required by the Articles of Association, the company must have at least one auditor appointed by the Annual General Meeting and, if the auditor is not an auditing firm, it must also have a deputy auditor. The company's auditors work according to an audit plan and report their observations to company management teams, the Group's executive team, the Audit Committee and the Board of Directors both during the course of the audit and in connection with the adoption of the annual financial statements. Internal procedures and control systems are reviewed as appropriate. A final review of the annual financial statements and the Annual Report is carried out in January and February. A review is conducted in the interim report for the third quarter. An account of the remuneration of the auditors, including the fees for consulting services, is presented in Note 6. The auditors are required to continually assess their independence before deciding whether to undertake an engagement to provide consulting services.
An account of the audit is reported to the shareholders in the form of an auditor’s report and other opinions, which constitute a recommendation to the shareholders on various items of business for resolution at the annual general meeting. The Auditor's Report contains proposals for adoption of the Income Statement and Balance Sheet for the Parent Company and the Statement of Comprehensive Income and the Statement of Financial Position for the Group, the appropriation of the company's profit and the discharge of the members of the Board and the Managing Director from liability.
The audit work includes such activities as an examination of compliance with the Articles of Association, the Swedish Companies Act and Annual Accounts Act, the International Financial Reporting Standards (IFRS), issues related to measurement of items recognised in the Statement of Financial Position/Balance Sheet for the Group/the Parent Company.
The company's auditors meet with the Audit Committee three times a year and once a year with the Board. The company's auditors also attend the Annual General Meeting to explain and give opinions on the audit work.
At the 2022 Annual General Meeting, Öhrlings PricewaterhouseCoopers AB was appointed as the company's auditor until the conclusion of the 2023 Annual General Meeting. Frida Wengbrand was appointed as the principal auditor. Öhrlings PricewaterhouseCoopers AB performs the audit of OEM International AB and most of the subsidiaries.
Internal control and risk management regarding financial reporting for the financial year 2022
As required by the Swedish Annual Accounts Act, the Board of Directors must annually submit a presentation of the most important elements of the company's system for internal control and risk management with regard to its financial reporting. Pursuant to the Swedish Companies Act, the Board of Directors is responsible for internal control. This responsibility includes an annual assessment of the financial reporting submitted to the Board and placement of requirements to its contents and presentation in order to ensure the quality of the reporting. This requirement means that the financial reporting must be fit for its purpose and appropriate and apply the applicable accounting rules, acts and regulations and any other requirements placed on listed companies.
The Board of Directors is responsible for ensuring that there is an adequate system for internal control, which covers all essential risks of errors in financial reporting. OEM's system for internal control comprises the control environment, risk assessment, control activities, information, communication and follow-up.
Control environment
OEM builds and organises its operations on decentralised profit and budget responsibilities. The basis for internal control in a decentralised organisation is a firmly-established process, aimed at defining goals and strategies for each organisation. Defined decision-making channels, powers and responsibilities are communicated through internal instructions and through guidelines and policies adopted by the Board of Directors. These documents set out the division of responsibilities and duties between the Board of Directors and the Managing Director and within the operational activities. They also include a financial policy, accounting manual for economic and financial reporting and instructions for each closing
of the books. A Group-wide reporting system is used for the Group's year-end procedures.
Risk assessment
OEM has established procedures for handling risks that are deemed by the Board and the company's management to be essential for the internal control regarding financial reporting. The Group's exposure to a number of different market and customer segments and the division of its operations into some 30 companies ensures a significant spread of risk. The risk assessment is carried out based on the Group's Statement of Financial Position and Statement of Comprehensive Income in order to identify the risk for significant errors. The greatest risks for the OEM Group as a whole are related to inventories and trade receivables.
Control activities
OEM has established a number of control activities based on risk assessments that have been carried out. The activities are both preventive and ascertaining and include transaction-related checks, such as rules regarding authorisations and investments, and clear payment procedures, as well as analytical checks performed by the Group's controller organisation and central financial function. There are also various control activities related to the management of the purchase, logistics and sales processes. Controllers and financial managers on all levels in the Group have a key role with regard to integrity, competence and ability to create the environment that is required to achieve transparent and fair financial reporting. An important overall control activity is the monthly performance follow-up, which is carried out via the internal reporting system and which the Board of Directors analyses and comments on as part of its internal work. This involves comparing performance against set targets and previous results and reviewing a number of key ratios. Each company in the Group has an active Board where the majority of the companies have someone from the Group's management team as chairperson. The Group management makes regular visits to the subsidiaries that are subject to financial follow-up.
Information, communication and follow-up
The internal information and external communications are regulated at an overall level.
Relevant steering documents and instructions are available on the Group's intranet.
The Board of Directors receives comments from the Managing Director concerning the state of the business and the development of the operations on a monthly basis. The Board of Directors also deals with all quarterly financial statements, as well as the annual report prior to their publication.
The financial situation is discussed at each Board meeting. The members of the Board then have an opportunity to pose questions to the company's management.
The company's auditors attend Audit Committee meetings three times a year and Board meetings once a year and present their observations. The members of the Board then have an opportunity to pose questions. Every year, the Board takes a position on significant risk areas and assesses the internal control.
Furthermore, OEM's management continuously assesses the internal control regarding financial reporting, above all, through own analysis, by asking questions and taking part in the work of the control function.
Internal audit
The company and the Group have a relatively simple legal and operating structure and working steering and internal control systems. The Board continuously follows up the different Group companies' assessments of internal control, among other things, through contacts with the company's auditors. The Board has therefore decided not to have a separate internal audit.
OEM 2022 37
Board of Directors
Åsa Söderström Winberg
Born in 1972.
Board Chairman since 2017 and Board member since 2010. Master of Economics.
Not employed by OEM.
CEO and major shareholder in AB Traction.
Other appointments: Chairman of the Board in Nilörngruppen AB and Softronic AB.

Board member of BE Group AB, Hifab Group AB and AB Traction incl. group companies.
Independence: Independent of the company and the company's management, but not independent of the company's major shareholders.
Number of shares: 3,816,000 OEM Class A and 639,292 OEM Class B (via AB Traction.)
Born in 1968.
Board member since 2019.
M.Sc. Engineering.
Not employed by OEM.
Other appointments: CEO of I&B Medical AB.
Chairman of the Board of MAZE Holding i Tranås AB and Padel Tranås AB.
Board member of Elektro Elco AB and IB Medical AB.
Independence: Independent of the company and the company's management, but not independent of the company's major shareholders.
Number of shares: 546,996 OEM Class B (incl. related party)
Born in: 1967.
Board member since 2017. M.Sc. Engineering.
Not employed by OEM.
Other appointments: Managing Director of Gränges.
Independence: Independent of the company and the company's management, and also independent of the company's major shareholders.
Number of shares: 9,000 OEM Class B
Born in 1957.
Board member since 2015.
MBA.
Not employed by OEM.
Board member of Skanska AB, Delete OY and FIBO AS.
Member of IVA, The Royal Swedish Academy of Engineering Sciences.
Independence: Independent of the company and the company's management, and also independent of the company's major shareholders.
Number of shares: 11,000 OEM Class B (incl. related party)
Born in: 1957.
Board member since 1997. MBA.
Not employed by OEM.
Independence: Independent of the company and the company's management, and also independent of the company's major shareholders.
Number of shares: 252,000 OEM Class B
Born in 1983.
Board member since 2019.
Masters degree in Business Administration (MBA).
Not employed by OEM.
CEO of Orvaus AB, Board member of Orvaus AB, Centrumfastigheter i Norrtälje AB and founder and board member of Vinterfors Invest AB.


Independence: Independent of the company and the company's management, but not independent of the company's major shareholders.
Number of shares: 9,763,920 OEM Class A and 11,693,286 OEM Class B (via Orvaus AB)
Born in 1969.
Board member since 2021.
Masters degree in Business Administration (MBA).
Not employed by OEM.
Other appointments: Owner and board member of Personality Gym AB.
Board member of ISP Innovative Sports Products AB.
Owner and board member of Dozer IT & kommunikation AB.
Independence: Independent of the company and the company's management, but not independent of the company's major shareholders.
Number of shares: 643,000 OEM Class B (incl. related party).
Shareholdings in OEM International AB are stated as they stand on 31 December 2022 and include any related party holdings of atural persons or legal entities.
Petter Stillström
Ulf Barkman
Richard Pantzar
Mattias Franzén
Jörgen Rosengren
Per Svenberg
38 OEM 2022
Senior executives
Born in 1964. Engineer.
Managing Director of OEM International AB since 1 March 2000.
Managing Director and CEO since 1 January 2002.
Group employee since 1985.
Other appointments: Chairman of the Board in BE Group AB.
Number of shares: 238,992 OEM Class B
Number of call options: 6,000
Born in 1977.
Business Director.
Group employee since 1997.
Number of shares: 9,236 OEM Class B (incl. related party)
Number of call options: 6,000
Born in 1962.
Managing Director of OEM Electronics AB.
Group employee since 1983.
Number of shares: 14,400 OEM Class B (incl. related party)
Number of call options: 6,000
Born in 1976.
Managing Director of OEM Finland Oy.


Group employee since 2002.
Number of shares: 100 OEM Class B
Number of call options: 6,000
Born in 1976.
Finance Director.
Group employee since 2006.
Number of shares: 17,080 OEM Class B (incl. related party)
Number of call options: 6,000
Born in 1968.
Managing Director of OEM Automatic AB.
Group employee since 1990.
Number of shares: 71,551 OEM Class B (incl. related party)
Number of call options: 6,000
Born in 1977.
Managing Director of Elektro Elco AB.
Group employee since 2018.
Number of shares: 0
Number of call options: 6,000
Shareholdings in OEM International AB are stated as they stand on 31 December 2022 and include any related party holdings of natural persons or legal entities.
Johan Broman
Jörgen Zahlin
Andreas Andersson
Jens Kjellsson
Urban Malm
Carl Reuthammar
Marko Salovaara
OEM 2022 39
Consolidated Statement of Income
* No effects of dilution present.
** Comparative figures for 2021 have been adjusted following the 3:1 share split and automatic redemption of every third share during the second quarter of 2022. Figures for earlier periods have been adjusted by a factor of 2, since the financial implication is a 2:1 split combined with an extraordinary dividend.
SEK million Note 2022 2021 Operating income Net sales 2 4,731.1 3,773.8 Other operating income 3 2.3 4.1 Operating costs Commodities -3,021.3 -2,406.1 Staff costs 5 -701.5 -594.1 Other expenses 6 -187.0 -130.4 Depreciation/amortisation of property, plant and equipment and intangible fixed assets 7 -88.6 -69.0 Operating profit 735.1 578.4 Finance income and expense Finance income 9 5.0 0.5 Finance expense 10 -16.0 -3.0 Profit before tax 724.1 575.9 Income tax 11 -148.4 -118.9 PROFIT/LOSS FOR THE YEAR 575.7 457.0 Profit for the year attributable to: Parent Company shareholders 575.7 457.0 Non-controlling interests -Earnings per share, SEK * ** 30 4.15 3.30 Average number of outstanding shares ** 138,644,772 138,644,772
40 OEM 2022
Consolidated statement of comprehensive income
SEK million Note 2022 2021 Profit/loss for the year 575.7 457.0 Other comprehensive income Items that have been or can be recycled to the income statement for the year Exchange differences on translation of foreign operations for the year 56.1 12.2 Items that have not been or cannot be recycled to the income statement for the year Revaluation of defined-benefit pension schemes -1.5 1.2 Tax effect from revaluation of defined-benefit pension schemes 0.3 -0.3 Other comprehensive income for the year 55.0 13.2 COMPREHENSIVE INCOME FOR THE YEAR 630.7 470.2 Comprehensive income for the year attributable to: Parent Company shareholders 630.7 470.2 Non-controlling interests -OEM 2022 41
Consolidated statement of financial position
SEK million ASSETS Note 31 Dec 2022 31 Dec 2021 Fixed assets Intangible fixed assets Goodwill 12 228.7 147.1 Other intangible fixed assets 12 115.3 29.9 Property, plant and equipment Buildings and land 13 307.7 300.2 Fixtures, fittings, tools and equipment 13 48.0 43.6 Financial assets and deferred tax assets Deferred tax assets 11 7.1 6.7 Non-current receivables 0.4 0.3 Total fixed assets 707.4 527.9 Current assets Inventories Commodities 15 1,182.5 785.3 Current receivables Tax receivables 1.3 1.9 Trade receivables 24 753.5 566.4 Other receivables 23.3 8.0 Prepaid expenses and accrued income 16 27.1 19.6 Cash and cash equivalents 25 108.9 144.8 Total current assets 2,096.6 1,526.0 TOTAL ASSETS 2,804.0 2,053.9 42 OEM 2022
Consolidated statement of financial position
SEK million EQUITY AND LIABILITIES Note 31 Dec 2022 31 Dec 2021 Equity 17 Share capital 38.6 38.6 Other contributed capital 39.4 39.4 Translation reserves 90.7 34.6 Retained earnings, including profit for the year 1,420.9 1,261.3 Total equity attributable to Parent Company shareholders 1,589.6 1,373.9 Liabilities Non-current liabilities Interest-bearing liabilities Non-current interest-bearing liabilities 18 32.6 30.4 Provisions for pensions 19 1.9 0.8 Non interest-bearing liabilities Non-current liabilities 20 58.8Deferred tax liabilities 11 133.9 105.5 Other provisions 2.0 2.0 Total non-current liabilities 229.3 138.7 Current liabilities Interest-bearing liabilities Overdrafts 18 316.7 32.9 Other current liabilities 18 27.9 27.4 Non interest-bearing liabilities Trade payables 24 272.0 205.6 Tax liabilities 11 21.3 13.5 Other liabilities 143.7 87.7 Accrued expenses and prepaid income 22 203.6 174.1 Total current liabilities 985.1 541.2 TOTAL EQUITY AND LIABILITIES 2,804.0 2,053.9 OEM 2022 43
Consolidated statement of changes in equity
SEK million Share capital Other contributed capital Translation reserve Retained earnings, including profit for the year Total shareholders' equity Opening equity 1 Jan 2021 38.6 39.4 22.4 1,265.5 1,365.9 Profit/loss for the year 457.0 457.0 Other comprehensive income for the year 12.2 1.0 13.2 Comprehensive income for the year - - 12.2 458.0 470.2 Transactions with owners: Dividends paid -173.3 -173.3 Redemption of shares -9.7 -279.2 -288.8 Bonus issue 9.7 -9.7 0.0 CLOSING BALANCE 31 DEC 2021 * 38.6 39.4 34.6 1,261.3 1,373.9 Opening equity 1 Jan 2022 38.6 39.4 34.6 1,261.3 1,373.9 Profit/loss for the year 575.7 575.7 Other comprehensive income for the year 56.1 -1.1 55.0 Comprehensive income for the year - - 56.1 574.5 630.7 Transactions with owners: Dividends paid -190.6 -190.6 Redemption of shares -12.9 -212.4 -225.3 Bonus issue 12.9 -12.9 0.0 Issued call options 1.0 1.0 CLOSING BALANCE 31 DEC 2022 * 38.6 39.4 90.7 1,420.9 1,589.6
44 OEM 2022
* Equity attributable to Parent Company shareholders.
Consolidated statement of cash flows
SEK million Note 2022 2021 Operating activities Profit before tax 724.1 575.9 Adjustments for non-cash items 25 95.5 69.8 Taxes paid -129.1 -115.4 Operating cash flows before movements in working capital 690.5 530.2 Change in inventories -360.8 -152.5 Change in trade receivables -98.2 -104.7 Change in other operating receivables -19.8 -14.9 Change in trade payables 23.8 39.5 Change in other operating liabilities 27.0 21.8 Operating cash flows 262.5 319.3 Investing activities Acquisition of subsidiaries, net effect on cash and cash equivalents 25 -131.5 -1.2 Acquisition of intangible fixed assets -2.8 -2.8 Acquisition of property, plant and equipment -18.6 -50.9 Sales of property, plant and equipment 0.3 0.6 Investing cash flows -152.7 -54.3 Financing activities Loans raised 25 - 0.8 Loan amortisation 25 -7.2 -6.3 Repayment of lease liabilities 25 -36.9 -34.0 Change in overdrafts 25 306.5 3.3 Call options 26 1.0Dividends paid -190.6 -173.3 Redemption paid -225.3 -288.8 Financing cash flows -152.6 -498.4 CASH FLOW FOR THE YEAR -42.7 -233.4 Cash equivalents at beginning of year 144.9 376.1 Exchange rate difference cash equivalents 6.8 2.1 Cash equivalents at end of year 108.9 144.9 OEM 2022 45
Parent Company income statement
SEK million Note 2022 2021 Operating income Net sales 31 91.3 83.4 Other operating income 3 -Operating costs Other external costs 6 -36.0 -31.6 Staff costs 5 -35.9 -30.2 Depreciation/amortisation of property, plant and equipment and intangible fixed assets 7 -3.8 -3.9 Operating profit 15.6 17.7 Income from interests in Group companies 8 147.2 89.7 Other interest income and similar income 9 7.7 1.2 Other interest expense and similar charges 10 -17.9 -2.6 Profit/loss after financial items 152.7 106.1 Year-end appropriations Difference between tax depreciation and depreciation according to plan: Expenses brought forward for software 23 1.0 0.2 Fixtures, fittings, tools and equipment 23 0.2 -0.2 Tax allocation fund, provision 23 -126.0 -106.0 Tax allocation fund, reversal 23 55.7 48.6 Group contributions received 436.5 356.9 Group contributions paid -0.2 -0.1 Profit before tax 519.8 405.5 Tax on profit/loss for the year 11 -78.0 -66.2 PROFIT FOR THE YEAR* 441.8 339.4 * Comprehensive income for the year is equal to profit for the year. 46 OEM 2022
Parent Company balance sheet
SEK million ASSETS Note 31 Dec 2022 31 Dec 2021 Fixed assets Intangible fixed assets Expenses brought forward for software 12 4.6 3.5 4.6 3.5 Property, plant and equipment Buildings and land 13 13.7 13.0 Fixtures, fittings, tools and equipment 13 2.9 4.0 16.6 17.0 Financial assets Interests in Group companies 14 632.3 408.4 Non-current receivable from Group companies 3.2 3.2 635.5 411.6 Total fixed assets 656.6 432.0 Current assets Current receivables Receivables from Group companies 830.3 670.1 Other receivables 20.3 3.0 Prepaid expenses and accrued income 16 6.0 5.1 856.6 678.1 Cash on hand and demand deposits 24 1.0 15.0 Total current assets 857.6 693.1 TOTAL ASSETS 1,514.2 1,125.2 OEM 2022 47
balance sheet SEK million SHAREHOLDERS' EQUITY, PROVISIONS AND LIABILITIES Note 31 Dec 2022 31 Dec 2021 Equity Non-distributable equity 17 Share capital 38.6 38.6 Reserve fund 32.3 32.3 Fund for development fees 1.4 3.4 72.3 74.3 Distributable equity Profit brought forward 105.8 179.4 Profit/loss for the year 441.8 339.4 547.6 518.7 Total shareholders' equity 619.9 593.0 Untaxed reserves Accelerated amortisation 23 1.5 2.7 Accruals funds 23 458.0 387.7 Total untaxed reserves 459.5 390.4 Provisions Deferred tax liabilities 11 1.7 1.9 Total provisions 1.7 1.9 Non-current liabilities Non interest-bearing liabilities Other liabilities 20 58.8Total non-current liabilities 58.8Current liabilities Interest-bearing liabilities Overdrafts 24 228.5Non interest-bearing liabilities Trade payables 3.3 4.0 Tax liabilities 16.0 3.9 Liabilities to Group companies 67.2 109.1 Other current liabilities 45.1 8.9 Accrued expenses and prepaid income 22 14.3 14.0 Total current liabilities 374.3 139.9 TOTAL EQUITY, PROVISIONS AND LIABILITIES 1,514.2 1,125.2 48 OEM 2022
Parent Company
Parent Company statement of changes in equity
SEK million Non-distributable equity Distributable equity Total shareholders' equity Share capital Reserve fund Fund for development costs Profit/loss brough forward including profit/loss for the year Opening equity 1 Jan 2021 38.6 32.3 5.4 639.6 715.8 Provisions to development fund for the year Winding-up of development fund for the year -2.0 2.0 Comprehensive income for the year * 339.4 339.4 Dividends paid -173.3 -173.3 Redemption of shares -9.7 -279.2 -288.8 Bonus issue 9.7 -9.7 CLOSING EQUITY 31 DEC 2021 38.6 32.3 3.4 518.7 593.0 Opening equity 1 Jan 2022 38.6 32.3 3.4 518.7 593.0 Provisions to development fund for the year Winding-up of development fund for the year -2.0 2.0 Comprehensive income for the year * 441.8 441.8 Dividends paid -190.6 -190.6 Redemption of shares -12.9 -212.4 -225.3 Bonus issue 12.9 -12.9 Issued call options 1.0 1.0 CLOSING EQUITY 31 DEC 2022 38.6 32.3 1.4 547.6 619.9 Proposed dividend, SEK 1.5 per share 208.5 * Comprehensive income for the year is equal to profit for the year. NUMBER OF SHARES Total Outstanding Opening number 1 Jan 2021 23,169,309 23,107,462 Share split 69,507,927 69,322,386 Share redemption -23,169,309 -23,107,462 CLOSING NUMBER 31 DEC 2021 69,507,927 69,322,386 Opening number 1 Jan 2022 69,507,927 69,322,386 Share split 139,015,854 138,644,772 Share redemption -69,507,927 -69,322,386 CLOSING NUMBER 31 DEC 2022 139,015,854 138,644,772 OEM 2022 49
Parent Company cash flow statement
SEK million Note 2022 2021 Operating activities Profit/loss after financial items 152.7 106.1 Adjustments for non-cash items 25 -1.1 3.9 151.6 110.0 Taxes paid -66.2 -84.3 Operating cash flows before movements in working capital 85.4 25.7 Cash flow from changes in working capital Change in other operating receivables -90.4 -49.7 Change in trade payables 0.7 1.5 Change in other operating liabilities -31.2 19.7 Operating cash flows -35.5 -2.9 Investing activities Acquisition of shares in subsidiaries -144.0 -42.4 Liquidation of subsidiaries - 6.5 Acquisition of intangible fixed assets -2.8 -0.1 Acquisition of property, plant and equipment -2.0 -1.8 Investing cash flows -148.8 -37.8 Financing activities Group contributions, received 356.9 259.5 Group contributions, paid -0.1 -2.0 Change in overdrafts 228.5Call options 26 1.0Dividends paid -190.6 -173.3 Redemption of shares -225.3 -228.8 Financing cash flows 170.3 -204.7 CASH FLOW FOR THE YEAR -14.0 -245.4 Cash equivalents at beginning of year 15.0 260.4 Cash equivalents at end of year 1.0 15.0 50 OEM 2022
Accounting Policies and Notes to the Financial Statements
Amounts in SEK millions unless otherwise stated
Note 1 Accounting policies
Compliance with standards and legislation
The consolidated financial statements have been prepared in accordance with the International Financial Reporting Standards (IFRS) issued by the International Accounting Standards Board (IASB) and statements concerning interpretation published by the International Financial Reporting Interpretations Committee (IFRIC), as approved by the European Union. Furthermore, the Group has applied the Swedish Financial Accounting Standards Council's recommendation RFR 1 (Supplementary Accounting Regulations for Groups).
The accounting policies adopted for the Parent Company are the same as those used for the Group, except in the cases specified below in the section "Accounting Policies of the Parent Company".
Requirements for preparing Parent Company and Group financial statements
The Parent Company's functional currency is the Swedish krona (SEK), which is also the official reporting currency for the Parent Company and the Group. This means that the financial statements are presented in Swedish krona. All amounts are rounded off to the nearest million with one decimal, unless otherwise stated.
Assets and liabilities are stated at historical cost, except derivative instruments and contingent considerations which are measured at fair value.
Fixed assets and non-current liabilities consist of amounts that can be expected to be recovered or paid more than twelve months after the balance sheet date. Current assets and current liabilities consist of amounts expected to be recovered or paid within twelve months from the balance sheet date.
The preparation of financial statements requires management to make judgements, estimates and assumptions that affect the application of policies and reported amounts of assets and liabilities, income and expenses. Estimates and assumptions are based on historical experience and other factors that are believed to be reasonable and relevant under the circumstances. Estimates and assumptions are reviewed on a regular basis and are compared to actual results. Critical estimates and assumptions are presented in Note 29.
The consolidated accounting policies outlined below have been applied consistently throughout the periods reported in the Group's financial statements, unless otherwise stipulated below.
New and amended standards applied by the Group
None of the amendments to standards that are effective from 1 January 2022 have had any material impact on the Group's financial statements.
New standards and interpretations not yet applied by the Group
A number of new standards and interpretations become effective for the financial year commencing 1 January 2023 and have not been applied in the preparation of these financial statements. None of these are expected to have any material impact on the Group's financial statements.
Reporting of operating segments
An operating segment is a component of the Group that engages in business activities from which it may earn revenues and incur expenses and whose operating results are reviewed regularly by the Group's executive team. Note 2 provides a more detailed description of the grouping and presentation of operating segments.
Principles of consolidation for subsidiaries
Subsidiaries are entities in which OEM International AB has the power to exercise control, either directly or indirectly. Control exists when the Parent Company has power over the investee, either directly or indirectly, when it is exposed, or has rights, to variable returns from its involvement
with the investee and has the ability to affect those returns through its power over the investee.
Business combinations are recognised in accordance with the acquisition method. The method means that the acquisition of a subsidiary is regarded as a transaction through which the Group indirectly acquires the subsidiary's assets and assumes its liabilities.
Goodwill in business combinations is calculated as the sum total of the consideration transferred minus the fair value of the subsidiary's identifiable assets and assumed liabilities. A negative difference is recognised directly in the profit or loss for the year. Transaction costs in connection with business combinations are expensed at the time of acquisition.
Contingent consideration in acquisitions is measured at fair value both at the acquisition date and continuously afterwards; any and all changes in value are recognised in profit or loss.
The financial statements of the subsidiaries are included in the consolidated financial statements from the effective date of acquisition until the day that control ceases.
Transactions to be eliminated on consolidation
All inter-company receivables and liabilities, income or expenses, and unrealised gains or losses arising from inter-company transactions between Group companies are eliminated in their entirety when preparing the consolidated financial statements.
Foreign currency
Transactions in foreign currencies
Transactions in foreign currencies are translated to the functional currency at the exchange rate prevailing on the date of the transaction. Functional currency is the currency that applies in the primary economic environments in which the Group companies operate. Monetary assets and liabilities denominated in foreign currencies are retranslated to the functional currency at the exchange rate prevailing on balance sheet date. Exchange rate differences resulting from translations are reported in the profit or loss for the year. Non-monetary assets and liabilities reported at their historical acquisition costs are translated at the exchange rate prevailing on the date of the transaction.
Financial statements of foreign operations
Assets and liabilities in foreign operations, including goodwill and other residual values in the corporate fair value adjustments, are translated from the foreign entities functional currency to the consolidated reporting currency, Swedish kronor (SEK), at the exchange rate prevailing on the balance sheet date. Income and expense in foreign entities are translated to Swedish kronor (SEK) at an average rate that represents an approximation of the rates that applied when each transaction took place. Exchange differences arising when translating currency of foreign operations are recognised in other comprehensive income and are accumulated in a separate component of shareholders' equity that is referred to as a translation reserve. When a foreign entity is divested, the accumulated translation differences attributable to the entity are realised and reclassified from the translation reserve of the shareholders' equity to the profit or loss for the year.
Income
Performance obligations and revenue recognition
The Group's revenues come from the sale of goods for resale, which is recognised when control of the goods is passed to the buyer. The revenue is recognised based on the amount specified in the contract with the customer and the sold quantity. The outcome of agreed volume discounts/ rebates and market contributions is estimated and reduces the revenue at the time of sale and is included in accrued expenses. The performance
OEM 2022 51
obligations of the Group are considered to be satisfied when control of the good is transferred to the customer.
When contracts allow customers to return goods, revenue is recognised only when it is highly probable that there will not be a significant reversal in the cumulative amount of revenue. Assessments of expected returns are based on past data for specific customers and goods. Expected returns are recognised as a reduction in revenue and as a refund liability, and the cost of goods associated with the returns is reduced and an asset equivalent to the right to recover the goods returned is recognised.
The characteristics of and the point in time for satisfaction of the performance obligations including significant payment terms
Control of the goods is usually transferred to the customer when the goods are sent from the Group's warehouses or when the goods have been delivered, depending on the terms of the contract. Invoices are generated at this point in time. The due date is normally 30 to 60 days from the invoice date.
Revenue recognition
Revenue is recognised when the goods have been delivered and the control of the goods has been transferred
Government support grants
Government grants are recognised at their fair value when there is reasonable assurance that the entity will comply with the conditions related to the grants and that the grants will be received. Government grants received for short-term work, sick pay and temporary staff redundancies are recognised as Other operating income on a systematic basis over the periods in which the entity recognises as expenses the related costs for which the grants are intended to compensate.
Repayment AGS
SEK - million (1.1 million) repayment received from the AGS collective health insurance has been recognised as revenue.
Operating costs and finance income and expense
Finance leases
The minimum lease fees are allocated as interest expense and amortisation for the outstanding liability. The interest expense is spread over the term of the lease, so that each accounting period is charged with an amount corresponding to a fixed rate of interest for the liability recognised in the respective period. Variable payments are expensed on the income statement for the year in the periods in which they occur.
Finance income and expense
Finance income and expense include interest income from bank assets, receivables and interest-bearing securities, dividend income, interest expenses related to loans, exchange rate differences attributable to financial investments and financing activities and derivative instruments used in the financial operating activities.
Interest income from receivables and interest expense related to liabilities are calculated using the effective interest method. The effective interest rate is the rate that exactly discounts estimated future cash payments or receipts through the expected life of the financial asset or financial liability to the gross carrying amount of a financial asset or to the amortised cost of a financial liability.
Interest income and interest expense respectively include periodic amounts of transaction costs and discounts where applicable, premiums and other differences between the originally recognised value of the receivable and of the liability respectively and the amount that is settled at maturity and the estimated future receipts and payments through the term of the agreement.
Dividend income is recognised when the right to retain payment has been established.
Exchange gains/losses are recognised net.
Taxes
Income tax consists of current tax and deferred tax. Income tax is reported in the income statement for the year unless the underlying transaction is charged to other comprehensive income or directly to equity, in which case any related tax effect is charged to other comprehensive income or to equity. Current tax is the tax that is to be paid or received for the current year. This includes adjustments of current tax attributable to prior periods. Current and deferred tax are calculated with application of the tax rates and regulations in effect or in practice at the balance sheet date.
Deferred tax is calculated using the balance sheet method on the basis of temporary differences between the carrying amounts and tax values of assets and liabilities. Temporary differences are not considered in consolidated goodwill.
Measurement of deferred tax is based on how the carrying amount of assets or liabilities is expected to be recovered or settled.
Deferred tax assets, relating to deductible temporary differences and loss carry-forwards, are only recognised to the extent that it is probable that these can be utilised. The value of deferred tax assets is reduced when it is no longer deemed likely that they can be utilised.
Financial instruments
Financial instruments reported in the statement of financial position as assets consist primarily of cash and cash equivalents, loan receivables and trade receivables. Trade payables, loan liabilities, contingent considerations and overdrafts are reported as liabilities.
Recognition in and derecognition from the statement of financial position
Recognition of a financial asset or financial liability in the statement of financial position is at the point when the entity becomes a party to the contractual provisions of the instrument. A receivable is recognised when the entity has performed and there is a contractual liability for the counterparty to pay, even if an invoice has not been sent. Trade receivables are recognised in the statement of financial position upon issuance of invoice. Liabilities are included when the counterparty has performed and there is a contractual liability to pay, even if the invoice has not been received. Trade payables are recognised on receipt of invoice.
A financial asset is derecognised and removed from the statement of financial position when the contractual rights are realised, expire or when control of the contractual rights is lost. The same applies to part of a financial asset. A financial liability is removed from the statement of financial position when the obligation is discharged or otherwise extinguished. The same applies to part of a financial liability.
A financial asset and a financial liability are offset and reported in the statement of financial position as a net amount only when there is a legal right to set off the amount and an intention to adjust the items with a net amount or, at the same time, realise the asset and settle the liability.
Initial recognition
Financial instruments are recognised initially at fair value plus/less transaction costs, with the exception of instruments that are continuously recognised at fair value through profit or loss. These transaction costs are instead recognised as an expense as they occur. Trade receivables (without a significant financing component) are measured initially at their transaction price as stated in accordance with IFRS 15.
Classification and subsequent measurement of financial assets
Financial assets are classified initially either as measured at amortised cost, fair value through other comprehensive income (liability instrument investment), fair value through other comprehensive income (equity investment), or fair value through profit or loss. The Group's various holdings of financial assets have been classified as described below:
- Other financial assets
All other financial assets are measured at amortised cost. This is because the objective of the business model is to hold these assets to collect their
52 OEM 2022
contractual cash flows, and that the cash flows from the assets are solely payments of principal and interest.
- Cash and cash equivalents
Cash and cash equivalents consist of cash in hand, deposits that are repayable on demand held with banks and similar institutions, plus shortterm deposits with an original maturity of three months or less, which are exposed to only an insignificant risk for fluctuations in value.
Classification and subsequent measurement of financial liabilities
Financial liabilities are classified either as measured at amortised cost or measured at fair value through profit or loss.
- Contingent considerations
Contingent considerations assumed in a business combination are recognised at fair value through profit or loss. Changes in fair value are recognised in "Other Operating Costs" or "Other Operating Income".
- Other financial liabilities
All other financial liabilities are measured at amortised cost using the effective interest rate method.
Property, plant and equipment
Owned assets
Property, plant and equipment are stated at cost less accumulated depreciation and any impairment losses. Cost includes the purchase price, including expenses directly attributable to their acquisition and costs incurred to prepare the assets for their intended purpose. Cost includes directly attributable expenses, such as the cost of delivery and handling, installation, title deeds, consultancy services and legal services. Borrowing costs directly attributable to the acquisition, construction or production of assets that necessarily take a substantial period of time to get ready for their intended use or sale, are added to the cost of those assets. Accounting policies for impairment are presented below.
The reported value of tangible fixed assets is removed from the statement of financial position on the disposal or retirement of the asset, or when no future economic benefits are expected from its use or disposal/ retirement. Gains or losses arising on the disposal or retirement of an asset is determined as the difference between the sales proceeds and the carrying amount of the asset, less direct selling costs. The gain or loss is recognised in other operating income/cost.
Right-of-use assets
The Group mainly has leases for property, machinery, equipment and vehicles.
As a lessee, the Group recognises the leases as a right-of-use asset and associated liability at the date on which the leased asset is available for use by the Group. Each lease payment is allocated between the liability and finance cost (interest). The finance cost is to be spread over the lease term so as to produce a constant rate of interest on the remaining balance for the liability for each period.
The right-of-use asset is depreciated over the shorter of the asset's useful life and the lease term on a straight line basis. The leases are normally for a fixed period with an option to renew.
Assets and liabilities arising from leases are initially measured on a present value basis. The lease liabilities include the present value of the following lease payments:
• fixed payments
• variable lease payments that are based on an index
• the exercise price of a purchase option if the Group is reasonably certain to exercise that option.
The lease payments are discounted using the interest rate implicit in the lease. Otherwise, if this rate cannot be determined, using the incremental borrowing rate.
The right-of-use assets are measured at cost and include:
• the initial measurement of the lease liability, and
• payments made at or before the date on which the leased asset becomes available to the lessee.
Leases of low-value underlying assets or leases with a term of 12 months or less are recognised as an expense on a straight-line basis over the lease term. Leases of low-value underlying assets generally comprise office equipment.
Extension and termination options
Some leases contain extension or early termination options. The terms are used to create maximum flexibility in the management of leases. Options to extend or terminate a lease are included in the asset and the liability as it is reasonably certain that they will be exercised.
Subsequent expenditure
Subsequent expenditure is added to the acquisition cost only if it is likely that the future economic benefits associated with the asset will flow to the enterprise and the acquisition cost can be calculated in a reliable manner. All other subsequent expenditure is reported as an expense in the period it is incurred.
A subsequent expenditure is added to the acquisition cost if the expense refers to the exchange of identified components or parts thereof. Even in those cases when a new component has been constructed, the expense is added to the acquisition cost. Any undepreciated values reported for replaced components, or parts of components, are discarded and charged to expenses when the component is replaced. Repairs are expensed as incurred.
Methods of depreciation for owned property, plant and equipment
Straight-line depreciation is applied over the estimated utilisation period of the assets. Land is not depreciated.
The Group applies component depreciation, meaning that the estimated useful life of components forms the basis for depreciation.
Estimates of useful life:
• buildings, business property see below
• land improvements 20 years
• plant and machinery 5-10 years
• fixtures, fittings, tools and equipment
3-10 years
Business property comprises a number of components with different useful lives. The main group is buildings and land. Land is not depreciated as its useful life is considered to be indefinite. The buildings consist of a number of components with different useful lives. The following main groups of components have been identified and form the basis for depreciation of buildings:
Shell 100 years
Frame extensions, interior walls, etc. 30 years
Installations and inner surfaces; heating, electricity, plumbing, ventilation etc. 20-32 years
External surfaces, walls, roof, etc. 20-50 years
The depreciation methods applied and the residual values of the assets and their useful lives are reviewed at the close of every year.
Intangible fixed assets
Goodwill
Goodwill is carried at cost less any accumulated impairment.
Goodwill is allocated to cash-generating units (the Group's operating segments) and is tested for impairment at least once a year.
Other intangible fixed assets
Acquired supplier relationships with an indeterminable useful life are carried at cost less any accumulated impairment.
Supplier relationships with an indeterminable useful life are deemed to exist in terms of certain acquisitions of agents or comparable relationships with individual suppliers who have historically exhibited a very long-term
OEM 2022 53
agent relationship. Circumstances are reviewed annually to determine if they still indicate that the useful life is indeterminable. Impairment tests are performed annually and when there is any indication of impairment. Other acquired supplier relationships are carried at cost less accumulated amortisation and impairment.
Other intangible assets include software, trademarks and customer relationships. These have a determinable useful life and are recognised at cost less accumulated amortisation and impairment. Expenditures for internally generated goodwill and internally generated brand names are not capitalised as assets but are expensed in the income statement as incurred.
Subsequent expenditure
Subsequent expenditure on capitalised intangible assets is reported as an asset in the statement of financial position only when it increases the future economic benefits of the specific asset to which it relates. All other expenditure is expensed when incurred.
Methods of amortisation
Amortisation is recognised in the income statement on a straight-line basis over the estimated life of the intangible asset, provided it has a definite useful life. Goodwill has an indefinite useful life and is tested for impairment each year or whenever there is an indication that the tangible asset may be impaired. The useful life of the assets are reviewed annually at least, refer also to Note 12.
Estimates of useful life:
• IT software 5 years
• brand names/trademarks 5-10 years
• customer relationships 5 years
• supplier relationships
Capitalisation of borrowing costs
5 years (unless indefinite)
Borrowing costs that are directly attributable to the construction of qualifying assets are capitalised as part of the cost of that asset. A qualifying asset is an asset that necessarily takes a substantial period of time to get ready for its intended use or sale. Firstly, borrowing costs arising on loans, which are specific to the qualifying asset are capitalised. Secondly, borrowing costs arising on general loans, which are not specific to any other qualifying asset are capitalised. For the Group, the capitalisation of borrowing costs is mainly relevant in the construction of storage and production facilities using its own direct labour.
Inventories
Inventories are stated at the lower of cost and net realisable value. The cost of inventories is calculated by applying the first-in, first-out method (FIFO) and includes expenditure arising on acquisition of the inventory assets and transportation thereof to their current location and state. Net realisable value is based on the estimated selling price in the operating activities less further costs expected to be incurred to completion and for realising a sale.
Impairments
The section below explains the impairment test for property, plant and equipment and intangible assets, investments in subsidiaries and for financial assets. Assets for sale and disposal groups, inventories and deferred tax assets are exempt. The recognised value of the exempt assets is assessed in accordance with the respective accounting standards.
Impairment tests for property, plant and equipment and intangible fixed assets and interests in subsidiary undertakings
If there is any indication of impairment, then the asset's recoverable amount is calculated, see below). The recoverable amount is also calculated annually for goodwill and other intangible assets with indefinite useful lives. If essentially independent cash flow cannot be isolated for individual assets, then the assets are grouped at the lowest levels where essentially
independent cash flows can be identified – a so-called cash-generating unit.
An impairment loss is recognised when the carrying amount of an asset or cash-generating unit, or pool of units, exceeds its recoverable amount. An impairment loss is recognised as an expense in the income statement for the year. Impairment losses attributable to a cash-generating unit, or pool of units, are mainly allocated to goodwill. The remaining impairment is then allocated pro rata to the other assets of the unit or group of units.
The recoverable amount is the highest of the fair value minus selling costs and value in use. Value in use is measured by discounting future cash flows using a discounting factor that takes into account the risk-free rate of interest and the risk associated with the specific asset.
Impairment losses on assets are reversed if there is an indication that impairment has ceased and there is a change in the assumptions that formed the basis of calculating the recoverable amount. Impairment losses on goodwill are never reversed. A reversal only occurs to the extent that the asset's carrying amount after reversal does not exceed the carrying amount that would have been recognised (less depreciation or amortisation, where applicable), had no impairment loss been recognised.
Impairment of financial assets
OEM recognises a loss allowance for expected credit losses on financial assets measured at amortised cost. The loss allowance for trade receivables is measured at an amount equal to the expected losses for the remaining time to maturity. The loss allowance for other receivables is measured at an amount equal to 12 months' expected credit losses, provided that the credit risk of the receivable has not increased significantly since initial recognition. If the credit risk of the receivable has increased significantly since initial recognition, the loss allowance is instead measured at an amount equal to the expected credit losses during the remaining time to maturity.
The loss allowance is calculated as the present value of all cash shortfalls (i.e. the difference between the cash flows as stated in the contract and the Group's expected cash flows). Receivables with a short term to maturity are not discounted. Assets are reported in the balance sheet net of any impairment losses. Impairment losses are recognised in the income statement.
The gross carrying amount of a financial asset is written off when the Group has no reasonable expectations of recovering the financial asset in its entirety or a portion thereof.
Capital payments to shareholders Repurchase of own shares
Purchase of such instruments is recognised as a deductible item from equity. Payment from sales of equity instruments is recognised as an increase in equity. Any transaction costs are recognised directly in equity.
Dividends paid
Dividends are recognised as a liability after the Annual General Meeting has approved the dividend.
Earnings per share
Earnings per share are calculated by dividing the Group's profit for the year attributable to the Parent Company's shareholders by the weighted average number of shares outstanding during the year.
Employee benefits
Defined-contribution pension schemes
Defined-contribution pension schemes are classified as those schemes for which the company's obligation extends only to the contributions the company has committed to pay. In such cases, the size of the employee's pension is determined by the contributions the company pays to the plan or to an insurance company and the return on capital yielded by the contributions. Consequently, it is the employee that carries the actuarial risk (that compensation is lower than expected) and the investment risk (that the invested assets will be insufficient to cover the expected compensa-
54 OEM 2022
tion). The entity's obligations concerning contributions to defined-contribution schemes are recognised as an expense in profit or loss for the year at the rate they are earned through services performed by the employees for the entity.
Defined-benefit pension schemes
The Group's obligation regarding defined-benefit pension schemes is calculated separately for each scheme by estimating the future compensation that the employees have earned through their employment; this compensation is discounted to present value. The discount rate used is the interest rate on high-quality corporate bonds on the reporting date, extrapolated to match the terms of maturity for the Group's retirement benefit obligations. If there is no active market for such corporate bonds, the market interest rate on government bonds is used instead. The retirement benefit obligation is recognised net, less the fair value of the plan assets. Pension rights earned are recognised in operating profit, with the exception of impacts of revaluation and interest rate as per below. The interest expense/income net on the defined-benefit obligation/asset is recognised in the income statement under net financial items. The net interest income is based on the interest rate in effect at the time of discounting the net obligation, i.e. interest on the obligation, plan assets and interest on the effect of any asset ceiling. Other components are recognised in operating profit.
Effects of revaluation comprise actuarial gains and losses and the difference between actual return on plan assets and the interest rate included in the net interest income. The effects of revaluation are recognised in other comprehensive income.
Termination benefits
An entity shall recognise an expense for termination benefits at the earlier of either when the entity can no longer withdraw the offer of those benefits to the employees, or when the entity recognises costs for a restructuring. Where an offer of benefits is made to encourage voluntary redundancy, an entity shall recognise an expense at the earlier of either when the employee accepts the offer, or when the entity can no longer withdraw the offer of those benefits.
The calculation of the expense is based on the probability of the offer being accepted, the number of employees expected to accept the offer and the length of time for which payment is expected to be made. Benefits that are settled after twelve months are discounted to their present values.
Short-term benefits to employees
Short-term benefits to employees are calculated without discounting and recognised as costs when the related services are received. The Group recognises a provision for the expected cost of bonus payments when it has a legal or constructive obligation to make such payments as a result of services received from employees.
Government grants
Where entitlement to receive a grant is not based on future performance, government support grants are recognised as revenue as the conditions for receiving the grant are met. Government grants are measured at the fair value of the amount that has been or will be received.
Provisions
Provisions are different from other liabilities because the time of payment and the amount of the payment are uncertain. A provision is reported in the statement of financial position when the Group has a legal or informal obligation owing to a past event and it is likely that an outflow of economic resources will be required to settle the obligation and a reliable estimate of the amount can be made.
Provisions are measured at the best estimate of the amount required to settle the obligation at the reporting date. If the effect is material, provisions are determined by discounting the expected future cash flows.
Contingent liabilities
A contingent liability is reported when there is a possible obligation that arises from past events whose existence will be confirmed only by the occurrence or non-occurrence of one or more uncertain future events not wholly within the control of the entity, or when there is an obligation that is not recognised as a liability or provision because it is not possible that an outflow of resources will be required or cannot be measured reliably.
Parent Company accounting policies
The Parent Company has prepared its Annual Report according to the Annual Accounts Act (1995:1554) and the Swedish Financial Accounting Council's recommendation RFR 2, Accounting for Legal Entities. In addition, the Swedish Financial Accounting Council's pronouncements for listed companies are applied. RR 2 means that the Parent Company in the annual accounts for the legal entity must apply all IFRS and interpretations adopted by the EU as far as this is possible within the framework of the Swedish Annual Accounts Act, the Swedish Pension Obligations Vesting Act and taking into account the relationship between accounting and taxation. The recommendation specifies exemptions and additions relative to IFRS.
Amended accounting policies
The Parent Company's accounting policies for 2022 are the same as for 2021.
Differences between the Group's and Parent Company's accounting policies
The differences between the accounting policies of the Group and those of the Parent Company are presented above and below. The accounting policies for the Parent Company as described below have been applied consistently to all periods presented in the Parent Company's financial statements.
Classification and presentation
Where the Group uses the terms statement of financial position and statement of cash flows, the Parent uses balance sheet and cash flow statement. The income statement and balance sheet for the Parent Company are prepared in accordance with the schedule of the Swedish Annual Accounts Act, whereas the statement of comprehensive income, statement of changes in equity and cash flow statement are based on IAS 1 Presentation of Financial Statements and IAS 7 Statement of Cash Flows. The Parent's income statement and balance sheet differ to the Group's mainly with regard to reporting of finance income and expense, non-current assets, equity, untaxed reserves and the occurrence of provisions as a separate heading in the balance sheet.
Sales of services and similar assignments
Services are sold only on an ongoing basis to subsidiaries. Revenue arising from the rendering of services is recognised in the income statement for the year in which the service is rendered.
Subsidiaries
Interests in subsidiary undertakings are recognised in the Parent Company using the cost method. This means that transaction costs are included in the carrying amount for interests in subsidiary undertakings. In the consolidated financial statements, transaction costs are recognised directly in profit for the year as they are incurred. Contingent consideration is measured using probabilities of payment. Any changes to the provision are added to or deducted from the cost.
Financial assets and liabilities
The Parent Company has decided not to apply IFRS 9 for financial instruments. Non-current financial assets in the Parent Company are valued at cost less any impairment losses and financial current assets are valued at the lower of cost and net realisable value. The rules for impairment according to IFRS 9 are applied for financial assets measured at amortised
OEM 2022 55
cost. Financial liabilities are stated at amortised cost on the same basis as in the consolidated financial statements.
Financial guarantee contracts
The Parent Company’s financial guarantee contracts consist of guarantee commitments to support subsidiaries. The Parent Company recognises financial guarantee contracts as provision in the balance sheet when the company has an obligation for which payment will probably be required to settle the obligation.
Anticipated dividends
Anticipated dividends from subsidiaries are reported when the Parent Company has sole right to determine the size of the dividend and the Parent Company has decided on the size of the dividend before the Parent Company has published its financial statements.
Property, plant and equipment
- Owned assets
Property, plant and equipment in the Parent Company is stated at cost less accumulated depreciation and any impairment, on the same basis as for the Group, but with additions for any increases arising on revaluation.
- Leased assets
The Parent Company recognises all leases in accordance with the regulations for operating leases.
Borrowing costs
Borrowing costs in the Parent Company are charged to the income statement in the period in which they arise. No borrowing costs are capitalised on assets.
Taxes
The Parent Company reports untaxed reserves including deferred tax liability. In the consolidated financial statements, however, untaxed reserves are divided between deferred tax liability and shareholders' equity.
Shareholders' contributions
Shareholders' contributions are charged directly to equity for the receiver and are capitalised in shares and contributor participations, to the extent that impairment is not required.
Group contributions
The Parent Company recognises issued and received Group contributions as year-end appropriations.
56 OEM 2022
Note 2 Operating segments
The Group's operations are divided into operating segments based on the business areas for which the company's chief operating decision maker, the Group's executive team, monitors the profit, returns and cash flows from the Group's various segments. The operating segments, in the form of market regions, have four managers in Sweden, two managers in Finland, the Baltic states and China, and two managers in the Denmark, Norway, the British Isles and East Central Europe region. They are responsible for the day-to-day operations and provide Group management with regular reports on the performance of the segment and resource requirements. The Group's internal reporting system is designed to allow the Group management to monitor the performance and results of each of the market regions. The Group's segments have been identified using data from this internal reporting system, and the different areas have been assessed in order to merge segments that are similar. This means that segments have been aggregated if they share similar economic characteristics, such as long-term gross margins and have similar product areas, customer categories and methods of distribution.
In the segments' profit, assets and liabilities are included directly attributable items and items that can be distributed to the segment in a reasonable and reliable manner. Non-distributed items consist of interest and dividend income, gains from the sale of financial investments, interest expenses, losses from the sale of financial investments, tax expenses and general administration expenses. Assets and liabilities not distributed to the segments are deferred tax assets, deferred tax liabilities, interest-bearing assets and liabilities. The segment's investments in property, plant
and equipment and intangible fixed assets include all investments except for investments in expendable equipment and minor value assets. Internal prices between the Group's different segments are set using the "arm'slength principle", i.e. between parties who are independent of each other, well informed and with an interest in completing the transactions.
Basically all income comes from product sales, consisting of components mainly for industrial automation in the product areas of electrical components, flow technology, motors, transmissions and brakes, appliance components, installation components, and bearing solutions and seals. Customers include machinery and appliance manufacturing industries, wholesalers, electrical contractors, catalogue distributors, strategic end users and electronics manufacturers and strategic contract manufacturers in northern Europe.
Internal sales have elements of services, both at the Parent Company and subsidiaries. All Parent Company sales relate to services sold to the subsidiaries.
Other Group-wide operations include the Parent Company, owning the shares in underlying companies, and property companies owning business properties in the locations where the Group conducts its business activities. The Parent Company is to be an active owner and develop the subsidiaries. In addition to clear management-by-objectives, this means contributing expertise and resources in the fields of IT, financial control, HR administration, market communication, quality and environmental control, and inventory management.
YEAR 2022 Sweden Finland, Baltic states and China Denmark, Norway, the British Isles and East Central Europe Group-wide operations Eliminations Total consolidated Income External sales 2,744.7 969.0 1,017.4 4,731.1 Internal sales 282.9 81.7 25.9 119.4 -509.9Total income 3,027.6 1,050.7 1,043.3 119.4 -509.9 4,731.1 Profit/loss Operating profit 502.9 136.0 93.3 26.3 -23.6 735.1 Financial items -11.0 -11.0 Tax expenses -148.4 PROFIT/LOSS FOR THE YEAR 575.7 EBITA 505.6 136.8 117.6 26.3 -23.6 762.8 EBITA margin, % 18.4 14.1 11.6 16.1 Other disclosures Assets 1,397.9 461.3 566.1 769.8 -508.4 2,686.7 Liabilities 770.0 136.8 144.3 127.8 -508.4 670.5 Investments in intangible fixed assets - - 104.6 2.8 107.5 Investments in property, plant and equipment 5.7 1.3 5.6 6.0 18.6 Amortisation and impairment of intangible fixed assets 3.1 1.1 24.7 1.8 30.6 Depreciation of property, plant and equipment 4.8 2.3 5.5 9.0 21.6 OEM 2022 57
Cont. Note 2
2021 Sweden Finland, Baltic states and China Denmark, Norway, the BritishIsles and East Central Europe Group-wide operations Eliminations Total consolidated Income External sales 2,325.4 791.2 654.7 2.5 - 3,773.8 Internal sales 172.0 13.3 4.0 92.0 -281.3Total income 2,497.4 804.6 658.7 94.5 -281.3 3,773.8 Profit/loss Operating profit 394.9 111.9 53.1 36.5 -18.0 578.4 Financial items -2.5 -2.5 Tax expenses -118.9 PROFIT/LOSS FOR THE YEAR 457.0 EBITA 398.5 117.8 55.8 36.5 -18.0 590.5 EBITA margin, % 17.1 14.9 8.5 15.6 Other disclosures Assets 1,080.2 334.9 257.6 668.4 -440.5 1,900.5 Liabilities 659.5 111.2 80.9 56.2 -440.5 467.4 Investments in intangible fixed assets 2.3 - 0.3 0.1 2.8 Investments in property, plant and equipment 15.0 6.1 5.4 44.3 70.8 Amortisation and impairment of intangible fixed assets 4.0 5.9 2.7 2.0 14.6 Depreciation of property, plant and equipment 24.2 7.0 15.5 8.8 55.4
58 OEM 2022
Cont. Note 2
* No customer accounts for more than 4% of sales
* No customer accounts for more than 4% of sales
* External sales are broken down by location of sales point.
** Relates to intangible fixed assets and property, plant and equipment incl. IFRS 16
OF EXTERNAL REVENUE PER REGION AND PRODUCT AREA Year 2022 Sweden Finland, the Baltic states and China Denmark, Norway, the British Isles and East Central Europe Total consolidated Breakdown of external revenue by product area Automation 975.4 590.5 750.7 2,316.6 Components 422.8 107.2 19.9 549.9 Installation components 558.5 56.8 246.7 862.0 Other 788.0 214.6 0.0 1,002.6 TOTAL EXTERNAL REVENUE* 2,744.7 969.0 1,017.4 4,731.1
SPECIFICATION
2021 Breakdown of external revenue by product area Automation 808.3 463.5 637.6 1,909.4 Components 355.6 86.0 17.1 458.7 Installation components 495.6 49.7 - 545.2 Other 666.0 192.1 - 858.0 TOTAL EXTERNAL REVENUE* 2,325.4 791.2 654.7 3,771.4
GEOGRAPHIC AREAS External sales * Assets ** Investments** 2022 2021 2022 2021 2022 2021 Sweden 2,742.0 2,321.8 282.3 287.0 22.4 15.9 Finland 881.2 717.2 140.4 133.2 2.3 43.9 Ireland 246.1 – 179.8 – 116.7 –United Kingdom 217.7 200.6 35.7 39.7 3.2 1.7 Denmark 190.1 146.5 39.9 37.9 1.1 1.2 Poland 155.3 133.2 9.8 10.0 2.3 2.4 Norway 97.4 82.6 3.5 6.0 0.1 1.7 Czech Republic 78.3 62.2 1.7 2.7 0.9 1.9 China 43.3 38.3 0.6 0.3 0.0 0.0 Estonia 32.6 27.4 0.6 0.2 0.4 0.1 Slovakia 17.0 15.8 0.5 0.6 0.1Hungary 15.4 13.9 1.0 1.3 0.3 0.9 Lithuania 11.0 9.1 0.3 0.3 0.0 0.2 The Netherlands 2.7 3.6 3.6 1.7 2.6 1.1 Latvia 0.9 1.8 – – – –TOTAL 4,731.1 3,773.8 699.8 520.9 152.4 70.8
OEM 2022 59
Note 3 Other operating income
* Government grants have been received for short-term work and sick pay in Sweden and for temporary staff redundancies in Denmark, Norway, Hungary and the UK. All grants are related to Covid-19.
See Notes 4 and 24 for additional information.
Note 4
Business combinations
2022
On 13 January 2022, all of the shares in Demesne Electrical Sales Ltd were acquired. The company was acquired through the transfer of all shares in the parent company Balfe Securities Limited. Demesne Electrical Sales is Ireland's leading independent importer and distributor of electrical control, switch-gear, energy-saving and installation products. It has 48 employees and an annual turnover of approximately SEK 250 million. The acquired business contributed SEK 247 million to Group sales and SEK 43 million to Group earnings. The company has its head office in Dublin and is part of Region Denmark, Norway, the British Isles and East Central Europe. OEM normally uses an acquisition structure with a base consideration combined with contingent consideration. The consideration for the acquired business was SEK 229.1 million, including a contingent consideration calculated as SEK 77.8 million, which is based on the performance of the business in the period 2022 to 2024. Intangible fixed assets increased by SEK 104.6 million as a result of the acquisition. The amount relates to supplier relationships that will be amortised over a five-year period, which is consistent with the Group's general acquisition strategy. Goodwill is attributable to synergies with current operations within the Group and amounts to SEK 70.0 million. Acquired receivables are recognised at fair value.
EFFECTS OF ACQUISITION (FINAL ACQUISITION ANALYSIS)
The net assets of the acquired companies on acquisition:
Goodwill
Goodwill is attributable to synergies with current operations within the Group. The value of goodwill is not deductible for tax purposes.
Acquisition-related expenses
Acquisition-related expenses amount to SEK 1.5 million (-) and relate to consultancy fees for due diligence. These expenses have been recognised as other operating expenses in the Statement of Income.
2021
No acquisitions of business operations were made in 2021.
2022 2021
Intangible assets 104.6Buildings and land -Other fixed assets 3.5Inventories 22.8Trade and other receivables 71.3Cash and cash equivalents 17.0Trade payables and other operating liabilities -47.2Deferred tax liability -13.1Net identifiable assets and liabilities 159.1 –Consolidated goodwill 70.0CONSIDERATION TRANSFERRED 229.1 –
The Group Parent Company 2022 2021 2022 2021 Remeasurement of contingent consideration 1.1 -Government support grants* 2.3 2.9 -Other information 0.2 -TOTAL 2.3 4.1 0.0 0.0
60 OEM 2022
Contingent consideration
It is stated in the acquisition agreement for the acquisition made in 2022 that a contingent consideration will be payable to the vendors based on the development of the performance. Contingent consideration is capped at SEK 79.5 million and is estimated at SEK 77.8 million in the acquisition cost analysis, comprising a current portion of SEK 24.8 million and a non-current portion of SEK 53.0 million. Contingent consideration is payable in Euros and is measured on an ongoing basis.
The contingent consideration has been calculated using weighted probability techniques.
Remeasurement of contingent consideration
The development of acquired business has not resulted in remeasurement of contingent consideration recognised as a liability except for foreign currency remeasurement. Acquisition-related consideration liabilities (both absolute and contingent) on 31 December 2022 totalled SEK 91 million (1.4).
Further information about intangible assets is presented in Note 12
Cont. Note 4 2022 2021 Remuneration Service fees paid 146.2Due in accordance with agreement 5.1Estimated contingent consideration 77.8TOTAL CONSIDERATION TRANSFERRED 229.1 –
OEM 2022 61
Note 5
Employees and staff costs
AVERAGE NUMBER OF EMPLOYEES 2022 Of which men 2021 Of which men Parent Company Sweden 22 77% 20 80% Subsidiaries Sweden 495 75% 466 75% Denmark 35 86% 36 86% United Kingdom 59 86% 66 80% Ireland 49 65% Estonia 3 100% 3 100% Finland 168 88% 163 86% The Netherlands 2 50% 2 50% China 20 75% 20 75% Lithuania 2 100% 2 100% Norway 24 83% 22 82% Poland 49 80% 49 80% Slovakia 5 60% 5 60% Czech Republic 28 82% 27 81% Hungary 6 100% 5 100% Total in subsidiaries 946 79% 866 79% GROUP TOTAL 968 79% 886 79% SALARIES, OTHER REMUNERATION AND SOCIAL SECURITY EXPENSES 2022 2021 Salaries and remuneration Social security expenses Salaries and remuneration Social security expenses Parent Company 24.7 9.7 20.9 8.7 (of which pension expenses) (3.1) (2.8) Subsidiaries 471.1 161.6 402.1 143.0 (of which pension expenses) (36.0) (32.1) GROUP TOTAL 495.8 170.4 423.0 151.7 (of which pension expenses) (39.1) (34.9) SALARIES AND OTHER REMUNERATION ACROSS THE PARENT COMPANY AND SUBSIDIARIES AND BETWEEN SENIOR EXECUTIVES AND OTHER EMPLOYEES 2022 2021 Senior executives including the Board Other employees Senior executives including the Board Other employees Parent Company Sweden, of which senior executives 11 people (11) 13.8 10.9 13.1 7.8 (of which bonus) (3.8) (3.6) Subsidiaries total, of which senior executives 24 people (24) 32.0 439.0 26.7 375.4 (of which bonus) (6.2) (5.5) GROUP TOTAL, OF WHICH SENIOR EXECUTIVES 35 PEOPLE (35) 45.9 449.9 39.8 383.2 (of which bonus) (10.0) (9.1) Pension premiums to the amount of SEK 6.5 million (5.6) have been paid for the category senior executives. 62 OEM 2022
REMUNERATION OF GROUP MANAGEMENT AND BOARD MEMBERS
* Of the other senior executives, five (four) people receive remuneration from subsidiaries. This remuneration is included at an amount of SEK 9.3 million (8.4). Pension expenses were SEK 1.9 million (2.2).
CEO /Managing Director
Pension expenses are defined contribution. There are no other pension obligations. As in previous years, variable remuneration is based on the performance levels attained. SEK 2.9 million was paid in variable remuneration in 2022. Variable remuneration payment totalled SEK 2.7 million in 2021. The maximum amount of variable remuneration was paid for 2022 and 2021. The period of notice for the Managing Director is 24 months from the company's side, with the obligation to work, and 6 months from the Managing Director's side. Retirement age for the Managing Director is 62 years. The CEO/ Managing Director's salary and remuneration is set by the Board.
Other senior executives
Pension expenses are defined contribution. There are no other pension obligations. Variable remuneration payment totalled SEK 3.4 million in 2022. Variable remuneration payment totalled SEK 3.0 million in 2021. Based on the attained profit level, variable remuneration can be paid at a maximum of 40% of base salary. The period of notice for other members of Group management is maximum 12 months, upon termination by the company, with the obligation to work, and maximum 6 months upon termination by the employee. If the company serves notice after the age of 55 years, the period of notice is increased by an additional six months.
Retirement age for the other members of Group management is between 60 and 65 years.
Guidelines for remuneration and other terms of appointment of senior executives
Guidelines for senior executives, approved by the 2022 Annual General Meeting, state that the Managing Director, Group management and other managers who report directly to the Managing Director shall have market-competitive salaries and other remuneration terms. Share-based compensation, so-called incentive schemes, shall be presented for approval at the Annual General Meeting. In addition to a basic pay, the management can also receive variable remuneration, which can amount to a maximum of eight monthly salaries. Senior executives shall have premium-based pension schemes, capped at 30% of fixed remuneration. The period of notice on the company's part may not exceed 24 months and involves the obligation to work during the period of notice. Employment agreements shall not contain provisions for severance pay.
2022 2021 Base pay, board fee Variable remuneration Other benefits Pension expense Total Base pay, board fee Variable remuneration Other benefits Pension expense Total Petter Stillström Chairman of the Board 0.5 - - - 0.5 0.5 - - - 0.5 Ulf Barkman, Board member 0.3 - - - 0.3 0.3 - - - 0.3 Mattias Franzén, Board Member 0.3 - - - 0.3 0.3 - - - 0.3 Richard Pantzar, Board Member 0.3 - - - 0.3 0.3 - - - 0.3 Jörgen Rosengren Board member 0.3 - - - 0.3 0.3 - - - 0.3 Per Svenberg, Board member 0.3 0.3 0.3 - - - 0.3 Åsa Söderström Winberg, Board member 0.3 - - - 0.3 0.3 - - - 0.3 Jörgen Zahlin, Managing Director 4.7 2.9 - 1.2 8.8 4.6 2.7 - 1.1 8.4 6.8 2.9 - 1.1 10.9 6.7 2.7 - 1.1 10.4 Other senior executives 8 persons (6) * 10.0 3.4 0.3 2.7 16.3 9.2 3.5 0.4 3.0 16.0 TOTAL 16.8 6.3 0.3 3.9 27.2 15.8 6.1 0.4 4.1 26.4
GENDER DISTRIBUTION Group (percentage of women) Parent (percentage of women) 2022 2021 2022 2021 Board of Directors 8% 6% 14% 14% Other senior executives 0% 0% 0% 0%
5 OEM 2022 63
Cont. Note
Note 6
Fees and reimbursement of expenses to the auditors
Of the remuneration to auditors in 2022, the following has been paid to Öhrlings PricewaterhouseCoopers in Sweden: Audit servic es SEK 2.0 million (1.5), other statutory services SEK - million (-), tax advice SEK - million (-) and other services SEK - millio n (-). Audit assignments refer to the auditing of the Annual Report, the consolidated financial statements, the accounting records and the administration by the Board of Directors and the Managing Director, other tasks that are the duty of the company's auditors, as well as advice and other assistance resulting from observations made during such audits or the performance of other such duties. Tax counselli ng refers to all consultations in the area of tax. "Other assignments" refers to advice on accounting matters and advice on processes and intern al control.
Note 7
Depreciation/amortisation and impairment of property, plant and equipment and intangible fixed assets
Note 8
Income from interests in Group companies
The Group Parent Company PwC 2022 2021 2022 2021 Audit assignments 3.4 2.7 0.9 0.6 Non-audit services - - -Tax counselling - - -Other services - - -3.4 2.7 0.9 0.6 Other auditors Audit assignments 0.6 -Tax counselling 0.1 -Other assignments - -0.6 0.0 -TOTAL 3.9 2.7 0.8 0.6
The Group Parent Company 2022 2021 2022 2021 Customer relationships -6.6 -12.1 -Patents - 0.0 -Supplier relationships -21.7 - -Expenses brought forward for software -2.3 -2.5 -1.8 -2.0 Buildings and land -31.5 -28.1 -0.5 -0.4 Fixtures, fittings, tools and equipment -26.5 -26.2 -1.6 -1.5 TOTAL -88.6 -69.0 -3.8 -3.9
Parent Company 2022 2021 Dividends received 142.4 89.7 Capital gains on liquidation 4.9 0.0 Impairment of interests in Group companies -TOTAL 147.2 89.7 64 OEM 2022
Note 9
Finance income/other interest income and similar income
Note 10
Finance expense/interest expense and similar charges
Note 11
RECOGNISED IN STATEMENT OF INCOME/INCOME STATEMENT
The Group holds SEK - million (0.5) in non-capitalised deferred tax assets equivalent to loss carryforwards which, when measured cannot be considered available for use because the surplus cannot be offset against these within a reasonable future period. The acquisition of subsidiaries affected the deferred tax liability by SEK 11.4 million (-).
The Group Parent Company 2022 2021 2022 2021 Interest on bank deposits 1.5 0.3 4.5 1.2 Other finance income 3.5 0.2 3.2TOTAL 5.0 0.5 7.7 1.2
The Group Parent Company 2022 2021 2022 2021 Interest expense on financial liabilities -8.5 -3.0 -5.4 -1.2 Other finance expense -7.6 - -12.4 -1.4 TOTAL -16.0 -3.0 -17.9 -2.6
Income tax
The Group Parent Company 2022 2021 2022 2021 Current tax -134.4 -106.7 -78.2 -66.2 Deferred tax -14.0 -12.1 0.2 0.0 TOTAL RECOGNISED TAX EXPENSE -148.4 -118.9 78.0 -66.2 LINK BETWEEN TAX EXPENSES FOR THE YEAR AND INCOME BEFORE TAX Reported profit before tax 724.1 575.9 519.8 405.5 Estimated tax on reported profit before tax as per applicable tax rate for income tax in each country -140.5 -116.0 -107.1 -83.5 Non-taxable share dividends 29.3 18.5 Non-taxable income 4.5 2.4 1.0Non-deductible items -12.4 -5.3 -1.3 -1.1 Impact of changed tax rate - -TOTAL RECOGNISED TAX EXPENSE -148.4 -118.9 78.0 -66.2 Deferred tax assets 7.0 6.7 -TOTAL DEFERRED TAX ASSETS 7.0 6.7 0.0 0.0 Deferred tax liability Intangible fixed assets 13.4 3.0 -Buildings and land 10.9 10.1 1.7 1.9 Untaxed reserves 108.3 91.7 -Other information 1.3 0.8 -TOTAL DEFERRED TAX LIABILITY 133.9 105.5 1.7 1.9
OEM 2022 65
Note 12
Intangible fixed assets
The acquisition of the operations of Demesne Electrical Sales Ltd increases the value of supplier relationships by SEK 104.6 million and goodwill by SEK 70.0 million. The estimated useful life of the supplier relationships is five years.
THE GROUP 2022 Goodwill Trademarks Customer relationships Supplier relationships Patents Software Total Accumulated cost At beginning of year 158.3 43.4 151.8 45.6 0.3 41.6 441.0 New acquisitions 2.8 2.8 Acquisition of subsidiaries 70.0 104.6 174.6 Sales and disposals 0.0 Exchange rate differences for the year 11.6 0.9 6.5 11.1 - 0.0 30.2 Total cost of acquisition 240.0 44.3 158.3 161.3 0.3 44.4 648.6 ACCUMULATED AMORTISATION At beginning of year -43.4 -135.1 -36.8 -0.3 -36.8 -252.4 Amortisation -6.6 -21.7 -2.3 -30.6 Sales and disposalsExchange rate differences for the year -0.9 -6.2 -2.9 - 0.0 -10.0 Total amortisation - -44.3 -147.9 -61.4 -0.3 -39.1 -293.0 ACCUMULATED IMPAIRMENTS At beginning of year -11.2 -0.3 -11.5 Sales and disposalsImpairmentsExchange rate differences for the year 0.0 0.0 Total impairments -11.2 - -0.3 - - - -11.5 CARRYING AMOUNT AT END OF YEAR 228.7 - 10.1 99.9 0.0 5.3 344.1 Total carrying amount relating to
and software at year-end was SEK 115.3 million (29.9) 2022
trademarks, customer relationships, supplier relationships, patents
66 OEM 2022
Cont. Note 12
Intangible fixed assets
Total carrying amount relating to trademarks, customer relationships, supplier relationships, patents and software at year-end was SEK 29.9 million (41.0)
2021
SEK 2.3 million, relating to customer relationships, is recognised as a result of the acquisition of the assets of the company Norwegian Export Import AS. The estimated useful life of the customer relationships is five years.
Impairment testing of customer relationships
Impairment testing of customer relationships refers to part of customer relationships from the acquisition of the assets of the company Finisterra AS in 2019.
THE GROUP 2021 Goodwill Trademarks Customer relationships Supplier relationships Patents Software Total Accumulated cost At beginning of year 157.0 43.3 145.0 45.3 0.3 41.1 431.9 New acquisitions 2.4 0.4 2.8 Acquisition of subsidiariesSales and disposalsExchange rate differences for the year 1.3 0.1 4.5 0.3 0.1 6.3 Total cost of acquisition 158.3 43.4 151.8 45.6 0.3 41.6 441.0 ACCUMULATED AMORTISATION At beginning of year -43.3 -119.3 -36.5 -0.3 -34.3 -233.6 Amortisation -12.1 0.0 -2.5 -14.6 Sales and disposalsExchange rate differences for the year -0.1 -3.7 -0.3 - 0.0 -4.1 Total amortisation - -43.4 -135.1 -36.8 -0.3 -36.8 -252.4 ACCUMULATED IMPAIRMENTS At beginning of year -11.2 -0.3 -11.5 Sales and disposalsImpairmentsExchange rate differences for the year 0.0 0.0 Total impairments -11.2 -0.3 -11.5 CARRYING AMOUNT AT END OF YEAR 147.1 - 16.4 8.8 0.0 4.8 177.1
OEM 2022 67
GOODWILL AND INTANGIBLE ASSETS WITH AN INDETERMINABLE USEFUL LIFE
The above amounts relate to goodwill amounting to SEK 228.7 million (147.1) and acquired supplier relationships for Telfa AB amounting to SEK 8.8 million (8.8).
These are long-standing supplier relationships with an indefinite useful life that are appraised as stable over the foreseeable future. The values in use are based on estimated future cash flows with the starting point in existing business plans for the next year. The amounts are calculated using the value-in-use methodology. The principal assumptions for the measurement for all cash-generating units are assumptions about margins and volume growth. The business plans are based on experience from previous years, but take the companies' forecasts for anticipated future growth into consideration. Current market shares are expected to increase marginally in the forecast period. The growth in sales and earnings in the operations is expected to be in line with the business plans. Net cash flow growth is expected to come in at 2% (2%) for other years after the forecast period of 1 year. The gross profit margins are expected to reach the same level as at the end of 2022. The forecast cash flows have been converted to a present value using a discount rate per segment before tax of 9% for Sweden, 8% for Finland, the Baltic states and China, and 9% for Denmark, Norway, the British Isles and East Central Europe. The values in use of the units exceed their carrying amounts. The company's management believes no reasonably possible change in the key assumptions would cause the carrying values of the units to exceed the estimated values in use.
Impairment test for intangible assets
Impairment tests have been performed at segment level on cash-generating units containing goodwill and intangible assets with indefinite useful lives, which is considered to be the smallest cash-generating unit, based on the value in use of the units.
The company's management has produced alternative projections that take account of reasonably possible changes in key assumptions on discount rates and growth. A 12% change in the discount rate applied across all operating segments would not give rise to any need for impairment. The Group's budget and business plans during the forecast period contain increases in sales, gross margins, earnings and cash flows. Nor would an assumption on 0% growth rate give rise to any need for impairment.
Cont. Note 12
2022 2021 Companies Goodwill OEM Automatic AB 3.3 3.3 OEM Electronics AB 5.0 5.0 Internordic Bearings AB 3.1 3.0 OEM Motor AB 12.0 12.0 Elektro Elco AB 32.4 32.5 Svenska Helag AB 3.0 3.0 Svenska Batteripoolen AB 1.8 1.8 Nexa Trading AB 12.0 12.0 AB Ernst Hj Rydahl Bromsbandfabrik 6.0 6.0 ATC Adhesive Tape Converting AB 3.0 3.0 OEM Finland OY 20.6 18.9 Akkupojat OY 2.2 2.0 RauHeat OY 13.3 12.2 OEM Automatic Klitsø AS 27.3 25.1 Zoedale Ltd 7.5 7.3 Balfe Securities Ltd 76.2 228.7 147.1 Supplier relationships with an indeterminable useful life Telfa AB 8.8 8.8 TOTAL 237.5 155.9
68 OEM 2022
Cont. Note 12
Expenses brought forward for software are written off during its estimated useful life of five years.
PARENT COMPANY 2022 2021 Expenses brought forward for software Accumulated cost of acquisition At beginning of year 39.1 38.9 New acquisitions 2.8 0.1 Asset retirementTotal cost of acquisition 41.9 39.1 Accumulated amortisation At beginning of year -35.5 -33.6 Amortisation -1.8 -2.0 Asset retirementTotal amortisation -37.3 -35.5 CARRYING AMOUNT AT END OF YEAR 4.6 3.5 Accumulated accelerated amortisation At beginning of year -1.4 -1.7 Change for the year 1.0 0.2 TOTAL ACCUMULATED ACCELERATED AMORTISATION -0.5 -1.4
OEM 2022 69
Note 13
Property, plant and equipment
RECOGNISED AMOUNTS OWNED PROPERTY, PLANT AND EQUIPMENT
THE GROUP 2022 2021 Buildings and land Fixtures, fittings, tools and equipment Buildings and land Fixtures, fittings, tools and equipment Accumulated cost of acquisition At beginning of year 368.2 175.4 321.0 167.2 New acquisitions 1.3 17.3 43.2 7.7 Cost of acquisitions taken over upon acquisition 24.0 -Sales and disposals -6.3 -4.2 -0.5 -2.6 Reclassifications 3.9 -3.9 -Exchange rate differences for the year 12.8 6.8 4.5 3.1 Total cost of acquisition 379.9 215.4 368.2 175.4 Accumulated depreciation according to plan At beginning of year -100.8 -146.2 -90.9 -134.1 Accumulated depreciation taken over upon acquisition -20.3 -Sales and disposals 3.7 3.4 0.5 2.1 Depreciation for the year -9.0 -12.6 -8.9 -11.6 Reclassifications 0.2 -Exchange rate differences for the year -3.6 -5.8 -1.5 -2.6 Total depreciation -109.7 -181.3 -100.8 -146.2 CARRYING AMOUNT AT END OF YEAR* 270.1 34.0 267.4 29.2 * The carrying amount of buildings is SEK 231.9 (231.5) for the Group and SEK 12.2 (11.5) for the Parent Company. PARENT COMPANY 2022 2021 Buildings and land Fixtures, fittings, tools and equipment Buildings and land Fixtures, fittings, tools and equipment Accumulated cost of acquisition At beginning of year 29.4 17.2 28.6 16.9 New acquisitions 1.1 0.9 1.3 0.5 Sales and disposals -1.9 -0.5 -0.2 30.5 16.2 29.4 17.2 Accumulated depreciation according to plan At beginning of year -16.4 -13.2 -16.4 -12.0 Sales and disposals 1.4 0.5 0.2 Depreciation for year acc. to plan based on cost -0.5 -1.6 -0.4 -1.5 -16.9 -13.3 -16.4 -13.2 CARRYING AMOUNT AT END OF YEAR 13.6 2.9 13.0 4.0 Accumulated accelerated depreciation At beginning of year - -1.2 - -1.1 Change for the year - 0.2 - -0.2 TOTAL ACCUMULATED ACCELERATED DEPRECIATION - -1.0 - -1.2 THE GROUP 2022 2021 Owned property, plant and equipment 304.2 296.5 Property, plant and equipment through right-of-use 51.7 47.4 TOTAL PROPERTY, PLANT AND EQUIPMENT 355.8 343.8 70 OEM 2022
Cont. Note 13
RECOGNISED AMOUNTS PROPERTY, PLANT AND EQUIPMENT THROUGH RIGHT-OF-USE
THE GROUP Recognised amounts in the balance sheet 31 Dec 2022 31 Dec 2021 Right-of-use assets Real estate 37.6 30.7 Machinery and equipment 0.2 0.3 Vehicles 13.9 16.3 TOTAL RIGHT-OF-USE ASSETS 51.7 47.4 Lease liabilities Current 26.9 26.3 Non-current 22.8 20.5 TOTAL LIABILITIES ARISING FROM RIGHT-OF-USE ASSETS 49.7 46.8 THE GROUP Recognised amounts in the income statement 2022 2021 Amortisation of right-of-use assets Real estate -22.4 -19.2 Machinery and equipment -0.4 -0.2 Vehicles -13.6 -14.5 TOTAL AMORTISATION OF RIGHT-OF-USE ASSETS -36.4 -34.0 Interest expense (included in finance expense) -0.8 -0.9 Costs attributable to short-term leases (included in other expenses)Costs attributable to leases with underlying assets of low value (included in other expenses) -0.2 -0.2 The total cash flow for leases in 2022 was SEK 37.2 million (34.9) OEM 2022 71
Note 14
Interests in Group companies
SPECIFICATION OF THE PARENT COMPANY'S DIRECT AND INDIRECT SHAREHOLDINGS IN SUBSIDIARIES
PARENT COMPANY 2022 2021 Book value At beginning of year 408.4 374.4 Acquisitions for the year 223.6 41.1 Remeasurement of contingent considerations 7.0 -0.7 Liquidations -6.7 -6.5 Impairments -CLOSING BALANCE 632.3 408.4
Corp. id. no. Reg. office No. of shares Share of capital Par value Book value 2022 Book value 2021 Sweden OEM Automatic AB, Sweden 556187-1012 Tranås 20,000 100% 100 16.0 16.0 OEM Motor AB, Sweden 556650-6498 Tranås 1,000 100% 100 18.4 18.4 Telfa AB, Sweden 556675-0500 Gothenburg 1,000 100% 100 10.0 10.0 Apex Dynamics Sweden AB, Sweden 556771-7466 Täby 1,000 100% 100 0.1 0.1 Svenska Batteripoolen AB, Sweden 556929-8291 Tranås 5,000 100% 100 0.5 0.5 Elektro Elco AB, Sweden 556564-2716 Jönköping 1,000 100% 100 68.0 68.0 OEM Electronics AB, Sweden 556054-3828 Tranås 3,500 100% 100 15.4 15.4 Internordic Bearings AB, Sweden 556493-8024 Nässjö 1,000 100% 100 12.2 12.2 Svenska Helag AB, Sweden 556225-9639 Borås 1,020 100% 100 12.6 12.6 Flexitron AB, Sweden (liquidated in 2022) 556414-6982 Täby 5,000 100% 100 - 0.4 Agolux AB, Sweden 556892-3774 Tranås 5,000 100% 100 0.5 0.5 Nexa Trading AB, Sweden 556327-6319 Gothenburg 2,000 100% 100 32.4 32.4 ATC Adhesive Tape Converting AB, Sweden 556242-6121 Järfälla 2,000 100% 100 11.5 11.5 IBEC B.V., Netherlands - - - 100% - 0.8 0.8 AB Ernst Hj Rydahl Bromsbandfabrik, Sweden 556535-6556 Karlstad 11,000 100% - -RF Partner AB, Sweden (liquidated in 2022) 556498-5298 Mölndal 1,000 100% 100 - 3.7 ATB Drivtech AB, Sweden (liquidated in 2022) 556315-6974 Ekerö 150 100% 1,000 - 1.9 Cabavo AB, Sweden (liquidated in 2022) 559211-3111 Täby 500 100% 100 - 0.9 Finland, the Baltic states and China OEM Finland OY, Finland - - - 100% - 43.7 43.7 Akkupojat OY, Finland - - - 100% - 6.3 6.3 Scannotec OY, Finland - - - 100% - 2.1 2.1 Sitek-Palvelu OY, Finland - - - 100% - 0.8 0.8 Rauheat OY, Finland - - - 100% - 26.7 26.7 OEM Eesti Ou., Estonia - - - 100% - 0.0 0.0 OEM Automatic SIA, Latvia - - - 100% - 0.0 0.0 OEM Automatic UAB, Lithuania - - - 100% - 0.0 0.0 OEM Automatic (Shanghai) Ltd, China - - - 100% - 0.0 0.0 72 OEM 2022
SPECIFICATION OF THE PARENT COMPANY'S DIRECT AND INDIRECT SHAREHOLDINGS IN SUBSIDIARIES
Note 15
Inventories
Group impairment of inventories at the close of 2022 was SEK 50.6 million (34.9), which represents approximately 4% (4%) of the cost of the stock. To determine impairment of stock, the Group uses set obsolescence models and individual assessment of each item of inventory. Swedish companies that do not use an obsolescence schedule instead use the flat-rate 3% option. Based on the lowest value principle, no impairment has arisen. Costs to scrap items and change in impairment reserve are included in goods for resale in the consolidated Statement of Income. From 2022, advances to suppliers are recognised as inventories as they refer to goods purchased. This has also been taken into account in the comparative year figures.
Note 16
Prepaid expenses and accrued income
Cont. Note 14
Corp. id. no. Reg. office No. of shares Share of capital Par value Book value 2022 Book value 2021 Denmark, Norway, the British Isles and East Central Europe OEM Automatic Klitsø A/S, Denmark - - - 100% - 46.5 46.5 OEM Automatic AS, Norway - - - 100% - 3.5 3.5 OEM Automatic Ltd, UK - - - 100% - 5.4 5.4 OEM Automatic Sp.z.o.o., Poland - - - 100% - 0.0 0.0 OEM Automatic spol.s.r.o., Czech Republic - - - 100% - 15.5 15.5 OEM Automatic s.r.o., Slovakia - - - 100% - 0.0 0.0 OEM Automatic Kft, Hungary - - - 100% - 1.2 1.2 Balfe Securities Ltd, Ireland - - - 100% - 230.6Other business units Internordic Förvaltning AB, Sweden 556302-0873 Nässjö 1,000 100% 100 1.3 1.3 OEM Logistics AB, Sweden 556194-8521 Stockholm 2500 100% 100 1.6 1.5 Intermate Electronics AB, Sweden 556266-6874 Tranås 1,000 100% 100 0.6 0.6 OEM Fastighetsbolag AB, Finland - - - 100% - 1.4 1.4 OEM Property Ltd, UK - - - 100% - 5.1 5.1 Brake Components AB, Sweden 559000-6499 Tranås 1,000 100% 100 0.1 0.1 Bankerydsbackens Fastighetsbolag AB 559013-6817 Tranås 1,000 100% 100 0.1 0.1 OEM Fiskarinkatu 6 AB, Finland - - - 100% - 41.1 41.1 Lerbackens Fastighetsbolag AB, Sweden 559398-1680 Tranås 1,000 100% 100 0.1TOTAL 632.3 408.4
The Group 2022 2021 Work in progress 85.6 77.9 Finished goods and merchandise 1,100.2 694.5 Advances to suppliers 47.3 47.7 Goodwill impairment -50.6 -34.9 TOTAL 1,182.5 785.3
OEM 2022 73
The Group Parent Company 2022 2021 2022 2021 Accrued commission income, etc. 1.2 0.6 -Prepaid rent expense - - 0.0 0.0 Prepaid insurance costs 1.8 1.9 0.8 0.3 Prepaid IT costs 5.3 4.3 4.7 3.7 Other prepaid expenses 18.8 17.1 0.5 4.8 TOTAL 27.1 19.6 6.0 5.1
The shares consist of Class A and Class B. The face value is SEK 0.28 (0.56)*.
REPURCHASED TREASURY SHARES INCLUDED IN THE EQUITY ITEM RETAINED EARNINGS, INCLUDING PROFIT FOR THE YEAR
* A 3:1 share split combined with an automatic redemption procedure was executed in 2022. This process gave each shareholder two new shares and one redemption share, which was redeemed. This means that the number of shares in the company has increased twice.
The Group's translation reserve
The translation reserve includes all exchange differences arising on the translation of financial statements from foreign operations that have prepared their financial statements in a currency other than that used in the consolidated financial statements. The Parent Company and the Group present their financial statements in Swedish krona.
Parent company's restricted funds
Restricted funds may not be reduced through the payment of dividends.
Reserve fund
The purpose of a reserve fund has been to save a proportion of the net earnings not required to cover retained losses. The amount which before 1 January 2006 went to the share premium account has been transferred to the reserve fund.
Development fund
When internally generated intangible assets are capitalised, a corresponding amount is transferred to a development fund classed as restricted equity. The fund is wound up at the same rate as the capitalised item is amortised.
Parent company's distributable equity
The following funds and profit for the year together constitute a distributable reserve, i.e. the amount available for distribution to shareholders as a dividend.
Retained earnings
Retained earnings are the profits and income that remain from the prior year after paying dividends.
Capital management
The Board's aim is to achieve a good return on total capital with a limited
financial risk during stable growth.
The target for one business cycle for 2020 to 2022 has been:
• Minimum sales growth of 10% per annum
• A minimum EBITA margin of 10% per annum
• A minimum return on equity of 20% per annum
• A minimum equity/assets ratio of 35%
New targets were approved by the Board of Directors in February 2023. The targets for one business cycle thereafter will be:
• Minimum sales growth of 10% per annum
• A minimum EBITA margin of 12% per annum
• A minimum return on equity of 25% per annum
• Debt/equity ratio below 100%
Allocation of profits
After the balance sheet date, the Board proposed a dividend of SEK 1.50 per share (1.38*). The Board aims to propose a reasonable dividend of profits to the shareholders, by taking into account the financial position, the tax situation and any need for acquisitions or investments in the operation. Retained earnings in the Parent Company total SEK 547.6 million. The Board recommends a SEK 207.9 million dividend and that SEK 339.6 million be carried forward.
* The dividend for 2021 has been adjusted following the 3:1 share split and automatic redemption of every third share in Q2 2022. The dividend has been adjusted by a factor of 2, since the financial implication is a 2:1 split combined with an extraordinary dividend.
17 Equity 2022 2021 Shares Voting rights Shares Voting rights Class A shares 10 votes 28,462,176 284,621,760 14,231,088 142,310,880 Class B shares 1 vote 110,553,678 110,553,678 55,276,839 55,276,839 TOTAL NUMBER OF TREASURY SHARES* 139,015,854 395,175,438 69,507,927 197,587,719 Repurchased treasury shares -371,082 -371,082 -185,541 -185,541 TOTAL NUMBER OF SHARES OUTSTANDING* 138,644,772 394,804,356 69,322,386 197,402,178
Note
Number of shares Amounts that affected equity 2022 2021 2022 2021 Opening repurchased own shares 371,082 185,541 23.3 23.3 CLOSING REPURCHASED TREASURY SHARES* 371,082 185,541 23.3 23.3
Outcome over the last three years: 2022 2021 2020 Sales growth 25% 15% 0% EBITA margin 16% 16% 13% Return on equity 39% 33% 26% Equity/assets ratio 57% 67% 69%
74 OEM 2022
Note 18
Liabilities to credit institutions and lessors
Liabilities that fall due for payment later than five years after the balance sheet date amount to SEK 6.2 million (7.0).
for payment as shown below:
* Lease liabilities relate to premises, machinery, equipment and vehicles as required under IFRS 16.
** The overdraft has a covenant, which means that the Group must have an equity/assets ratio that does not drop below 35%.
As at 31 December 2022, the Group's equity/assets ratio stood at 57% (67%).
See Note 24 for additional information about bank loans and overdrafts.
See Note 21 for information about pledged assets for own liabilities.
Note 19
Provisions for pensions and similar obligations
The Group 2022 2021 Other non-current liabilities Bank loan 9.8 10.0 Lease liabilities* 22.8 20.5 TOTAL 32.6 30.4
Current liabilities Overdrafts** 316.7 32.9 Current bank loans 1.0 1.1 Lease liabilities* 26.9 26.3 TOTAL 344.6 60.3 LEASE LIABILITIES 2022 2021 Lease liabilities fall
Within one year 26.9 26.3 Between one and five years 22.8 20.5 Later than in five years -TOTAL 49.7 46.8
due
The Group 2022 2021 Present value of entirely or partially funded obligations 8.3 6.5 Fair value of plan assets -6.4 -5.7 Net of entirely or partially funded obligations 1.9 0.8 The net amount recognised in the following items in the Statement of Financial Position: Provisions for pensions and similar obligations 1.9 0.8 Net amount in the Statement of Financial Position (obligations + assets -) 1.9 0.8 The net amount is split over plans in the following countries: Norway 1.9 0.8 Net amount in the Statement of Financial Position (obligations + assets -) 1.9 0.8 OEM 2022 75
The principal assumptions used for the purpose of the actuarial valuations were as follows:
In Norway, all employees are covered by defined-benefit pension schemes. SEK 0.9 million is expected to be paid in contributions for the schemes during 2023. In other countries, except for Sweden, all employees are covered by defined-contribution schemes. The company pays defined contributions to a separate legal entity and has no obligation to pay additional amounts. Costs are expensed on the consolidated income statement as the benefits are earned. Pension obligations related to the defined-benefit ITP 2 scheme for retirement and family pensions for salaried employees in Sweden are underwritten with insurance provided by Alecta. According to statement UFR 10 Reporting for Pension Scheme ITP 2, issued by the Swedish Financial Reporting Board, the ITP 2 scheme, which is underwritten by the Alecta insurance company, is a defined-benefit multi-employer scheme. For the 2022 financial year, the company did not have access to information that would enable it to report its proportionate share of the scheme's obligations, plan assets and costs. Consequently, it has not been possible to report the scheme as a defined-benefit pension scheme. The ITP 2 pension scheme, which is provided for by means of insurance with Alecta, is therefore reported as a defined-contribution pension scheme. The premium for the defined-benefit retirement and family pension is calculated individually and is based on such factors as the salary, previously earned pension and expected remaining length of service. Expected contributions in the next reporting period for ITP 2 insurance with Alecta amount to SEK 1.5 million (1.6). The Group's share of the total contributions to the pension scheme is 0.007% (0.006%), while its share of the total number of active members in the
scheme is 0.011% (0.011%). The collective consolidation level comprises the market value of Alecta's assets as a percentage of the insurance commitments calculated according to Alecta's actuarial methods and assumptions, which are not consistent with IAS 19. The collective consolidation level is normally allowed to vary between 125% and 175%. If Alecta's consolidation level falls below 125% or rises above 175%, measures must be taken to enable the consolidation level to return to the normal range. If the consolidation level is low, an appropriate measure might be to introduce premium reductions. At the end of 2022, Alecta's surplus, in the form of the collective consolidation level, was 172 per cent (148). The premiums to Alecta are determined by assumptions regarding interest rates, life expectancy, operating costs and tax on returns, and is calculated in order that the payment of a consistent amount of premium up to the date of retirement is sufficient to ensure that the entire, targeted benefit, based on the insured's current pensionable salary, is, in fact, earned. There is no agreed framework to guide the process of managing any deficit that may arise. In the first instance, losses will be covered by Alecta's collective consolidation capital and will thus not lead to increased costs through higher contractual premiums. Nor are there guidelines on how any surpluses or deficits should be allocated in the event of dissolution of the scheme or a company's withdrawal from the scheme. Most of the employees in Sweden are covered by defined-contribution pension schemes. The total cost of the Group's defined-contribution schemes is SEK 35.8 million (32.1). The Parent Company's cost for defined-contribution schemes is SEK 3.1 million (2.8).
The Group 2022 2021 Changes in the present value of the obligation for
schemes Obligation for defined-benefit schemes as at 1 January 6.5 8.0 Pensions earned during the period 0.3 0.5 Actuarial gains and losses 1.1 -2.6 Interest on obligations 0.1 0.1 Benefits paid 0.0 0.0 Exchange rate differences 0.2 0.6 Obligations for defined-benefit schemes as at 31 December 8.3 6.5 Change in fair value of plan assets Fair value of plan assets as at 1 January 5.7 6.0 Contributions by employer 0.8 0.6 Benefits paid 0.0 0.0 Transferred to defined-contribution scheme -Interest income recognised in the income statement for the year 0.1 0.1 Return excluding interest recognised in the income statement for the year -0.3 -1.3 Exchange rate differences 0.2 0.4 Fair value of plan assets as at 31 December 6.5 5.7 Expense recognised in the income statement Expense for pensions earned during the year 0.4 0.5 Net interest income/expense 0.0 0.0 Other information 0.0 0.0 TOTAL NET EXPENSE IN THE INCOME STATEMENT 0.5 0.6 ACTUARIAL ASSUMPTIONS
Cont. Note 19
defined-benefit
Discount rate 3.0% 1.9%
76 OEM 2022
Note 20
Other non-current liabilities
Other non-current liabilities relate to the long-term element of contingent considerations.
Note 21
Pledged assets and contingent liabilities
See Note 18 for additional information about the company's liabilities.
Note 22
Accrued expenses and prepaid income
The Group Parent Company 2022 2021 2022 2021 Other non-current, non-interest-bearing liabilities 58.8 - 58.8TOTAL 58.8 – 58.8 –
The Group Parent Company 2022 2021 2022 2021 Accrued salaries and holiday pay 98.1 86.6 7.0 6.6 Accrued social security costs 36.6 31.7 3.9 3.7 Accrued supplier inv./commercial debts 40.3 33.8Other accrued expenses 28.6 22.0 3.4 3.8 TOTAL 203.6 174.1 14.3 14.0
The Group Parent Company 2022 2021 2022 2021 Pledged assets for own liabilities Property mortgages 17.7 17.8 7.5 7.5 Business mortgages 57.0 57.0 -TOTAL 74.7 74.8 7.5 7.5 Contingent liabilities Security undertakings to support subsidiaries – – 195.5 193.1 TOTAL – – 195.5 193.1
OEM 2022 77
Note 23
Untaxed reserves
UNTAXED RESERVES
Deferred tax constitutes SEK 97.7 million (82.9) of untaxed reserves.
Note 24 Financial risks and risk management
The most significant financial risks for the OEM Group are currency and customer credit risks. However the currency risks have been more or less been eliminated through matching. An elimination of risks that helps the Group achieve a relatively stable coverage ratio over time. In addition to the named risks, the Group has a limited interest rate risk in the form of a cash flow risk. The OEM Group's financing activities and financial risks are primarily managed by the Parent Company. This is carried out in accordance with the financial policy approved by the Board of Directors. There are frameworks for how risk management is to be conducted and for how risks are to be limited. These frameworks are characterised by a low risk level. The basis is the structured and efficient management of the financial risks that arise in the business.
OEM is of the opinion that the carrying values of financial assets and liabilities approximate their fair values. The Group's holdings of such financial assets that represent fixed assets are fairly limited. At the close of 2022, the amount of non-current receivables was SEK 0.4 million (0.3). At year-end, the Group's holding of such financial assets that represent current assets amounted to SEK 754 million (566) and accrued income to SEK 1.2 million (0.6) and other receivables to SEK 23 million (8). As shown above, more than 99% of the Group's financial assets are measured at amortised cost under IFRS 9. The financial liabilities are measured at amortised cost, except for contingent considerations which are measured at
their fair values. The Group does not have any liabilities with fixed interest. The risk of a shift in the interest rate causing a significant change in fair value for the Group is thus non-existent. The fair values of interest-bearing liabilities are based on estimates of future cash flows of capital and interest, discounted at market interest rate on the balance sheet date. Contingent considerations are classified within Level 3. The company's contingent considerations were valued at SEK 85.7 million (1.4) at the close of 2022. Refer to Note 4 for further information about contingent considerations.
The items cash and bank balances at SEK 109 million (145), overdrafts at SEK 317 million (33) and other interest-bearing liabilities at SEK 61 million (58) have variable interest rates and are thus exposed to cash flow risk. Overdrafts apply for one (1) year and the requirement is that the equity/assets ratio of the Group does not fall below 35%.
The majority of the Swedish companies are part of a central accounting system with a total limit of SEK 450 million (250), which is the Parent Company's limit. The drawn amount is SEK 228 million (-). The subsidiaries' balance/liability in the central accounting system is reported in the Parent Company, either as a receivable from, or a liability to, the subsidiaries. The total limit in the Group is SEK 689 million (437). The drawn amount is SEK 317 million (33).
Parent Company 2022 2021 Accumulated accelerated amortisation At beginning of year 2.7 2.7 Changes in accelerated amortisation for the year -1.2 -0.1 AT END OF YEAR 1.5 2.7 Accruals funds Allocated in the financial year 2016 - 55.7 Allocated in the financial year 2017 56.0 56.0 Allocated in the financial year 2018 67.0 67.0 Allocated in the financial year 2019 28.0 28.0 Allocated in the financial year 2020 75.0 75.0 Allocated in the financial year 2021 106.0 106.0 Allocated in the financial year 2022 126.0TOTAL 458.0 387.7 TOTAL
459.5 390.4
78 OEM 2022
Cont. Note 24
Financial risks and risk management
FINANCIAL
ASSETS AND LIABILITIES
OEM is of the opinion that the carrying values of financial assets and liabilities approximate their fair values. Definition of categories:
1: Financial assets at amortised cost,
Financial liabilities
LIQUIDITY RISKS
Liquidity risk relates to the risk that the Group will not be able to fulfil its obligations associated with financial liabilities. This is offset, as far as possible, by establishing a maturity profile that makes it possible to take necessary alternative actions to secure capital if necessary. Cash and bank balance at the end of the year was SEK 109 million (145) and financial current assets were SEK 754 million (566). At the close of the year, the Group's financial liabilities were SEK 843 million (384). The maturity profile is presented in the table below. The table shows both capital payments and interest payments.
CONTINGENT CONSIDERATIONS 2022 2021 Opening book value 1.4 7.1 Acquisitions for the year 77.8Recycled to the income statement 0.9 -1.3 Consideration paid -2.3 -4.7 Exchange rate differences 7.9 0.2 Closing book value 85.7 1.4 2022 2021 Total Within month 1–3 months 3 months –1 year 1 year and longer Total Within 11 months 1–3 months 3 months –1 year 1 year and longer Overdrafts* 325.7 - - 285.4 40.3 34.1 1.0 - 33.1Other interest-bearing liabilities 10.9 0.1 0.1 0.9 9.8 11.1 0.0 0.1 1.0 10.0 Trade payables, etc. 415.6 347.5 66.6 1.5 - 293.2 250.1 41.9 1.2Lease liabilities 49.7 2.2 4.5 20.2 22.8 47.5 2.2 4.5 20.0 20.8 801.9 349.8 71.1 308.1 72.9 385.9 253.3 46.5 55.3 30.8
* Overdraft runs for one (1) year at a time. The Group Category 2022 2021 Financial Assets Other non-current receivables 1 0.4 0.3 Trade receivables 1 753.5 566.4 Other receivables 1 23.3 8.0 Cash and cash equivalents 1 108.9 144.8 Financial liabilities Non-current borrowings - non-hedge accounting 4 9.8 10.0 Other non-current liabilities - contingent considerations 3 58.4Current borrowings - non-hedge accounting 4 1.0 1.1 Overdrafts 4 316.7 32.9 Trade payables 4 272.0 205.6 Other liabilities - contingent considerations 3 27.3 4.1 Other liabilities 4 108.9 83.6
loss 4: Financial liabilities at amortised cost. OEM 2022 79
2: Financial assets that are recognised at fair value through profit or loss. 3:
that are recognised at fair value through profit or
Interest rate risks
The interest rate risk is low and essentially consists of the cash flow risk that arises when the items cash and bank balance, overdraft and other interest-bearing liabilities have variable interest rates. A one percentage point change in interest on the balance sheet date would entail a change of SEK -3.3 million (-0.5) in the income statement.
Currency risks
The currency risks are primarily due to purchases being made in foreign currencies. The risks are managed by the customer contract often prescribing that the price must be adjusted in relation to any currency changes. Alternatively, the sale is carried out in the same currency as the purchase. A detailed report is given in connection with the below table.
The currency flow of the Group is attributable to imports from Europe, Asia and North America.
As long as it is possible, the Group eliminates the effects of exchange rate fluctuations by using currency clauses in the customer contract and by purchasing and selling in the same currency. On the whole, purchasing is carried out in the supplier's functional currency. The table shows that 55% (56%) of purchases in 2022 were in EUR, 22% (23%) USD, 3% (2%) GBP, 9% (10%) SEK and 11% (9%) in other currencies. The OEM Group manages the effects of changing exchange rates by currency clauses in the sales contract and by invoicing in the same currency as the corresponding purchase. OEM sells goods to Swedish and foreign customers and either invoices in the purchasing currency or in another currency with currency clauses with regard to the purchase currency. The currency clauses adjust 80% to 100% of the changes in the exchange rate from the sales order to the date of invoicing, depending on whether OEM receives currency compensation for the profit margin or not. There is often a threshold value, which means that exchange rate changes below 2.25% are not taken into account. Currency adjustments are made symmetrically for rising and falling currency rates. Currency clauses and sales in the purchasing currency make up approximately 69% (73%) of all sales contracts. Where purchasing is based on sales orders, economic hedging of currency risks is achieved in sales and purchasing. However, in many cases there is a mismatch in timing between purchase orders and sales orders. Purchase orders normally run 7-60 days prior to delivery. The supplier credit period is approximately 32 days. The currency adjustment clauses means that only currency changes between the time of sale and the time of invoicing affect the amount reported in Swedish Kronor. Since invoicing, in accordance with currency adjustment clauses, is carried out in SEK, there is no exchange rate difference after the date of invoicing. OEM applies the same terms and conditions for adjusting currencies and prices for its Swedish and overseas customers. The changes in values related to the currency clauses are therefore treated consistently from the points of view of risk and accounting. A ten per cent change in exchange rates for the EUR and USD would, using a simplified model, mean a change in turnover of approximately SEK 280 million.
With regard to currency risk, it can be determined that OEM also has balance exposures in the form of net investment in independent foreign operations. At present, these currency risks are not hedged.
Purchases are broken down into percentages as follows:
The sensitivity of the translation exposure to changes in the exchange rate is explained below:
Exchange rates used in the preparation of the accounts to translate the income statements and net assets of foreign subsidiaries:
Cont. Note 24
2022 2021 EUR 55% 56% USD 22% 23% GBP 3% 2% SEK 9% 10% Other currencies 11% 9% 100% 100%
Currency Weighted average 2022 Weighted average 2021 Change EUR 1 10.56 10.08 5% USD 1 10.00 8.51 18% GBP 1 12.37 11.69 6%
Exchange rate changes significant currencies:
Carrying amount 31 Dec 2022 SEK million Sensitivity analysis, +/- 5 % in exchange rate. Impact on the Group's shareholders' equity CZK 12.7 0.6 DKK 41.8 2.1 EUR 481.2 24.1 GBP 54.6 2.7 NOK 10.2 0.5 PLN 23.0 1.1 HUF 2.7 0.1 CNY 21.3 1.1 TOTAL 647.5 32.4
Currency Weighted average 2022 Dec 2022 Weighted average 2021 Dec 2021 NOK 100 104.60 105.27 98.96 101.89 DKK 100 142.08 148.88 135.63 136.73 EUR 1 10.56 11.07 10.08 10.16 GBP 1 12.37 12.47 11.69 12.10 PLN 1 2.26 2.36 2.20 2.21 HUF 100 2.69 2.75 2.79 2.74 CZK 1 0.43 0.46 0.39 0.41 80 OEM 2022
Cont. Note 24
Customer and credit risks
Defined customer limits are carefully decided and strictly applied. Customer limits are assessed at company level. Customer limits and credit risk are set for all new customers via third party credit reference agencies. The credit limits for existing customer are continually updated. These are also assessed with the help of third party credit reference agencies and using internal knowledge about the customer. Short credit periods and absence of risk concentrations for individual customers, segments or geographic areas contribute to a good risk picture, one that is confirmed by the small historical customer losses. Recognised
receivables are measured based on the low level of risk. The Group has approximately 30,000 purchasing customers in total. The largest individual customer accounted for approximately 4% (4%) of sales. The five largest customers accounted for 13% (14%) of sales and the ten largest customers accounted for 17% (19%) of sales. The distribution of risk is thus very good. Bad debt expenses for the year totalled SEK 1.9 million (0.6) which represents 0.01% (0.01%) of sales. The bad debt risk is assessed as low. The average credit period rose to approximately 46 days (43).
AGE ANALYSIS, TRADE RECEIVABLES 2022 2021 Trade receivables not matured 668.9 519.0 Trade receivables matured 0-30 days 72.4 39.4 Trade receivables matured > 30-90 days 9.0 4.9 Trade receivables matured > 90-180 days 2.3 1.4 Trade receivables matured > 180-360 days 0.9 0.6 Trade receivables matured > 360 days 0.0 1.1 TOTAL 753.5 566.4 PROVISIONS EXPECTED CREDIT LOSSES 2022 2021 Balance at beginning of year -1.3 -1.7 Provision for expected losses -1.5 -0.2 Confirmed losses -0.3 0.6 CLOSING BALANCE -3.1 -1.3
OEM 2022 81
Note 25
Cash Flow Statement
Additional disclosures on the cash flow statement The Group Parent Company 2022 2021 2022 2021 Interest received 1.2 0.3 4.5 1.2 Dividends received - 142.4 89.7 Interest paid -8.5 -3.0 -5.4 -1.2 Specification items not included in the cash flow Amortisation and impairment -88.6 -69.0 -3.8 -3.9 Capital gain profits 1.2 0.1 4.4 0.0 Other information -8.1 -0.9 0.5TOTAL -95.5 -69.8 1.1 -3.9 ACQUISITION AND SALE OF SUBSIDIARY COMPANIES AND OPERATIONS – THE GROUP The Group Acquisitions 2022 Acquisitions 2021 Acquired assets and liabilities Intangible assets 104.6Other fixed assets 3.5Inventories 22.8Trade and other receivables 71.3Cash and cash equivalents 17.0Total assets 219.3 –Deferred tax liability 13.1Current operating liabilities 47.2Total liabilities 60.2 –Net 159.1 –Consideration Consideration for acquired units in the current year -229.1Consideration payable 77.8Specified consideration for acquired units before the current year 2.8 -1.2 Deducted: Cash and cash equivalents in the acquired operations 17.0IMPACT ON CASH AND CASH EQUIVALENTS -131.5 -1.2 82 OEM 2022
Cont. Note 25
Cash and cash equivalents
Cash and cash equivalents consist only of bank balances.
Note 26 Incentive programme
At the Annual General Meeting on 26 April 2022, shareholders approved the proposal for a long-term share-based incentive scheme, based on call options for the CEO, senior executives and some other key personnel within the Group. The maximum number of call options under the scheme is 160,000, corresponding to approximately 0.12% of the total number of shares and approximately 0.04% of the number of votes in the company. Using the Black-Scholes method of valuation, the call option price was set at SEK 6.64, which is the market value of the options at the time of acquisition. Each call option entitles the holder to acquire one share in OEM International in the period 1 March 2025 through 15 June 2025.
The exercise price per share is SEK 86.60, equal to 120% of the average price of the company's share on the Nasdaq Stockholm stock exchange in the period 9 May 2022 through 20 May 2022. In 2022, 152,500 call options were subscribed for under the scheme. The Board of Directors has decided that, in order to encourage participation in the scheme, a subsidy in the form of a gross salary supplement will be paid to participants who are still employed by the company on 1 June 2024. The supplement shall not exceed the price paid for the call options. No new shares have been issued for the purpose.
CHANGE IN FINANCIAL LIABILITIES Other financial liabilities Overdrafts Lease liabilities OPENING BALANCE 1 JAN 2022 10.5 32.9 46.8 Approved credit 306.5 Approved credit (non cash-impacting) 7.5 -22.7 39.8 Repayment of credit -7.2 - -36.9 CLOSING BALANCE 31 DEC 2022 10.8 316.7 49.7 OPENING BALANCE 1 JAN 2021 16.0 29.7 60.9 Approved credit 0.8 3.3Approved credit (non cash-impacting) - - 19.9 Repayment of credit -6.3 - -34.0 CLOSING BALANCE 31 DEC 2021 10.5 32.9 46.8
OEM 2022 83
2022 2021 Average exercise price per call option Number of call options Average exercise price per call option Number of call options As at 1 January - - -Allocated during the year 86.60 152,500 -Redeemed/repurchased during the year - - -Exercised during the year - - -As at 31 December 86.60 152,500 -Date of allotment Maturity date Exercise price Stock options 31 December 2022 Stock options 31 December 2021 Incentive programme 2022-2025 20 May 2022 15 June 2025 86.60 152,500TOTAL 152,500 -
Note 27 Information about the Parent Company
OEM International AB (publ) is a Swedish-registered public limited company with its headquarters in Tranås, Sweden. The Parent Company shares are listed on NASDAQ Nordic Mid Cap in Stockholm. The Head Office address is
Förrådsvägen 2, Box 1009, 573 28 Tranås, Sweden. The consolidated financial statements for 2022 incorporate the financial statements of the Parent Company and its subsidiaries, jointly referred to as the Group.
Note 29
Significant estimates and judgements
The company's management and the Audit Committee have discussed the developments, choices and disclosures regarding the Group's significant accounting policies and estimates, as well as the application of these policies and estimates. The recognised values for certain assets and liabilities are based in part on assessments and estimates.
Goodwill impairment testing
Assumptions about future conditions and estimates of parameters were made when calculating the values in use of cash-generating units for the company's goodwill impairment testing. An account of these is given in Note 12. The company's management considers that no reasonably possible change in the key assumptions would cause the carrying amounts of the units to exceed the estimated values in use.
Note 30
Earnings per share
Earnings per share has been based on the following number of shares:
Note 28 Events after the balance sheet date
There are no significant events to report after the close of the reporting period.
Measurement of other intangible assets
Other intangible fixed assets are mainly the values arising on acquisition, comprising SEK 99.9 million for supplier relationships and SEK 10.0 million for customer relationships. The supplier relationships include some with an indeterminable useful life. The remaining SEK 91.1 million have arisen from acquisitions made in 2022 and are written off over a five-year period. There are a maximum of 48 months remaining on the amortisation period. The customer relationships consist of a new market establishment and are expected to be written off over a five-year period. There are a maximum of 45 months remaining on the amortisation period.
per share on the number of outstanding shares
There is no dilutive effect.
Calculations of basic and diluted earnings per share are based on the year's profit attributable to the Parent Company's shareholders.
* * Adjusted for the 3:1 share split and automatic redemption of every third share in Q2 2022. Earlier periods have been adjusted by a factor of 2, since the financial implication is a 2:1 split combined with an extraordinary dividend.
Note 31 Related party disclosures
The OEM Group's related parties consist primarily of senior executives (Note 5), other senior executives (Note 5) and major shareholders. Other than Board fees, salaries and other remuneration, no other remuneration has been paid to related parties. The Parent Company and its subsidiaries
are related parties. See Note 14. The sale of services to the Parent Company's subsidiaries accounts for 100% of its net sales. Related party transactions are priced at market-rate terms and conditions.
2022 2021 Profit/loss for the year 575.7 457.0
138,644,772 138,644,772 2022 2021
Earnings per
in SEK* 4.15 3.30
Average number of outstanding shares*
Earnings
share
84 OEM 2022
Note 32
Proposed allocation of profits
PARENT COMPANY
The following profits are at the disposal of the Annual General Meeting
The Board of Directors proposes that a dividend of SEK 1.50 per share be paid to the shareholders*
and that the following be carried forward
The Board of Director's comments on the dividend proposal may be viewed on the company's website, www.oem.se or is available upon request. The Board of Directors recommends Thursday 20 April 2023 as the record date.
The Board of Directors and the Managing Director declare that the Annual Report has been prepared in accordance with generally accepted accounting policies in Sweden and that the consolidated financial statements have been prepared in accordance with the International Financial Reporting Standards as stipulated in the European Commission's and the Swedish Financial Reporting Board's Regulation (EC) No. 1606/2002 of 19 July, 2002, regarding the application of international accounting standards. The Annual Report and the consolidated financial statements
give a fair and true view of the Parent Company and the Group's financial position and results. The Directors' Report for the Parent Company and the Group, respectively, gives a true and fair summary of the Group's and Parent Company's business operations, financial position and results and describes significant risks and uncertainties faced by the Parent Company and companies included in the Group.
The Annual Report and the consolidated financial statements were approved for publication by the Board of Directors on 16 March 2023. The Group's Statement of Income, Statement of Comprehensive Income and Statement of Financial Position and the Parent Company's Income Statement and Balance Sheet will be matters for approval at the Annual General Meeting on 18 April 2023.
Tranås on the date of our digital signature
Our Auditors' Report was presented on the date of our digital signature
PricewaterhouseCoopers AB
Retained earnings 105,771,774 Profit/loss for the year 441,803,914 547,575,688
207,967,158
339,608,530 547,575,688
Petter Stillström Chairman of the Board Ulf Barkman Member of the Board Mattias Franzén Member of the Board
Öhrlings
Jörgen Zahlin Managing Director Åsa Söderström Winberg Member of the Board Richard Pantzar Member of the Board Jörgen Rosengren Member of the Board Per Svenberg Member of the Board OEM 2022 85 Frida Wengbrand Authorized Public Accountant Partner in charge Christoffer Sillén Authorized Public Accountant
Auditors' Report
To the Annual General Meeting of OEM International AB (publ), Corp.
ID no. 556184-6691
Report on the annual accounts and consolidated accounts Opinion
We have audited the annual accounts and consolidated accounts of OEM International AB for the year 2022 except for the corporate governance statement on pages 34-37. The annual accounts and consolidated accounts of the company are included on pages 28-85 in this document.
In our opinion, the annual accounts have been prepared in accordance with the Annual Accounts Act and present fairly, in all material respects, the financial position of parent company and the group as of 31 December 2022 and its financial performance and cash flow for the year then ended in accordance with the Annual Accounts Act. The consolidated accounts have been prepared in accordance with the Annual Accounts Act and present fairly, in all material respects, the financial position of the group as of 31 December 2022 and their financial performance and cash flow for the year then ended in accordance with International Financial Reporting Standards (IFRS), as adopted by the EU, and the Annual Accounts Act. Our opinions do not cover the corporate governance statement on pages 34-37. The statutory administration report is consistent with the other parts of the annual accounts and consolidated accounts.
We therefore recommend that the general meeting of shareholders adopts the income statement and balance sheet for the parent Company, as well as the statement of comprehensive income and the statement of financial position for the group.
Our opinions in this report on the annual accounts and consolidated accounts are consistent with the content of the additional report that has been submitted to the parent company’s audit committee in accordance with the Audit Regulation (537/2014) Article 11.
Basis for opinion
We conducted our audit in accordance with International Standards on Auditing (ISA) and generally accepted auditing standards in Sweden. Our responsibilities under those standards are further described in the Auditor’s Responsibilities section. We are independent of the parent company and the group in accordance with professional ethics for accountants in Sweden and have otherwise fulfilled our ethical responsibilities in accordance with these requirements. This includes that, based on the best of our knowledge and belief, no prohibited services referred to in the Audit Regulation (537/2014) Article 5.1 have been provided to the audited company or, where applicable, its parent company or its controlled companies within the EU.
We believe that the audit evidence we have obtained is sufficient and appropriate to provide a basis for our opinions.
Our audit approach
The objective and scope of the audit
We designed our audit by determining level of materiality and assessing the risks of material misstatement in the financial statements. In particular, we looked at areas where the Managing Director and the Board of Directors made subjective judgements, for example in respect of significant
Key audit matter
Inventory valuation
On 31 December 2022, the recognised value of inventories in the Group was SEK 1,182.5 million.
Inventory valuation always requires the application of a number of estimates and judgements. Because of this and the fact that the carrying amount is 42.2% of total consolidated assets, we have identified inventory valuation as a key audit matter.
In 2022, the price of several of the goods in which OEM trades increased in the economy. It is therefore important to ensure that the price increases are reflected correctly in the Group's recognised cost of inventories.
accounting estimates that involved making assumptions and considering forecasts about future events that are inherently uncertain. As in all audits, we also addressed the risk of override of internal controls by the Managing Director and the Board of Directors, including consideration of whether there was evidence of systematic non-conformances that have given rise to the risk of material misstatement due to fraud.
We tailored the scope of our audit to ensure that we performed sufficient work to be able to give an opinion on the financial statements as a whole, taking into account the structure of the Group, the accounting processes and controls, and the industry in which the Group operates.
The Group's operations are conducted in subsidiaries in 10 or more countries, mainly in Europe. The subsidiaries in Sweden and Finland jointly account for a significant percentage of the Group's operations. It was natural and necessary to perform an audit for these entities. The audit in Sweden was performed by the Group team and in Finland by a local PwC team.
After consultation with Group's Board and Group management, the Group audit in other countries included an additional 10 entities, where an audit was also performed with the assistance of PwC's network, with the exception of the UK and Ireland where it was performed by local audit firms.
The Group team has reviewed the work which is performed by all entity auditors to ensure that sufficient auditing has been performed, and has also continually communicated to understand how the audit has been conducted. In addition to this, the Group team has examined the Group consolidation, the Group's Annual Report and has assessed a number of complex transactions and issues.
All in all, this means that we are satisfied that sufficient audit work has been undertaken and particularly within the PwC network.
Materiality
The scope and objective of our audit were influenced by our assessment of materiality. An audit is designed to obtain reasonable assurance about whether the financial statements as a whole are free from material misstatement. Misstatements can arise from fraud or error. They are considered material if, individually or in the aggregate, they could reasonably be expected to influence the economic decisions of users taken on the basis of these financial statements.
Based on professional judgement, we set certain quantitative thresholds for materiality, including for the financial statements as a whole (see table below). These, together with qualitative considerations, helped us to determine the objectives and scope of our audit and the nature, timing and extent of our audit procedures, and to evaluate the effect of misstatements, both individually and in aggregate, on the financial statements as a whole.
Key audit matters
Key audit matters are those matters that, in our professional judgement, were of most significance in our audit of the financial statements of the current period. These matters were addressed in the context of our audit of the financial statements as a whole, and in forming our opinion thereon, and we do not provide a separate opinion on these matters.
Estimates and judgements are also required to calculate actual obsolescence caused by both slow-selling stock and the principle of lowest value. It may occasionally be necessary for OEM to keep large quantities in stock to meet customer requirements, which can increase the risk of obsolescence. OEM must thus make assumptions about future events when calculating the year's obsolescence on the value of the current inventory.
The Group's principles for measuring inventories are described in Note 1 on page 54 of the Annual Report. Note 15 explains what consideration has been given to obsolescence.
86 OEM 2022
How our audit addressed the key audit matter
Our audit included the following audit procedures.
We initially examined whether the Group's principles for cost calculation are compliant with generally accepted accounting practice. We then asked the subsidiary auditors to confirm compliance with this at a local level too. We evaluated whether any local entity had made any substantial change when applying the relevant principles.
We also updated our understanding of how processes and systems affect the warehousing process in each company.
With the help of data analyses, we have been able to collect and scrutinise a large volume of transactions in order to;
- examine whether the rapid price change during the year was correctly considered in the valuation of inventories
- identify products that are slow-selling and obsolete, and also measure against the obsolescence schedules applied by OEM as appropriate
- check any additional obsolescence requirements caused by the lowest value principle
Other Information than the annual accounts and consolidated accounts
This document also contains other information than the annual accounts and consolidated accounts and is found on pages 1-27 and 89-94. The Board of Directors and the Managing Director are responsible for this other information.
Our opinion on the annual accounts and consolidated accounts does not cover this other information and we do not express any form of assurance conclusion regarding this other information.
In connection with our audit of the annual accounts and consolidated accounts, our responsibility is to read the information identified above and consider whether the information is materially inconsistent with the annual accounts and consolidated accounts. In this procedure we also take into account our knowledge otherwise obtained in the audit and assess whether the information otherwise appears to be materially misstated.
If we, based on the work performed concerning this information, conclude that there is a material misstatement of this other information, we are required to report that fact. We have nothing to report in this regard.
Responsibilities of the Board of Director’s and the Managing Director
The Board of Directors and the Managing Director are responsible for the preparation of the annual accounts and consolidated accounts and that they give a fair presentation in accordance with the Annual Accounts Act and, concerning the consolidated accounts, in accordance with IFRS as adopted by the EU. The Board of Directors and the Managing Director are also responsible for such internal control as they determine is necessary to enable the preparation of annual accounts and consolidated accounts that are free from material misstatement, whether due to fraud or error.
In preparing the annual accounts and consolidated accounts, The Board of Directors and the Managing Director are responsible for the assessment of the company’s and the group’s ability to continue as a going concern. They disclose, as applicable, matters related to going concern and using the going concern basis of accounting. The going concern basis of accounting is however not applied if the Board of Directors and the Managing Director intend to liquidate the company, to cease operations, or has no realistic alternative but to do so.
The Audit Committee shall, without prejudice to the Board of Director’s responsibilities and tasks in general, among other things oversee the company’s financial reporting process.
Auditor’s responsibility
Our objectives are to obtain reasonable assurance about whether the annual accounts and consolidated accounts as a whole are free from material misstatement, whether due to fraud or error, and to issue an auditor’s report that includes our opinions. Reasonable assurance is a high level of assurance, but is not a guarantee that an audit conducted in accordance with ISAs and generally accepted auditing standards in Sweden will always detect a material misstatement when it exists. Misstatements can arise from fraud or error and are considered material if, individually
Moreover, we have posed questions to the company management and have reviewed Board meeting minutes in order to identify forecast changes in the companies' sales that might result in obsolescence of inventory.
We have also taken part in physical stocktaking during the year.
We have concluded that the Group has described its principles for the valuation of inventories in a satisfactory manner in the Annual Report, including estimates and judgements, that have been conducted in order to measure the value of the inventory as at 31 December 2022.
or in the aggregate, they could reasonably be expected to influence the economic decisions of users taken on the basis of these annual accounts and consolidated accounts.
A further description of our responsibility for the audit of the annual accounts and consolidated accounts is available on Revisorsinspektionen’s website: www.revisorsinspektionen.se/revisornsansvar. This description is part of the auditor’s report.
Report on other legal and regulatory requirements
The auditor’s examination of the administration of the company and the proposed appropriations of the company’s profit or loss Opinions
In addition to our audit of the annual accounts and consolidated accounts, we have also audited the administration of the Board of Director’s and the Managing Director of OEM International AB for the year 2022 and the proposed appropriations of the company’s profit or loss.
We recommend to the general meeting of shareholders that the profit be appropriated in accordance with the proposal in the statutory administration report and that the members of the Board of Director’s and the Managing Director be discharged from liability for the financial year.
Basis for Opinions
We conducted the audit in accordance with generally accepted auditing standards in Sweden. Our responsibilities under those standards are further described in the Auditor’s Responsibilities section. We are independent of the parent company and the group in accordance with professional ethics for accountants in Sweden and have otherwise fulfilled our ethical responsibilities in accordance with these requirements.
We believe that the audit evidence we have obtained is sufficient and appropriate to provide a basis for our opinions.
Responsibilities of the Board of Director’s and the Managing Director
The Board of Directors is responsible for the proposal for appropriations of the company’s profit or loss. At the proposal of a dividend, this includes an assessment of whether the dividend is justifiable considering the requirements which the company’s and the group’s type of operations, size and risks place on the size of the parent company’s and the group’ equity, consolidation requirements, liquidity and position in general.
The Board of Directors is responsible for the company’s organization and the administration of the company’s affairs. This includes among other things continuous assessment of the company’s and the group’s financial situation and ensuring that the company’s organization is designed so that the accounting, management of assets and the company’s financial affairs otherwise are controlled in a reassuring manner. The Managing Director shall manage the ongoing administration according to the Board of Directors’ guidelines and instructions and among other matters take measures that are necessary to fulfill the company’s accounting in accordance with law and handle the management of assets in a reassuring manner.
Cont. Auditors' Report
OEM 2022 87
Auditors' responsibility
Our objective concerning the audit of the administration, and thereby our opinion about discharge from liability, is to obtain audit evidence to assess with a reasonable degree of assurance whether any member of the Board of Directors or the Managing Director in any material respect:
• has undertaken any action or been guilty of any omission which can give rise to liability to the company, or
• in any other way has acted in contravention of the Companies Act, the Annual Accounts Act or the Articles of Association.
Our objective concerning the audit of the proposed appropriations of the company’s profit or loss, and thereby our opinion about this, is to assess with reasonable degree of assurance whether the proposal is in accordance with the Companies Act.
Reasonable assurance is a high level of assurance, but is not a guarantee that an audit conducted in accordance with generally accepted auditing standards in Sweden will always detect actions or omissions that can give rise to liability to the company, or that the proposed appropriations of the company’s profit or loss are not in accordance with the Companies Act.
A further description of our responsibility for the audit of the administration is available on Revisorsinspektionen’s website: www.revisorsinspektionen.se/revisornsansvar. This description is part of the auditor’s report.
The auditor’s examination of the ESEF report Opinion
In addition to our audit of the annual accounts and consolidated accounts, we have also examined that the Board of Directors and the Managing Director have prepared the annual accounts and consolidated accounts in a format that enables uniform electronic reporting (the ESEF report) pursuant to Chapter 16, Section 4(a) of the Swedish Securities Market Act (2007:528) for OEM International AB for the financial year 2022.
Our examination and our opinion relate only to the statutory requirements.
In our opinion, the ESEF report has been prepared in a format that, in all material respects, enables uniform electronic reporting.
Basis for Opinions
We have performed the examination in accordance with FAR’s recommendation RevR 18 Examination of the ESEF report. Our responsibility under this recommendation is described in more detail in the Auditors’ responsibility section. We are independent of OEM International AB in accordance with professional ethics for accountants in Sweden and have otherwise fulfilled our ethical responsibilities in accordance with these requirements. We believe that the evidence we have obtained is sufficient and appropriate to provide a basis for our opinion.
Responsibilities of the Board of Director’s and the Managing Director
The Board of Directors and the Managing Director are responsible for ensuring that the ESEF report has been prepared in accordance with the Chapter 16, Section 4(a) of the Swedish Securities Market Act (2007:528), and for such internal control that the Board of Directors and the Managing Director determine is necessary to prepare the ESEF report without material misstatements, whether due to fraud or error.
Auditor’s responsibility
Our responsibility is to form an opinion with reasonable assurance whether the ESEF report is in all material respects prepared in a format that meets the requirements of Chapter 16, Section 4(a) of the Swedish Securities Market Act (2007:528), based on the procedures performed. RevR 18 requires us to plan and execute procedures to achieve reasonable assurance that the ESEF report is prepared in a format that meets these requirements.
Reasonable assurance is a high level of assurance, but it is not a guarantee that an engagement carried out according to RevR 18 and generally accepted auditing standards in Sweden will always detect a material misstatement when it exists. Misstatements can arise from fraud or error and are considered material if, individually or in aggregate, they could reasonably be expected to influence the economic decisions of users taken on the basis of the ESEF report.
The audit firm applies ISQC 1 Quality Control for Firms that Perform Audits and Reviews of Financial Statements, and other Assurance and Related Services Engagements and accordingly maintains a comprehensive system of quality control, including documented policies and procedures regarding compliance with professional ethical requirements, professional standards and legal and regulatory requirements.
The reasonable assurance engagement involves obtaining evidence, through various procedures, that the ESEF report has been prepared in a format that enables uniform electronic reporting of the annual accounts. The procedures selected depend on the auditor’s judgment, including the assessment of the risks of material misstatement in the report, whether due to fraud or error. In carrying out this risk assessment, and in order to design procedures that are appropriate in the circumstances, the auditor considers those elements of internal control that are relevant to the preparation of the ESEF report by the Board of Directors and the Managing Director, but not for the purpose of expressing an opinion on the effectiveness of those internal controls. The reasonable assurance engagement also includes an evaluation of the appropriateness and reasonableness of assumptions made by the Board of Directors and the Managing Director.
The procedures mainly include a technical validation of the ESEF report, i.e. if the file containing the ESEF report meets the technical specification set out in the Commission’s Delegated Regulation (EU) 2019/815 and a reconciliation of the ESEF report with the audited annual accounts and consolidated accounts.
Furthermore, the procedures also include an assessment of whether the ESEF report has been marked with iXBRL which enables a fair and complete machine-readable version of the consolidated statement of financial performance, statement of financial position, statement of changes in equity and the statement of cash flow.
The auditor’s examination of the corporate governance statement
The Board of Directors is responsible for that the corporate governance statement on pages 34-37 has been prepared in accordance with the Annual Accounts Act.
Our examination of the corporate governance statement is conducted in accordance with FAR’s auditing standard RevR 16 The auditor’s examination of the corporate governance statement. This means that our examination of the corporate governance statement is different and substantially less in scope than an audit conducted in accordance with International Standards on Auditing and generally accepted auditing standards in Sweden. We believe that the examination has provided us with sufficient basis for our opinions.
A corporate governance statement has been prepared. Disclosures in accordance with chapter 6 section 6 the second paragraph points 2-6 of the Annual Accounts Act and chapter 7 section 31 the second paragraph the same law are consistent with the other parts of the annual accounts and consolidated accounts and are in accordance with the Annual Accounts Act/ the Annual Accounts Act for Credit Institutions and Securities Companies/ the Annual Accounts Act for Insurance Companies.
Öhrlings PricewaterhouseCoopers AB, Torsgatan 21, 113 97 Stockholm, was appointed auditor of OEM International AB by the general meeting of the shareholders on the 26 april 2022 and has been the company’s auditor since the 3 june 2019.
Jönköping on the date of our digital signature Öhrlings PricewaterhouseCoopers AB Frida Wengbrand Authorized Public Accountant
in
Christoffer
Authorized
Cont. Auditors' Report 88 OEM 2022
Partner
charge
Sillén
Public Accountant
OEM Shares
OEM International on the stock exchange
OEM's shares were quoted on the Stockholm Stock Exchange's OTC List in December
1983 and since then have shown good growth in price. An investor who purchased 100 shares in OEM for SEK 12,500 at the initial public offering would have a holding of 43,200 shares worth SEK 3,123,360 on 31 December 2022. OEM's shares were transferred to the O List in 2000 and its shares have been trading on the NASDAQ Nordic Small Cap market since 2006. The shares were transferred to the NASDAQ Nordic Mid Cap market in 2014.
3:1 share split combined with an automatic redemption procedure
Given OEM International's strong financial position and as a step in the process of changing the company's capital structure, a 3:1 share split combined with an automatic redemption procedure was carried out in 2022. This process gave each shareholder two new shares and one redemption share, which was redeemed for SEK 3.25 per share. This amounts to a transfer of SEK 226 million to the shareholders.
Price trends
The price of OEM International shares fell 22% during the year from SEK 92.79* to a closing price of SEK 72.30. During the year, the Stock Exchange's index for Nasdaq Stockholm_PI fell 25%. The highest price paid during the year was SEK 103.65 on 5 January. The lowest price paid during the year was SEK 54,20* on 26 October. OEM's market value at the close of 2022 was SEK 10,051 million.
Sales
In 2022, 11,343,948 Class B shares (17,589,890*) were sold, corresponding to a turnover rate of 8% (13%). The average shareholder in OEM therefore retains shares for about 8 (6) years.
OEM's Class B shares were tradeable on 100% (100%) of the trading days and the average number of trades per day in 2022 was 44,838 (69,526*). As at 31 December 2022, OEM International had 6,609 shareholders (5,739). Institutional ownership is approximately 50% (50%) and foreign ownership is 15% (17%).
Repurchase of shares
The repurchase programme for shares, which was adopted for the first time by the Annual General Meeting in 2000, is intended to improve the company's capital structure and contribute positively to return on shareholders' equity and earnings per share. After implemented reductions the previous year, there are 139,015,854 shares in the company at year-end. In 2011, the company repurchased 371,082* shares at an average price of SEK 8.88*. At year-end, the company held a total of 371,082* treasury
Share trends
shares. The Board has been authorised by the Annual General Meeting to repurchase up to 10% of the number of shares, i.e. 13,901,585 shares. The objective is to continue the repurchases up to 10% of the total number of shares wherever the Board considers the conditions to be attractive. The acquired shares will be retained, deregistered or used as payment in corporate acquisitions. The disadvantage that this can entail, that the number of shareholders decreases and the liquidity of the share declines, has been minimised by mainly making repurchases of large blocks of shares.
Liquidity boosting measures
OEM International has signed an agreement with ABG Sundal Collier ASA regarding liquidity guarantees for company shares. The aim is to reduce the difference between purchase and sales prices. The goal is to achieve a lower investment cost and to lower the share trading risk for present and future shareholders. Commitments fall within the scope of the NASDAQ Nordic Stock Exchange system with liquidity guarantees and started on 1 December 2004.
Dividend policy
The Board of OEM International aims to propose a reasonable dividend of profits to the shareholders, by considering the financial position and any need for acquisitions or investments in the operations.
Dividend
The Board proposes a SEK 1.50 (1,38*) per share dividend, equivalent to 15% (15%) of distributable equity in the Group.
Financial information
OEM aims to maintain high quality as regards information to the market and the media. The goal is for the information to facilitate an accurate valuation and liquid trading of the shares. The dates for the Annual General Meeting, interim reports and annual report for the 2022 financial year are shown on page 93 of this Annual Report.
Financial information is also published on the Group's website (www. oem.se).
The Company offers shareholders the opportunity to receive interim reports and other press releases by e-mail, at the same time as they are made public to the market. Please send an e-mail to: info@oem.se and state "Corporate Information" to receive mailings from us.
* Adjusted for the 3:1 share split and automatic redemption of every third share in Q2 2022. Adjusted by a factor of 2, since the financial implication is a 2:1 split combined with an extraordinary dividend.
100 200 300 400 50 2022 2019 2018 2020 2021
OEM International B OMX Stockholm_PI
OEM 2022 89
The chart compares the growth of the OEM share against the OMX Stockholm_PI. The start point is the 100 Index.
Change in share capital
Shareholding structure
OEM's
The company's 371,082 Class B shares held as treasury stock are not included in the above break-down. The purpose is to provide a clear overview of the various shareholders' interests in the company
Class A shares Class B shares Percentage share capital Percentage votes Orvaus AB 9,763,920 11,693,286 15.48% 27.7% Siv Franzén 7,682,256 7,414,740 10.89% 21.3% Agne Svenberg 7,200,000 5.19% 18.2% AB Traction 3,816,000 639,292 3.21% 9.8% Nordea Investment Funds 13,799,051 9.95% 3.5% Lannebo equity funds 13,496,799 9.73% 3.4% SEB Investment Management 9,046,355 6.52% 2.3% Cliens Fonder 4,821,491 3.48% 1.2% Handelsbanken Fonder 3,656,577 2.64% 0.9% Skandinaviska Enskilda Banken 2,485,996 1.79% 0.6% Total 10 owners 28,462,176 67,053,587 68.9% 89.1% Other 43,129,009 31.11% 10.9% TOTAL 28,462,176 110,182,596 100.0% 100.0% Votes per share 10 1
largest shareholders as at 30 Dec 2022
Year Transaction Change in share capital SEK million Total share capital, SEK million Total number of shares Par value per share SEK Opening value 0.1 0.1 500 100.00 1981 Bonus issue 0.3 0.4 4000 100.00 1983 Split - 0.4 40000 10.00 1983 Bonus issue 0.4 0.8 80,000 10.00 1983 New issue 0.8 1.6 160,000 10.00 1983 New issue 0.4 2.0 200,000 10.00 1986 Bonus issue 4.0 6.0 600,000 10.00 1986 New issue through conversion 0.4 6.4 636,000 10.00 1994 Split - 6.4 1,272,000 5.00 1994 Bonus issue 6.4 12.7 2,544,000 5.00 1996 Bonus issue 12.7 25.4 5,088,000 5.00 1997 New issue through subscription in kind 20.1 45.5 9,113,703 5.00 2001 Reduction -3.9 41.6 8,332,203 5.00 2003 Reduction -1.0 40.6 8,132,203 5.00 2004 Reduction -2.0 38.6 7,723,103 5.00 2007 Split - 38.6 30,892,412 1.25 2007 Redemption -9.6 29.0 23,169,309 1.25 2007 Bonus issue 9.6 38.6 23,169,309 1.67 2014 Split - 38.6 46,338,618 0.83 2014 Redemption -19.3 19.3 23,169,309 0.83 2014 Bonus issue 19.3 38.6 23,169,309 1.67 2021 Split - 38.6 92,677,236 0.42 2021 Redemption -9.7 28.9 69,507,927 0.42 2021 Bonus issue 9.7 38.6 69,507,927 0.56 2022 Split - 38.6 208,523,781 0.19 2022 Redemption -12.9 25.7 139,015,854 0.19 2022 Bonus issue 12.9 38.6 139,015,854 0.28 90 OEM 2022
Shareholder analysis
As at 30 Dec 2022*
*) Source: Euroclear Sweden AB. Directly and fund manager registered. In the table, an ownership detail may be a combination of several items in Euroclear Sweden's statistics. This combination is intended to show an institution's or a private individual's total ownership in OEM.
Key indicators for OEM shares
* Calculated on total number of shares.
** The key performance indicators for 2018-2021 have been adjusted following the 3:1 share split and automatic redemption of every third share in Q2 2022. Earlier periods have been adjusted by a factor of 2, since the financial implication is a 2:1 split combined with an extraordinary dividend.
SIZE CLASS Percentage of no. of shareholders Percentage of share capital 1–500 58.1 0.3 501–1, 000 11.0 0.4 1, 001–2, 000 9.0 0.7 2, 001–5, 000 8.6 1.3 5, 001–10, 000 5.9 2.0 10, 001–20, 000 3.3 2.3 20, 001–50, 000 2.2 3.2 50, 001–100, 000 0.9 3.0 100, 001–5, 000, 000 1.1 86.7 TOTAL 100.0 100.0 The total number of shareholders in OEM is 6,609.
past five years 2022 2021 2020 2019 2018 Key performance indicators Sales per share* ** SEK 34 27 24 24 22 Sales increase per share % 25 15 0 6 14 Earnings per share* ** SEK 4.14 3.29 2.28 2.08 1.79 Shareholders' equity per share* ** SEK 11.43 9.89 9.83 7.67 6.66 Dividend** SEK 1.50 1.38 1.25 - 1.13 Dividend/Income % 36 42 55 - 63 Dividend/Shareholders' equity % 13 14 13 - 17 Cash flow per share* ** SEK 1.89 2.30 3.38 2.09 1.56 Risk key indicators Rate of turnover for shares % 8 13 11 5 5 Valuation ratios Quoted price as per 31 December** SEK 72.30 92.70 51.50 41.67 31.75 Quoted price as per 31 December* SEK million 10,051 12,887 7,159 5,792 4,414 P/S ratio times 1.7 3.4 2.2 1.8 1.4 P/E ratio times 17.5 28.2 22.6 20.0 17.8 Price/Shareholders' equity % 633 938 524 543 477 EV/Sales times 2.2 3.4 2.1 1.8 1.5 EBIT multiple times 14.0 22.1 16.7 15.7 13.9 Direct return % 2.1 1.5 2.4 - 3.5
The
OEM 2022 91
Definitions
Direct return
Dividend per share divided by the quoted price at end of year.
EBIT multiple
Enterprise value divided by operating profit after depreciation/ amortisation.
EBITA*
Operating profit before amortisation of acquisition-related intangible fixed assets.
EBITA margin
EBITA as a percentage of net sales.
Shareholders' equity per share
Shareholders' equity divided by the average number of shares.
EV/Sales
Enterprise values (market value + net debt) divided by net sales.
Capital turnover rate
Net sales divided by total assets.
Cash flow per share
Operating cash flows divided by the average number of shares.
Quick ratio
Current assets less inventories divided by current liabilities.
Price/Shareholders' equity
Quoted price divided by shareholders' equity per share.
Net sales per share
Net sales divided by the number of shares on the market at end of year.
Net sales per employee
Net sales divided by average number of employees.
Net sales increase per share
Increase of the net sales per share.
Net debt
Interest-bearing liabilities less cash and cash equivalents.
Rate of turnover for shares
The number of shares sold during the year divided by the number of outstanding shares at year-end.
*In addition to the conventional financial performance measures established by IFRS, OEM uses the terms Organic growth and EBITA/ EBITA margin, the definitions of which are given above. The reason is that OEM wants to provide clearer comparability of sales performance between periods, without the effects of currency movements or acquisitions, and be able to summarise the companies' operations with regard to profit and margins, excluding amortisation and depreciation that arose on acquisition.
Organic growth*
The change in total revenue in the period, adjusted for acquisitions, sales and currency movements, measured against the total revenue in the comparative period.
P/E ratio
Quoted price as per 31 December divided by earnings per share.
P/S ratio
Stock market value in relation to net sales.
Return on equity
Profit for the year divided by average shareholders' equity.
Return on capital employed
EBITA plus finance income as a percentage of average capital employed.
Return on total capital
EBITA plus finance income as a percentage of average total capital.
Interest coverage ratio
Operating profit for the year plus finance income in relation to interest expense.
Operating margin
Operating profit as a percentage of net sales.
Debt/equity ratio
Interest-bearing liabilities divided by shareholders' equity.
Equity/assets ratio
Shareholders' equity as a percentage of total capital.
Capital employed
Total assets minus non-interest-bearing liabilities and provisions.
Dividend/Shareholders' equity
Dividends in relation to the Group's shareholders' equity.
Dividend/Profit payout ratio
Dividends in relation to profit/loss for the year.
Earnings per share
The profit or loss for the year divided by the average number of shares.
Profit margin
Profit/loss before tax as a percentage of sales.
92 OEM 2022
Annual General Meeting
Tuesday 18 April 2023, at 4.00 pm at Badhotellet's Conference Centre, Ågatan 16, Tranås, Sweden.
Requirements for participation
Shareholders wishing to attend the Annual General Meeting must:
• be entered in the share register held by Euroclear Sweden AB by Thursday 6 April 2023, if the shares are registered in the name of an authorised agent, request the agent to register their rights to vote by 12 April 2023 at the latest, and
• notify the company no later than Thursday 6 April 2023 at this address:
OEM International AB, Box 1009, SE-573 28 TRANÅS, Sweden Tel. +46 (0)75 242 40 15 or e-mail: ir@oem.se
When notifying OEM of their attendance, shareholders should state their name, personal identity number (company registration number), address, phone number, their shareholding and the names of any proxies.
Shareholders who have registered their shares in the name of an authorised agent must temporarily register the shares in their own name with Euroclear Sweden AB by Wednesday 12 April 2023 to be entitled to attend and vote at the Annual General Meeting.
If participation is by proxy with power of attorney, the original power of attorney document and any authorisation documents must be sent to the company in good time before the Annual General Meeting. A representative of a legal entity must also submit a signed copy of a registration certificate or equivalent authorisation document to show that they may represent the legal entity. Shareholders who wish to be represented by proxy may obtain a power of attorney form from the company's head office or its website www.oem.se no later than 20 March 2023.
Dividend
The Board of Directors recommends that the Annual General Meeting approve the proposal to pay a dividend of SEK 1.50 per share for 2022 and to fix Thursday 20 April 2023 as the record date. If the proposal is approved by the Annual General Meeting, the dividend is expected to be paid on Tuesday 25 April 2023 to shareholders who are on the share register on the record date.
Business
A notice stating the agenda and business of the Annual General Meeting will be published in the daily press and will be available on OEM's website, www.oem.se. The agenda can also be obtained from the company when registering to attend the Meeting.
OEM 2022 93
Future reports Interim report – January - March 18 April 2023 Interim report – January - June 13 July 2023 Interim report – January - September 19 October 2023 Financial Statement 2023 19 February 2024
Long-term ownership and energy-efficient solutions
OEM's philosophy for ownership of real estate is to own and manage properties for the Group's own operations and to offer premises that are suitable for the business needs of our companies. This is primarily effected through its own real estate companies that lease premises to the subsidiaries. Some premises are leased to external parties in order to generate returns on invested capital where there is excess capacity or where properties have been acquired for strategic purposes and potential expansion in the future
oem also rents premises from external parties where this is considered to be the best solution in locations where the Group has local requirements. This is particularly the case in small overseas entities where expectations for expansion are higher and local requirements are likely to change more rapidly.
At present, oem owns real estate in Sweden, Finland, Denmark and the UK.
oem aims to offer premises that are efficient and suitable for business needs with good development potential to the Group's operations. As part of its clear focus on sustainability and goals to reduce its
energy consumption and carbon footprint, oem is committed to installing solar panels on all properties that it owns. In 2022, solar panel arrays were installed and commissioned on all properties in Tranås and are now covering over 50% of annual electricity requirements. In 2023, solar panel arrays will be installed on properties in Finland and Denmark. In addition to this, heating, cooling and lighting systems are being analysed and mapped to ensure optimisation of operational performance and efficient utilisation of existing properties and premises.
94 OEM 2022 REAL ESTATE
LOCATION ADDRESS OFFICE AREA (m2) WAREHOUSE AREA (m2) Tranås Dalagatan 4 3,070 2,764 Fredriksbergsgatan 2 3,611 9,753 Förrådsvägen 2 2,060 990 Nässjö Lerbacksgatan 1 362 957 Lerbacksgatan 3 840 1,960 Bankeryd Tallvägen 5 1,565 3,815 Åbo, Finland Fiskarsinkatu 3 2,228 3,961 Fiskarsinkatu 6 2,346 6,205 Rauma, Finland Kirvestie 1 277 612 Allerød, Denmark Engholm Parkvej 4 800 591 Leicester, UK Whiteacres, Whetstone 1,400 1,280
The Höganloft logistics centre in Tranås serves the following companies: oem Automatic Sweden, Norway and Denmark, oem Motor, Telfa and Batteripoolen. The centre was opened in 2010 and extended by approximately 5,000 m2 in 2019 to create a total area of approximately 13,000 m2
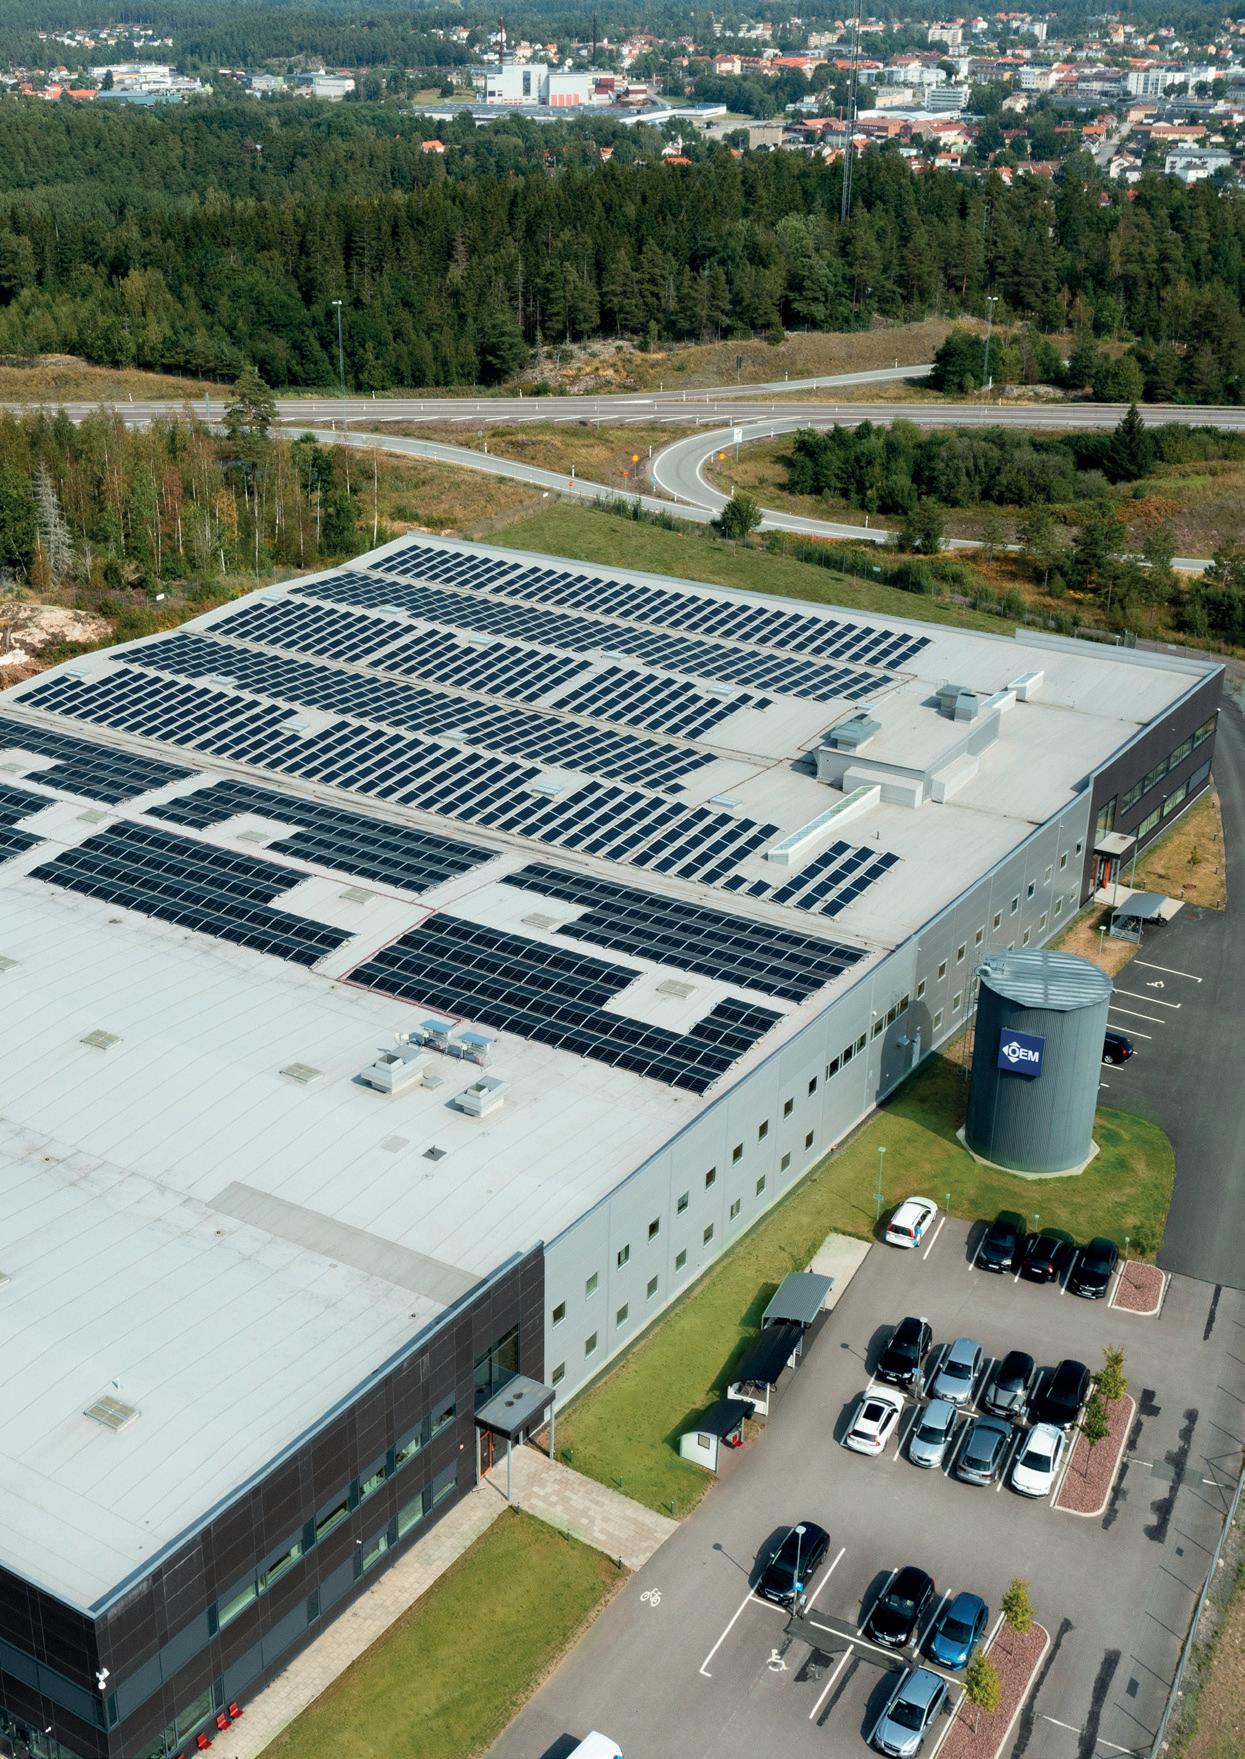
ADDRESSES
REGION SWEDEN
OEM Automatic AB
Box 1011, Dalagatan 4
573 28 TRANÅS, Sweden
Tel: +46-75-242 41 00
E-mail: info@oemautomatic.se
Website: www.oemautomatic.se
OEM Motor AB
Box 1011, Fredriksbergsgatan 2
573 28 TRANÅS, Sweden
Tel: +46-75-242 44 00
E-mail: info@oemmotor.se
Website: www.oemmotor.se
Telfa AB
Box 1011, Fredriksbergsgatan 2
573 28 TRANÅS, Sweden
Tel: +46-75-24 24 450
E-mail: info@telfa.se
Website: www.telfa.se
Svenska Batteripoolen AB
Box 1011, Fredriksbergsgatan 2 573 28 TRANÅS, Sweden
Tel: +46-75-24 24 300
E-mail: kundsupport@batteripoolen.se
Website: www.batteripoolen.se
Elektro Elco AB
Tallvägen 5
SE-564 35 BANKERYD, Sweden
Tel: +46-36-290 60 00
E-mail: elektro@elco.se
Website: www.elco.se
Nexa Trading AB
Datavägen 37 B 436 32 ASKIM, Sweden
Tel: +46-31-14 13 80
E-mail: info@nexa.se
Website: www.nexa.se
OEM Electronics AB
Box 1025, Förrådsvägen 2
573 29 TRANÅS, Sweden
Tel: +46-75-242 45 00
E-mail: info@oemelectronics.se
Website: www.oemelectronics.se
Internordic Bearings AB
Box 105, Lerbacksgatan 3
571 22 NÄSSJÖ, Sweden
Tel: +46-75-242 49 40
E-mail: info@internordic.com
Website: www.internordic.com
Svenska Helag AB
Box 6, Dalagatan 4
573 21 TRANÅS, Sweden
Tel: +46-75-242 46 00
E-mail: helag@helag.se
Website: www.helag.se
Agolux AB Box 6, Dalagatan 4
573 21 TRANÅS, Sweden
Tel: +46-75-242 45 50
E-mail: kundsupport@agolux.se
Website: www.agolux.se
ATC Tape Converting AB
Box 575, Veddestavägen 17 175 26 JÄRFÄLLA, Sweden
Tel: +46-8-564 708 80
E-mail: info@atc.se
Website: www.atc.se
AB Ernst Hj. Rydahl Bromsbandfabrik Box 12, Brisgatan 19, 651 02 KARLSTAD, Sweden
Tel: +46-10-550 94 00
E-mail: mail@rydahls.se
Website: www.rydahls.se
IBEC Aartsdijkweg 111
NL-2676 LE MAASDIJK, the Netherlands
Tel: +31-174 52 51 00
E-mail: info@ibec.cn
Website: www.ibec.cn
REGION FINLAND, THE BALTIC STATES AND CHINA
OEM Automatic (Shanghai) Co., Ltd
Room 117, Building 8
Shanghai Zhongtian Science & Technology Business Park, 787 KangQiao Rd
SHANGHAI 201315, P.R. of China
Tel: +86-21-3331 1200
E-mail: info@oemautomatic.cn
Website: www.oemautomatic.cn
OEM Automatic FI Box 9, 20101 TURKU
Fiskarsinkatu 3, 20750 TURKU, Finland
Tel: +358-207 499 499
E-mail: info@oem.fi
Website: www.oem.fi
Akkupojat Oy Satakunnankatu 38
28130 PORI, Finland
Tel: +358 2 631 8600
E-mail: akkupojat@akkupojat.fi
Website: www.akkupojat.fi
OEM Electronics FI Box 9, 20101 TURKU
Fiskarsinkatu 3,
20750 TURKU, Finland
Tel: +358-207 499 499
E-mail: info@oem.fi
Website: www.oemelectronics.fi
Rauheat Oy
Kirvestie 1
26510 Rauma, Finland
Tel: +358 2 54 90 400
E-mail: rauheat@rauheat.fi
Website: www.rauheat.fi
OEM Automatic Oü
Aia 8
80010 PÄRNU, Estonia
Tel: +372-5059 849
E-mail: info@oem.ee
Website: www.oem.ee
REGION DENMARK, NORWAY, THE BRITISH ISLES AND EAST CENTRAL EUROPE
OEM Automatic AS
Postboks 2144 STRØMSØ
Bjørnstjerne Bjørnsonsgate 110
3003 DRAMMEN, Norway
Tel: +47-32 21 05 05
E-mail: post@oem.no
Website: www.oem.no
OEM Automatic Klitsø A/S
Engholm Parkvej 4
3450 ALLERØD, Denmark
Tel: +45-70 10 64 00
E-mail: info@oemklitso.dk
Website: www.oemklitso.dk
OEM Automatic Ltd
Whiteacres Cambridge Road
Whetstone, LEICESTER LE8 6ZG
UK
Tel: +44-116 284 99 00
E-mail: information@uk.oem.se
Website: www.oem.co.uk
Zoedale Ltd
Priory Business Park, Stannard Way
Bedford MK44 3 WG, UK
Tel: +44-1234 83 28 32
E-mail: enquiries@zoedale.co.uk
Website: www.zoedale.co.uk
Demesne Electrical Sales
The Square Industrial Complex
Tallaght, Dublin 24, D24 ED71, Ireland
Tel: +353 1-4047777
E-mail: sales@demesne.ie
Website: www.demesne.ie
OEM Automatic Sp. z o.o. ul. Działkowa 121A 02-234 WARSAW, Poland
Tel: +48-22-863 27 22
E-mail: info@pl.oem.se
Website: www.oemautomatic.pl
OEM Electronics PL ul. Działkowa 121A, 02-234 WARSAW, Poland
Tel: +48-22-863 27 22
E-mail: info@pl.oem.se
Website: www.oemelectronics.pl
OEM Automatic SIA
Vilandes 3-3
1010 RIGA, Latvia
Tel: +372-5295 114
E-mail: info@oemautomatic.lv
Website: www.oemautomatic.lv
OEM Automatic UAB
Raudondvario str. 101, 47184 KAUNAS, Lithuania
Tel: +370-64015 878
E-mail: info@oem.lt
Website: www.oem.lt
OEM INTERNATIONAL
Box 1009, Förrådsvägen 2
573 28 TRANÅS, Sweden
Tel: +46-75-242 40 00
E-mail: info@oem.se
Website: www.oem.se
OEM Automatic spol. s r.o. Prazska 239, 250 66 ZDIBY, Czech Republic
Tel: +42-0-241 484 940
E-mail: info@oem-automatic.cz
Website: www.oemautomatic.cz
OEM Automatic, s.r.o. Bratislavska 8356, 917 01 TRNAVA, Slovakia
Tel: +421-33-2400-160
E-mail: info@oem-automatic.sk
Website: www.oemautomatic.sk
OEM Automatic Kft. P.O. Box: 111, Gyár u. 2 2058 BUDAÖRS, Hungary
Tel: +36-23-880 895
E-mail: info@oemautomatic.hu
Website: www.oemautomatic.hu
www.oem.se
20 March 2023 PRINTERS: TMG Tabergs PHOTOS BY: Patrik Svedberg and others.
BOLT kommunikation AB
