1435 Walnut Street, 4th Floor Philadelphia, PA 19102 215 717 2777
econsultsolutions.com


1435 Walnut Street, 4th Floor Philadelphia, PA 19102 215 717 2777
econsultsolutions.com
To: JobItzkowitz,OldCityDistrict
From: PeterAngelides,CarlosBonillaandEthanConner Ross;EconsultSolutions,Inc
Date: October 20, 2017
The Old City District commissioned Econsult Solutions, Inc (ESI) to assess off street public parking availability in and near the District. This study updates and expands upon a 2015 Philadelphia City Planning Commission (PCPC) study, which measured capacity and occupancy within Center City and Old City as part of a broader study of parking availability 1 The current study area includes 15 public parking facilities, with more than 3,100 spaces in total. This study can serve as a baseline against which future parking studies can compare. Recent development has removed several parking facilities with a total of nearly 650 spaces (including public and private spaces) from service, without significant new public parking construction, so the overall supply of public parking has diminished since 2015 We analyzed the number of public parking spaces, and measured occupancy of each facility at three separate times. There were numerous available spaces at all times, though some lots were observed to be filled. Further, traffic counts in Old City have decreased over time, suggesting that the customer base is less car dependent than in previous times
The study area used in this analysis includes: Callowhill Street to Walnut Street (northern and southern boundaries) 6th Street to Columbus Boulevard (western and eastern boundaries)
The study area roughly follows the boundaries of the Old City District, but extends beyond that actual District in some instances to capture parking that likely serves the District.
1 Philadelphia City Planning Commission, “Center City Philadelphia Parking Inventory” (2015), https://goo.gl/uaFrAv
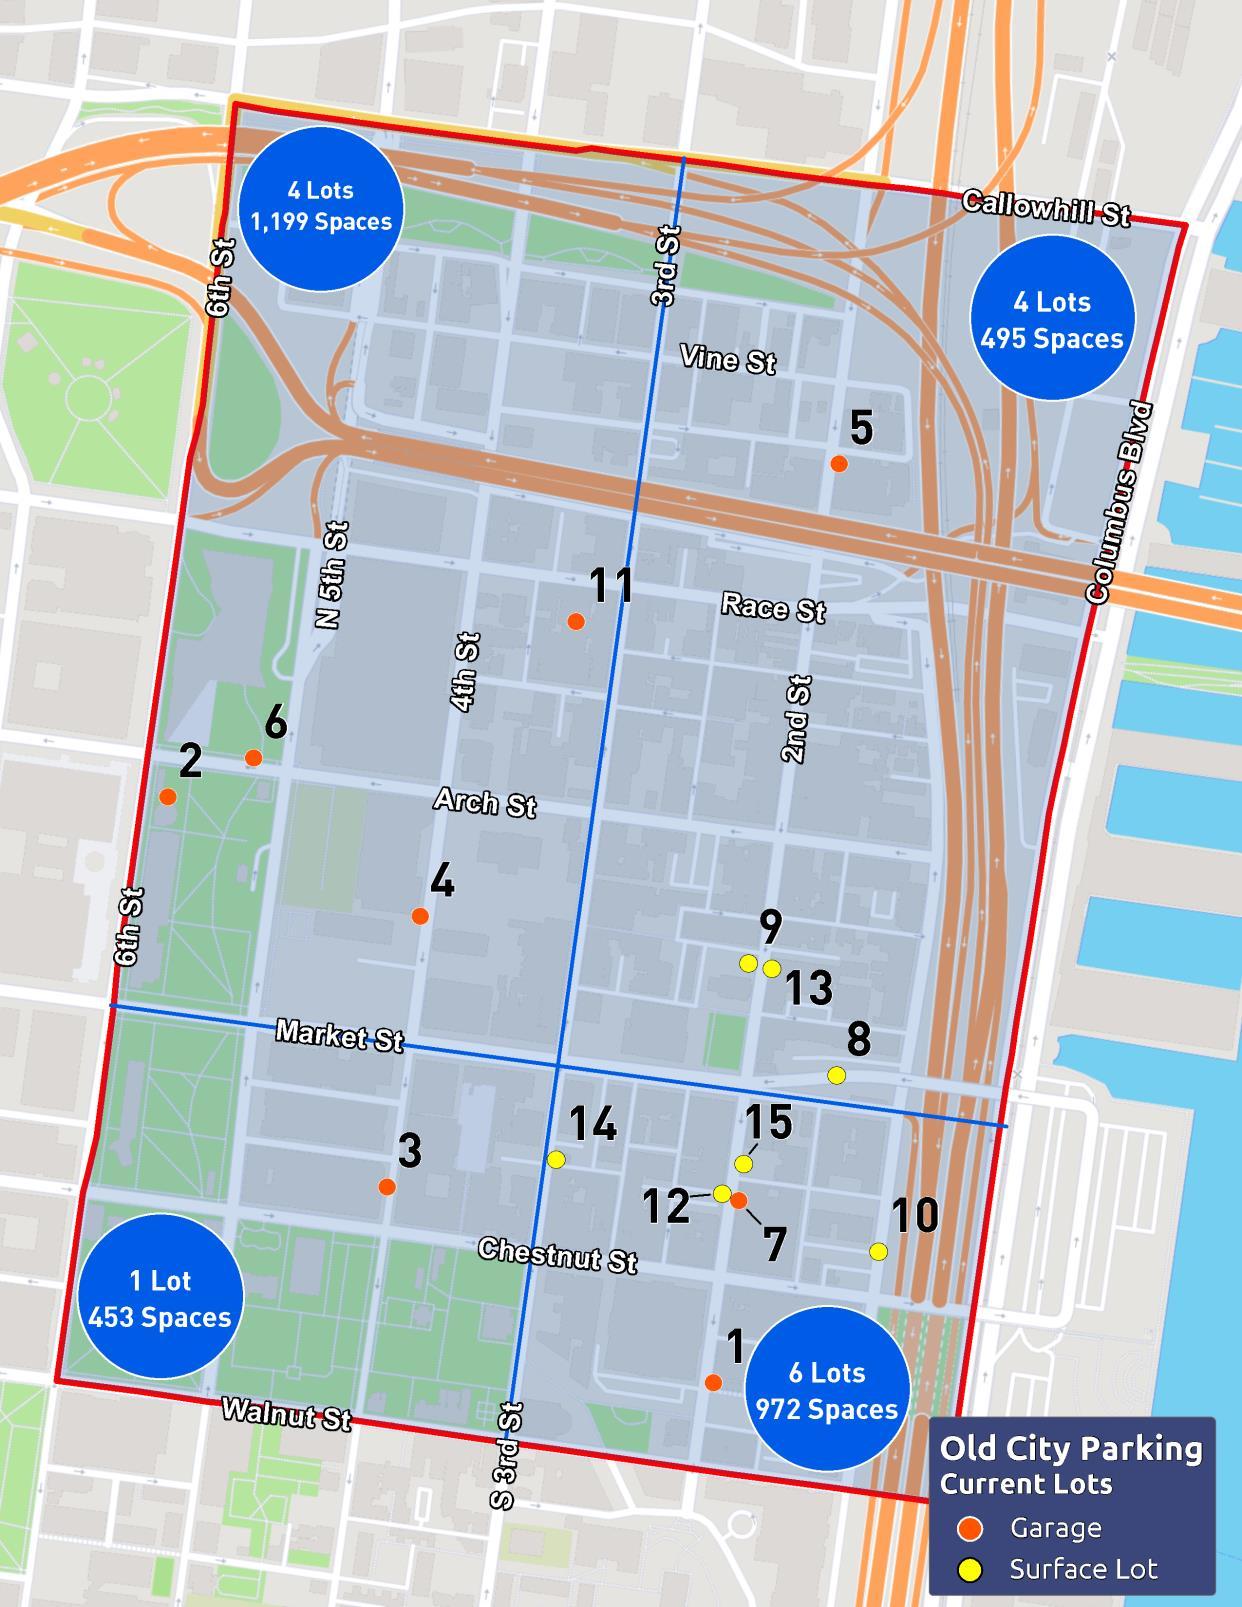
The study area includes 15 public parking facilities, including eight garages and seven surface lots (see Table 1). These lots have a total capacity of 3,119 spaces, with 2,729 spaces in garages and 390 in surface lots. The average price for the first hour of parking is $11. In addition to daily customers, the majority of lots offer monthly contracts The public parking inventory does not include small lots of less than 20 spaces
1 125 S 2nd St. PPA Garage 650 $8 $8 Yes
2 41 N. 6th St. PPA Garage 600 $8 $11 Yes
3 401 Chestnut St. Bourse Garage 453 $9 $9 Yes
4 50 N. 4th St. Wyndham Garage 354 $12 $12 Yes
5 231 N. 2nd St. Old City Parkominium Garage 280 $8 $7 Yes
6 525 Arch St. Central Parking Garage 170 $8 $8 Unknown
7 37 S. 2nd St. Sky Parking Garage 147 $16 $16 Yes
8 101 Market St. Patriot Parking Inc. Lot 105 $7 $20 Yes
9 210 Filbert St. Park America Lot 80 $11 $15 Yes
10 36 S. Front St. EZ Park Lot 79 $12 $25 Yes
11 304 Race St. SafeParc Garage 75 $8 $8 Unknown
12 38 S. 2nd St. Parkway Lot 39 $10 $25 Yes
13 35 N. 2nd St. Independence Parking Lot 30 $25 $25 Yes
14 27 S. 3rd St. Classic Parking Lot 29 $18 $10 Yes
15 21 S. 2nd St. Parkway Lot 28 $11 $26 Yes
Total / Average 3,119 $11 $15
Source: Econsult Solutions (2017), Philadelphia City Planning Commission (2015)
The study area was divided into four quadrants by 3rd Street and by Market Street. The two quadrants south of Market Street cover a smaller area, but they have nearly as many spaces as those north of Market Street (see Figure 1)
Source: Econsult Solutions (2017), Mapbox (2017)
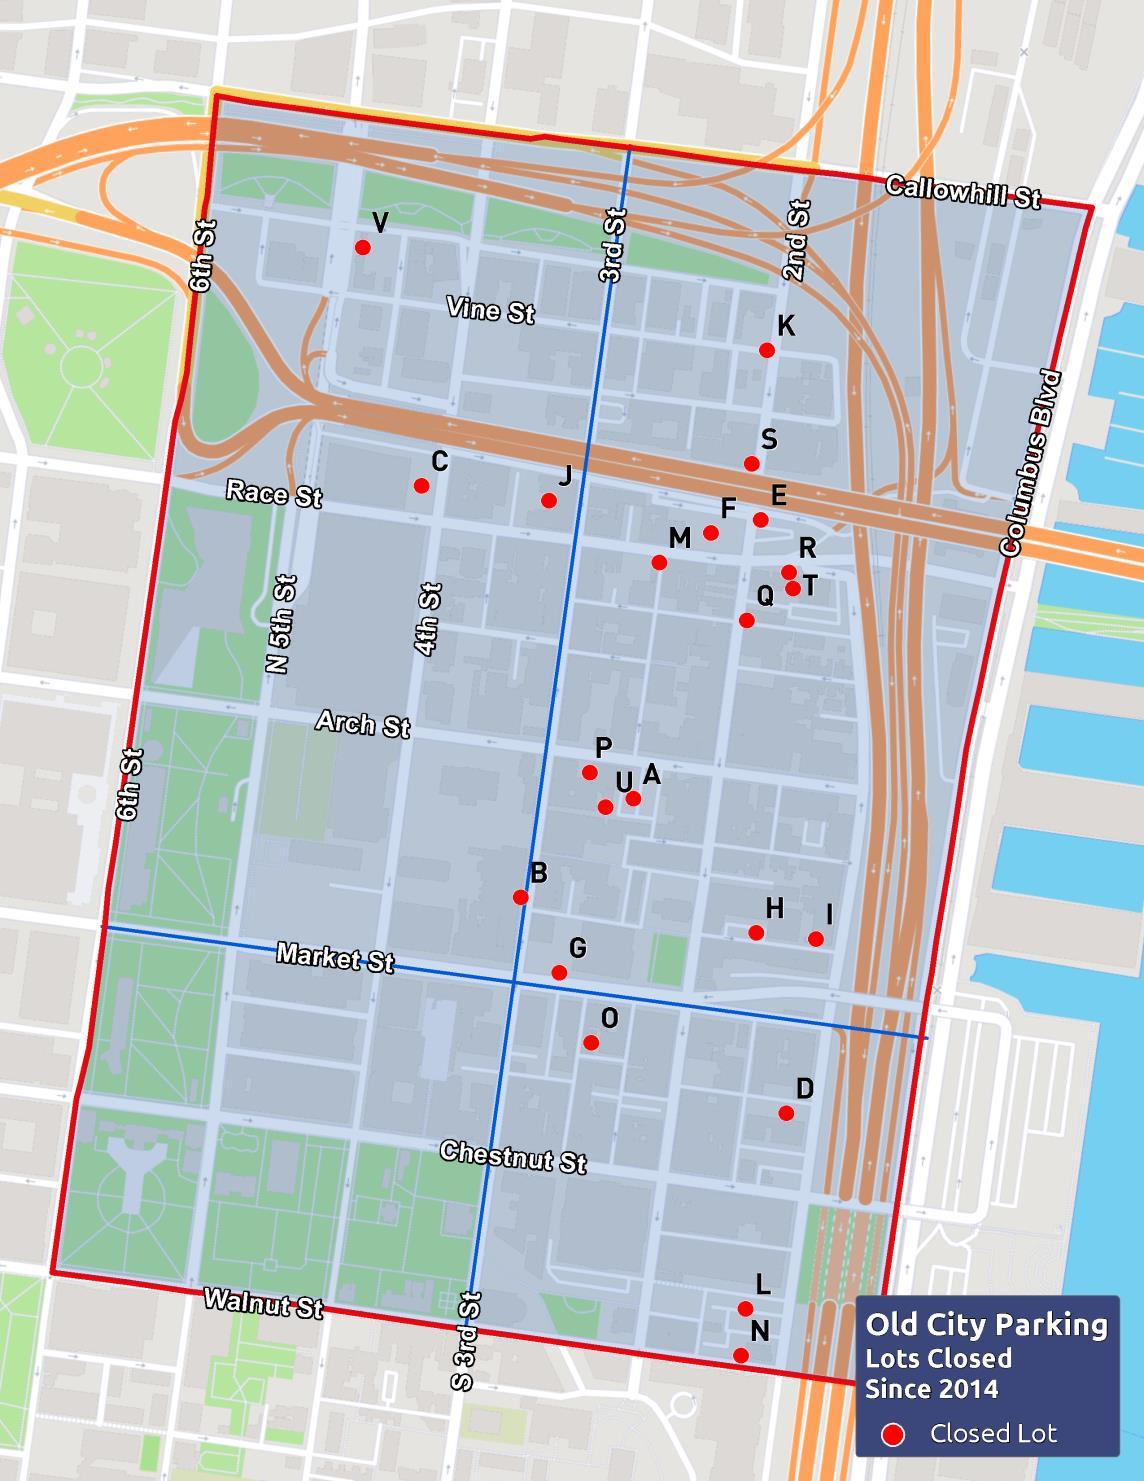
In recent years, more than twenty parking lots have closed due to development in Old City. In total, we estimate the closed lots contained approximately 650 spaces. Many of the closed lots were small or were private, and hence not available for public use Lots A E, which contained 278 spaces, were included in the 2015 PCPC parking study. The other lots were not included, and are primarily smaller lots compared to the PCPC identified lots. The average capacity of surface lots was around 30 spaces (see Table 2) The majority of closed lots are clustered in the northeastern portion of the study area (see Figure 2).
Map Address Operator Type Capacity
A 218 Arch St. Central Parking Lot 75
B 38 N. 3rd St. E Z Park Lot 70
C 401 Race St. E-Z Park Lot 60
D 26 S. Front St. Parkway Lot 41 E 2nd St. & Florist St. Patriot Park Lot 32
F 205 Race Street 2 Lot 50
G 241 259 Market Street Lot 40 H 113 121 Church Street Lot 40 I 22 28 S. Front Street Lot 40
J 313 Race Street Lot 35 K 300 308 N. Second Street Lot 30
L 130 S. Front Street Lot 30
M 230 238 Race Street Lot 25 N 105-109 Walnut Street - Lot 25
O 1 7 Bank Street Lot 15
P 240 244 Arch Street Lot 10
Q 151 N. Second Street Lot 10 R 120 24 Race Street Lot 8 S 240 N. Second Street Lot 6
T 138 Race Street Lot 5
U 159 N.2nd 117 Quarry Lot 5 V 418 420 Wood Street Lot 5
Total 647
Source: Econsult Solutions (2017), Philadelphia City Planning Commission (2015), Old City Area Development (2017)
2 These former lots were not listed in the 2015 parking inventory study. Data on these lots were provided by a resident formerly involved in the Old City Civic Association.
Source: Econsult Solutions (2017), Mapbox (2017)
ESI staff conducted parking inventories of the 15 identified lots throughout June and July 2017 to determine their occupancy levels at three different points in the week (see Table 3) We visited each facility three times, confirmed the number of spaces, recorded the number of empty spaces, and calculated occupancy. Monthly parking spaces were also included in this total. Parking occupancy was recorded at the following times, which are intended to reflect peak demand for weekday evenings, weekend days and weekend evenings:
Thursday night (Jun 22, 2017), for which overall occupancy was 64% and one lot was at full capacity; Saturday afternoon (Jun 24, 2017), for which overall occupancy was 79% and two lots were at full capacity; Saturday night (Jul 15, 2017), for which overall occupancy was 71% and three lots were at full capacity
In each observed period, there were parking spaces available during peak times. All of the larger facilities had some availability at all times, though some of the smaller lots were fully occupied at some times. We received independent confirmation from Parkway that our occupancy estimates were on target or greater than actual occupancy.
Map Address Operator Type Spaces
2015 Thursday Night Saturday Afternoon Saturday Night
2 41 N. 6th St. PPA Garage 600 89% Unknown3 62% 30%
3 401 Chestnut St. Bourse Garage 453 97% 71% Unknown 42%
4 50 N. 4th St. Wyndham Garage 354 42% 47% 51% 69%
6 525 Arch St. Central Parking Garage 170 89% 74% 82% Unknown
7 37 S. 2nd St. Sky Parking4 Garage 147 68% Unknown Unknown Unknown
8 101 Market St. Patriot Parking Inc. Lot 105 100% 90% 95% 95%
9 210 Filbert St. Park America Lot 80 49% 63% 100% 49%
10 36 S. Front St. EZ Park Lot 79 100% 44% 54% 94%
12 38 S. 2nd St. Parkway Lot 39 85% 46% 87% 87%
13 35 N. 2nd St. Independence Parking Lot 30 100% 100% 100% 100%
14 27 S. 3rd St. Classic Parking Lot 29 72% 48% 82% 100%
15 21 S. 2nd St. Parkway Lot 28 54% 64% 96% 100%
1 125 S 2nd St. PPA Garage 650 5 62% 69% 35%
5 231 N. 2nd St. Old City Parkominium Garage 280 46% 55% Unknown
11 304 Race St. SafeParc Garage 75 83% 91% 82%
Total / Average 3,119 79% 64% 79% 74%
Source: Econsult Solutions (2017), Philadelphia City Planning Commission (2015)
3 Some facilities were unwilling to disclose occupancy numbers during these inventories. Averages are based on measured lots.
4 Although an occupancy estimate was determined in 2015, the current parking inventory was unable to provide an estimate for any of the surveyed days. This garage was unwilling to disclose occupancy numbers and could not be observed from the street. We note that there are three floors, and the observable first floor was filled at each visit.
5 Lots 13, 14, and 15 were not included in the 2015 PCPC parking inventory.
Traffic counts have been declining in Old City. Based on traffic counts from Delaware Valley Regional Planning Commission (DVRPC), as supplemented by NV5, we observe that the most recent traffic counts at all measured segments are lower than their peaks. We also observe that all peaks occurred in 2008 or earlier.
Daily Traffic Counts
2nd, MarketChestnut
3rd, MarketRace
5th, MarketArch Arch, 2nd 5th Arch, 5th 7th Chestnut , 5th 2nd
Front (2 way), MarketChestnut
Market, 2ndFront (EB)
KEY: MAX MIN
Market, 4th-3rd (EB)
Market 3rd-4th (EB)
Market , 8th-5th (EB)
Market, 8th-5th (WB) Walnut, 2nd 5th 1997 5,822 7,412 6,114 3,449 5,840 1998 5,633 8,325 9,258 6,687 4,463 1999 6,794 13,216 6,952 2000 8,167 10,069 4,847 2001 6,849 2002 10,057 12,816 7,361 13,618 13,449 4,449 2003 7,710 3,233 5,729 10,183 4,367 2004 6,141 8,162 2005 14,993 4,615 11,012 5,667 2006 9,304 8,507 7,379 2007 9,269 11,708 2008 13,127 7,269 4,393 12,064 7,110 2009 6,430 8,617 2010 6,706 7,130 2011 11,215 4,910 2012 6,176 7,872 3,000 6,691 9,756 5,539 2013 5,484 4,718 3,658 6,997 2014 5,956 2015 9,904 4,506 2016 5,525 6,238 5,299 9,072 4,779 2017 6,153
Source: NV5
These data suggest a shift in mode preference, away from automobiles and towards other forms. Further, the volumes do not account for the rise of ride sharing, which would show up as traffic but would not require parking. At the same time, ridership at the 2nd & Market station of the Market Frankford line has increased by nearly 30% since 2000.