19 minute read
2. INVENTORYING FARM RESOURCES
from Guidebook: Using the Rising Plate Meter and NDVI to Estimate Pasture Biomass in Rotational Grazing S
Inventorying farm resources is an essential component of properly managing rotationally grazed pastures. This process involves assessing the current resources available, including equipment, infrastructure, labour, livestock, and pastures. By assessing the status of livestock and pastures, producers can plan for the right number of animals in each paddock, the timing and frequency of grazing rotations, make necessary changes to pasture management.
Advertisement
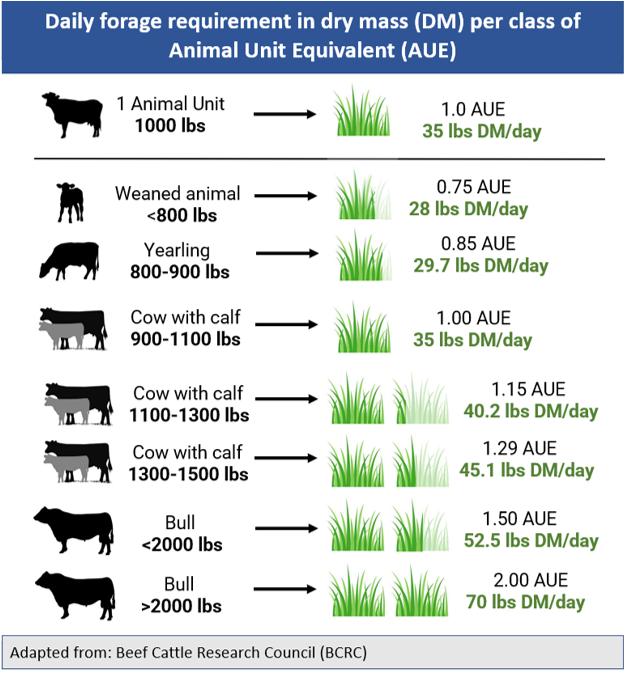
Inventorying livestock involves assessing the number, class and weight of the animals in the herd (example in Table 1), which greatly influences the herd’s forage requirements (Figure 1). This information is important for determining the carrying capacity of the pasture, which is the number of animals the pasture can support without being overgrazed. With this information, you can make decisions on when to graze, how long to graze and how many animals to include in each pasture rotation.
Inventorying pasture resources requires assessing the type and amount of forage present at a given point in time (example in Table 2). This helps in determining the overall forage availability, as well as the best time to graze the pasture depending on the growth patterns of the forage species. Based on how much time you want to dedicate to the management of your herd and land, you can choose how often you inventory your pastures.
For instance, you can choose to inventory the available forage in each paddock right before moving the herd into it (which gives more accurate estimates to calculate rotation period and forage utilization, but is more labour and time-consuming), or you can inventory your pastures in a schedule that works best for you (e.g., every few weeks which would give you less accurate information, but would save you time and labour).
Together, inventorying both livestock and pasture ensures you have accurate information to make informed management decisions that will improve the health and productivity of both the animals and the pasture. It also helps to prevent overgrazing, under-grazing or uneven grazing, which can have a negative impact on animal performance and pasture health. However, while it is relatively easy to keep track of livestock resources, tracking available forage has its own set of challenges.
Challenges related to inventorying available forage
Ranchers who practice rotational grazing often rely on visual observations to estimate how much forage is available in a pasture before moving cattle into it. This can be a significant challenge for proper management of rotationally grazed pastures. If the estimation is inaccurate, the rancher may overgraze or under-graze a particular paddock, which can lead to negative impacts on pasture health and animal productivity. Some methods have been proposed to overcome this challenge, including:
• The clipping method.
• The grazing stick method.
• The ruler method.
Although these methods can be useful, they present many operational challenges. First, they involve time-consuming and labour-intensive processes. Additionally, because they take more time to be executed, producers that adopt them usually take less samples/measurements than would be necessary to represent their entire pastures, consequently reducing the accuracy of the estimates obtained. As a result of these issues, most producers do not use any method to measure the available forage in their pastures, which has directly negative consequences for pasture health and productivity.
Fortunately, new technologies such as satellite imaging and the rising plate meter can help you overcome the challenges related to estimating available forage. These technologies enable a quicker and more accurate measurement of the available forage in each field or paddock. In the sections below, we give you examples of how you can use these technologies to help you get better estimates for your pastures and how this information can be used to optimize the management of your ranch.
There are different brands and models of RPMs available that you can acquire. The calibration equations required vary by RPM model, forage species, regions, and developmental phase of the grass plants (i.e., vegetative, transition and reproductive).
In order to know if there are RPMs calibrated for your region and for your grass types, consult local extension agents or other forage specialists from your region. If you want to acquire an RPM and calculate the calibration equations for your pastures by yourself, you can do so by following the manufacturer’s manual of instructions of whichever RPM.
2.1 Using the rising plate meter to estimate available forage
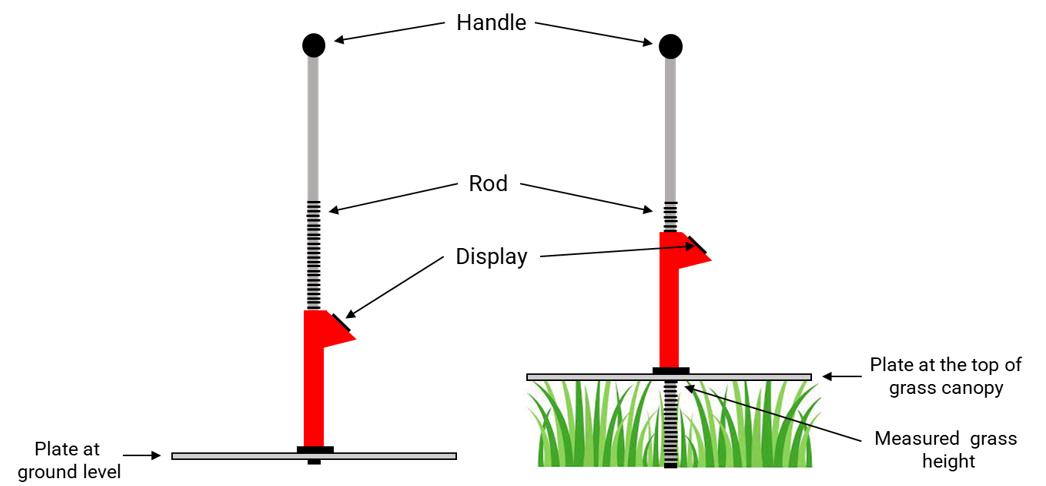
The rising plate meter (RPM) is a useful tool for estimating available forage in rotationally grazed pastures. The primary components of an RPM typically consist of a weighted circular metallic plate and a meter stick inserted through the center of the plate. The plate is connected to the rod by a counter, which counts the number of notches on the rod as the plate moves when placed on the ground. In order to obtain measurements within a pasture, the plate is placed atop the forage canopy, lightly compressing the leaves and stems until they support the weight of the plate (Figure 2).
The RPM can measure pasture stands ranging from 0 to 50 cm in height, depending on the RPM model used. The point at which the plate intersects with the meter stick provides the measurement of the compressed height, which is then utilized to determine the estimated forage yield through established mathematical correlations for various types of forage. This estimation can subsequently be used to determine the appropriate stocking rate for each pasture.
The plate meter provides the benefit of consolidating forage height and canopy density into one reading, ultimately saving time for users.
Those who use the grazing stick recognize that obtaining accurate forage yield estimations necessitates measuring both forage height and canopy cover (a time and labour-intensive activity), whereas the RPM combines both factors in a single reading.

2.1.1 Types of RPMs
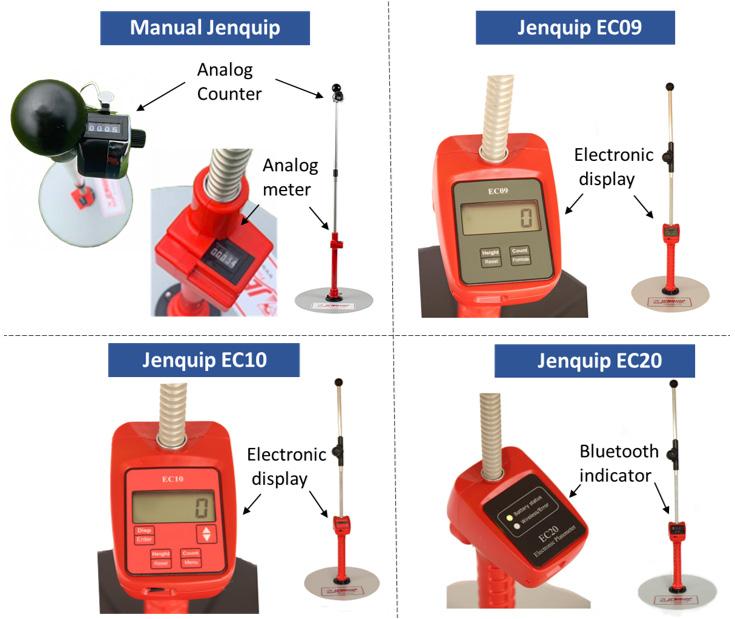
Different models of RPMs have varying features related to recording and storing of obtained data. Some models require users to carry a pen, paper and calculators in the field. Meanwhile, other models enable the automatic calculation of available forage and the storage of all pasture data within the RPM unit, which can be later downloaded to a computer via USB (Figure 3).
functions collection, storage calculation.
Manual requires that producers take note of each measurement in the field from the analog meter and counter, and manually calculate the available forage in each paddock. The Jenquip EC09 (top right) automatically calculates available forage in each paddock (shown in the electronic display), but still requires that producers take note of each measurement in the field since the data cannot be automatically saved. The Jenquip EC10 (bottom left) automatically calculates available forage in each paddock (shown in the electronic display) and stores data for up to 99 paddocks, which can be later downloaded via USB cable. The Jenquip EC20 (bottom right) automatically calculates available forage and stores the data on the user’s smartphone (either Android or iOS) via Bluetooth connection. The Jenquip EC20 also collects and saves the GPS location for each measurement taken. To our knowledge, only RPMs manufactured by Jenquip (NZ-based) are commercially available in North America. Other options available elsewhere include PlatemetersTM (NZ-based) and Grasshopper (UK-based).
2.1.2 How to use an RPM
Zero-calibration test
Before starting data collection in any pasture, turn on the RPM and test if it correctly reads the zero position at ground level. The procedures for this test will vary from model to model. Therefore, make sure to follow the manufacturer’s manual of instructions for your specific RPM model.
Taking paddock readings
In order to obtain data in an effective and time efficient way, adhere to the following procedures:
• Walk in zig-zap (or W-pattern) across each paddock, and take a measurement at consistent intervals (for instance, every 20 steps) instead of selecting sampling spots by eye.
• Most paddocks will have areas with good, average and poor growth. When collecting data with the RPM, make sure you are not biased towards any particular area. Try to include samples of all types of areas in your observation.
• Take between 20 to 40 measurements per paddock. In paddocks that are highly variable, take a higher number of samples. The more samples taken per paddock, the more accurate the estimates will be.
• Avoid sampling in areas with cattle tracks, stock camp sites or any other atypical areas relative to the overall pasture.
The
• Maintain consistency by taking the same route when taking readings from each paddock. You can switch up the direction and start from the opposite end, but keep the path the same each time. This way, you can easily compare your observations from one walk to the next.
• Place the RPM on top of the pasture with as little pressure as possible. Do not plunge the RPM onto the pasture or apply pressure.
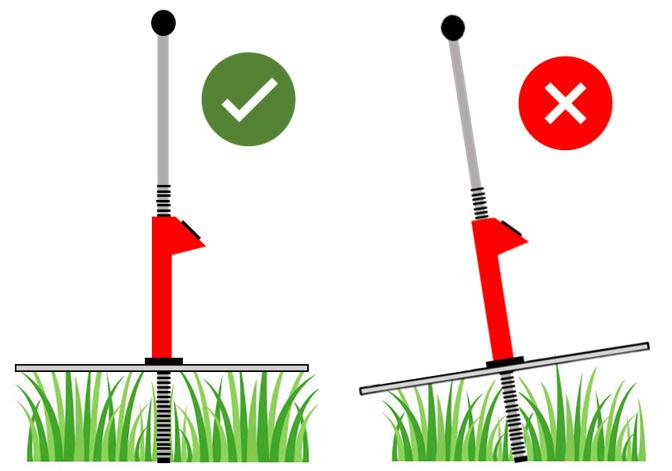
• Position the RPM at a 90° angle to the ground during each reading (Figure 4).
• Switch the RPM off while navigating around obstacles, such as fences or creeks, to avoid taking readings if the plate moves.
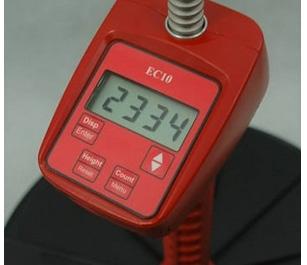
When you enter a paddock and begin collecting readings using the RPM, depending on the model of RPM you choose, the display will show you the available biomass per acre or per paddock after each reading (depending on how it is configured which can be found on each RPM’s manual of instructions). The total dry matter (DM) will be continuously averaged out every time you take a measurement. For instance, if you take 20 measurements in a paddock, the number shown on the RPM’s display after the 20th reading corresponds to the average available forage (DM lbs) from those 20 readings (Figure 5). As discussed earlier, the more measurements within a paddock, the higher the accuracy of the RPM in estimating available biomass. Table 2 above shows an example of how the available forage in each paddock within a field can be organized.
2.2 Using satellite imaging to estimate available forage
Satellite imaging has been used to advance crop management by offering almost real-time monitoring, precise data analysis and informed decision-making. In grazing management, satellite imaging can be used to estimate available forage in any given field using the Normalized Difference Vegetation Index (NDVI). Satellite-derived NDVI data offers an unbiased and objective measure of vegetation health and biomass, allowing farmers to make informed decisions about grazing management based on accurate and up-to-date information. Furthermore, monitoring pasture biomass through satellite imaging reduces the need for time-consuming and labour-intensive field assessments. This allows farmers to more efficiently allocate their time and resources to other important aspects of their operation.
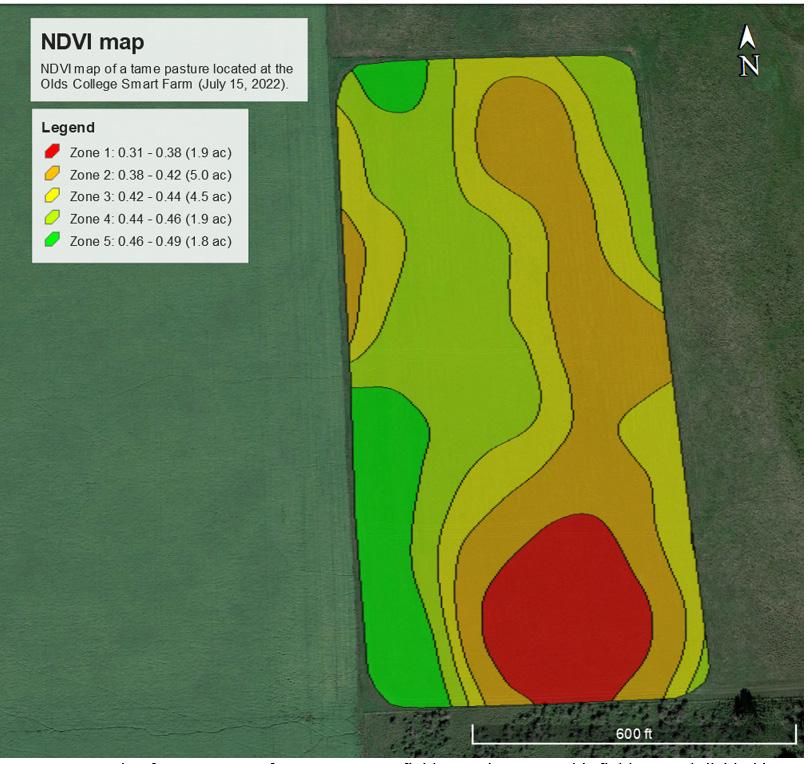
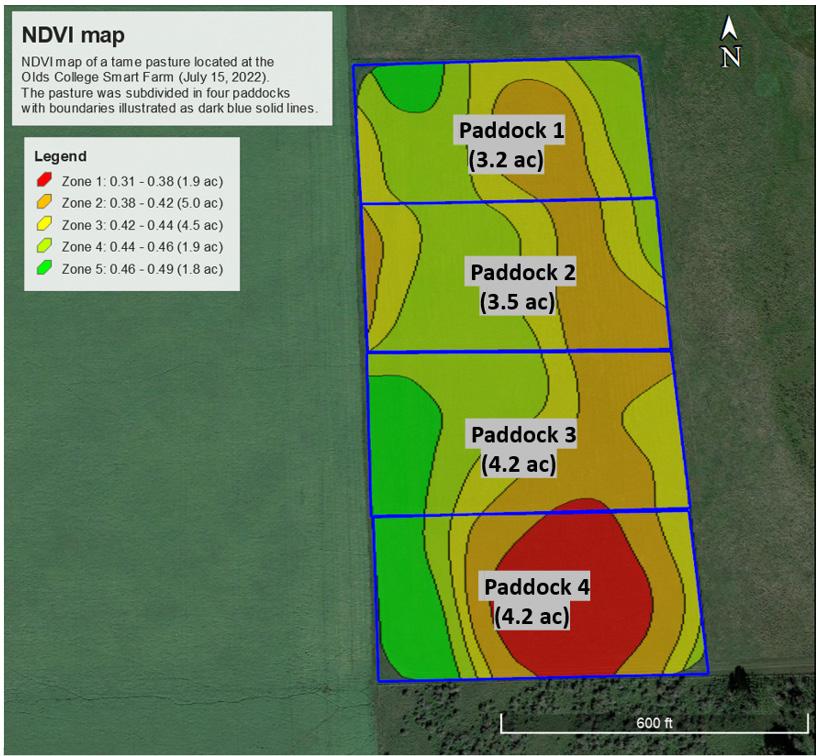
NDVI is a tool used to assess the difference between near-infrared (NIR) and visible red light reflected by plants. Healthy and productive plants with abundant chlorophyll content reflect more NIR light and absorb more red light, resulting in higher NDVI values. Unhealthy or sparse vegetation reflects less NIR light, leading to lower NDVI values. As a result, NDVI serves as a practical tool for estimating forage biomass in pasturelands. NDVI values typically range from -1 to 1. Figure 6 shows an example of an NDVI map of a tame pasture.
Note: You will need to do the calculations every time you plan to move the herd into a field. The calculations are based on the assumption that sufficient rest was provided to each field prior to it being grazed.
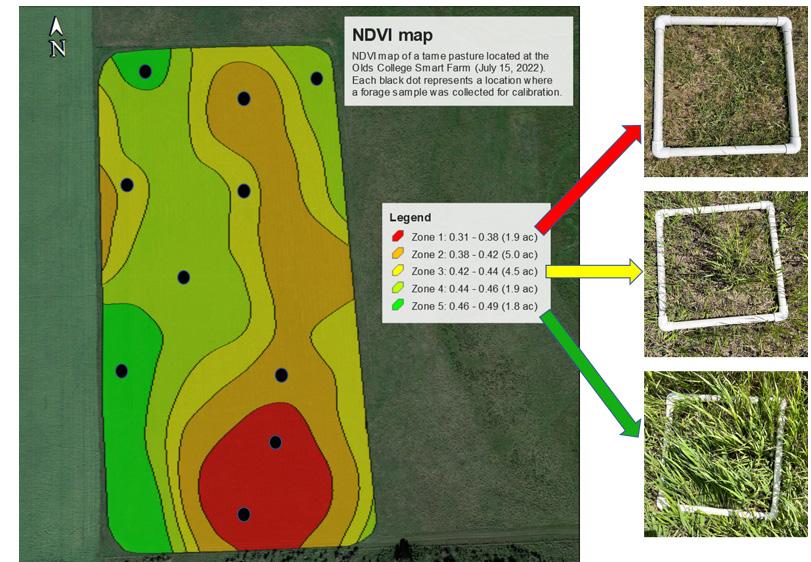
using was subdivided into five different productivity zones (i.e., Zone 1 to Zone 5) with NDVI values varying from 0.31 (lower value in Zone 1) to 0.49 (higher value in Zone 5). Besides calculating NDVI values for the field, the area of which zone was also calculated (ac = acres) which is crucial to estimate the forage in each zone and for the entire field. This NDVI map represents the conditions of a field from the Olds College Smart Farm on July 15, 2022. The imaging data used came from the Sentinel-2 satellite mission and was downloaded from The Copernicus Open Access Hub webpage (www.scihub.copernicus.eu).
2.2.1 Interpreting NDVI values
NDVI values can be interpreted as follows:
• -0.1 to -1 (Negative values): These values usually represent non-vegetated areas such as water bodies or bare soil.
• 0 to 0.2 (Low positive values): These values suggest sparse or stressed vegetation, which may indicate low forage availability or poor pasture health.
• 0.2 to 0.5 (Moderate positive values): These values represent moderately productive or healthy vegetation, indicating moderate forage availability and average pasture conditions.
• 0.5 to 0.8 (High positive values): These values signify healthy and actively growing vegetation, suggesting good forage availability and pasture conditions.
• 0.8 to 1 (Very high positive values): Although these values are less common in pasturelands, they may represent very dense, healthy pastures.
It is important to note that the NDVI values from a given field can either vary substantially from zone to zone, or they can be fairly similar between zones. For instance, the zones within the field shown in Figure 6 range in NDVI values from 0.31 to 0.49.
2.2.2 Variability within a field
The variability in NDVI values within a field will depend primarily on the following factors:
Soil properties: Soil texture, fertility, and moisture content can vary within a field affecting the growth and health of plants. Areas with well-drained, fertile soils typically support healthier and denser vegetation resulting in higher NDVI values.
• Plant species composition: The presence of different plant species with varying growth patterns, leaf structures and chlorophyll content can affect the NDVI values within a field. Some species might have higher NDVI values due to their denser or healthier appearance, while others might have lower values.
• Management practices: Past management practices, such as fertilizer application, irrigation, and grazing, can impact the spatial distribution of vegetation health and biomass. Overgrazing or uneven fertilizer application can lead to patches of poor vegetation and lower NDVI values.
Therefore, in fields where soil properties, plant species composition, and grazing management practices are less uniform, NDVI tend to be more variable from zone to zone. Larger fields and native grasslands tend to be more variable compared to smaller fields and tame pasture.
In order to use satellite images to obtain NDVI values of a certain field and then use it to estimate forage biomass, a number of procedures need to be followed. These procedures are described in following sections.
2.2.3 Obtaining satellite images and NDVI values
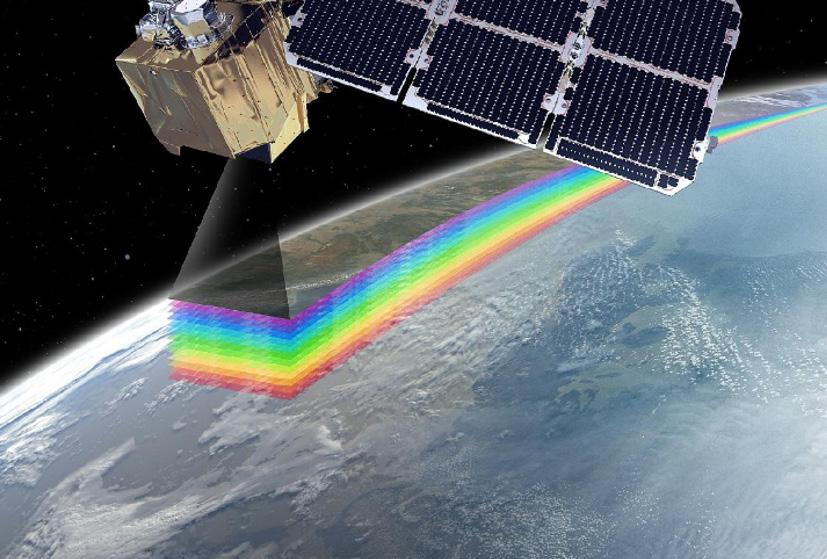
NDVI values can be calculated from various satellite images, as long as they provide data in the near-infrared (NIR) and visible red-light bands. However, data from the Sentinel-2 satellites (Figure 7) are often preferred for calculating NDVI for several reasons:
• Spatial resolution: Sentinel-2 satellite images offer a high spatial resolution of 10 meters for NIR and red bands. This fine resolution enables more precise monitoring of vegetation health and biomass at the field level, making it ideal for agricultural applications.
• Temporal resolution: Sentinel-2 has a relatively high temporal resolution with a revisit time of just five days when considering both Sentinel-2A and Sentinel-2B satellites. This means that new images are available more frequently, allowing for more timely monitoring of vegetation changes, which is crucial for managing grazing and other agricultural activities.
• Data availability: Sentinel-2 data is provided by the European Space Agency (ESA) and is freely available to the public. This open data policy allows farmers, researchers, and other users to access and use the data without incurring additional costs.
2.2.4 Downloading Sentinel-2 data
There are several steps involved in downloading Sentinel-2 data for a specific pasture field. While some producers may have the technical skills to perform these tasks, most are likely to require assistance from GIS consultants or professionals to download the data efficiently and perform NDVI calculations and zone mapping.
Here are the general steps for obtaining Sentinel-2 data for a given pasture field:
• Identify the location: To download satellite data for a specific pasture field, first, you will need to know its geographical coordinates (latitude and longitude) or a clearly defined boundary.
• Access data platforms: Sentinel-2 data can be accessed through the Copernicus Open Access Hub platform (scihub.copernicus.eu), which requires registration and signing in to access and download the data.
• Search and filter: Once you have accessed a data platform, you can input the coordinates or boundary of your pasture field and set the date range of your interest. You can then filter the results based on cloud cover percentage to ensure you select images with minimal cloud interference. Aim for Sentinel-2 images acquired as close as possible to the start of the grazing period. Considering the five-day interval between each Sentinel-2 image, this approach allows for a more accurate assessment of the available forage to be consumed by your herd. One potential challenge in obtaining accurate Sentinel-2 data is the interference of clouds, which can obscure the field and reduce the quality of the imagery. To deal with this issue, it might be necessary to examine Sentinel-2 images taken slightly before the grazing period. By doing so, you can find an image with minimal cloud cover that still provides a reasonably accurate representation of the field's forage conditions at the start of the grazing period. Keep in mind this approach may involve some compromise as the image may not perfectly align with the exact start of the grazing period, but it will help ensure that the data used for calculating NDVI is as clear and reliable as possible.
• Download data: After selecting the appropriate images, you can download them in a format compatible with GIS software, such as GeoTIFF.
At this point, a GIS consultant or professional can assist with the NDVI calculations and zone mapping using the downloaded Sentinel-2 data.
2.2.5 Calculating NDVI data from Sentinel-2 data
You or the hired consultant will likely use GIS software like ArcGIS or QGIS to process Sentinel-2 data, perform necessary calculations, and create maps that visually represent NDVI values across the pasture field. Consulting a GIS professional for these tasks is advantageous for producers as they can provide accurate and reliable results while also guiding producers on how to interpret the data. Regardless of who does the NDVI mapping, it is important to adhere to the following principles:
• Process data for NDVI on a per-field basis: Two different fields should not have their NDVI calculated together unless they have precisely the same spatial composition, overall soil type and identical grazing management history. This is because each field may have unique characteristics that influence NDVI values, such as soil properties, management history and plant species composition. Combining fields with different characteristics could lead to inaccurate NDVI classification and
• Use at least five NDVI zones per field: Using at least five NDVI zones when estimating forage biomass is essential for achieving a balance between accuracy and practicality. Having fewer zones might not provide sufficient resolution to accurately capture the variability of pasture biomass and health within a field.
2.2.6 Calibrating the NDVI data using clipped forage samples
To ensure the accuracy of NDVI-based forage biomass estimations in a given field, it is necessary to calibrate the NDVI data by using clipped forage samples from that field. This process helps to calibrate the satellite-derived estimates and provides a more accurate representation of the available forage. You can conduct forage clipping yourself and then send the clipped forage data to the hired GIS professional for the NDVI analysis. The GIS professional can then calibrate the NDVI values using the data from the clipped samples and provide actual forage estimates from each field.
To ensure accurate and representative forage sample collection, follow these steps to collect forage samples:
• Timing: Aim to download the Sentinel-2 images and perform forage clipping on dates as close as possible to the beginning of the grazing period (if possible, within a week from when grazing starts). This ensures that the data is relevant to the actual conditions in the field.
• Ensuring consistent sampling area: Use a quadrat measuring 0.5 x 0.5 meters (2.69 ft2) to delineate the sampling area within each NDVI zone. This standardizes the sample size to allow for consistent comparisons between zones (Figure 8).
• Sample collection: Clip at least two forage samples from distinct locations within each NDVI zone, to a total of 8 to 12 samples depending on the number of using scissors or shears to trim the vegetation to approximately two inches above the ground. Multiple samples per zone account for any variability and provide a more accurate representation of the overall biomass within that area.
• Sample handling: After collecting the samples, place them in separate, labeled bags ensuring that each bag corresponds to a specific NDVI zone and sample location. This will help in organizing and analyzing the data later on.
• Data recording: Make note of the date, time and specific location (GPS coordinates if possible) for each sample collected. This information is vital for comparing the groundtruthed data to the NDVI values derived from the Sentinel-2 imagery.
• Sample drying: Weigh the fresh forage samples immediately after clipping, then dry them using a home microwave until they reach a constant weight. Follow these steps:
• Spread the fresh samples evenly on a microwave-safe plate ensuring they do not overlap. This allows for consistent drying and prevents burning.
• Place a microwave-safe glass of water in the corner of the microwave to help absorb excess energy and reduce the risk of burning the samples.
• Set the microwave power to medium or medium-high (50-70% power) and heat the samples in 1 - 2 minute intervals.
• Check the samples after each interval and gently mix them to promote even drying.
Continue the process until the samples feel dry and brittle to touch, and they do not change weight upon additional heating. This will provide the dry matter (DM) weight of each sample, which is a more accurate representation of the available forage biomass.
• Keep in mind that drying times may vary depending on the microwave's power and the moisture content of the samples. It is essential to monitor the drying process closely to prevent burning or overheating the samples. You can use a kitchen scale to weigh the forage samples during this step.
• Sending data to the GIS consultant: With the dry forage mass data from the clipped samples in hand, the GIS consultant will analyze the relationship between the NDVI values and the corresponding DM weights of the forage samples collected within each zone. This can be done using linear regression or other statistical techniques to establish a calibration equation that relates NDVI values to actual forage biomass.
2.2.7 Results from NDVI mapping
Once you have the dry weight data from the clipped forage samples, you will use the amount of forage within each quadrat (g/0.25 m2) to estimate the amount of forage per NDVI zone (lbs/acre). An example of how to do this calculation is provided in Table 3 below.
In addition to knowing how much forage is available in a field, you can also estimate how much forage is available in each paddock within a field. In this case, you will need to tell the GIS consultant approximately where the fence separating each paddock is (if you already have a permanent fence in place separating each paddock) or where it will be (if you will use a temporary electric fence to separate each paddock).
Figure 9 shows how the boundaries of each paddock within a field can be mapped out using GIS software to determine each paddock’s area. Once each paddock has been mapped out, the area of each NDVI zone within each paddock can be determined. Subsequently, by using the area of each paddock, the area of each NDVI zone within each paddock, and the yield per NDVI zone, you or the GIS consultant can calculate the available forage within each paddock by replicating the approach discussed and shown in Table 4.
As shown in this section, you can estimate the amount of available forage per field or per paddock by using NDVI zoning which, combined with the knowledge about the daily amount of forage required by your herd, will enable the optimization of your grazing plan.
Table 3: Example of how to calculate the amount of available forage per NDVI zone in a field and thereby in the entire field. First, you will obtain the dry weight (g) from each clipped forage sample (2 samples per NDVI zone) collected within the quadrat (0 25 m2) You will then multiply the dry weight of each forage sample by a factor of 35 178 to obtain the estimated yield per sample (e g , 20 x 35 178 = 714 DM lbs/ac) Subsequently, you calculate the average yield in each zone by s umming up the estimated yield from the two clipped samples in each zone and dividing the total by two (e. g., (714 + 1000)/2 = 857 lbs/ac). Finally, you multiply the yield in each zone (DM lbs/ac) by the area (ac) of each zone to obtain the total available forage in each zone (e. g., 857 x 1.9 = 1,628 DM lbs). The total available forage for the entire field can then be calculated by summing up the forage available from all NDVI zones. The data shown in this table were collected from the sa mpling locations shown earlier in Figure 8.
Table 3: Example of how to calculate the amount of available forage per NDVI zone in a field and thereby in the entire field. First, you will obtain the dry weight (g) from each clipped forage sample (two samples per NDVI zone) collected within the quadrat (0.25 m2). You will then multiply the dry weight of each forage sample by a factor of 35.178 to obtain the estimated yield per sample (e.g., 20 x 35.178 = 714 DM lbs/ac). Subsequently, you calculate the average yield in each zone by summing up the estimated yield from the two clipped samples in each zone and dividing the total by two (e.g., (714 + 1000)/2 = 857 lbs/ac). Finally, you multiply the yield in each zone (DM lbs/ac) by the area (ac) of each zone to obtain the total available forage in each zone (e.g., 857 x 1.9 = 1,628 DM lbs). The total available forage for the entire field can then be calculated by summing up the forage available from all NDVI zones. The data shown in this table were collected from the sampling locations shown earlier in Figure 8.
By multiplying the average yield in each NDVI zone by the area of the zone within each paddock, you will obtain the available forage from each zone within each paddock (e g , Zone 2 in Paddock 1 = 1268 DM lbs/ac x 1 ac = 1270 DM lbs). To acquire the available forage per paddock, you will sum up the available forage from all zones within each paddock (e g , Available forage in paddock 1 = 0 DM lbs + 1270 DM lbs + 2055 DM lbs + 946 DM lbs + 771 DM lbs = 5043 DM lbs).
Table 4: Example table of how you can calculate the amount of forage available per paddock within a field. In order to acquire this information, you need to communicate to your GIS consultant that you want to have not only the area of each NDVI zone within a field, but also the area of each NDVI zone within each paddock. By multiplying the average yield in each NDVI zone by the area of the zone within each paddock, you will obtain the available forage from each zone within each paddock (e.g., Zone 2 in Paddock
1 = 1268 DM lbs/ac x 1 ac = 1270 DM lbs). To acquire the available forage per paddock, you will sum up the available forage from all zones within each paddock (e.g., Available forage in Paddock 1 = 0 DM lbs + 1270 DM lbs + 2055 DM lbs + 946 DM lbs + 771
DM lbs = 5043 DM lbs).
