
15 minute read
OPTIMISATION KEEPS THE BEER FLOWING


© ILTP
OPTIMISATION KEEPS THE BEER FLOWING
MARKUS MICKEIN, MATTHES KOCH AND KNUT HAASE
THE INSTITUTE FOR LOGISTICS, TRANSPORTATION, AND PRODUCTION OF THE UNIVERSITY OF HAMBURG implemented a model-based production planning system at the Swiss brewery Feldschlösschen. Feldschlösschen is the leading brewery in Switzerland, with a market share of 40% and revenue of nearly CHF 1 billion (approx. £776 million). The company was founded in 1876 and acquired by the Carlsberg Group in 2000. The largest production site in Rheinfelden produces 1.8 million hectolitres per year.
Beer manufacturing contains brewing, fermentation, maturation, filtration, and filling. Feldschlösschen cooperates with the project team of the University of Hamburg because there is no suitable industrial production planning solution that covers brewery needs, such as unique storage tank operations with processing times. Feldschlösschen defined three requirements for the planning system: considering all operations and resources, modelling the multilevel production system and process restrictions, and optimising production and inventory schedules. Therefore, we
designed a planning system customised for breweries. The mathematical program optimises each resource of the entire product system to support holistic planning.
Figure 1 illustrates the brewery production process. At first, the brew house brews the base beer. The base beer stays in the storage tanks for fermentation and maturation. Next, the filtration filters undesirable particles to produce semifinished beer. Buffer tanks keep semifinished beer until further processing. Finally, the filling lines fill the beer in bottles, cans, and kegs. The warehouse stores the finished beer until delivery to the customer. Various production and storage tank resources are available at each production stage. In addition to the general brewing process, particular beer types such as speciality beer, alcohol-free beer, and mixed beer require additional processing with special equipment.
CHALLENGES AND APPLICATION The brewing industry is confronted with new challenges as a result of changing consumer preferences. The demand for speciality and alcohol-free beer has increased in recent years. As mentioned before, such beer types require special equipment and hence adaptations to the production system. Feldschlösschen’s product portfolio includes 220 finished goods out of 100 semifinished goods. The production system contains 13 production resources and 8 storage groups. The growing number of products and resources increase the planning complexity.
Since most supply chain planning issues have strong dependencies, the decision making is centralised in the supply chain planning department. For this reason, the planning department strives at a transparent planning procedure to simplify the decision communication and improve solution acceptance. Challenges regarding changing consumer preferences, complex production processes, and transparent planning necessitate the application of an advanced analytics tool. Therefore, the project team developed a model-based production planning system.
The planning department requires a comprehensive scenario analysis tool for tactical tasks and strategic issues as well as an operative planning tool. Tactical planning tasks include selecting shift schedules or identifying temporarily required capacity extensions. Strategic planning issues contain evaluating the impact on the production system regarding changes in product portfolio, production volume, and production equipment. The detailed process mapping for the tactical and strategic planning activities guarantees operational feasibility. The operational planning tool provides detailed schedules that includes production quantities, inventory levels, required overcapacities, production sequences, and storage tank allocations.
PLANNING SYSTEM The planning system consists of a user interface for data collection and validation as well as a dashboard for visualising the optimisation results embedded in a cloud-based optimisation framework (see Figure 2). The user-friendly interface is designed for production managers and planners without a mathematical optimisation background. The server stores the data and hosts the optimisation engine.
The employed brewery-specific production planning problem considers relevant process restrictions, such as the available number of storage tanks, different storage tank groups, and processing times. The planning system implements the optimisation model and algorithm in GAMS/CPLEX. The computationally intensive optimisation runs on scalable cloud services to reduce computing times and hardware costs.

FIGURE 1 THE BEER PRODUCTION PROCESS © INFORMS
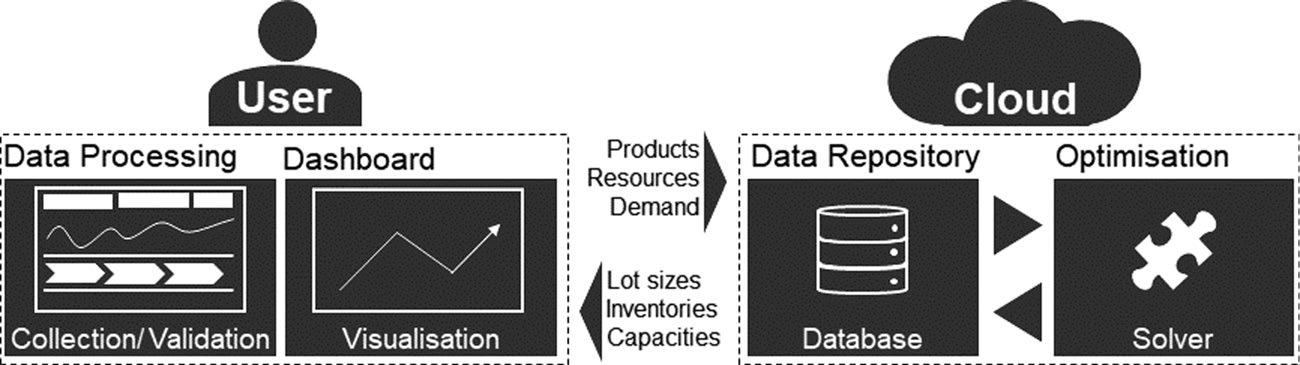
FIGURE 2 THE PLANNING SYSTEM © INFORMS
The user interface provides the input data collection from various sources, i.e., master data from the ERP system and additional data from spreadsheets. The basis data query includes the product, resource, and demand data for operational planning. Collecting and adjusting data sets enables the creation of different production scenarios for tactical and strategic analysis. The user interface visualises the collected data for quick checks and provides a comprehensive data validation to ensure structurally correct data sets for optimisation.
The integrated visualisation tool displays the optimisation results in dashboards. Derived key performance indicators predict the future performance in operational planning, e.g., utilisation and costs. In addition, the indicators quantify the impact of different production scenarios for comparison. The management report contains an overview and a detailed dashboard. The overview dashboard enables a simple identification of bottleneck resources. The detailed dashboard provides production and storage tank schedules.
ADDED VALUE The customised planning system applies to operational, tactical, and strategic planning activities. Considering all relevant process stages and restrictions guarantees practicable production schedules. In addition, the detailed plans reduce the manual planning effort and the need for reactive capacities due to improved planning quality. The scenario analyses improve cross-divisional decision making by quantifying the impact on the entire production system of planning decisions by other departments in various production scenarios.
Besides nonmonetary benefits, the new planning system reduces investment costs by avoiding reactive capacities and inefficient equipment as well as realising operational cost savings by optimised production and inventory schedules.
SUCCESS FACTORS The involved departments were integrated in the software development process from the beginning to ensure the acceptance of model-based planning solutions. Besides higher trust in the optimisation results, this procedure gets detailed process knowledge from expired planners and customise the tool for the enduser's need. Thus, the project team implemented a supportive data validation and calculation report to support users in data collection and result interpretation. The data validation ensures correct data sets for optimisation. Additionally, the calculation report displays unexpected relaxations of constraints during the optimisation, for example, the used capacity exceeds the given capacity. This information supports planners in identifying bottlenecks and adjusting production scenarios.
CONCLUSION The project team developed a modelbased production planning system designed for the brewing industry and the implementation at the Swiss brewery Feldschlösschen. The main advantage of the proposed system is the consideration of the relevant process stages and restrictions as well as the application of different planning activities in one planning system. Considering the process-specific constraints improves the planning quality. Integrating all planning activities in one planning system guarantees operational feasibility for tactical and strategic decisions. Applying the new planning system supports Feldschlösschen in reducing planning effort, reactive capacities, inefficient investments, and operational costs.
Feldschlösschen’s Head of Supply Chain Planning & Product Change Management said: “The software supports strategic and tactical planning decisions in standardised reports. The most significant value added is the analysis of the interactions between production stages as the consequence of decisions. This enables us to better quantify investment requirements and evaluate future strategies. It reduces investment costs by identifying actual need and realises operational cost savings by analyzing strategic scenarios in a holistic manner. Furthermore, it improves decision communication to the relevant departments.”
OUTLOOK The project team currently works on higher modularity, integrating advanced optimisation methods, and considering related planning problems to extend the planning system. Higher modularity

simplifies adaptations of the planning system to other production sites and industries. Furthermore, integrated advanced optimisation methods are able to cope with further challenges, for example, stochastic programming to manage demand uncertainty and multicriteria optimisation to balance different company targets. Moreover, considering additional related planning problems improve holistic decision making in supply chains, e.g., production network design.
Markus Mickein is a PhD candidate in operations research and management science at the Hamburg Business School, Universität Hamburg. His research focuses on advanced optimisation approaches for lot-sizing in the process industry. Matthes Koch is a specialist in operations research and managing partner at the consultancy DESIOR. His research work through a PhD program at Universität Hamburg focused on management systems for large-scale problems in crowd management.
Knut Haase is the director of the Institute for Logistics, Transportation, and Production at Universität Hamburg. His research topics are focused on optimisation approaches for solving large-scale problems with applications in logistics, public transport, and crowd management.
FOR FURTHER READING
Mickein, Markus, Matthes Koch and Knut Haase (2022). A Decision Support
System for Brewery Production Planning at Feldschlösschen. INFORMS
Journal on Applied Analytics 52:158–172.

FURTHER SUGGESTIONS TO SUPPORT YOUR EFFORTS TO UNDERSTAND THE POTENTIAL IMPACT OF CLIMATE CHANGE
Nicola Morrill
If I had an hour to solve a problem and my life depended on it, I would use the first 55minutes determining the proper question to ask. Albert Einstein
In my last column, I explored ways that O.R. and Analytics can help with understanding the potential impact of climate change. Here I will explore where more traditional areas of O.R. and Analytics are able to help: covering discrete event simulation and forecasting.
EXPRESSING CLIMATE CHANGE AS A PROBLEM As a quick re-cap, climate change, expressed as a problem, is an example of a Megatrend and a ‘wicked problem.’ Megatrends are typically slow to form; persist for a long time (circa. 10-15 years); occur at a global or large scale; and are visible and well known to everyone. A ‘wicked problem’ is generally, a social or cultural problem that is difficult or impossible to solve—normally because of its complex and interconnected nature.
My previous article shared some of the approaches and examples that are useful in exploring such situations with a principle focus on increasing understanding. Here, I focus on where an O.R. practitioner extracts a part of the complex mess to enable a focused exploration of an issue related to the system to be explored.
MOVING INTO IDENTIFYING THE ISSUE TO BE CONSIDERED Considering the questions to be explored is a key aspect in increasing understanding of a problem and preparing to address it. This is not a trivial thing to do and is something that warrants a decent amount of time spent on it; sadly, this is too often not the case. Exploring and shaping the question is an area that O.R. as a discipline has much to offer – look to Problem Structuring Methods for more details. The nature of the question will be shaped by whether it is a puzzle, problem or mess that is to be explored. Figure 1, taken from Mike Pidd’s 1996 book Tools for Thinking, provides an insight into where these vary along the axes of problem formulation and the ‘solution’. The difference for each is related to how much agreement there is on each axis. Puzzles tend to be tightly bound, have lots of certainty and a clear answer, where messes have lots of different interpretations and there is always debate. This is in contrast to a problem where it is possible to have agreement around its focus but as there is unlikely to be one definitive answer, the solution tends to be less agreed. This links into the notion that ‘problems are social constructs,’ where people see issues in diverse ways; re-enforcing the importance of diversity of thought in addressing problems.
Welham (2021) (https://bit.ly/theaccidentalmarketer) provides a clear and succinct overview of the differences between puzzles, problems and messes and discusses the importance of problem formulation; so, it is not just O.R. people that see how tremendously important it is!
In the context of considering how O.R. can help with questions organisations may wish to address related to climate change, McKinsey (see A framework for leaders to solve the net-zero equation | McKinsey) have identified a range of ‘requirements for ‘solving’ the net-zero equation’ (see Figure 2). They have articulated a series of questions related to these requirements that some businesses may

© Mike Pidd
FIGURE 1 PUZZLES, PROBLEMS AND MESSES

FIGURE 2 NINE REQUIREMENTS FOR SOLVING THE NET-ZERO EQUATION
wish to consider in supporting their efforts towards netzero. Clearly this is not an exhaustive list or suitable for all organisations but provides an insight into the micro level questions to consider.
LOGISTICS, SUPPLY CHAINS AND DISCRETE EVENT SIMULATION Discrete Event Simulation (DES) is a modelling approach used to model real world systems where they can be separated into a set of logical processes that autonomously progress through time. If it is possible to create a process map of the system being considered, it is likely that DES can be applied. In the McKinsey questions, the one related to bottlenecks is well suited to DES.
A good, accessible overview of DES is provided in an Impact article (see https://bit.ly/Elder2015) by Mark Elder. Figure 3 is from a 2018 Impact article on modelling logistics at the Port of Dover: (https://bit.ly/Dover2018). One area the work explored was understanding how the Port could best handle future volumes of traffic and the team decided to use DES as ‘the Port consists of a series of process steps, each preceded by orderly queues.’ The layout and processes of the Port are shown.
This was then used to create a simulation model where the team modelled the current day system as well as modelling potential future scenarios (see Figure 4).
Here are a few examples of where DES has been applied to issues related to climate change.
• Estimating CO2 emissions that result from equipment usage during a construction project with the goal of allocating resources to make projects more eco-friendly. (See https://bit.ly/EstimatingCO2) • Simulation modelling and analysis for sustainable supply chains. This work identified the benefits of consolidation of transport orders, which would result in a fewer number of trucks on the road. (See https://bit.ly/SCSustainable)
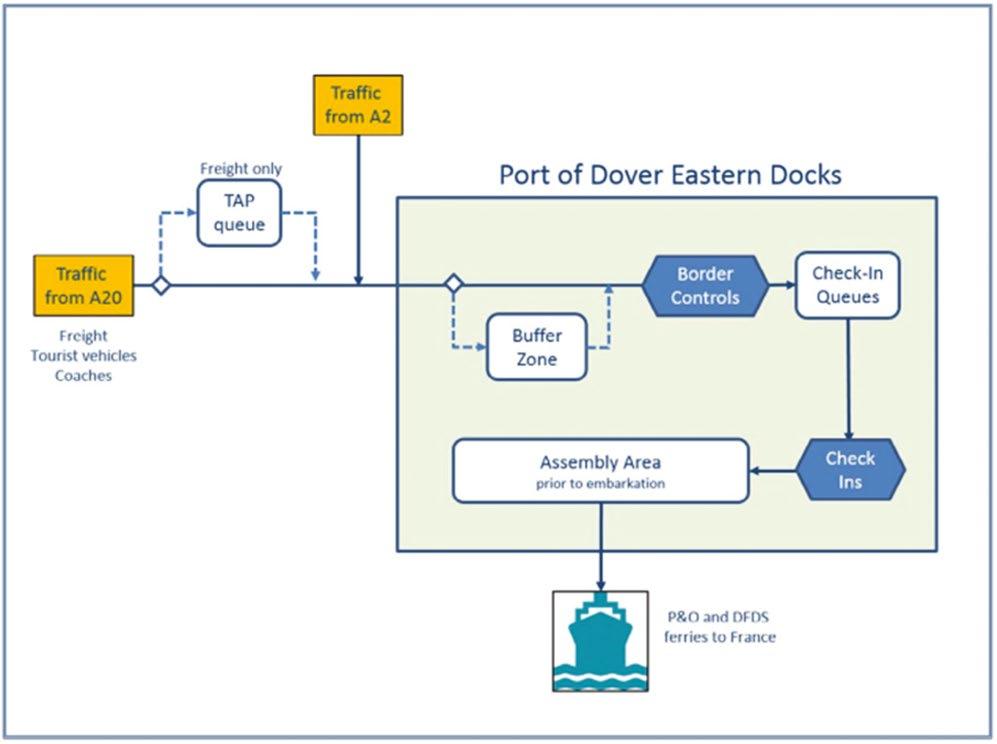
FIGURE 3 SCHEMATIC OF THE PORT OF DOVER EASTERN DOCKS (OUTBOUND TRAFFIC)

FIGURE 4 BASELINE SIMUL8 MODEL OF THE PORT OF DOVER EASTERN DOCKS
• Simulating vehicle movements on the road to explore the impact of traffic congestion on CO2 emissions.
The work identified that factors such as synchronization or desynchronization of traffic lights, mode of dispatch rates, and route configurations were important factors to consider. (See https://bit.ly/DESGreenSC) • An analysis of carbon friendly supply chains, based on a 3-tier system, created a simulation model that ran a range of scenarios. It was considering the CO2 emissions along supply chains from freight energy use to inventories storage and identified that the location of the first-tier supplier is particularly important. (See https://bit.ly/CarbonFriendlySC)
DES is an O.R. approach that has wide applicability in supporting efforts on looking at climate change with a focus on specific types of questions. Some of the software packages, such as Simul8, have carbon emission features built into them.
CONFIDENCE IN ACHIEVING TARGETS AND FORECASTING Forecasting is another area of O.R. that has use when exploring issues related to climate change. Forecasting is a commonly used word and in the context of this article I use the term to refer to the host of formal analytical approaches to undertaking a forecast. An article in the Harvard Business Review (https://bit.ly/forecastingtechniques) provides an accessible insight into the different ways to formally undertake forecasting and a paper by Fildes et al (2008) presents a review of forecasting and also provides a useful insight into different techniques (see https://doi.org/10.1057/palgrave.jors.2602597).
In April 2022, EUROCONTROL issued a new long-term air traffic forecast, focussing out to 2050, (see https://bit.ly/EuroControl2050), which provides insights into how aviation may be able to achieve net-zero emissions over that period. This forecasted a range of scenarios and included consideration of growth in demand and the changing nature of the aircraft fleet. Figure 5, from the report, provides an insight into one aspect of the forecasting work.
Other examples, include:
• Scottish Government Zero Emission Energy for Transport Report, which provides forecasts out to 2045 across a range of scenarios for national demand for electricity and hydrogen. The underlying question for the work

© EUROCONTROL
FIGURE 5 EUROCONTROL AVIATION OUTLOOK 2050-BASE SCENARIO
undertaken related to decarbonising the transport sector (see https://bit.ly/TransportScotand2022). • The Deloitte carbon forecasting model was used by the organisation to improve the sustainability of its own business practises, resulting in changes to its air travel and lease car policies. The question sitting behind the modelling was the goal of carbon neutral business operations within
Deloitte Netherland by 2025 (see https://bit.ly/DeloitteNL) • In the investment world there are a few carbon forecasting models with a focus on supporting sustainable equity decisions.
In some examples related to organisations improving their climate risk forecasting there were discussions around what to do when there is no data available. This is more common a challenge than people may think. It is an important consideration and something that O.R. is well versed in addressing.
Finally, it would be remiss of me not to mention the importance of validation, verification, and governance over what will be complex (simulation or forecasting) models.
SHAPING MY NEXT PIECE If there is something, related to O.R., that you would like me to consider for future columns in Impact then please get in touch. The goal is to share the discipline with users / potential users of O.R. by highlighting how it could support ‘business’ challenges they may be facing.
WANT TO LEARN MORE? The OR Society runs training courses on much of the above if you want to bolster your in-house team. We are an active community and there are various events running through the year that may be of interest.
Nicola Morrill is a Systems Thinking Consultant at Dstl, a certified coach and mentor and the current Diversity Champion of the OR Society. She writes in a private capacity – all views expressed are her own and all examples are available in the open domain. You can contact her on Nicola.Morrill@googlemail.com


