17 minute read
TACTICAL RECONSTRUCTION AND FAST O.R. AT THE MARITIME WARFARE CENTRE


STEPHANIE MONKS AND HAYLEY BIRD
THE MARITIME WARFARE CENTRE (MWC) is a unique military and scientific establishment that provides direct support to the front line. With a staff of around 100 service and civilian personnel, including representatives from the Defence Science and Technology Laboratory (Dstl), Ministry of Defence (MOD) and industry, there is a wide range of expertise to help solve problems and provide warfare advice wherever and whenever it is needed. The MWC Operational Analysis Team is responsible for supporting the delivery of tactical and operational advice by military staff to the front line of the Royal Navy.
WHAT IS TACTICAL RECONSTRUCTION? One of the team’s most important activities is tactical reconstruction. The tactical reconstruction method is a defined process which involves the detailed post event understanding and analysis of a range of data. It is used to
assess the performance or effectiveness of maritime units during an event, operation or exercise.
The team collate large quantities of quantitative and qualitative geospatial and signal data from maritime units, and re-create maps of actual activity which can be critically analysed to understand the situation and decisions made by key players; and identify areas of improvement for current and future Royal Navy tactics. WHY DO WE DO TACTICAL RECONSTRUCTION? We have identified three reasons for using tactical reconstruction. Firstly, the approach creates a basis for analysis of big data. Tactical Reconstruction is able to ‘make sense’ of large quantities of geospatial and signal data and display it in an easy to understand format that can be communicated to maritime units.
Secondly, it helps the MWC understand the performance and effectiveness of maritime units. The ‘quick-time’ nature of tactical reconstruction enables MWC to pass back invaluable performance assessments during training and exercise.
Thirdly, it supports the MWC in identifying improvements to Royal Navy tactics. Through reconstruction the MWC are able to provide quantitative analysis of tactics, techniques and procedures which can then be communicated to the frontline.
Captain Chris O’Flaherty, Captain of the Maritime Warfare Centre, observed that “Tactical Reconstruction and the ability to replay operational and training events is at the core of tactical development. My team’s ability to conduct such reconstruction rapidly and with considerable fidelity is a core element

ROYAL NAVY TYPE 23 FRIGATE HMS KENT, AT SPEED OFF THE SOUTH WEST COAST OF SCOTLAND DURING EXERCISE JOINT WARRIOR 19-1
in our delivery of battle-winning tactics.”
AN EXAMPLE OF ITS APPLICATION: EXERCISE JOINT WARRIOR 19-1 AND OPERATION PENSEIVE Exercise Joint Warrior is the largest military exercise in Europe, bringing together the Royal Navy, the Royal Air Force and the British Army, as well as forces from other nations. The exercise runs through a range of crisis and conflict scenarios that could be realistically encountered in operations, such as territory disputes, terrorist activity and piracy.
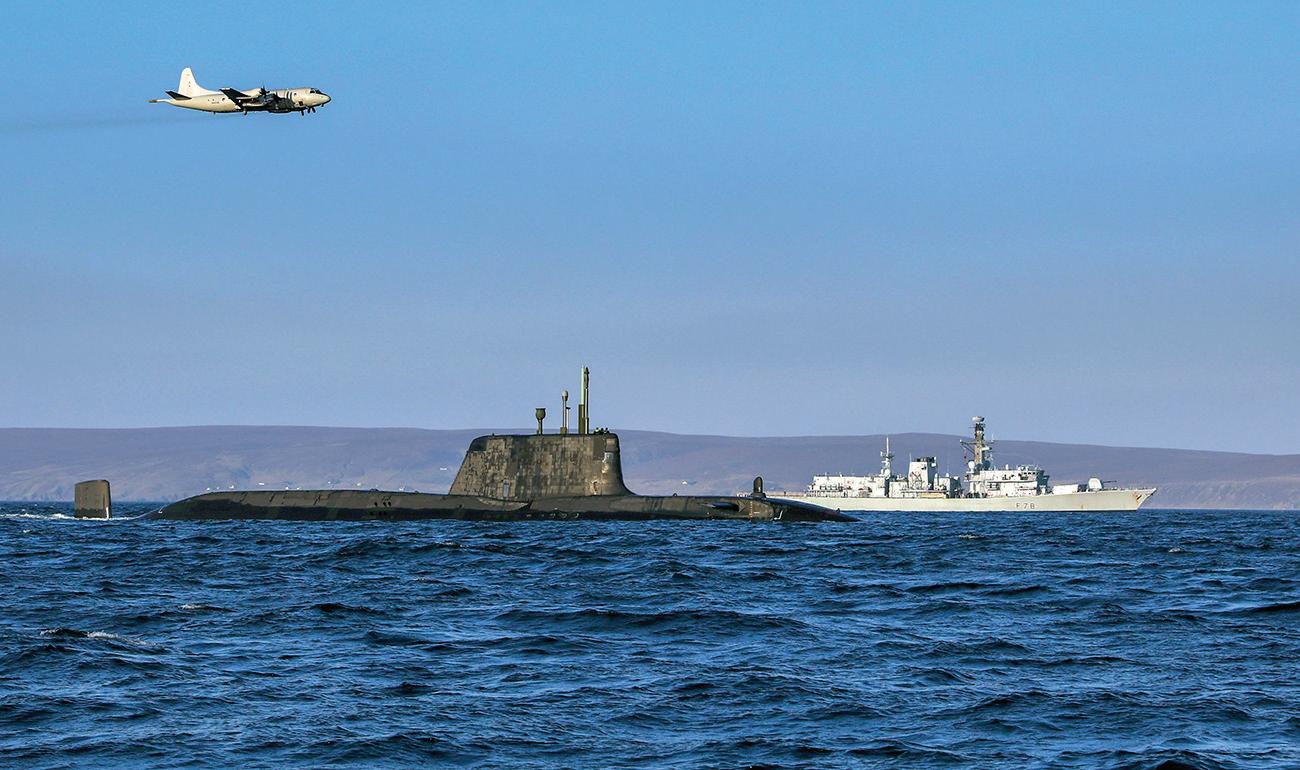
Exercise Joint Warrior 19-1 (JW19-1), which took place in April 2019 was an opportunity for MWC to develop and test operational analysis techniques used for supporting UK and NATO worldwide operations, exercises and trials. The opening image shows an Astute class nuclear submarine in company with the Type 23 frigate HMS Kent being over flown by a German navy P3 maritime patrol aircraft during JW19-1.
Operation PENSEIVE
The MWC analysis team conducted post-event analysis of Exercise JW 19-1, known internally as Operation PENSEIVE. The team used the opportunity to apply a number
of operational analysis techniques, including tactical reconstruction, for supporting exercises and operations around the world.
Aims and Objectives
MWC’s primary interest is the tactics employed by assets, for example, ships of the fleet, building up a long-term view and assessing, for instance, whether the correct tactics are employed and whether new tactics are required. The aims of the PENSEIVE Team were therefore: • To provide analysis and an account of success of Exercise Joint Warrior serials (a defined practice from a single domain or multi-threat domain with a clear start and end point) with regards to the Tactics and Procedures followed by the UK Royal Navy and
Royal Marines. • To enable the MWC assess its own capability to deliver rapid operational research support to operations, exercises and trials.
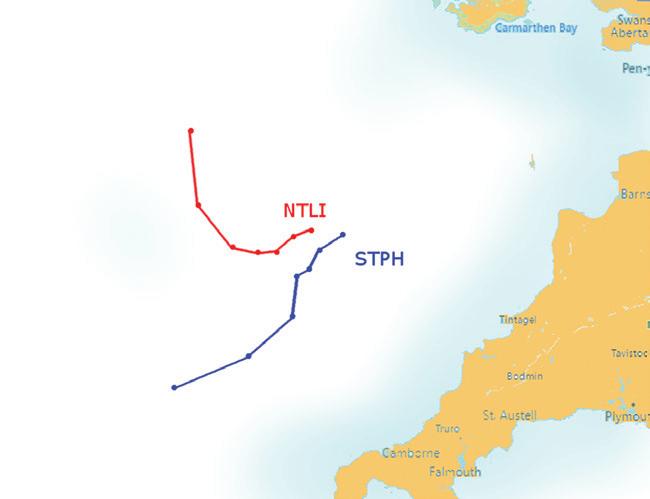
FIGURE 1 EXAMPLE OF TRACK RECONSTRUCTION TO SUPPORT OP PENSEIVE ANALYSIS AT MWC
What’s better:
Conducting Full Operational Research studies (detailed modelling and simulation) to determine why events happened and enhance the Royal Navy’s understanding? Or
Conducting Fast Operational Research which emphasises a question and targeted data collection for establishing what is happening now?
This is a debate over which the MWC analysis team agonise frequently. Of course, it would be ideal to complete a full modelling study, and delve into the data to fully understand the situation which would provide a rich base of evidence to the Navy. However, this takes time and there is often a requirement for an answer within hours, or a few days. Nevertheless, doing a fast analysis of a sample of the data available often raises more questions than it answers. There is therefore a trade-off between delivering high quality evidence based analysis, and providing an assessment within the time it is required for making a decision. During Operation PENSEIVE, the MWC analysis team completed track reconstruction (plotting geo-physical data obtained onto mapping software – see Figure 1) and Fast O.R. or, rather, Fast OA, as Operational Analysis is the terminology used in Defence to describe Operational Research. Table 1 highlights the features and benefits of a Fast OA approach when compared to full OA studies. When looking at the ‘Methodology’ and ‘Measure of Effectiveness’ comparators in particular, it is clear that in the fast-time turn around environment, fast-OA is the best method.
The Operation PENSEIVE Approach
The team completed Fast OA of selected serials each day during the two-week exercise within a four-hour period; delivering daily ground truth reconstructions of fast OA findings of selected serials to the Joint Exercise Planning Team and Captain MWC. The daily approach can be seen in the adjacent display.
The daily routine
9.00 – 10.00: Data sorting: 0 Quantitative (geospatial) 0 Qualitative textual (signals from ships) 0 Satellite imagery 10.00 -10.30: Reconstructed GPS tracking 10.30 – 12.00: Made assessment on success of serial 13.00: Brief to Captain MWC 14.00 – 17.00: Preparations for following day
Analytical Challenges
There are numerous challenges that the team face when doing Tactical Reconstruction and Fast OA during a major Navy Exercise:
Data: Either too much data, or a lack of data arriving into MWC. The team cannot predict in advance the amount of data we will receive. This can cause either gaps in the information, or an overwhelming amount of data to sort and analyse. Further, differing data formats can cause issues as we are relying on ships
OA APPROACH FAST OA
Very generalised description of the likely OA approach Hard OA; addressing a well-defined question feeding into a structured methodology and clear quantified result
Application
Scope Model validation, equipment performance, assessment or green paper development Specific question(s)
Methodology
Focus
Measure(s) of effectiveness
Data Collection
Preparations
Support
Scrutiny/Challenge
Report Timescale Contribution to broader understanding
Customers
Confidence in results Rigid and procedural
Describe what events happen Quantitative and/or binary pass/ fail outcomes that should be both measurable and achievable Tendency to rely on system recordings and discrete observations. Likely to concentrate on the system(s) identified in the data collection plan Trial instructions detailing the necessary activities Trial seariders* and additional data collection equipment Tendency to draw on stakeholder views. Caveated by ‘quick look’ label attached to the output Within three weeks Rare that understanding based on a series of analyses is conducted Technology development and equipment assessment Fair to Good FULL OA Combination of hard and soft OA techniques; also address problematic questions where a flexible methodology might lead to qualified results Green paper validation and developing concepts of operation/employment/use and operation orders Tendency to be broad Iterative process with room for curiosity driven digressions Identify why events happen
Qualitative third-person perspective built on first-person narratives and system data
Tendency to emphasise the operator narrative that describes motivations. Possible that complementary data from a wider number of systems is available Standing orders and books of reference detailing system recordings and text No seariders* or additional data collection equipment Peer review, and possible red teaming, explicitly included during staffing. More likely to be revisited at a later stage. In excess of three months An aspiration to develop understanding from a series of analyses exists
Tactical development and warfare assurance
Good to Very Good
TABLE 1 FEATURES OF FAST OA VS FULL OA
*A SEARIDER IS A MEMBER OF MOD CIVILIAN STAFF WHO IS ON BOARD A NAVY VESSEL FOR THE BENEFIT OF FAST-TIME ANALYTICAL OUTPUT.
companies completing forms in a robust manner. Time pressures: Completing Fast OA within 4hours to deliver useful insights to the Captain MWC is a challenge. Analysis Bias: Working within a fast-paced environment can mean that analysts begin to see false trends and unintentionally focus on data supporting a working hypothesis, instead of fully designing the analytical question at the start of the process.
However, a fantastic team working ethic; skilled, experienced analysts, with a structure to the analytical approach; and support from a forward team based at sea all make the Fast OA experience a rewarding and impactful one.
DATA SCIENCE AND ARTIFICIAL INTELLIGENCE
Learning lessons from the past
Where the team have completed Fast OA and reconstruction and received a larger amount of data to work with during previous Joint Warrior Exercises, it has been possible to begin to understand bottlenecks that form at data processing points.
FIGURE 2 REPRESENTATION OF THE DATA SORTING PROCESS IN SIMUL8 MODEL.
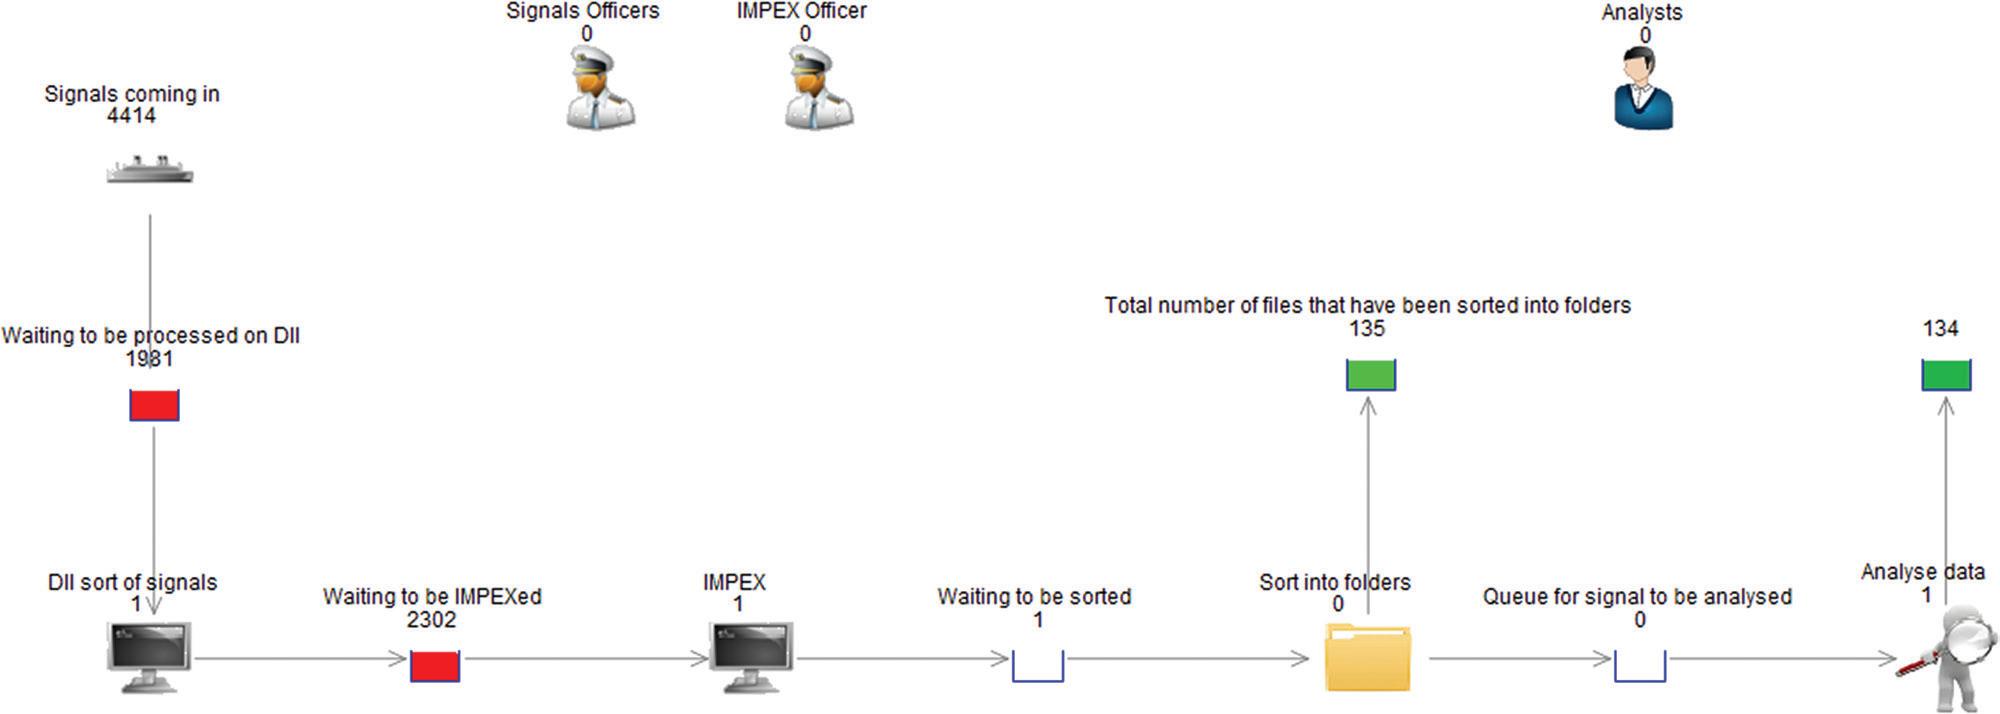
A larger Dstl team created a process view using Simul8 in order to review of the system itself. This enabled the analysis team to improve the data flow from ships to analysts. One improvement was the implementation of programmed scripts to automatically sort qualitative data into a more manageable format (see Figure 2).
Fast OA and reconstruction delivered a daily brief to the Joint Tactical Exercise Planning Staff in line with the dictated ‘battle rhythm’ of the command and control of the training exercise
IMPACT AND OUTCOMES Fast OA and reconstruction Delivered a daily brief to the
Joint Tactical Exercise Planning
Staff in line with the dictated
‘battle rhythm’ (schedule) of the command and control of the training exercise. Completed daily analysis of 4-6 of the previous day’s exercise activities alongside presenting a view of their success from a MWC perspective. This analysis was presented in a quad-slide format allowing for various vignettes (for example a narrative, overview and recommendations) to be presented alongside imagery in a concise brief. Identified areas for MWC Tactical development to take forward with regards to tactics, techniques and procedures that can be trialled and released to the frontline. Identified areas for analytical improvement such as data collection methods and process to getting data back to MWC, improvement in the
Artificial Intelligence for automating signal analysis and instigating debate around ‘Fast OA’ vs ‘OA Faster’.
Stephanie Monks is the Defence Capability Change Manager at the Met Office. She was the Defence Science and Technology Laboratory (DSTL) team leader of the staff working at the Maritime Warfare Centre.
Hayley Bird is a lead analyst for the newly established Tactical Reconstruction team based at the Maritime Warfare Centre. Whilst in its infancy, the team plans to expand on and develop the skills demonstrated during Operation PENSEIVE and provide the Navy with a comprehensive resource of track reconstruction and analysis of simulation, trials and exercises and real time events.
Content includes material subject to © Crown Copyright (2020), Dstl and MOD. This material is licensed under the terms of the Open Government Licence except where otherwise stated. To view this licence, visit http://www.nationalarchives.gov. uk/doc/open-government-licence/ version/3 or write to the Information Policy Team, The National Archives, Kew, London TW9 4DU, or email: psi@nationalarchives.gov.uk
OutbReak
Geoff Royston
You have almost certainly caught a virus sometime (hopefully not the latest coronavirus). Maybe your computer has had a viral infection too? And have you ever caught an idea?
My column in this issue of Impact focuses on things that can spread quickly and widely, as in a classical epidemic, and what analysis can tell us about such outbreaks. They are not confined to the spread of biological or computer pathogens, or of tangible things such as wildfires, but extend to a variety of other often non-material outbreaks – such as financial crises, adoption of innovations, and indeed, ideas. It has been prompted (of course) by the current global COVID-19 epidemic and draws upon the recently published ‘The Rules of Contagion’ by Adam Kucharski, a mathematical epidemiologist at the London School of Hygiene and Tropical Medicine.
MODELLING EPIDEMICS Current news coverage of COVID-19 must have ensured that most people are now all too aware of the characteristic growth curve of an epidemic; the accelerating rise to a peak in cases, and then a (often rather less rapid) fall as the number of cases declines.
Such curves are a portal into the realm of mathematical modelling of epidemics. Again, something that lately has been much publicised. As The Rules of Contagion describes, a seminal early use of mathematics in epidemiology was by the surgeon Ronald Ross (who in 1902 had won the Nobel Prize for his work on how mosquitoes transmit malaria). Ross was not only a medic but also a keen amateur mathematician and he put this to good use in his later work. His key analytical innovation, later developed by Anderson McKendrick and William Kermack, was to move beyond previous approaches to the mathematical analysis of epidemics, which were essentially no more than descriptive curve-fitting exercises, to an approach which ‘lifted the bonnet’ by considering the processes driving epidemics and then modelling these with corresponding equations. The huge advantage was that it was then possible to do ‘what if?’ tests with the resulting model, varying key process parameters, particularly those that might be controllable, e.g. the probability of transmission from an infected person, and see what effect this had.
Many people will now be familiar with the R value, the average number of new cases generated by transmission of an infectious agent from someone who is infected with it to someone who is not. Whenever R exceeds one, the number of cases will grow, and grow at an increasing rate – that acceleration is what characterises a classical epidemic. If R starts and stays below one however, the epidemic will fail to take off. When R has started above one and then falls below that, because of increasing immunity, or because it is driven down by control measures, the epidemic will begin to die out.
Kucharski notes that R can be broken down into key multiplicative components: duration of infectivity, opportunity for spreading by interactions between hosts, probability of an interaction leading to transmission, and proportion of a population who are susceptible – DOTS for short. (A nice example of the application of the Fermi approach that I discussed in Guesstimate That! Impact Spring 2016). Such decomposition of R into DOTS can help in considering what measures might reduce the magnitude of one or more of its components and thus assist in controlling an epidemic.
The Rules of Contagion provides a much fuller account of modelling infectious disease outbreaks, with some fascinating examples and coverage of other key aspects such as the important role that social and other networks play in associated phenomena such as localised hotspots and ‘superspreaders’ of disease. However, the book also shows how the concepts extend far beyond the biological sphere.
BEYOND BIOLOGY ‘Epidemics’ can occur with a large range of non-biological outbreaks – for instance the uptake of a technological innovation. That suggests a common underlying mechanism. The underlying fundamentals are simple enough; you need an agent (e.g. a virus, an idea) capable of occupying –
REPORTED DAILY CASES OF COVID-19 IN THE UK


SIMPLE CONTAGIOUS SPREAD: R = 2
‘infecting’ – a host (e.g. a body, a mind) that is susceptible to such ‘infection’ by that agent, and a way (e.g. coughing for a virus, texting for an idea) that copies of the agent can be transmitted from the host to multiple other hosts. Given those basic building blocks an accelerating outbreak amongst its potential hosts can occur for an agent – any agent.
So for example, the uptake of innovations such as the colour television or the videorecorder typically follows an epidemic-type growth and decline pattern. A new product emerges and some people (‘early adopters’) buy it, this is observed by (‘transmitted to’) others, who like (are ‘infected’ by) and act on the idea of owning it; their ownership is then observed and copied in turn by others. Uptake can be slow and linear or fast and non-linear (epidemic-like), depending on the values of the components of R (the DOTS), and will decline as the market saturates (fewer ‘susceptibles’). Such processes were described in the Diffusion of Innovations, a seminal 1960s book (now in its fifth edition!) by the sociologist Everett Rogers.
INFODEMICS Perhaps the most pervasive example of contagion in the non-biological domain is the spread of information, ideas and ‘memes’, ranging from the adoption of scientific theories to the ability of great tits to peck through milk bottle tops to get the cream. Information spread can happen very rapidly and widely, especially online. Often this can be helpful, but sometimes the spread of information or ideas is harmful, and unfortunately it is false information that tends to spread furthest and fastest. (Because, for example, misinformation is often newsworthy by being outrageous, or because people are receptive to it because it chimes with their other beliefs.)
The WHO have highlighted ‘infodemics’ as a major global health challenge. Kucharski discusses the problem of misinformation about health by considering the story of resistance to MMR vaccine, originating from a discredited paper by the (now struck-off) medic Andrew Wakefield, and spread by a vocal online anti-vaccination movement. About 95% of a population needs to be vaccinated to prevent outbreaks of measles. (This is another use of R; the proportion of a population that needs to be immune to stop an epidemic breaking out is, roughly, 1−1/R0 where R0 is the average number of new cases generated by an infected person at the start of an outbreak, when susceptibility is high. For measles R0 is very big – about 15, so 1−1/R0 is 93%). In places where anti-vaccination beliefs have spread and taken root, outbreaks of measles, with the associated fatalities, are now occurring. An ‘infodemic’ can feed an epidemic – and indeed vice versa, as has been happening with fears of COVID-19 providing fertile soil for the spread of all sorts of dangerous myths about prevention or treatment, potentially opening up a truly vicious circle of mutual reinforcement.
CONCLUSION The Rules of Contagion goes on to discuss a variety of other phenomena – such as computer malware, financial bubbles, social and anti-social behaviour, that can be contagious. In some of these cases – financial bubbles, for example – contagion is high and epidemics are observed (R over 1) in others, shootings and suicides for example, there is evidence of contagion but, fortunately, there are generally only a few knock-on events (R below 1).
The similarities between the dynamics of the spread of infectious disease and the dynamics of non-biological contagions are not only interesting, but have also been useful in devising possible measures, targeting one or more of the DOTS factors identified for the former, to influence the latter. For example, Kucharski points out that the adoption of measures analogous to public health interventions has proved quite promising as a way to reduce gun and knife crime, and that dissemination of fake news that often follows disasters can be successfully overtaken by quickly responding with corrective tweets. A deeper understanding of The Rules of Contagion should be of wide benefit.
Dr Geoff Royston is a former president of the OR Society and a former chair of the UK Government Operational Research Service. He was head of strategic analysis and operational research in the Department of Health for England, where for almost two decades he was the professional lead for a large group of health analysts.
© Profile Books


