35 minute read
SCIENCE TOOLKIT


How do scientists test claims?
CHAPTER
What if? Staples What you need: Ten sheets of A4 paper, a stapler with staples What to do: 1 Fold an A4 sheet of paper in two. 2 Staple the two halves of paper together with the stapler. 3 Add another sheet of paper to the folded paper so that there are now three sheets over the top of each other. 4 Staple all the sheets together with the stapler. 5 Repeat steps 3 and 4 until the stapler is unable to penetrate all the sheets of paper effectively. SCIENCE TOOLKIT 1Scientists can test manufacturers’ claims1.1 Scientists present their data accurately1.4 Scientists must be aware of experimental errors1.2 1.3 Scientists prepare Safety Data Sheets Science as a human endeavour: Scientists investigate consumer products 1.5 DRAFT ONLY - NOT FOR SALE
What if?
» What if another stapler was used? » What if another brand of staples was used? » What if different paper was used?
1.1 Scientists can test manufacturers’ claims
In this • The scientific method involves forming a hypothesis, planning an experiment that topic, you controls the variables, gathering data, analysing results, drawing a conclusion and will learn communicating the results.
that:
• Consumer science is a branch of science that involves applying the scientific method to the claims made by manufacturers.
No matter what you buy – toilet paper, a smartphone or a bottle of water – you are being a consumer. As a consumer you make choices and you expect certain things from the products you buy.
Consumer science case study
In 2004, two New Zealand science students,
Jenny Suo and Anna Devathasan, exposed a startling fact about the fruit juice drink
Ribena while conducting research for their school’s science fair. Jenny and Anna decided to compare the vitamin C content of different fruit juice drinks to see if the manufacturer’s claims on the labels were correct. The label on Ribena, which contains blackcurrant juice, implied that it had a much higher vitamin C content than the other fruit juice drinks they tested. It said: ‘The blackcurrants in Ribena contain four times the vitamin C of oranges’.
The students therefore predicted that Ribena would have four times the vitamin C content of orange fruit juice drinks. Jenny and Anna then analysed the vitamin C content of Ribena and several other fruit juice drinks, using the scientific method. They ensured that their tests were fair and objective. The only difference between the drinks during their tests was the brands. Jenny and Anna did three trials to ensure the accuracy of their results. After each trial, they re-examined their data. The students were surprised to find that the vitamin C content of Ribena was far lower than most other brands. But because they had followed the scientific method, they were confident that their results were reliable. For this reason, they contacted the manufacturer about

the misleading labelling and advertising. When no response was received, they brought their case to a national consumer affairs program. After their case was broadcast, and after further testing of Ribena, the New Zealand Commerce Commission brought 15 charges against the manufacturer under the Fair Trading Act 1986 (NZ). The scientific method at work Jenny and Anna were sure of their results because they followed the scientific method. Hypothesis The scientific method involves developing a plan to test a hypothesis that can come from a ‘what if’ question. For Jenny and Anna, this question was: ‘What if the vitamin C content of Ribena was compared with other fruit juice drinks?’ This then became a prediction using the words ‘if’ and ‘then’: ‘If the vitamin C content of Ribena is compared with other fruit juice drinks, then Ribena will have more vitamin C per millilitre.’ A hypothesis should also include the idea or theory on which the prediction is based. This is done through the use of ‘because’: ‘If the vitamin C content of Ribena is compared with other fruit juice drinks, then Ribena will have more vitamin C per millilitre Figure 1 Ribena was found to contain less vitamin C than its competition, despite the manufacturer’s claims. DRAFT ONLY - NOT FOR SALE because blackcurrants have a greater vitamin C content than other fruits.’ A hypothesis should be based on some underlying suspicion, prediction or idea that Figure 2 Anna is based on previous observations. It must Devathasan and be very specific (operational) so that it can Jenny Suo be tested.
Variables
A hypothesis should be tested in an objective way. For example, for a fair comparison of the fruit juice drinks, Jenny and Anna needed to design an experiment that identified all the variables that would be operating. The variables in an experiment are the factors that will affect the results in some way. These could include the volume of the fruit juice drinks tested, the age and temperature of the fruit juice drinks, and the quality of the chemicals used in the testing.
To test the hypothesis, all the variables should be controlled except for the one being tested. This is known as the independent variable and in Jenny and Anna’s case it was the brand of the fruit juice drink being tested. The variable being measured at the end of the experiment is the dependent variable, such as the amount of vitamin C in a fruit juice drink. Method In this section, a scientist describes the materials and equipment they used, including the concentrations and brands they tested. Diagrams are also useful to illustrate the steps taken. Remember to label all equipment in the diagram and to give the diagram a title.
The number of times you repeat an entire experiment is referred to as repetition. The more times an experiment is repeated and the results are averaged, the more likely it is that the results are reliable.
The sample size refers to the number of subjects being tested or used in the experiment. The greater the sample size, the more reliable the results will be and the stronger the evidence available to support the conclusion. Results The observations you make, or the data you collect, during your experiment are written down as the results. All observations should be what you actually see and not what you expect to see. Data can be organised into a table format and a graph to make it easier to understand. Discussion Once all the results have been gathered, they need to be analysed for any patterns that show if the independent variable and the dependent variable changed in a similar way. If they did, this means the results are correlated. Conclusion A conclusion answers the initial question asked about the experiment. It provides evidence that supports or refutes the hypothesis. Any further investigations that may need to be done are outlined in this section.
variable something that can affect the outcome or results of an experiment independent variable a variable (factor) that is changed in an experiment dependent variable a variable in an experiment that may change as a result of changes to the independent variable sample size the number of subjects being tested or used in an experiment correlated when results in an experiment show that independent and dependent variables are related Remember and understand 1 Define the term ‘hypothesis’. 2 Explain why an experiment should have a clear and detailed method. 3 Describe how a hypothesis that is shown to be wrong can still be useful. Justify your answer (by providing an example that matches your description). Apply and analyse 4 Consider the following statement:
‘If participants in Group A use Brand A toothpaste for six weeks, then they will have whiter teeth than participants in Group B, who used Brand B toothpaste for six weeks.’ a Identify what is missing from this statement to make it a hypothesis. b Identify the independent and dependent variables being tested. c Identify one controlled variable in the experiment. Explain why it is important for this variable to be controlled.
Evaluate and create 5 Evaluate the claim that ‘an increased sample size makes an experiment more reliable’. Justify your answer by: • defining the terms ‘sample size’ and ‘reliable’ • explaining the effect of increasing the sample size in an experiment • deciding whether increasing the sample size makes an experiment more reliable. 6 Often scientists have to present their findings to the public in order to get action taken. Sometimes this is difficult, so they need to be sure that their findings are reliable. Explain how the scientific method ensures 1.1 Check your learning DRAFT ONLY - NOT FOR SALE that the findings are reliable (by describing all the steps in the scientific method and identifying which steps improve the reliability of the results).
1.2
Scientists must be aware of experimental errors
In this
topic, you • In scientific investigations, measurements can only show that a hypothesis is will learn correct if the measurements are accurate. that: • To achieve maximum accuracy, the measurement must be taken carefully, using the most suitable measuring device. • Each scientific device must have a scale appropriate to the accuracy that you require. Choosing the right device Choosing the right instrument is the first step in making sure the measurements are close to the accuracy expected true value (accurate). For example, how carefully, correctly if you needed to accurately measure the volume and consistently data of a liquid, then you would use a burette or a has been measured or measuring cylinder, but not a beaker. A burette processed; in science, how close a measured value is to has a more accurate scale than a measuring the true value cylinder. Both are carefully checked during reading error an error that occurs when the manufacturing process; however, a burette has smaller units that can be controlled by the markings on a scale are not scientist. A beaker often has no scale. read correctly
Errors and accuracy Choosing the right instrument is only part of a scientist’s job. It is very important to take care with your measurements. The most common errors in measurement are reading errors, parallax errors and zero errors. A reading error can result when guesswork is involved when taking a reading. For example, when a reading lies between the divisions on a scale, a guess of the actual reading can result in a reading error (Figure 2). 1 2 DRAFT ONLY - NOT FOR SALE
Figure 1 A burette is a laboratory instrument used to accurately measure the volumes of liquids. Figure 2 Guessing the reading between units of measurement (for example, between 1.5 and 2) can produce a reading error.
A parallax error occurs when the eye is not directly opposite the scale when the reading is being taken. You can avoid parallax errors by making sure that your eye is in the correct position when taking the reading. For zero error example, when reading the level of a liquid in an error that occurs when a measuring cylinder, place the cylinder on the an instrument has not been bench and line up your eye with the bottom of adjusted to zero before the the meniscus (Figure 3). measurement is taken
A zero error happens when an instrument has not been correctly adjusted to zero or the reading has not taken into account the weight of the empty container. For example, scales must be set to zero correctly before making a weight measurement of substances.
To check the accuracy of scales, scientists use a special mass that is known to be exact. When this is placed on the scale, the weight shown by the scale is compared to the known true mass. If they are the same, then the scale is accurate.
parallax error an error, or inaccurate reading, that occurs as a result of reading a scale from an angle Meniscus
Eye level Figure 3 To avoid parallax error, make sure your eye is correctly lined up with the bottom of the meniscus. Mathematical accuracy When conducting a scientific investigation, mathematical accuracy is very important. To avoid errors, not only must your equipment be appropriate and precise, but your calculations must also be correct. When taking a reading, you should quote the maximum allowed number of significant figures (the number of digits). This can represent the accuracy of a measurement or reading.
When recording results, it is important to know the number of significant figures the instrument allows. When adding or subtracting numbers, the final answer will be based on the least number of decimal places. When multiplying or dividing numbers, the final answer can only be quoted correct to the number of significant figures in the least accurate result. For example, if one measuring device measures 10.22 (four significant figures and two decimal places) and a second device measures 20.345 (five significant figures and three decimal places), averaging these results means adding the values. This means the final answer should only have two figures after the decimal point. This might require a rounding off procedure. Worked example 1.2 (on page 6) shows how to calculate significant figures.
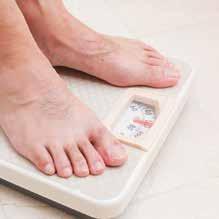
significant figures the number of digits that contribute to the overall value of a number Figure 4 Scales must be zeroed correctly before using them. rounding off reducing the number of significant figures by increasing or decreasing to the nearest significant figure; for example, 7.6 cm is rounded up to 8 cm, 7.2 cm is rounded down to 7 cm DRAFT ONLY - NOT FOR SALE
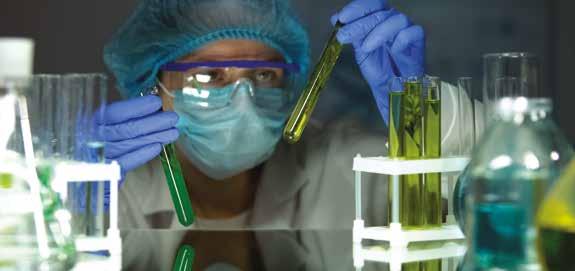
Figure 5 The meniscus is the curved surface of a liquid, as you can see in these test tubes.

Worked example 1.2: Significant figures
A student used two sets of scales to measure 0.44 g of sand and 0.696 g of water. Calculate the final mass when the sand was mixed with the water. Give your answer to an appropriate number of significant figures. Solution Add the mass of the sand and water together. 0.44 + 0.696g = 1.136g
As one number has only two decimal places, the final answer must have two decimal places. The number (1.136) is closer to 1.14 than to 1.13, so 1.14 is more accurate.
Final mass of sand and water = 1.14 g SI system an international system of measurement based on the metric system, with units such as kilogram, metre, kilometre derived units units of measurement that are calculated using a combination of SI (international system) base units, e.g. cm3 for volume (base unit is cm), m2 for area (base unit is m)
Table 1 SI units Physical quantity SI unit Abbreviation or symbol
Length metre
Volume litre L
Mass kilogram kg
Time second s
Thermodynamic temperature kelvin K
Amount of substance mole mol
Electric current ampere A
Measurements and units Scientists measure fundamental quantities, Although the SI unit for mass is the such as mass, time and length, in a standard kilogram, this is not always the most suitable unit that has been agreed upon by scientists unit to use. Some objects are too heavy or around the world. The international system too light for this to be the most convenient of units, known as the SI system of units, is unit. The measurement would have too based on the metric system. Table 1 shows many zeros in it. For example, a mass of some SI units. Other measurements, such as 0.00000000743kg or 850000000kg is volume, are calculated from those basic units very inconvenient to write. Scientists and and are called derived units. mathematicians choose a unit that requires as few zeros as possible. They use a system of prefixes before the basic measurement unit, shown in Table 2.
Figure 6 Mixing sand and water m DRAFT ONLY - NOT FOR SALE Figure 7 Scales are used to measure quantities of materials used in experiments.
Table 2 Standard prefixes and meanings
Prefix Symbol Value Meaning peta P 1015 One quadrillion (one thousand million million) tera T
1012 One trillion
Remember and understand 1 Identify three kinds of errors that can occur during an experiment. 2 Describe how these errors can be reduced to improve accuracy. 3 Explain why scientists often repeat experiments and then take an average of the results. 4 Identify the symbol for: a millionths of a gram b billions of litres c thousandths of an ampere d thousands of metres.
Apply and analyse 5 Identify the number of significant figures in each of the following measurements. a 45.22 mL b 9.0 s c 8000 L d 3.005 m 6 A student took the following measurements during an experiment: 5.6 volts, 2.97 amperes, 3000 seconds. If these three numbers were used in a calculation, identify how many significant figures should be stated in the final answer. Justify your answer (by explaining how you made your decision). 1.2 Check your learning giga G 109 One billion mega 106 One million kilo k 103 One thousand centi c 10-2 One-hundredth milli m 10-3 One-thousandth micro µ 10-6 One-millionth nano n 10-9 One-billionth pico p 10-12 One-millionth of one million M Notice that when the number is larger than the basic measurement, the symbol for the prefix is a capital letter. When it is only a fraction of the basic measurement, the symbol for the prefix is a small letter (i.e. lower case). For example, a megalitre, which is a million litres, is written as ML, while a millilitre, which is one-thousandth of a litre, is written as mL. ‘Kilo’ is an exception to this general rule. A kilogram is 1000 grams and its symbol is kg. Figure 8 These dumb-bells weigh 3 kg each. DRAFT ONLY - NOT FOR SALE
1.3
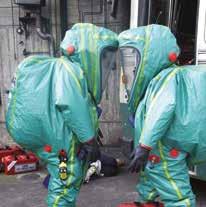
Scientists prepare Safety Data Sheets • A Safety Data Sheet (SDS) contains information about a chemical, such as its various names, the dangers involved in its use and the precautions that should be taken when handling the chemical. • SDSs should be prepared for all the reactants used and the products produced during science experiments. In this topic, you will learn that: Anticipate, recognise and eliminate Scientists work with many hazardous materials when completing experiments. As a result, they need to be aware of anything that might affect their health or safety in the laboratory. The laboratory is a safe place, provided hazards are: > anticipated > recognised > eliminated or controlled. A Safety Data Sheet (SDS) provides scientists and emergency personnel with information on how to use a particular substance. An SDS also helps scientists understand more about how the chemical should be used during the experiment. SAFETY DATA SHEET Sodium Chloride: Hazardous chemical MSDS name: Sodium Chloride Synonyms: Common salt; Halite; Rock salt; Saline; Salt; Sea salt; Table salt. Company identi cation: Chemical company Eye and skin: May cause eye irritation. Ingestion: Ingestion of large amounts may cause gastrointestinal irritation. Ingestion of large amounts may cause nausea and vomiting, rigidity or convulsions. Inhalation: May cause respiratory tract irritation. Handling: Use with adequate ventilation. Minimise dust generation and accumulation. Avoid contact with eyes, skin, and clothing. Keep container tightly closed. Store in a cool, dry, well-ventilated area away from incompatible substances. Store protected from moisture. Engineering controls: Good general ventilation should be used. Personal protective equipment Eyes: Wear safety glasses with side shields. Skin: Wear appropriate gloves to prevent skin exposure. Clothing: Wear appropriate protective clothing to minimise contact with skin. Eyes: Flush eyes with plenty of water for at least 15 minutes, occasionally lifting the upper and lower eyelids. Get medical aid. Skin: Flush skin with plenty of soap and water for at least 15 minutes while removing contaminated clothing and shoes. Get medical aid if irritation develops or persists. Wash clothing before reuse. Ingestion: If victim is conscious and alert, give 2-4 cupsful water. Get medical aid. Wash mouth out with water. Inhalation: Remove from exposure to fresh air immediately. If breathing is dif cult, give oxygen. Get medical aid if cough or other symptoms appear. Physical state: Solid Appearance: Colourless or white Section 1 - Chemical Product and Company Identification Section 2 - Hazards Identification Section 3 - Handling and Storage Section 4 - Exposure Controls, Personal Protection Section 5 - First Aid Measures Section 6 - Physical and Chemical Properties Odour: Odourless Boiling point: 1413 deg C Freezing/melting point: 801 deg C Solubility: Soluble Speci c gravity/density: 2.165 Molecular formula: NaCl Molecular weight: 58 Section 7 - Accidental Release Measures Spills/leaks: Vacuum or sweep up material and place into a suitable disposal container. Clean up spills immediately, observing precautions in the Protective Equipment section. Avoid generating dusty conditions. Provide ventilation. Section 8 - Fire Fighting Measures General information: Water runoff can cause environmental damage. Collect water used to ght re. Wear appropriate protective clothing to prevent contact DRAFT ONLY - NOT FOR SALE with skin and eyes. Wear a self-contained breathing apparatus (SCBA) to prevent contact with thermal decomposition products. Substance is noncombustible.
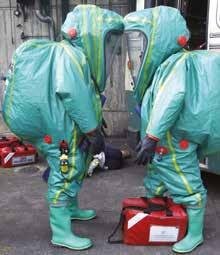
Figure 1 Example of an SDS from a manufacturer or certified provider
Figure 2 Emergency workers in sealed positivepressure protective suits communicating with each other
Safety Data Sheets
• What to do in the case of a spill (in the
laboratory or the environment)
The information on a Safety Data Sheet This includes first aid measures, any includes the following: antidotes, symptoms that might result > The various names of the chemical from exposure and if personal protective
This includes its chemical name and its equipment (PPE) is recommended for first common generic name, its concentration aiders. Advice may be needed on how to and structure. For example, DL-threo-2- cover drains to prevent the chemical making (methylamino)-1-phenylpropan-1-ol is also its way into ground water. called pseudoephedrine. • Fire-fighting measures > The contact details of the manufacturer Some chemicals produce toxic fumes or are > The hazard level of the chemical highly flammable. Other chemicals become
All chemicals should contain labels relating more dangerous if they are exposed to water. to their particular dangers. This may Firefighters may need special equipment. include their flammability, corrosive ability, • How to dispose of the chemical safely toxicity and ability to cause long-term This section should include what disposal damage, such as cancers. The risks can be containers should be used, the effects of shown using descriptions or the symbols sewage disposal and the special precautions shown in Figure 4. that may be needed to ensure the safety of > Usage instructions and restrictions individuals and the environment.
Some chemicals may form a dust that can • How to transport the chemical explode. For example, workers in flour mills Information should include any special need to be especially aware of flour dust. precautions for transporting this chemical.
This section provides information about This may include the Hazchem code (the how to safely handle and store the substance code provided by the government for each to minimise the risks. class of chemical). • Protective measures • An Australian telephone number of the
The SDS should contain information on the Office of Chemical Safety eye and face protection needed, the type of • The date the SDS was last reviewed gloves or skin protection required and the possible need for masks. • The physical and chemical properties
of the substance
Everyone in a laboratory should be able to easily identify the chemical. The SDS should include the colour, smell, pH, flammability, solubility, melting and boiling points of the chemical.
Remember and understand 1 Identify the meaning of the term ‘SDS’. 2 Explain why it is important to prepare an SDS before starting an experiment. 3 Explain why it is important to have all the different names of the chemical on the SDS.
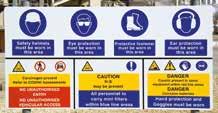
4 Describe the types of personal 1.3 Check your learning Figure 3 The hazards identified in the SDSs are displayed by many industries, including the mining industry. DRAFT ONLY - NOT FOR SALE protective equipment (PPE) you have in your laboratory. 5 Identify the phone number of the Office of Chemical Safety in Victoria. Figure 4 Pictograms such as these are often seen on the labels of chemicals, to communicate specific hazards.
1.4
Scientists present their data accurately • Outliers are values that are very different from the main group of data. • Outliers can affect the mean (average) of the overall results. • The median (middle number of data when placed in increasing order) and the mode (most common result) are less affected by outliers. • Positive correlation of data does not mean one event caused another event. In this topic, you will learn that: All seedlings except seedling 5 grew between 3.5 and 4.3 cm. The average (or mean) growth of the seedlings (including seedling 5) was 3.4 cm, as shown in Worked example 1.4. This average is well below the growth of any of the seedlings other than seedling 5. This shows how one outlier can cause a distorted result for seedling growth. If the average is determined without using the height of seedling 5, the average becomes 3.9 cm. This is a closer representation of the actual growth. However, is it fair to discard any results that we don’t like? An outlier is only excluded if an explanation is given as to how the results have been modified and the reason for doing so. For example, the discussion might include the statement that ‘Seedling 5 was excluded from the analysis because a fungal infection affected its growth.’ Outliers Occasionally the data that scientists collect contains a value that is far away from the main group of data. These values are called outliers and may be due to inaccurate measurements or experimental errors. For example, an outlier may occur when measuring the height of seedlings after 3 weeks of growth (see Table 1). Table 1 Seedling growth Seedling number Height (cm) 1 3.6 2 4.0 3 4.1 4 4.0 5 0.1 6 3.5 7 4.3 outlier a data value that is outside the normal range of all the other results Worked example 1.4: Calculating the mean Determine the average (mean) of the seedling heights shown in Table 1. Solution DRAFT ONLY - NOT FOR SALE As the seedling heights had two significant figures and one decimal place, the final answer must have one decimal place. The average seedling height is 3.4 cm (3.371 is closer to 3.4 than to 3.3).
Figure 1 How should you calculate the average growth of seedlings?
Median
positive correlation. If one value increases as the other decreases, then it has a negative correlation. The median is the middle value of the data This can be shown on a graph (Figure 3). after all the numbers have been placed in Correlation shows that there is a increasing order. For the previous data, this relationship between the two variables; it does means: not necessarily mean that one variable causes 0.1, 3.5, 3.6, 4.0, 4.0, 4.1, 4.3 the other to change. For example, there is a ↑ positive correlation between the number of ice Median creams sold and the number of shark attacks in
The median amount the seedlings grew was Australia. This does not mean that selling ice 4.0 cm. If the outlier is removed, the median creams causes shark attacks. Instead, there is growth is still 4.0 cm. So the median value of another causative factor: hot weather. the data is not affected as much by outliers as the mean/average is. Number of ice creams sold and number of shark attacks from November to January Mode 18 The mode is the most common number in the set of data. In our set of data, the number 4.0 occurs twice (seedlings 2 and 4). This means the mode, or most common 12 14 16 Ice creams soldShark attacks amount the seedlings grew, was 4.0 cm. If the 10 outlier was removed, the mode of the seedling 8 growth would still be 4.0 cm. An outlier does not affect the mode value. 4 Correlation of data 2 When two sets of data are strongly linked (as one November December Januarychanges, the other changes by a similar amount), the data has a strong correlation. When both Figure 2 There is a positive correlation between values increase at the same rate, it is called a the number of ice creams sold and the number of shark attacks. Figure 3 Correlation of data
Perfect positive correlation Low positive correlation Low negative correlation High positive correlation High negative correlation No correlation Perfect negative correlation Remember and understand 1 Explain why it is best to present your data in table form. 2 Define the term ‘outlier’. Describe when an outlier should be included in the results. 3 Define the following terms. a mean b median c mode Apply and analyse 4 Draw an appropriate graph for the data in Table 2. a Describe any correlation between the daily 1.4 Check your learning Table 2 Ice cream sales vs daily temperature Temperature (°C) Sales ($) 14.2 215 16.4 325 11.9 185 15.2 332 18.5 406 22.1 522 19.4 412 6 DRAFT ONLY - NOT FOR SALE temperature and ice cream sales. 25.1 614 b Explain the effect the daily temperature has on the 23.4 544 number of ice creams sold that day. 18.1 421 c Explain what you would expect to happen to 22.6 445 ice cream sales if the daily temperature increased 17.2 408 to 40°C.
//SCIENCE AS A HUMAN ENDEAVOUR//
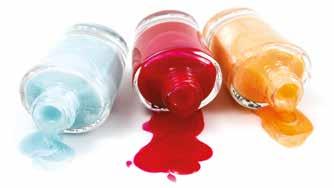
Working in groups of two or three, design an experiment to investigate an everyday consumer product. Your aim is to practise using the scientific method. You will need to ensure that you follow the scientific method. Use the 'Develop your abilities' questions on the next page to design an experiment that investigates consumer products. Scientists investigate consumer products1.5 Figure 2 More consumer products to investigate: bottled water and bubblegumFigure 1 Investigating a consumer product: nail polish DRAFT ONLY - NOT FOR SALE
1.5 Develop your abilities
Investigating a product
Choose a consumer product to investigate and discuss what you already know about the product. Identify any claims or slogans that may be tested. Then design a reproducible experiment to investigate these claims or slogans, following the scientific method.
You will need to research the product thoroughly. This may mean visiting a supermarket and comparing the prices and packaging of different brands, as well as searching the internet, journals, books and encyclopedias to identify the science behind your product. Ideas Here are some ideas for your investigation. > Do all brands of bubblegum make the same-sized bubble? > Do all washing detergents produce the same amount of bubbles and clean the same number of dishes? > How permanent are permanent markers? What solvents (for example, water, alcohol, vinegar, detergent solution) will remove the ink? Do different brands or types of markers produce the same result? > Do consumers prefer bleached white paper products or unbleached paper products? Why? > Is laundry detergent as effective if you use less than the recommended amount? What if you use more than the recommended amount? > Is bottled water purer than tap water? How does distilled water compare with drinking water? > How does the pH of juice change with time? How does temperature affect the rate of this chemical change? > Do all hairsprays hold equally well? And equally long?
Does the type of hair affect the results? > Do all nail polishes dry at the same rate? > Do some lipsticks stay on longer? > How absorbent are nappies? > Do all batteries have the same battery life? > How long can the life of cut flowers be prolonged? Evaluate As a class, discuss each experiment design by answering the following questions. > Will the experiment produce data that answers the question?
> Is the method repeatable? (Will the same process produce the same results if it is repeated?) > Could someone else reproduce the experiment? (Are there any steps that require more scientific information to be supplied?) > Have all the safety considerations been taken into account? > What changes could be made to improve the design? Planning for errors Before you carry out your consumer science investigation, you will need to think about reducing errors and improving accuracy. > What variables will you need to control, to ensure a fair test? > How will you make sure your data is accurate and free of errors? > What type of equipment will you be using? Is this the most appropriate equipment? > How will you reduce parallax, reading and zero errors in your data measurements? > What other factors could introduce errors into your investigation? How will you minimise these? Presenting your results Once you have completed your consumer science investigation, you will need to analyse your data appropriately. > Are there any outliers? Can you explain these? > What methods of data presentation will you use and why? > What method will you use to describe your results: mean, median or mode? > Are there any correlations between the sets of data in your results? Do they imply causation? You will also need to complete a presentation about your investigation. This could be done as a webpage, a slide presentation, an advertisement, a video, or an article for Choice magazine, comparing your findings with the manufacturers’ claims. Present your findings to the class. DRAFT ONLY - NOT FOR SALE
Multiple choice questions
1 Identify the most appropriate definition of ‘independent variable’.
A the variable that is measured
B the variable that is controlled
C the variable that is deliberately changed by the scientist
D the variable that is measured at the end of the experiment 2 Identify which of the following statements is correct.
A Correlation means causation.
B Data is described in the method section of a scientific report.
C Data is analysed in the results section of a scientific report.
D A Safety Data Sheet should include the PPE to be used for a chemical. 3 Identify the graph that indicates no correlation between the variables. Short answer questions Remember and understand 4 Identify the main steps used when conducting an experimental investigation by the scientific method. 5 Define the term ‘variable’. 6 Identify why consumer scientists are interested in what can be observed and tested, rather than in the slogans and claims of manufacturers. 7 Describe how scientists find out about the safety risks involved in an experiment they are planning. 8 Suppose you are conducting a fair experiment in which you have identified six variables. Explain how you can be sure of the effect of one particular variable. 9 Explain why beakers are not used to measure volumes.
10 Compare (the similarities and differences between) zero error and parallax error, by describing each type of error. 11 Define the term ‘SI unit’. 12 Identify the SI unit for the following: a time b mass c length. 13 Identify the meaning of the following prefixes for a quantity: a mega b micro c kilo. 14 Explain why scientists have developed an internationally agreed system of units. Apply and analyse 15 A consumer scientist wanted to test the effect of a lotion for treating acne. They first tested the lotion on a group of 20 teenagers, all aged 15, but then they decided to conduct more tests. So they then tested 100 teenagers, all aged 15. a Identify whether this is an example of experimental repetition or increasing the sample size. b Identify which result (using 20 teenagers or 120 teenagers) is likely to lead to the most reliable conclusion. Justify your answer (by comparing the reliability of the test with 20 teenagers to that of 120 teenagers and deciding which is more reliable). 16 A scientist was commissioned by a jeans manufacturer to test various denims. The manufacturer wanted a more durable fabric than the one they were currently using. Describe how the scientist might test a fabric for durability in a fair and objective way. Explain why this is important. A B DC DRAFT ONLY - NOT FOR SALE
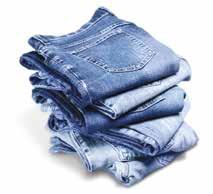
Figure 1 How might a scientist test the durability of different denims?
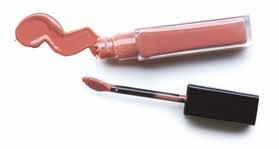
17 Identify the number of significant figures in each of the following measurements: a 65.301 g b 0.006 420 kg c 40 L. 18 Calculate the mean, median and mode of the following set of data: 15, 13, 18, 16, 14, 17, 12, 14, 19 19 A lipstick manufacturer claims that their brand of highgloss lipstick will stay on for at least 6 hours, even during eating and drinking. Design an experiment based on the scientific method to test this claim. First state your hypothesis, and then identify the variables you will be considering. Describe the measurements you will take and how you will ensure that they are accurate. 20 For the experiment you designed in question 19, describe the results you would expect to obtain if your stated hypothesis was correct. Evaluate 21 For the experiment you designed in question 19, evaluate the accuracy of the results that you may measure and suggest what further investigation you could undertake to improve the reliability of your conclusions. 22 For the experiment you designed in question 19, assuming you found that the manufacturer’s claim was correct, create a scientifically accurate slogan or advertisement for the lipstick based on your findings. Social and ethical thinking 23 Two phrases commonly used in advertising are ‘Scientists have proved …’ and ‘Recommended by scientists’. These are often accompanied by pictures of named scientists who are paid to appear in the advertisement. Discuss the ethical implications of using these phrases or pictures of scientists, by completing the following:
» Bottled water
Many people in Australia spend a lot of money on bottled drinking water. Are they doing this because of the way the water is marketed, or are there scientifically supported health benefits in drinking bottled water rather than tap water? Is tap water unsafe to drink? Have there been any cases where water bottlers have been fraudulent in their claims about the water they are selling? Investigate this issue. Find out what dentists and medical experts say about bottled water. Describe the scientific tests that are performed to check that the claims are correct and that the results that have been obtained are valid. After researching and comparing a range of evidence, evaluate whether we should drink bottled water in Australia or use tap water. Describe any limitations of your conclusions (e.g. does it depend on where you live?).
Figure 3 Why do people drink bottled water?
Figure 2 What results would be expected for the hypothesis from question 19?
a Describe why the company may choose to use the phrases or a picture of a scientist. b Describe how a person viewing the advertisement might be affected by the use of the phrases or pictures. c Describe how a person would be affected if the phrases/pictures were not used. d Evaluate whether using the phrases/pictures disadvantages the person viewing the advertisement. e Decide whether the phrases/pictures of scientists should be allowed in advertising. Critical and creative thinking 24 One source of information for consumers is Choice magazine. The magazine reports the results of testing a variety of brands of consumer products. a If a consumer scientist was reading a report on the safety of children’s pyjamas, describe the evidence they might look for to see if the report was fair and objective. b If the scientist concludes that the report is reliable, describe how the public might be convinced to read such reports before purchasing children’s pyjamas. Research 25 Choose one of the following topics for a research project. Some questions have been included to help you begin your research. Present your findings in a format of your choosing. DRAFT ONLY - NOT FOR SALE
» Mobile phone safety
Reflect
The table below outlines a list of things you should be able to do by the end of Chapter 1 ‘Science toolkit’. Once you’ve completed this chapter, use the table to reflect on your ability to complete each task. I can do this. I cannot do this yet.
Explain the differences between variables, independent variable and dependent variable in terms of what is controlled, changed or measured.
Relate reliability of results to sample size and repetition of the test.
Write a scientific report with all relevant sections. Go back to Topic 1.1 ʻScientists can test manufacturers’ claimsʼ Page 2
Define reading error, parallax error, zero error, significant figures, rounding off, SI system and derived units.
Explain the importance of minimising experimental error. Go back to Topic 1.2 ʻScientists must be aware of experimental errorsʼ Page 4
Describe the purpose of Safety Data Sheets and provide examples of some of the types of information included on them. Go back to Topic 1.3 ʻScientists prepare Safety Data Sheets’ Page 8
Describe the differences between positive and negative correlation, and high, low and no correlation.
Explain how to deal with outliers in data.
Calculate the mean and mode of data. Go back to Topic 1.4 ʻScientists present their data accurately’ Page 10
Describe the factors involved in designing a valid experiment and explain how to increase the reliability of results.
Provide examples of common errors that should be minimised or avoided.
Present data in an appropriate manner. » Artificial colourings and flavourings
Research is continuing into the safety of mobile phones, in foods although most people in the Western world have one Some people claim that certain artificial colourings Go back to Topic 1.5 ʻScience as a human endeavour: Scientists investigate consumer products’ Page 12 and flavourings in foods can cause problems, such as hyperactivity in children. Use the internet and other resources to investigate this issue. Define the term ‘opposing evidence’. Identify whether the warnings are based on anecdotal evidence or scientific evidence. Discuss whether anecdotal evidence can be of value to scientists. Figure 4 Are artificial colourings and flavourings in foods bad for us? or use one. You are an advisor to the Minister of Communications and Technology. Produce a report, of at least 10 points, detailing any research that has taken place into mobile phone safety. Make sure you include the outcomes or conclusions reached in these studies. DRAFT ONLY - NOT FOR SALE
Check your Student obook pro for these digital resources and more: Check your Teacher obook pro for these digital resources and more:
Compete in teams to test your knowledge. Chapter quiz Test your understanding of this chapter with one of three chapter quizzes. Launch a quiz for your students on key concepts in this chapter.


