6 minute read
Glossary

Robyn Granger and Graciela Gil-Romera
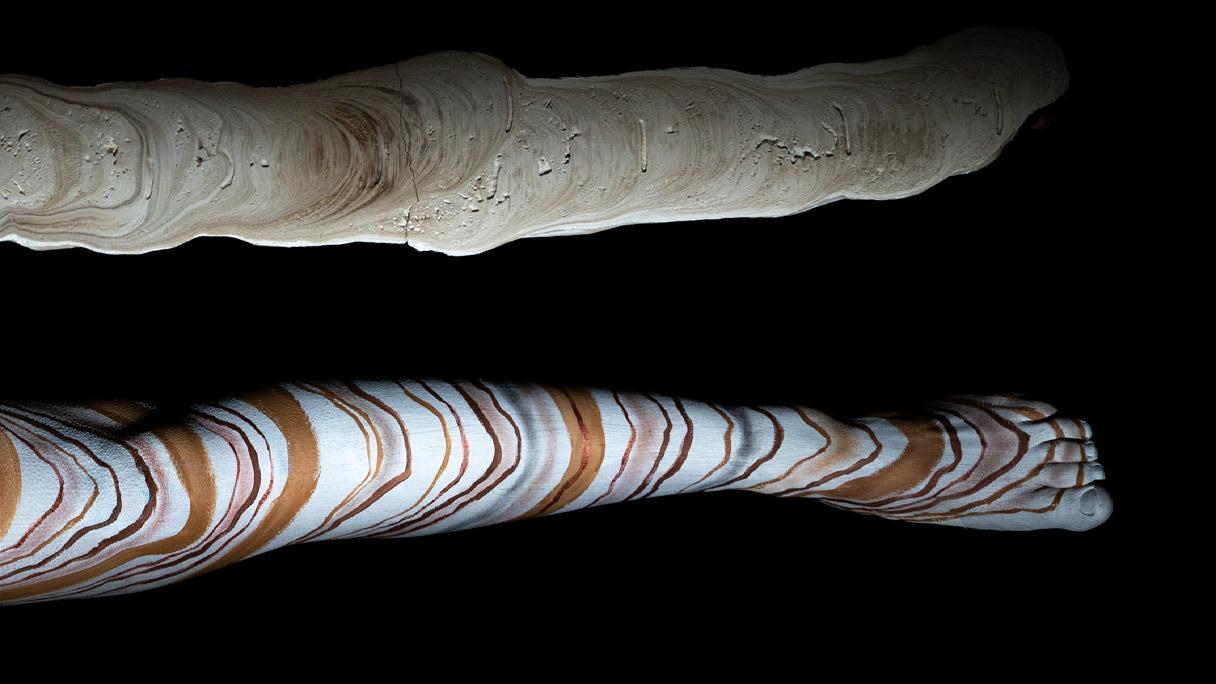
Sediment cores
Advertisement
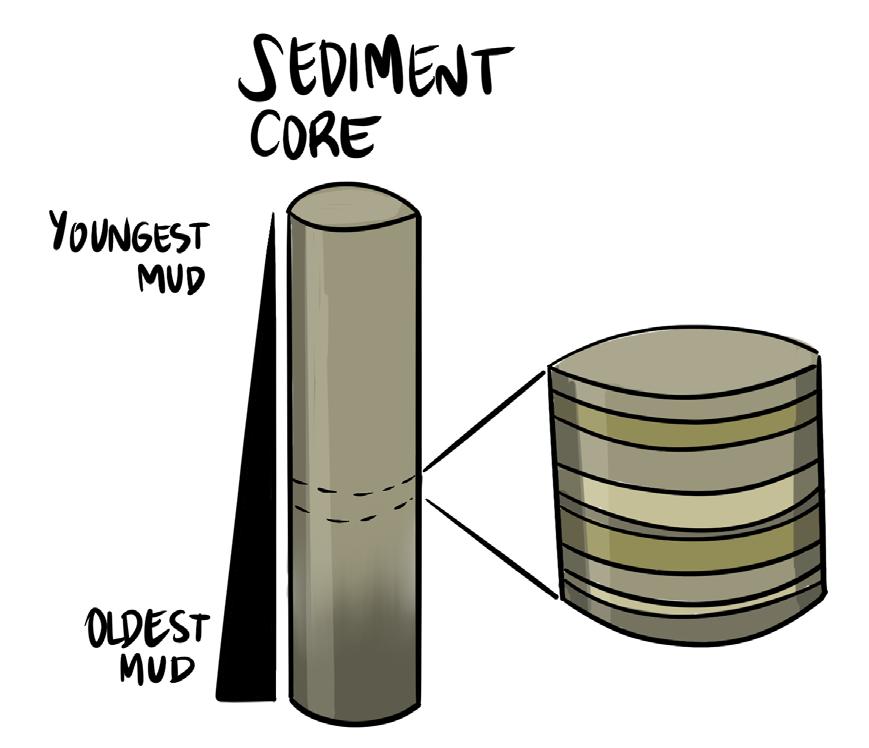
Reconstructing the past using the archives of the Earth is like reading books from our planet's libraries. There are many different types of natural archives that act as libraries: ice, lakes, oceans, stalagmites from caves, tree rings, fossilized dunes, or dried lakes (you have seen some of these already in this issue!). Researchers need to check out one of those books to read about the Earth's past. One example of an Earth archive is sediment cores – long cylinders of mud recovered from an ocean or lake floor. In these cores, the deeper you go, the older the sediment.
Chronology and age models
Scientists working with archives of the past need to be sure about when particular events or changes actually happened, i.e. they need to place these along a timeline. This timeline is called a chronology or an age model. Determining the date (usually the year, but nothing as precise as day and month – sometimes we can only figure out how many centuries or millennia ago!) at which something happened in the past can be done using different methods, depending on the type of archive we need to date.
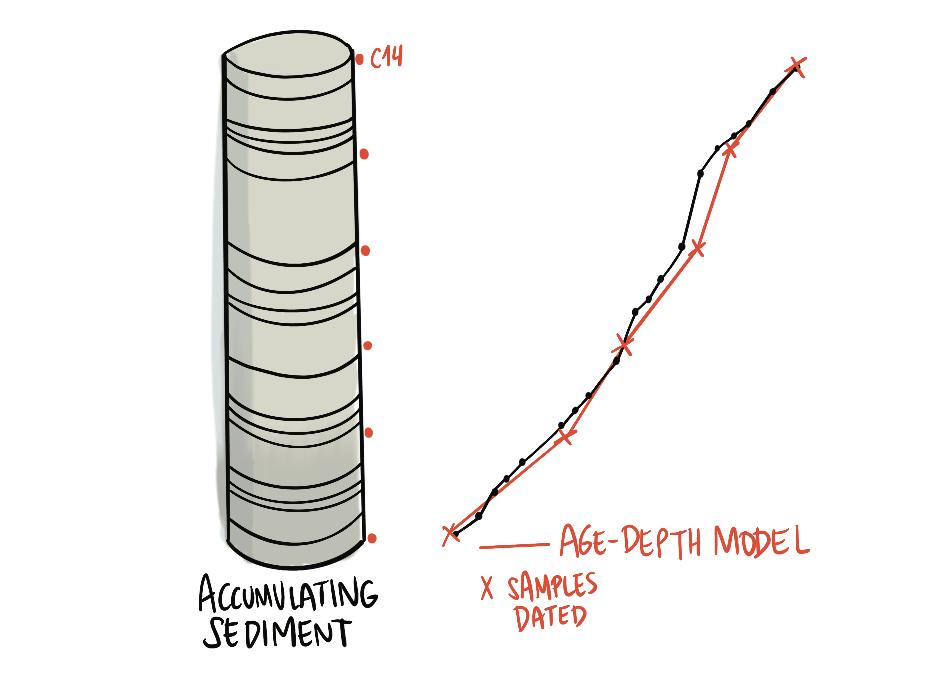
Dating techniques can offer a quantitative value: for example, we may find that something happened 25,000 years ago. However, dates can also be interpreted relative to other events. If we find fossils from organisms that we know lived within a particular time period (for instance, trilobites lived between 520 and 250 million years ago), this gives us a clue that the sediment in which they were found, and anything else that sediment might contain, is about that old too. One common dating method which provides trusted quantitative values is radiometric techniques. These compare the abundance of a naturally occurring radioactive isotope with the abundance of its disintegration products, which form at a known constant rate of decay. A well-known example of this is radiocarbon dating, a technique that measures the decay of 14C atoms. Reconstructing the timeline of events usually requires more than one date. Take for instance the cores that are shown in "Lake mud detectives" on page 36. If we want to understand how fast diatoms changed over time, we need to determine several dates within a single sediment core. Dating every centimeter of the whole core is costly and difficult, so, quite often, researchers have to build a model to interpret the sections of the core that are not dated. This model, as with any other we have in science, has some degree of uncertainty. Keep reading for more about models and confidence.
Models
In paleoclimate climate research, scientists use the term model to refer to a simple, small-scale representation of the Earth and its climate. These models are based on mathematical equations that describe our planet's physical, chemical, and biological laws. The equations are solved (approximately) by powerful computers, and unknown variables in the equations are assigned values based on modern observed data. "Can we tell how climate will change in the future?" on page 6 of this issue provides a good example of how models work.
Because interactions between the atmosphere, oceans, land, and cryosphere (all of the ice found on the Earth) in models mimic real-world processes, they can be used to predict how average climate or ecological conditions may change in the near future. These predictions are sometimes also called "projections". In addition, scientists can set different conditions in their model (more CO2 in the atmosphere, for example) to test hypotheses, explore different scenarios, and experiment freely without real-life consequences. Although large-scale climate modeling can involve large amounts of data, a model doesn't have to be complicated!
Climate projection
A climate projection is what might happen in the future and how we might get there. Projections use the results generated by models to best reflect the most likely outcome of a situation; for instance a prediction about sea level 100 years in the future based on rising temperatures and melting of ice sheets on Antarctica.
The red line tells you how scientists build models; the black line shows how fast the sediment really accumulated. For an animation of this, check out Maarten Blaauw's website: chrono.qub.ac.uk/ blaauw/wiggles/agemodel.html
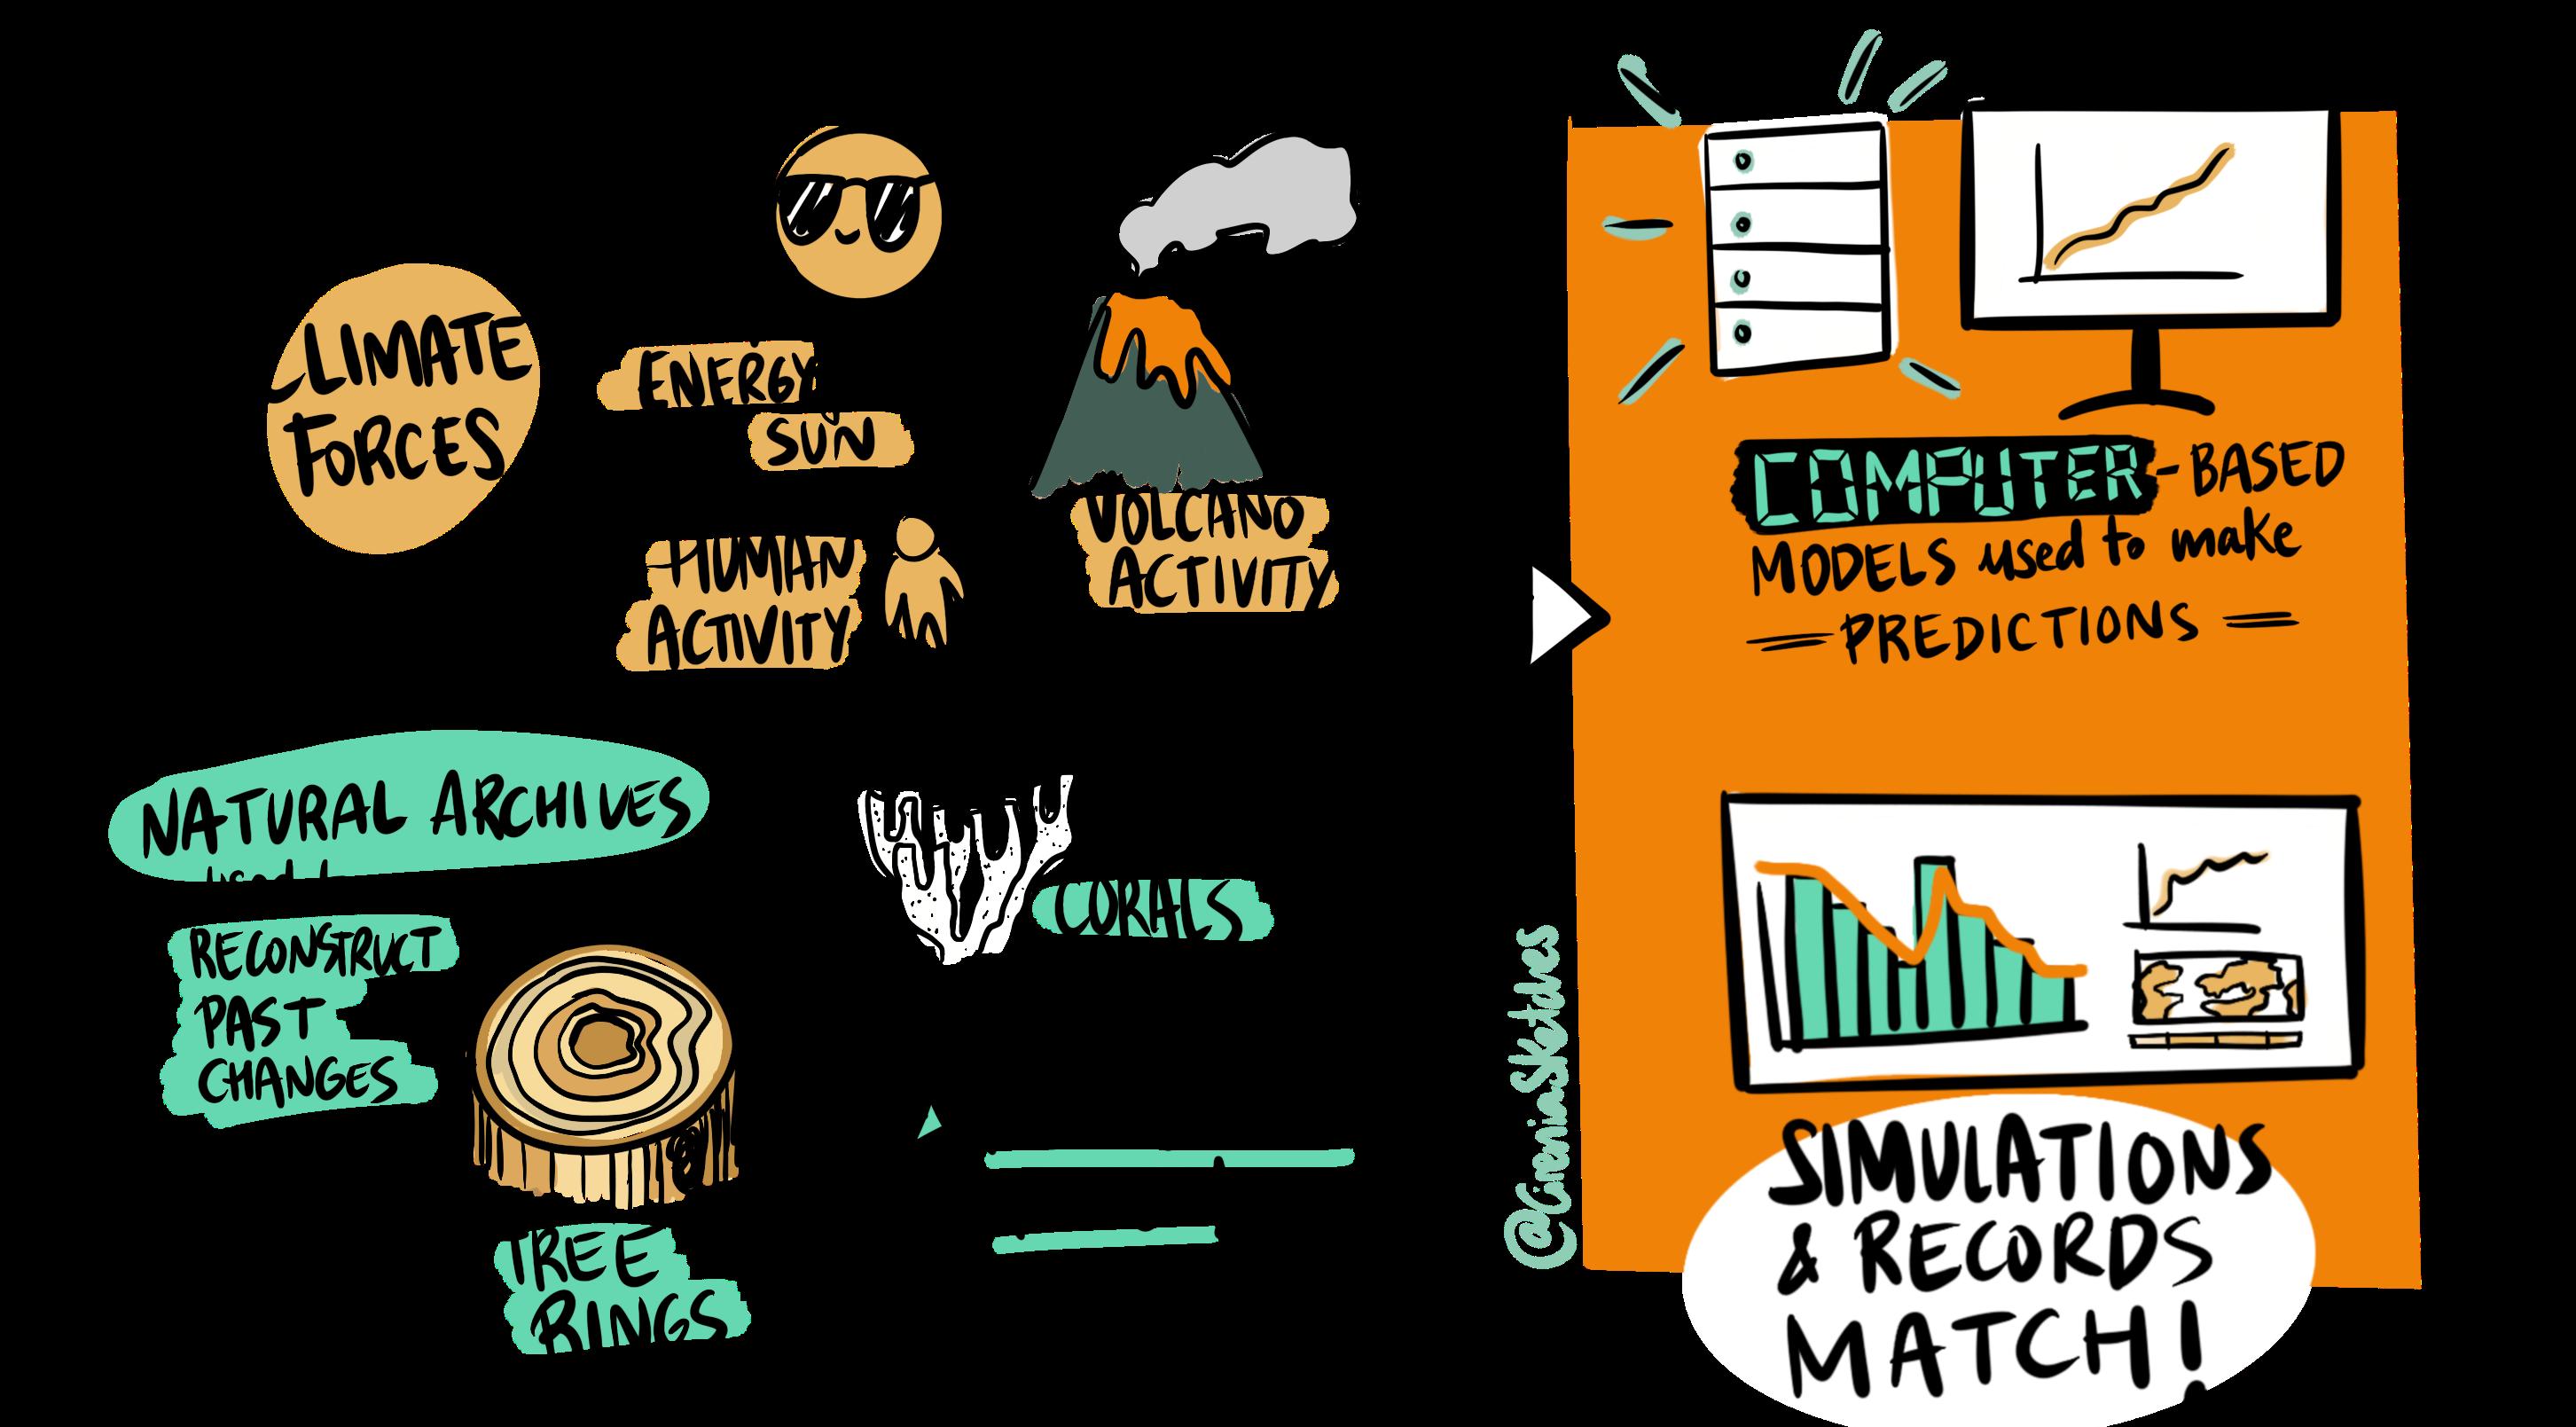
A key element of projections is determining what the climate was like in the past, using the same model data that determines the future. In this way, we can get an idea of the limits of climatic change even during times when the climate was extremely different from today, and to check the similarity of the projection to actual observed data. If your projection for the past looks nothing like the observations from the present or past, then it's unlikely that you will have a lot of faith in your future projection!
Ongoing observational measurements are also a crucial element of developing more accurate future projections, as these can be compared to previously projected scenarios, improving new projections and the models that inform them.
Uncertainty
Uncertainty refers to the level of confidence we have in any given result, based on the type, quality, amount, and consistency of the data. A low degree of uncertainty will produce a result with a high confidence level. It's similar to how confident you feel when you've aced an exam. There's no question (uncertainty) about it – you rocked it! Scientists try to increase confidence in their data by reducing uncertainty as much as possible, narrowing down the wide range of possible outcomes. One way to achieve this is to increase the amount of data points in a study, as a larger sample size will provide a more robust average and/or a higher resolution. Other ways include focusing on a smaller area or shorter time frame, or by using several independent methods to research the same question.
Uncertainty can be referred to quantitatively (e.g. standard deviation) or stated in words. The International Panel for Climate Change (IPCC) uses qualitative language based on quantitative probability estimates when discussing confidence in their climate projections:
"Virtually certain" = 99-100% probability "Likely" = 66-100% probability "About as likely as not" = 33-66% probability "Unlikely" = 0-33% probability There is almost always a degree of uncertainty associated with scientific results, indicating a range of possible values. This does not mean the results of a study are wrong – instead, uncertainty is simply a way to quantify how much confidence we should place in our measurements. Any resulting decisions can be made taking the appropriate level of confidence into account. One example of this is how the IPCC takes into account several potential scenarios with different levels of uncertainty, when making decisions on how best to reduce atmospheric CO2 emissions.
An often quoted saying by statistician George Box was that "all models are approximations. Essentially, all models are wrong, but some are useful." In summary, all data possess uncertainty, but can still provide useful information.
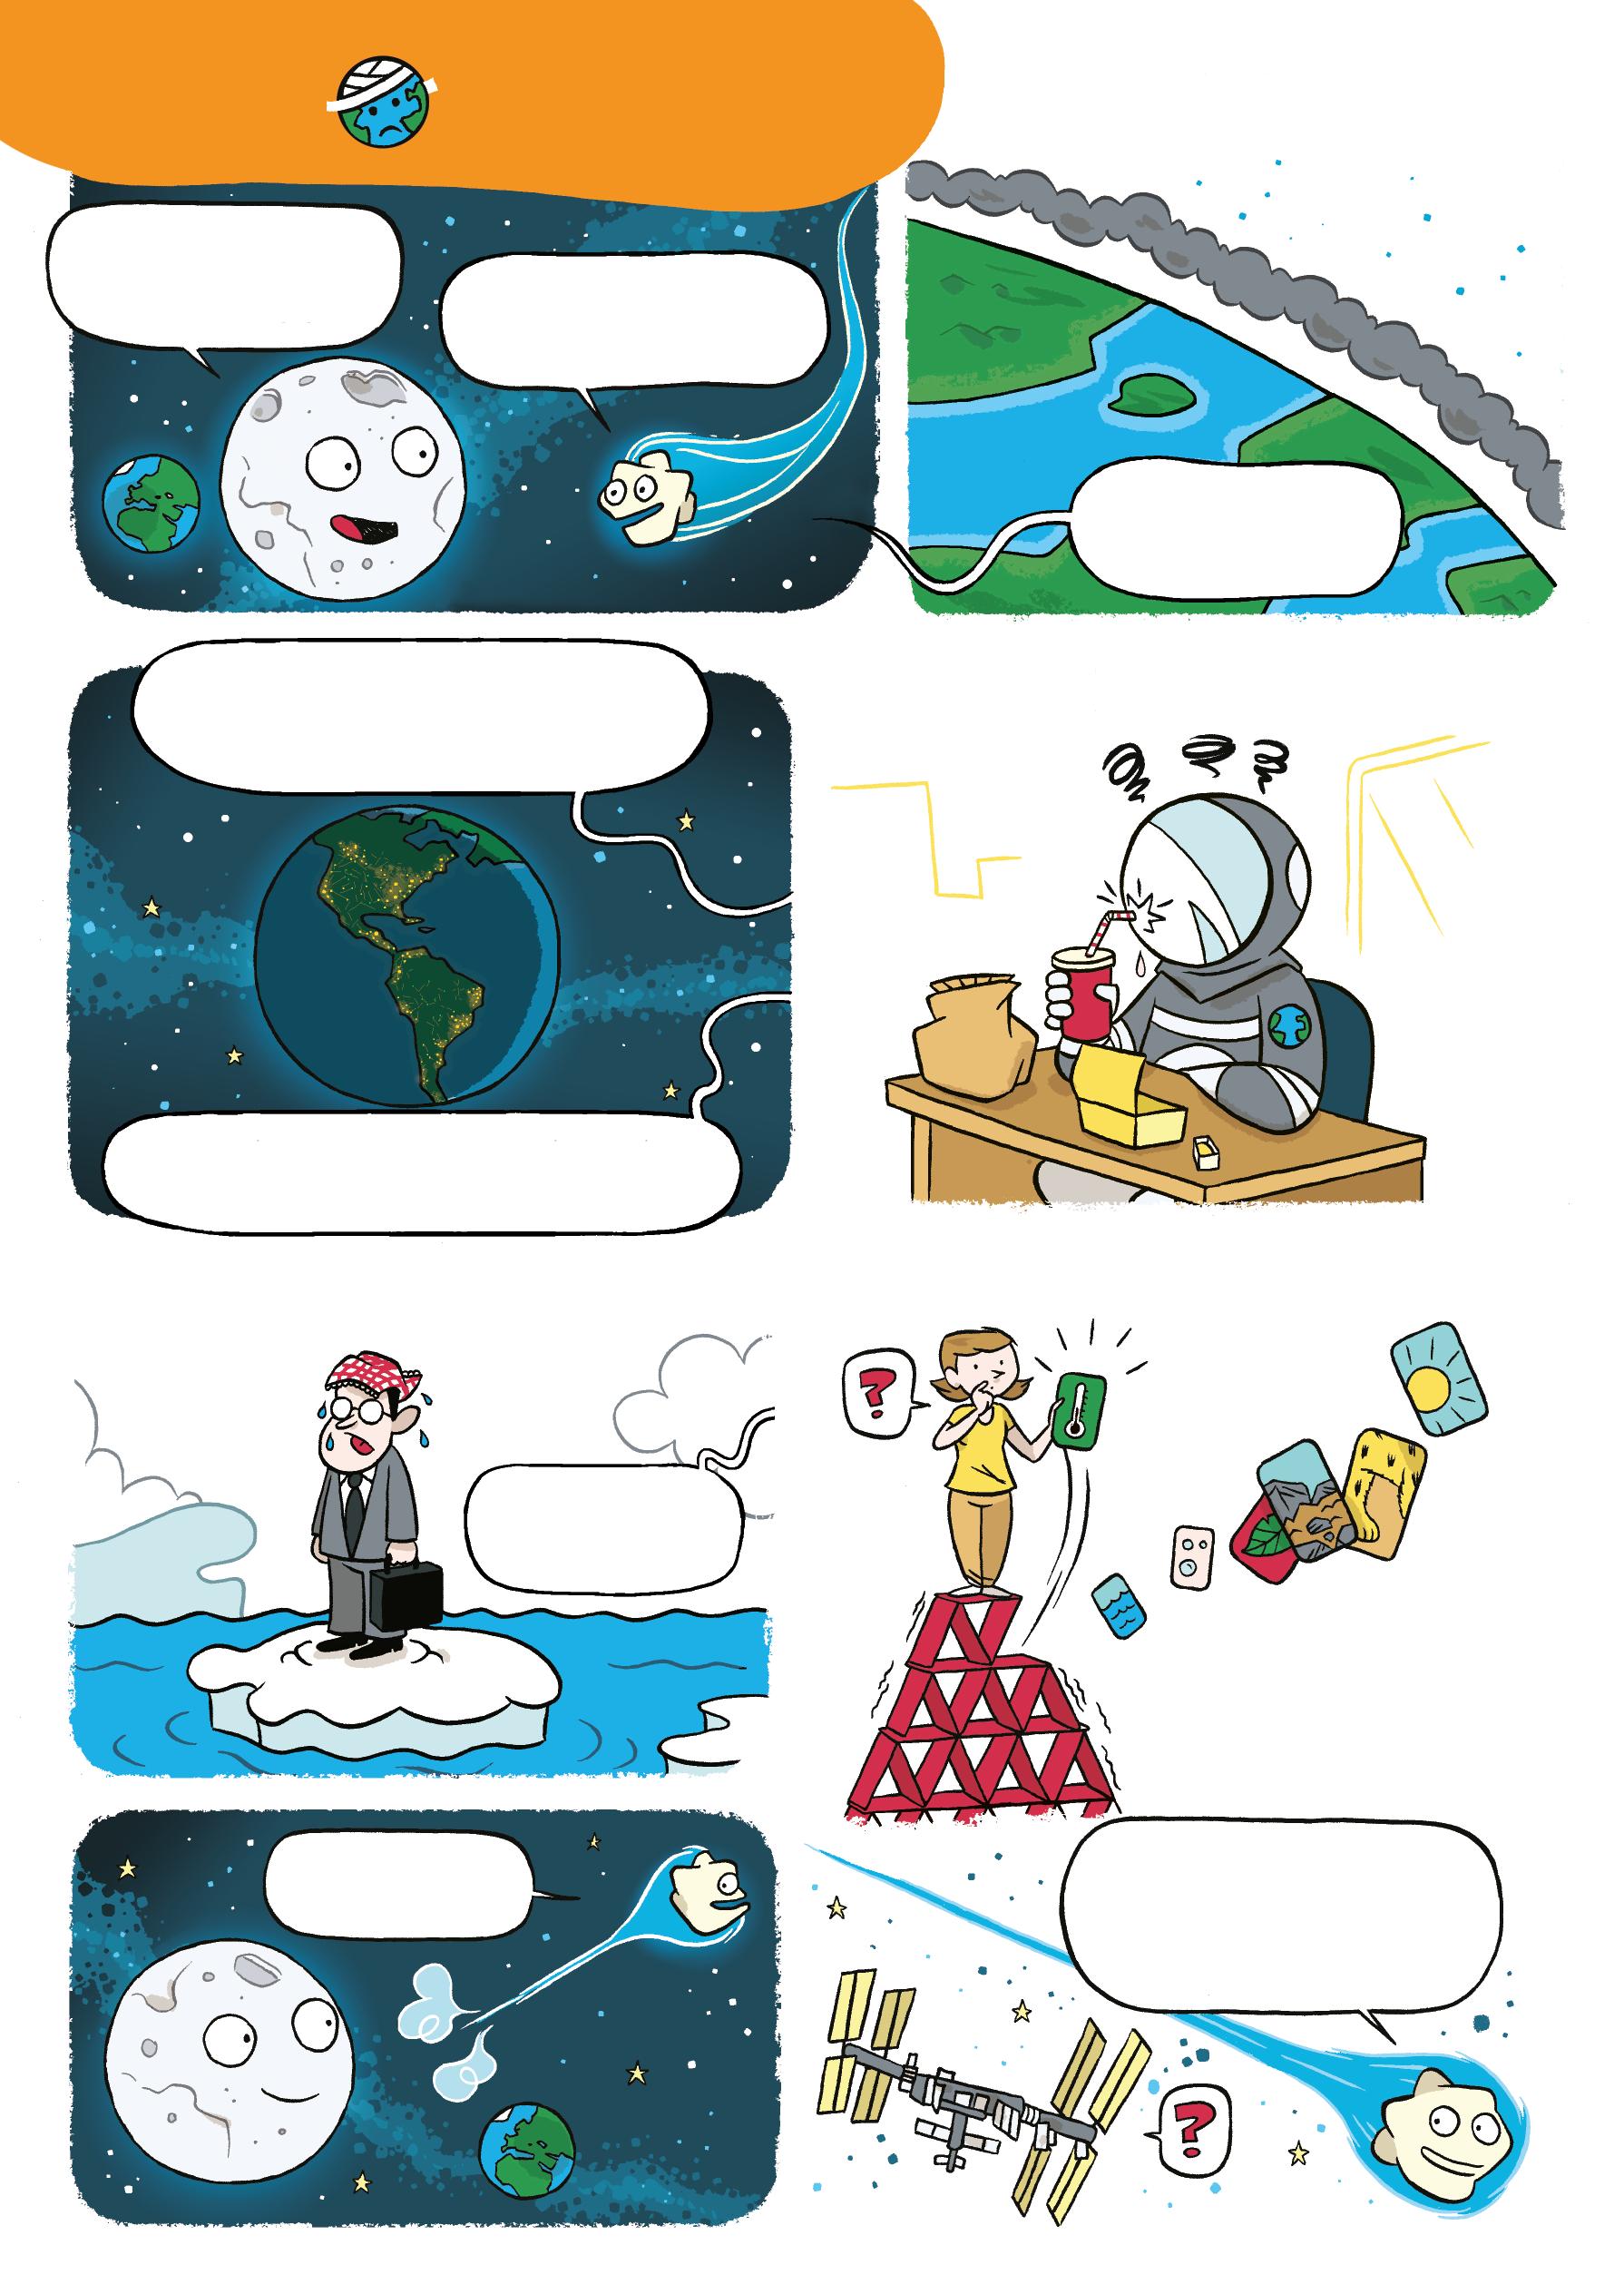
You see that your friend has a sandwich, a cookie, and an apple in her lunchbox. You casually wonder which she will eat first, but take a guess that she will go for the sandwich. But after several days of studying her eating habits, you observe that she usually eats the apple first, and your predictions begin to favor the apple. Then, after several weeks, you notice that she tends to eat her apple first on Mondays, Wednesdays, and Fridays, but her sandwich first on Tuesdays and Thursdays. The more days you watch, the easier it becomes to predict which she will reach for first. This is how uncertainty works! You can become more confident in your predictions once you have more data, but you can never be completely certain that your guess will be correct.