Situation of the Tourism Sector
Year ending 2023

INDEX Page THE TOURISM SECTOR: A BRIEF VIEW 3 General summary table SECTION 1: TOURISTS AND PASSENGERS 5 Gran Canaria Canary Islands SECTION 2: CUSTOMER PROFILE 11 SECTION 3: ACCOMMODATION INDICATORS 14 Hotel and non-hotel occupancy survey SECTION 4: EMPLOYMENT 20 SECTION 5: AIR CONNECTIVITY 22 Airlines ranking in Gran Canaria Airports ranking with Gran Canaria as destination

The tourism sector: a brief view
General summary table. 2023.

Foreign
Employees in the tourism sector 93.658
Purpose of stay
Tourist profile. Gran Canaria
Leisure and holidays have been the main reason during 2023, accounting for 95,75%.
Type of accommodation
Hotel accommodations have been preferred by visitors, with a 64,38% share.
Period of stay
Use of touristic package
CANARY ISLANDS
*The number of total tourists in the Canary Islands does not match with the sum of the islands. The data for each island is calculated as the sum of main tourist and secondary tourist (one who visits the island after visiting another).
The most frequent distribution of nights spent by tourists in 2023 has been from 1 to 7 nights, accounting for 62,85%.
The use of touristic package decreases compared to 2019, with a 53,64% share.
FOREIGN TOURISTS IN GRAN CANARIA BY COUNTRY OF RESIDENCE 2023
Germany
Belgium
France
Ireland
Italy
The Netherlands
Nordic countries
United Kingdom
Other countries
4
% Var. 19-23
tourists (FRONTUR) 4.340.676 1,59%
GRAN CANARIA Indicator 2023
Total
passengers (AENA) 3.692.377 2,22%
-18,28%
Region / Island Total tourists 2023 % Var. 19-23 Canary Islands 16.210.911 7,25% Lanzarote 3.179.036 3,70% Fuerteventura 2.380.581 17,66% Gran Canaria 4.340.676 1,59% Tenerife 6.572.823 11,60%
Cruise passengers (Palmasport) 2023 In transit 354.293 Landing 363.047 Total 717.340 21,51% 2,86% 4,16% 2,91% 3,33% 7,17% 21,96% 24,86% 11,25%

Section 1
Tourists and Passengers
1.1. Tourists in Gran Canaria. 2023.

Source: ISTAC – FRONTUR. COUNTRY OF ORIGIN 2019 2022 2023 Var. % 19-23 Var. % 22-23 Germany 874.742 720.959 819.660 -6,30% 13,69% Belgium 103.474 105.972 108.972 5,31% 2,83% France 95.530 136.369 158.745 66,17% 16,41% Ireland 77.915 81.125 110.766 42,16% 36,54% Italy 100.344 114.253 126.834 26,40% 11,01% The Netherlands 237.795 275.272 273.327 14,94% -0,71% Nordic countries 942.683 736.263 836.839 -11,23% 13,66% United Kingdom 771.922 792.488 947.449 22,74% 19,55% Other countries 416.357 354.147 428.882 3,01% 21,10% Foreigners 3.620.756 3.316.840 3.811.475 5,27% 14,91% Nationals 651.858 551.209 529.201 -18,82% -3,99% TOTAL 4.272.615 3.868.048 4.340.676 1,59% 12,22%
Pasajeros
SECCIÓN 1
6
1.2. Tourists in Canary Islands. 2023.

Source: ISTAC – FRONTUR.
7
SECCIÓN 1
Pasajeros
FOREIGNERS Canary Islands Lanzarote Fuerteventura Gran Canaria Tenerife 2019 13.147.474 2.756.026 1.857.792 3.620.756 5.048.209 2022 12.694.329 2.466.036 1.968.558 3.316.840 5.116.249 2023 14.266.572 2.853.186 2.203.105 3.811.475 5.678.405 Var. 19-23 1.119.098 97.160 345.313 190.719 630.196 Var. 19-23 (%) 8,51% 3,53% 18,59% 5,27% 12,48% NATIONALS Canary Islands Lanzarote Fuerteventura Gran Canaria Tenerife 2019 1.968.234 309.550 165.403 651.858 841.245 2022 1.923.053 350.194 169.195 551.209 835.206 2023 1.944.338 325.853 177.475 529.201 894.417 Var. 19-23 -23.896 16.303 12.072 -122.657 53.172 Var. 19-23 (%) -1,21% 5,27% 7,30% -18,82% 6,32% TOTAL Canary Islands Lanzarote Fuerteventura Gran Canaria Tenerife 2019 15.115.709 3.065.575 2.023.196 4.272.615 5.889.454 2022 14.617.383 2.816.231 2.137.752 3.868.048 5.951.456 2023 16.210.911 3.179.036 2.380.581 4.340.676 6.572.823 Var. 19-23 1.095.202 113.461 357.385 68.061 683.369 Var. 19-23 (%) 7,25% 3,70% 17,66% 1,59% 11,60%
1.3. Foreign tourists in Spain. 2023.

SECCIÓN 1
Pasajeros
Source: INE – FRONTUR. Data may differ from those published by ISTAC due to methodological differences.
8
REGIONS 2023 Var. 19-23 (%) TOTAL 85.056.528 1,85% Andalusia 12.200.666 1,48% Balearic Islands 14.405.322 5,30% Canary Islands 13.942.965 6,06% Catalonia 18.004.010 -7,08% Valencian Community 10.491.985 10,03% Community of Madrid 7.841.055 2,62% Rest of regions 8.170.525 0,77% COUNTRY OF ORIGIN 2023 Var. 19-23 (%) Germany 10.801.229 -3,20% France 11.812.623 5,97% Ireland 2.477.429 13,77% Italy 4.862.972 7,24% The Netherlands 4.094.016 11,12% Nordic countries 4.864.241 -12,04% United Kingdom 17.328.629 -3,80%
1.4. Foreign passengers arrivals in Gran Canaria. 2023.

Source: AENA.
9
SECCIÓN 1 Pasajeros
COUNTRY OF ORIGIN Total 2019 Total 2023 Var. 19-23 Var. (%) 19-23 UNITED KINGDOM 814.549 928.636 114.087 14,01% GERMANY 878.511 834.470 -44.041 -5,01% NORWAY 334.333 284.552 -49.781 -14,89% THE NETHERLANDS 231.325 266.199 34.874 15,08% SWEDEN 307.048 232.802 -74.246 -24,18% DENMARK 164.245 176.555 12.310 7,49% ITALY 94.608 119.370 24.762 26,17% IRELAND 87.656 108.298 20.642 23,55% FINLAND 134.343 105.459 -28.884 -21,50% BELGIUM 101.653 103.380 1.727 1,70% FRANCE 60.487 98.940 38.453 63,57% SWITZERLAND 101.806 97.992 -3.814 -3,75% POLAND 52.350 62.972 10.622 20,29% MOROCCO 49.561 61.295 11.734 23,68% PORTUGAL 65.101 57.706 -7.395 -11,36% AUSTRIA 35.490 44.578 9.088 25,61% MAURITANIA 22.732 22.628 -104 -0,46% OTHER COUNTRIES 76.560 86.545 9.985 13,04% TOTAL 3.612.358 3.692.377 80.019 2,22%
1.5. Foreign passengers in Canary Islands. 2023.


Source: AENA.
10
FOREIGNERS
Total 2019 13.218.941 2.488.520 1.950.950 3.612.358 5.032.809 176.891 Total 2023 14.170.762 2.698.138 2.076.418 3.692.377 5.622.407 81.422 Total variation 951.821 209.618 125.468 80.019 589.598 -95.469 Var. (%) 7,20% 8,42% 6,43% 2,22% 11,72% -53,97%
Canary Islands Lanzarote Fuerteventura Gran Canaria Tenerife La Palma

Section 2
Customer profile
2.1. Tourists according to purpose of stay and booking of touristic packages. 2023.

Source: ISTAC – FRONTUR.
Leisure or holidays
Visits and health
Education, religion, shopping and other personal reasons
Work, business, etc
12
95,75% 1,33% 0,47% 2,45%
54,16% 45,84%
2023 GRAN CANARIA Leisure or holidays 93,59% 95,75% Visits and health 1,63% 1,33% Education, religion, shopping and other personal reasons 0,49% 0,47% Work, business, etc. 4,29% 2,45%
2023 GRAN CANARIA Tour package 57,86% 54,16% No tour package 42,14% 45,84%
Tour package No tour package 2019
2019
2.2. Tourists by type of accommodation and by number of nights stayed. 2023.

Source: ISTAC – FRONTUR.
Hotels or similar
Apartments
Accommodation with family or friends
Cruise ships
Personal property accommodation
Other
1 to 7 nights
8 to 15 nights
16 to 31 nights
32 nights or more
13
62,85% 29,62% 5,59% 1,95%
64,38% 18,75% 6,87% 4,77% 2,36% 2,87%
2023 GRAN CANARIA Hotels or similar 74,50% 64,38% Apartments 6,45% 18,75% Accommodation with family or friends 6,25% 6,87% Cruise ships 5,65% 4,77% Personal property accommodation 2,64% 2,36% Other 4,52% 2,87%
2023 GRAN CANARIA
to 7 nights 62,22% 62,85% 8 to 15 nights 31,68% 29,62% 16 to 31 nights 4,43% 5,59% 32 nights or more 1,68% 1,95%
2019
2019
1

Section 3
Accommodation indicators
3.1. Accommodation survey in hotels and non-hotel establishments in Gran Canaria. 2023.

Source:
SECCIÓN
15
1 Pasajeros
ISTAC – Tourist Accommodation Surveys
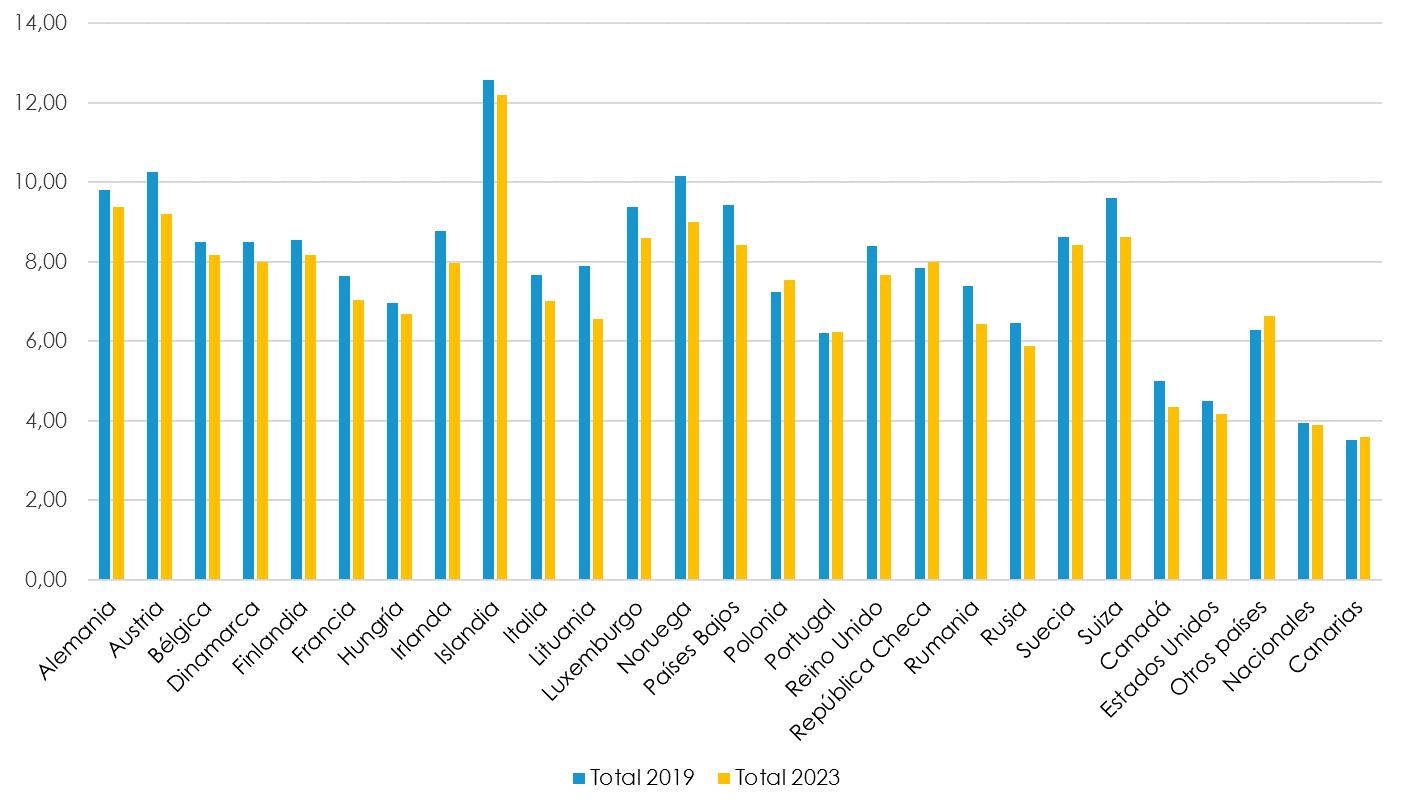
Note: “Nationals” excludes “Canary Islands”. Annual total Interannual variation 2019 2022 2023 Var. 19-23 Var. 22-23 Average stay Total 7,6 7,0 7,1 -6,54% 2,00% Foreigners 8,8 8,1 8,2 -7,12% 0,64% Nationals 3,9 3,9 3,9 -1,60% 0,58% Canary Islands 3,5 3,5 3,6 1,52% 2,31% Overnight stays Total 28.845.156 23.157.953 26.352.290 -8,64% 13,79% Foreigners 25.257.750 19.770.920 22.873.652 -9,44% 15,69% Nationals 3.587.406 3.387.033 3.478.638 -3,03% 2,70% Canary Islands 1.971.743 1.792.837 1.969.620 -0,11% 9,86% Hosted tourists Total 3.871.563 3.376.603 3.775.470 -2,48% 11,81% Foreigners 2.957.987 2.493.977 2.873.358 -2,86% 15,21% Nationals 913.576 882.626 902.112 -1,25% 2,21% Canary Islands 558.339 512.145 550.197 -1,46% 7,43% Inbound tourists Total 3.784.870 3.316.536 3.699.837 -2,25% 11,56% Foreigners 2.876.452 2.439.822 2.804.633 -2,50% 14,95% Nationals 908.418 876.714 895.204 -1,45% 2,11% Canary Islands 556.320 509.752 547.383 -1,61% 7,38% Occupancy rates By rooms 77,2 74,6 79,3 2,75% 6,29% By seats 64,3 65,5 69,3 7,84% 5,85% Daily average rate (€) 86,4 108,2 113,9 2,75% 6,29%
.

Gran Canaria. 2023.

Source: ISTAC – Tourist Accommodation Surveys. Note: “Nacionales / Nationals” excludes “Canarias / Canary Islands”.
16
3.2. Average number of nights in hotels, by country.

Source: ISTAC – Tourist Accommodation Surveys. Note: “Nacionales / Nationals” excludes “Canarias / Canary Islands”.

17
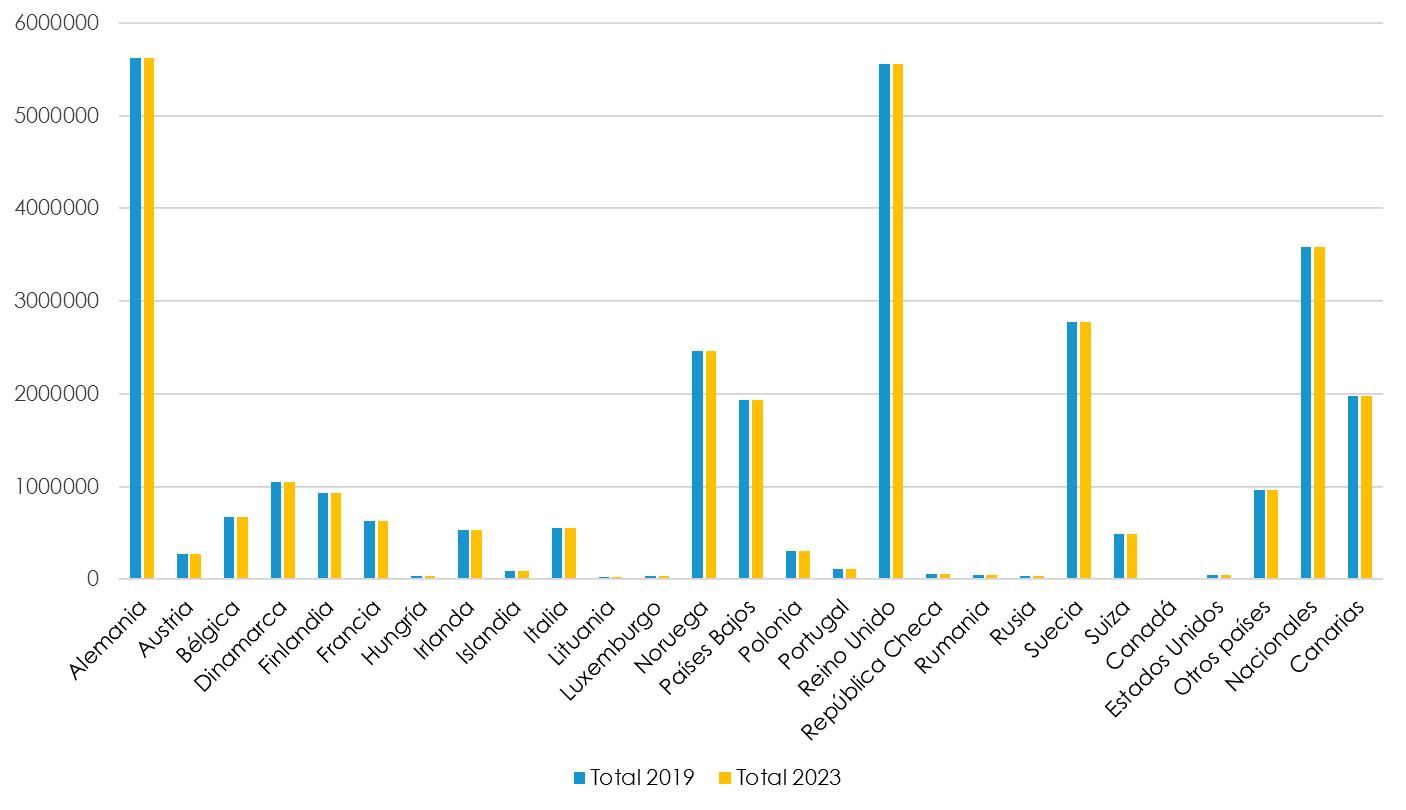
3.3. Total number of stays in hotels, by country. Gran Canaria. 2023.
3.4.


18
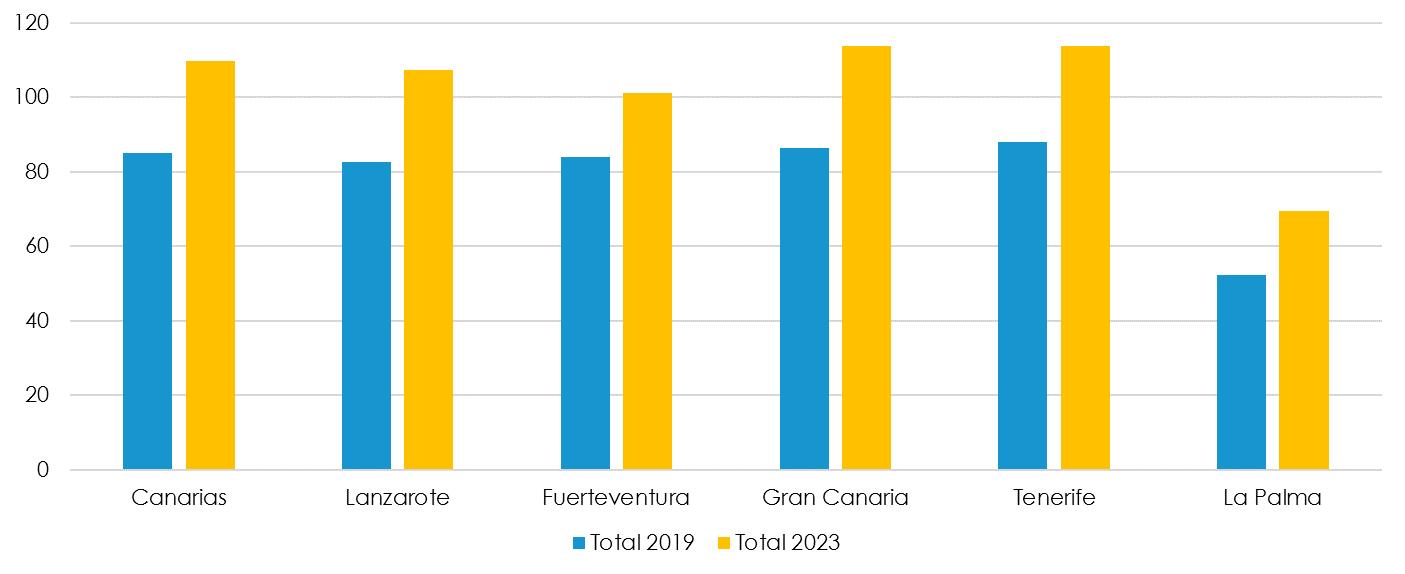
Average daily rate per room
Accommodation Survey. Island / Period Canary Islands Lanzarote Fuerteventura Gran Canaria Tenerife La Palma 2019 85,17 82,75 83,93 86,42 87,94 52,22 2023 109,9 107,51 101,13 113,87 113,88 69,5 Total variation 24,73 24,76 17,2 27,45 25,94 17,28 Var. (%) 29,04% 29,92% 20,49% 31,76% 29,50% 33,09%
(ADR). Canary Islands. 2023. Source: ISTAC – Tourist


19
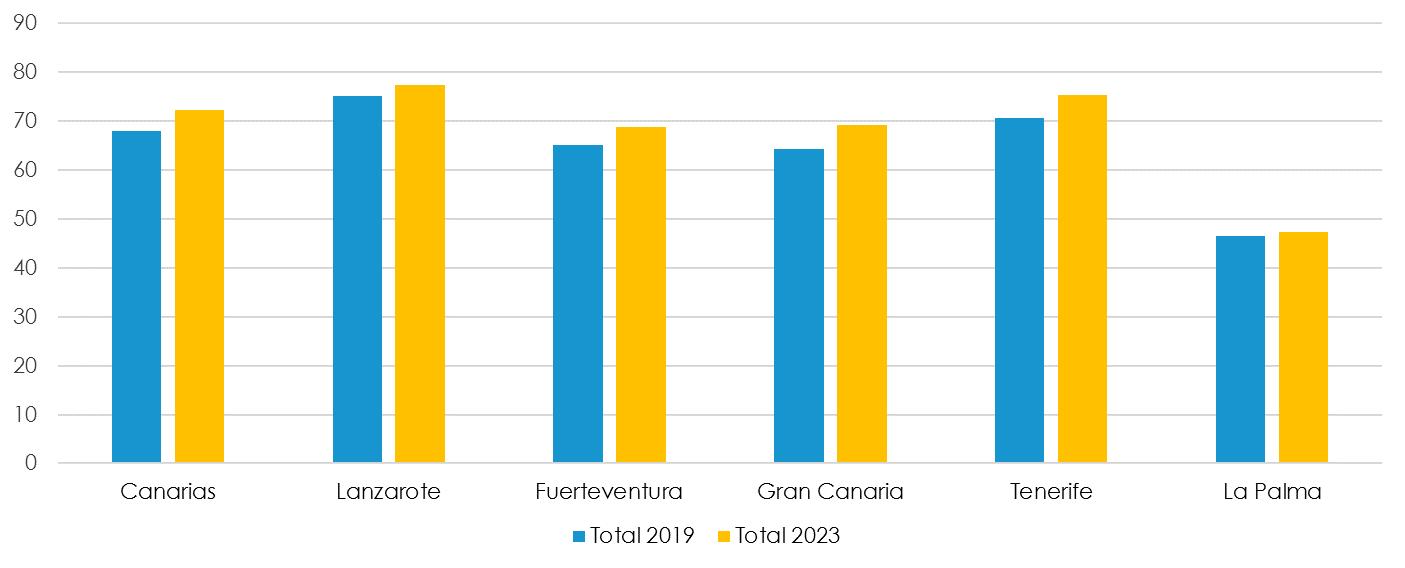
3.5. Occupancy rate by seats. 2023.
Accommodation
Island / Period Canary Islands Lanzarote Fuerteventura Gran Canaria Tenerife La Palma 2019 67,95 75,08 65,1 64,27 70,57 46,5 2023 72,23 77,42 68,8 69,31 75,32 47,41 Total variation 4,28 2,34 3,7 5,04 4,75 0,91 Var. (%) 6,30% 3,12% 5,68% 7,84% 6,73% 1,96%
Source: ISTAC – Tourist
Survey.

Section 4 Employment

SECCIÓN 1 Pasajeros 21 4. Employment in Tourism in Gran Canaria. 2023. Source: OBECAN. UNEMPLOYED AND EMPLOYEES IN TOURISM, IN ACCORDANCE WITH THE CNAE-2009 GRAN CANARIA Unemployed Employees Land and pipeline transportation 14.563 6.141 Maritime and inland waterway transport 1.679 1.291 Air transport 985 841 Accommodation services 37.612 37.766 Food and beverage services 80.885 32.741 Real estate activities 5.087 927 Rental activities 4.818 1.981 Travel agencies activities, tour operators, reservation services and related activities 1.640 689 Creative, artistic and show activities 3.947 4.719 Libraries, archives, museums and other cultural activities 572 174 Gambling and betting activities 2.424 591 Sports, recreational and entertainment activities 10.569 5.797 Total Turism 2019 212.147 114.607 Total Turism 2023 164.781 93.658 Var % interannual -22,33% -18,28% CANARY ISLANDS Unemployed Employees Total Turism 2019 570.420 363.879 Total Turism 2023 424.158 281.654 Var % interannual -25,64% -22,60%

Section 5 Air connectivity
5.1. Airlines ranking in Gran Canaria, by passengers. 2023.

Source: AENA.
Pasajeros
SECCIÓN 1
23
AIRLINE 2019 2022 2023 Total Var. 19-23 Var.19-23 (%) BINTER CANARIAS 1.208.860 1.367.842 1.539.162 330.302 27,32% RYANAIR GROUP 747.739 690.517 778.709 30.970 4,14% VUELING AIRLINES, S.A. 521.537 658.012 725.266 203.729 39,06% TUI GROUP 769.563 595.847 622.623 -146.940 -19,09% IBERIA GROUP 451.588 427.588 490.379 38.791 8,59% JET2.COM LIMITED 261.027 302.714 339.038 78.011 29,89% LUFTHANSA GROUP 234.509 227.306 275.731 41.222 17,58% CONDOR 213.930 187.221 233.351 19.421 9,08% SUNCLASS AIRLINES 195.593 196..824 228.948 33.355 17,05% AIR EUROPA 369.760 180.127 218.759 -151.001 -40,84% EASYJET 102.899 175.580 187.798 84.899 82,51% CANARY FLY, S.L. 186.731 131.666 168.036 -18.695 -10,01% NORWEGIAN AIR SHUTTLE 469.256 121.239 148.297 -320.959 -68,40%
5.2. Airports ranking with Gran Canaria as destination. 2023.

Source: AENA.
24
SECCIÓN 1 Pasajeros
AIRPORT 2019 2022 2023 Total Var. Var. (%) MADRID-BARAJAS ADOLFO SUÁREZ 819.498 709.344 797.667 -21.831 -2,66% TENERIFE NORTE-C. LA LAGUNA 500.586 394.917 451.655 -48.931 -9,77% LANZAROTE-CÉSAR MANRIQUE 402.349 373.370 405.532 3.183 0,79% FUERTEVENTURA 332.576 296.600 323.521 -9.055 -2,72% BARCELONA-EL PRAT J.T. 257.775 233.836 253.226 -4.549 -1,76% DÜSSELDORF 187.504 152.011 175.891 -11.613 -6,19% AMSTERDAM / SCHIPHOL 146.912 182.862 172.019 25.107 17,09% MANCHESTER / INTERNACIONAL 141.258 147.291 155.695 14.437 10,22% FRANKFURT / INTERNACIONAL 121.038 129.919 151.306 30.268 25,01% OSLO / GARDERMOEN 160.870 125.503 148.977 -11.893 -7,39% LONDRES / GATWICK 129.381 115.483 141.995 12.614 9,75% SEVILLA 120.031 128.893 138.266 18.235 15,19%


