2023-2024
INSIGHTS INITIATIVE
RESEARCH REPORT

The Auto Show Insights Initiative is a research study organized and executed by Productions Plus, a company with a long, respected history in the auto show industry. The purpose of the initiative is to tell the story of auto shows through a consistent set of unified data encompassing shows across the country.
Ten auto shows/market areas engaged in the research, which was conducted online and onsite during the 2023-2024 auto show season. A significant 14,908 show attendees completed the survey, the results of which can be found on the pages that follow. Please direct any questions to:
ABOUT THE INITIATIVE Amy Emmatty Chief Research Officer, Productions Plus aemmatty@productions
plus.com 248.881.9616 Jen Morand President, Chicago Automobile Trade Assoc. jmorand@drivechicago.com 630.424.6084
-
THE PARTICIPATING SHOWS


Data sourced from Experian Automotive
Chicago Cleveland Denver Milwaukee Orange County, CA Philadelphia Portland, OR Salt Lake City Seattle-Tacoma Washington, DC
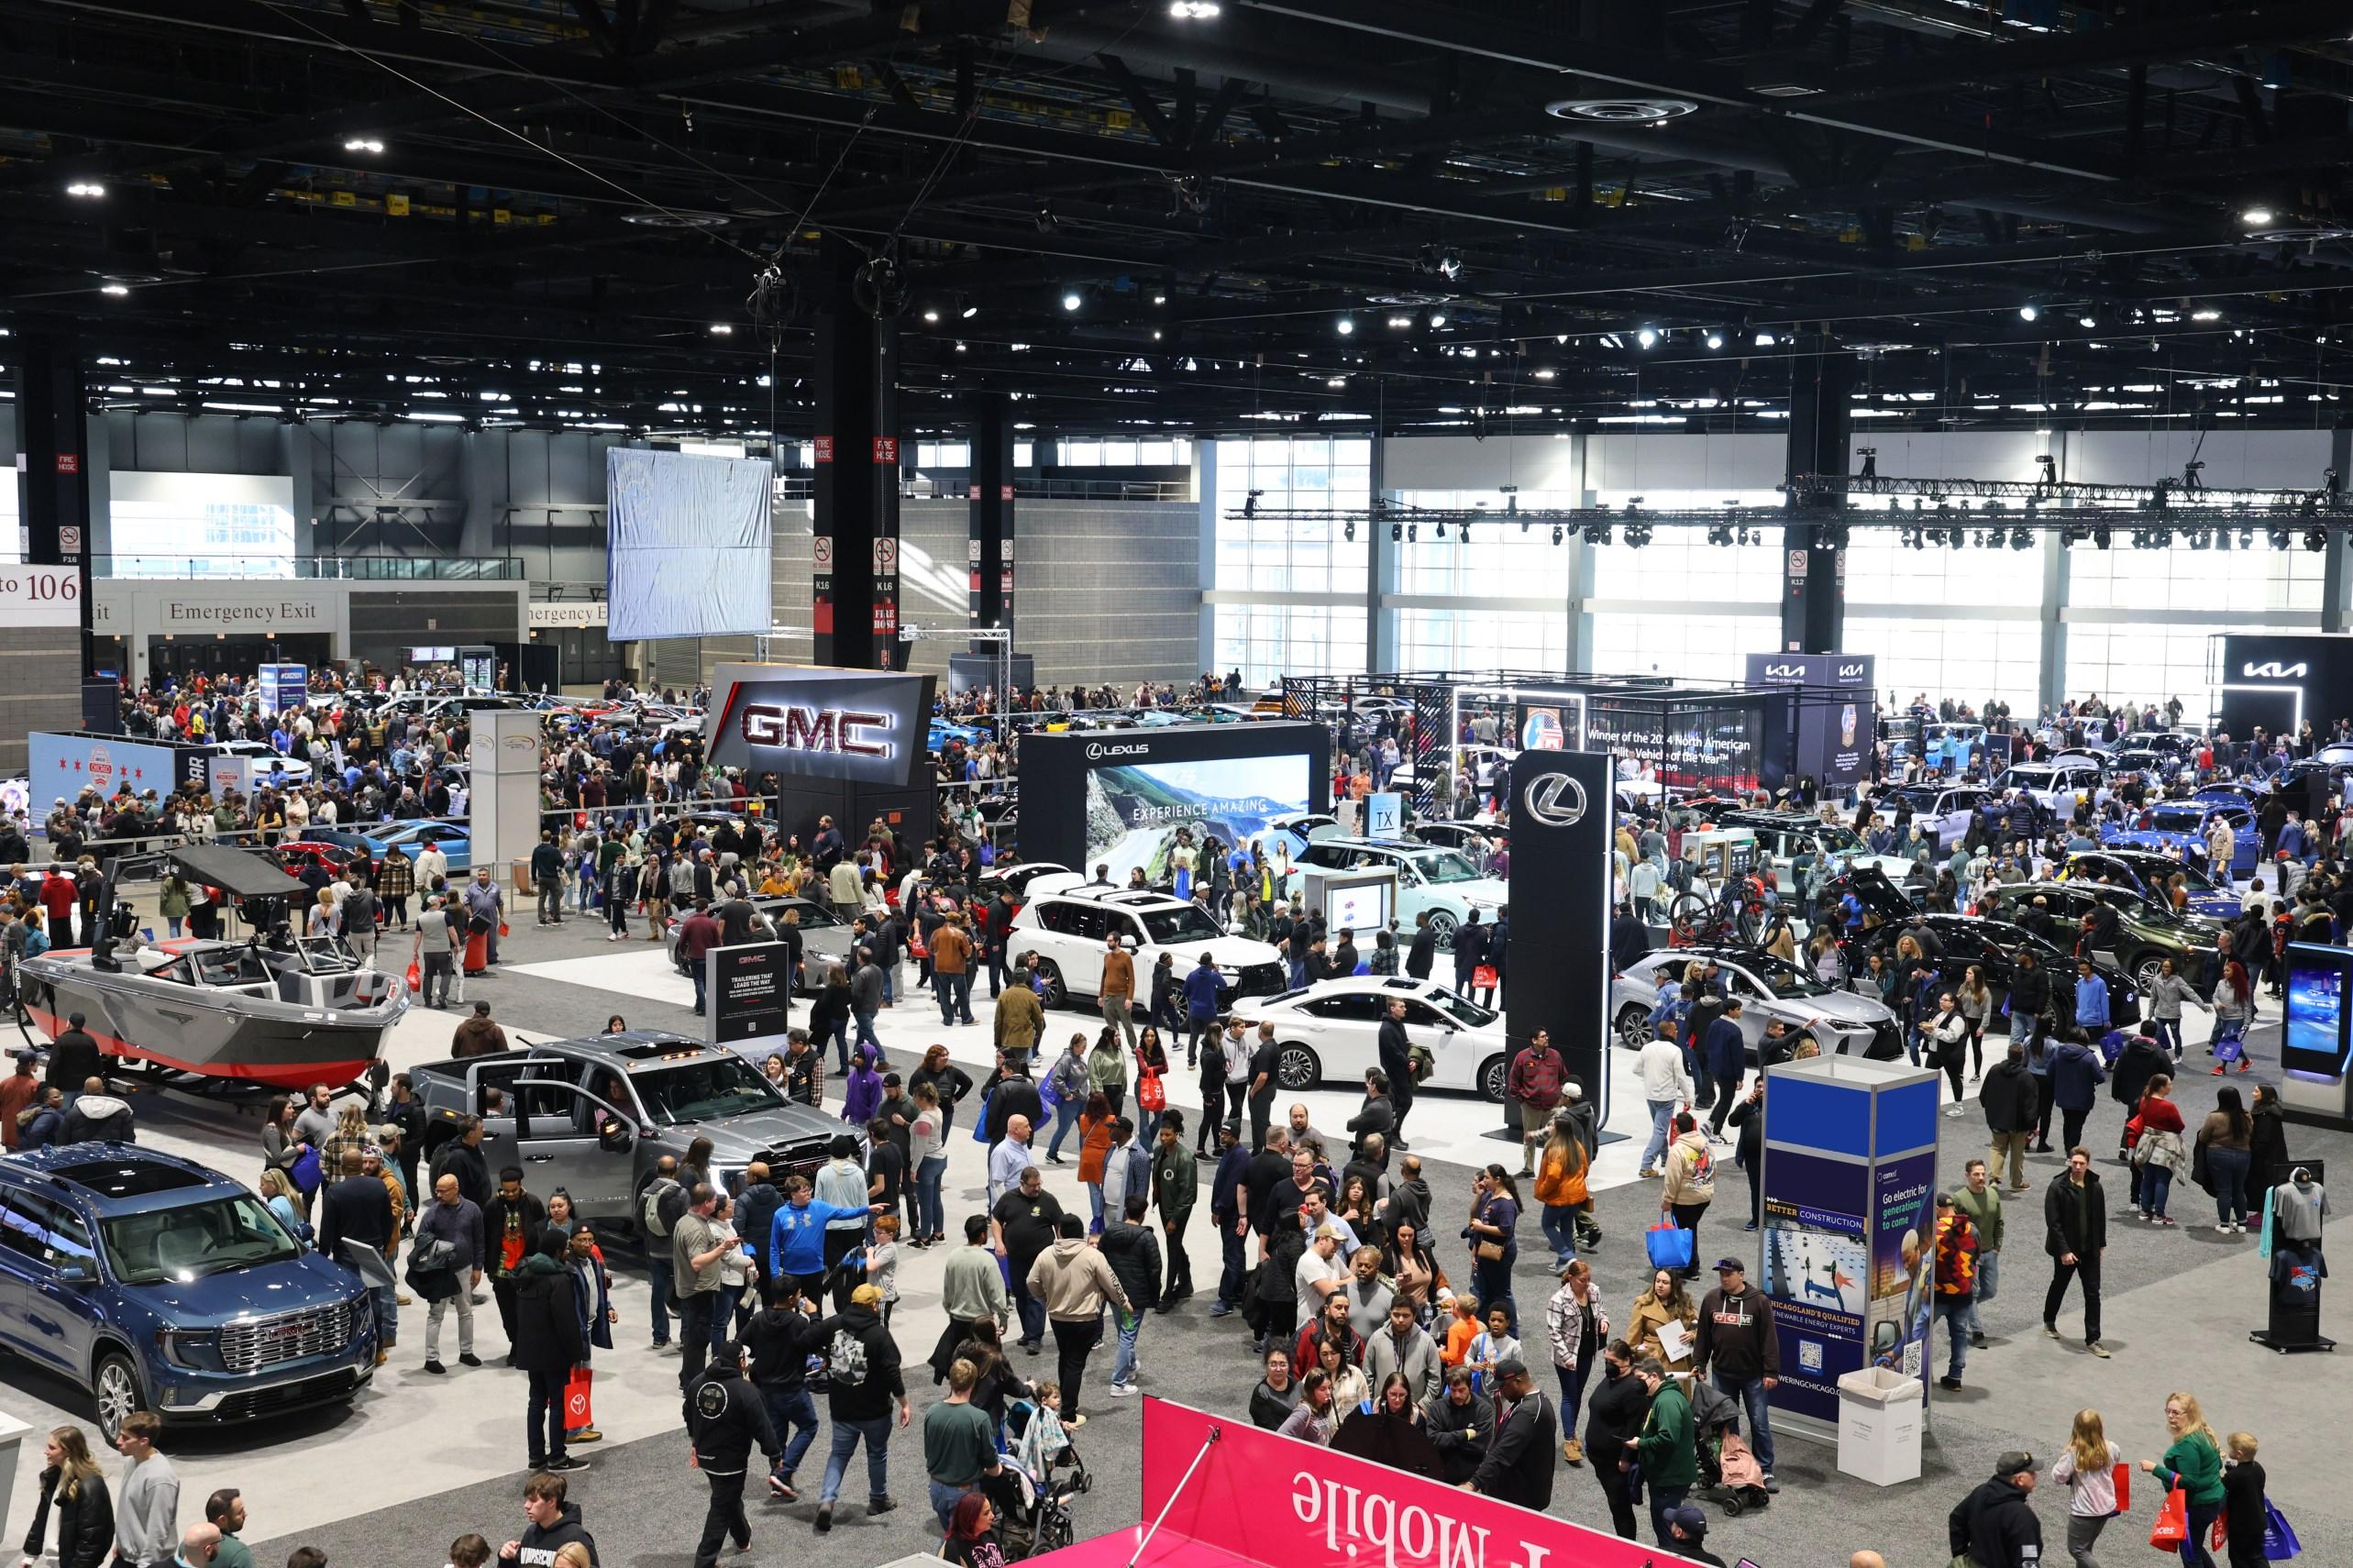
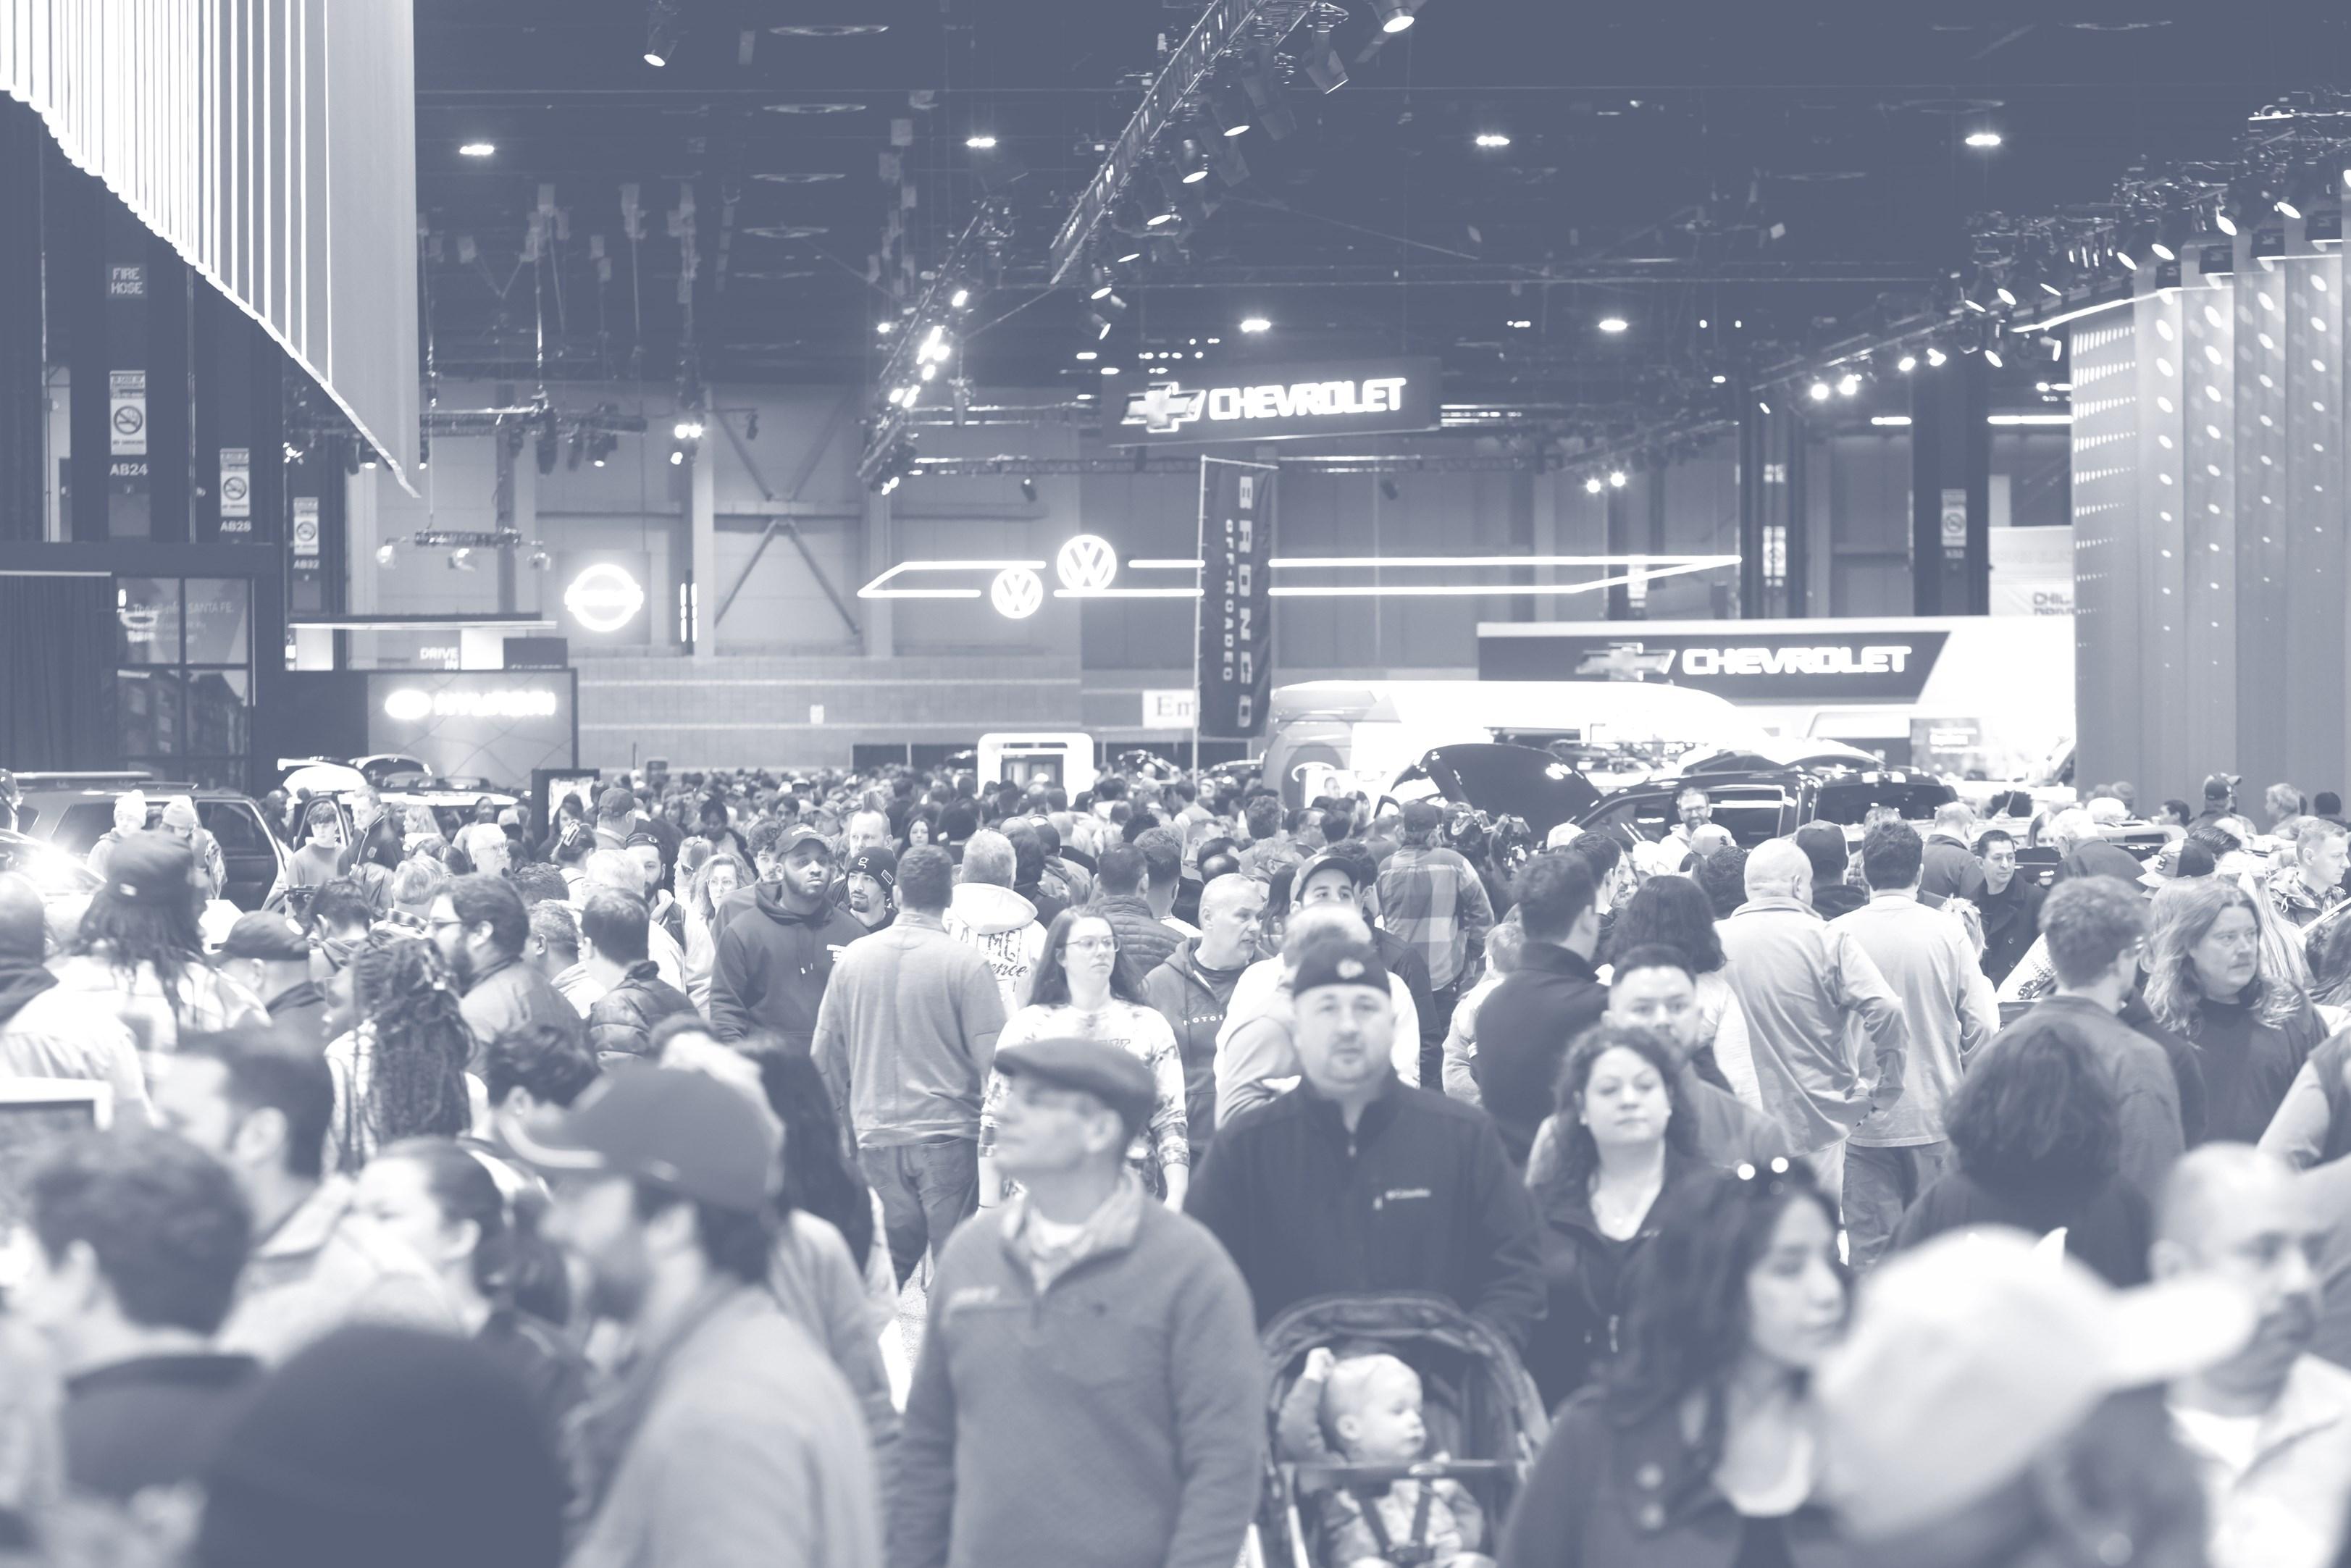
SHOW EXPERIENCE


2.8 average hours spent on the show floor 10.1 average number of vehicles sat in or experienced 8.6 average OEM exhibits visited by each consumer 74% came to see the latest vehicles and technology
2,576,884 HOURS SPENT
7,914,718 DISPLAY VISITS
9,295,192 BUTTS IN SEATS
20% were first-time auto show attendees That’ s...

IN-MARKET CONSUMERS

43% reported they were in the market to purchase a vehicle within the next 12 months
55% plan to spend $40,000—75,000 on their next vehicle
37% added brands to their consideration list

100% were hoping to see a brand that was not at the Show

395,736
BUYERS
69% found the auto show helpful in their purchase decision

51% are more likely to purchase a hybrid, PHEV or EV after attending the show

34% said the auto show has more influence on their purchase choice than any other medium
NON-PARTICIPATING BRANDS
There is a real opportunity cost associated with NOT participating in auto shows.
94% were hoping to see a brand that was not at the Show = 865,097 consumers


66% were disappointed a brand they wanted to see was not present 71% said a brand’s absence impacts their purchase consideration = 690,237 consumers


16% are less likely to purchase from an absent brand = 147,251 consumers = 607,409 consumers


That’s a lot of potential lost sales… not to mention the missed opportunity to be added to a consideration list!
RIDE & DRIVES


30% participated in at least one ride & drive 53% were introduced to a vehicle they had never considered 42% were more likely to purchase the vehicle they drove/rode in
17% participated in an electric ride experience*
58% were introduced to a vehicle they had never considered 41% were more likely to purchase the vehicle they drove/rode in
276,095 consumers got behind the wheel or into the passenger seat for a test drive or ride-along.
156,454 consumers rode in at least one EV or PHEV.
*8 out of 10 shows offered EV-specific test track(s)
EV EDUCATION
Auto shows offer the unique opportunity to introduce a wide range of consumers to these new vehicles & technology.
How knowledgeable were/are you about driving, charging and maintaining an EV? EXTREMELY VERY
BEFORE THE SHOW AFTER THE SHOW EV TRACK RIDERS:
After attending the Auto Show, are you more likely to consider buying an electric vehicle?
47% of EV track riders said they are now more likely to purchase a pure EV
EV PHEV HYBRID EV TRACK RIDERS NON PARTICIPANTS 47% 23% 19% 14% 29% 26%
REASONABLY A LITTLE NOT AT ALL 17% 18% 18% 23% 29% 34% 23% 18% 13% 8%
ATTENDEE DEMOGRAPHICS

INCOME
GENDER 29% 69% AGE 18 24 25 39 40 55 56 65 66 75 76+ 9% 29% 15% 10% 2% 35%
<$30K $30K $44K $45K $59K $60K $74K $75K $99K $100K $149K $150K $199K $200K+ 5% 5% 7% 8% 13% 25% 15% 22% 62% of attendees report household income over $100,000/year of adult attendees are aged 25-55 64% RACE/ETHNICITY CAUCASIAN/WHITE ASIAN OR PACIFIC ISLANDER HISPANIC/LATINO BLACK OR AFRICAN AMERICAN NATIVE AMERICAN OR ALASKAN NATIVE OTHER 70% 10% 11% 11% 1% 1% US POPULATION ATTENDEES
HOUSEHOLD
INSIGHTS INITIATIVE
