WATER INDUSTRY INSIGHTS

Asset management procedure for assessing the risk of failure and remaining useable life of polyethylene water mains


Asset management procedure for assessing the risk of failure and remaining useable life of polyethylene water mains


Joseph Sanders (RPS), Shana Meeus (Artesia), David Chrystie-Lowe (ControlPoint), Joanne Claronino (Severn Trent Water), Edward Eaton (Severn Trent Water), Patrick Campbell (UKWIR Programme Lead Water Mains & Services)
Polyethylene potable water mains with an assumed minimum design life of 501 years have been in widespread use in the UK water industry for more than 30 years. They currently make up approximately 95,000km of UK’s potable network and is currently used for 90% of new mains laid2 .
In the 1980s and 1990s Severn Trent Water buried two polyethylene pipe test beds in the Midlands. These two test beds near the pumping stations at Great Gates and Coopers Green, had all the pipe material analysed chemically and mechanically before installation. This was documented in several studies as well as the subsequent exhumations in the following years 34 . These reports showed that the pipe had not deteriorated significantly in the first 5 years after installation.

A recent UKWIR funded collaborative project has exhumed several of these pipes and repeated these tests, 30 years later. Analysis of these pipes showed that some of the newest PE100 pipes could last as long as 160 years. It also confirmed the relationship between certain chemical markers such as antioxidant concentration and carbonyl levels and the mechanical performance of the pipe. The chemical markers showed the change between a ductile failure and a brittle failure. The variation in performance of early pipes compared to newer evolutions was also obvious from the results obtained.
Based on these test results and the statistical analysis performed, combined with previous work performed on artificially aged samples, a risk assessment methodology for the UK’s polyethylene pipe water network was derived. This methodology gives water companies a way of assessing more accurately if/when pipes need to be scheduled for renewal, assisting with their asset management planning and ensuring that network is maintained in the correct manner.
Further to this, a procedure to perform a statistically robust risk assessment on water company networks was produced. This procedure sets out the number of samples required, methods for obtaining the sample test methods for chemical analysis, and methods for calculating the remaining useable life of polyethylene pipe from the results.
Polyethylene pipes have been used in the UK since the 1960’s initially as service pipes connecting properties to the mains, and then with the improved materials being used as mains from the mid 1980s. The design standard for these pipes1 suggests that a design life of 50 years should be used, this would suggest that the earliest pipes are reaching the end of their life. To date analysis of remaining life of pipes has been conducted on samples
3 DTI Sponsor Group. (1987). Long Term Performance of Plastic Pipes For Water Supply – Appendices.
4 FWR (1991,1992, 1993, 1994), Reports FR0168, FR0266, FR0351, FR0474.
Overview of the Coopers Green excavationthat have been accelerated using higher temperatures56 , or by using chemical accelerants78 . In the absence of any in-service pipes being analysed water companies had little information other than these accelerated tests to base their asset management decisions.

A project to exhume the pipes in Great Gates and Coopers Green has been talked about for over a decade, with several potential starts made. In Summer of 2019 a UKWIR project 9 was started led by ControlPoint including Artesia and subsequently RPS to examine these pipes and present the results of the in-service pipe to the industry. Pipes were exhumed (Figure 1) and tested in winter of 2019/20. From these results, insights into the risks and the asset management decisions required to manage the polyethylene network can be determined.

This paper is one of a set that have been produced focusing on different areas of the results and how they can be used by the water industry to improve asset management decision making and help to improve service to customers.
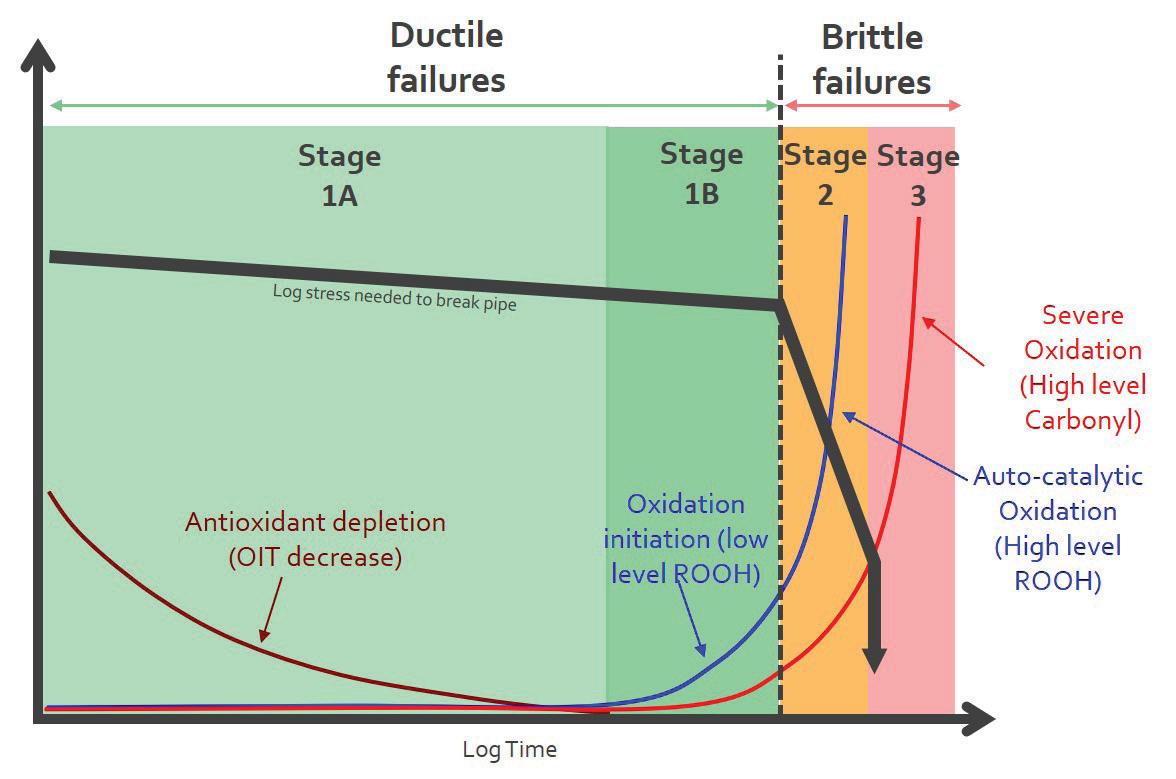
The stages of polyethylene degradation are best described using the creep rupture curve5 , of stress against time. An adaptation of this curve is presented in Figure 2. The degradation can be divided into three main stages, Stage 1 is where failures occur in a ductile manner due to excess force being exerted on the pipe, Stage 2 is the beginning of brittle failures, but still with an amount of force to initiate and Stage 3 is brittle failures with very low force applied. From the accelerated tests, the chemistry of the pipe is thought to change. These changes align with the mechanical properties and hence the failure mode that occurs. Chemical inhibitors are added to the pipe at manufacturing, known as antioxidants, to try and extend the time that the pipe remains in Stage 1, by preventing oxidation of the main polyethylene material.

Stage 1 is divided into 2 sub sections, in Stage 1A the antioxidant inhibitors are depleted from the pipe, through processes of leaching and a small amount of oxidation. During Stage 1A there is little change to the mechanical properties of the pipe. Once all of the antioxidants have been depleted Stage 1B begins. During Stage 1B the pipe starts to oxidise, and the mechanical properties of the pipe begin to become more brittle. During this stage hydroperoxide is formed as a by-product of the oxidation process, Hoàng & Lowe6 showed that once this concentartion was above a certain level then the pipe started to fail in a brittle manner.
5 Eriksson, P., & Ifwarson, M. (1985). Is it possible to explain the occurrence of brittle fracture in polyethylene with fractography and chemical analysis? Plastic Pipes, VI.
6 Hoang, E. M.,
Lowe, D. (2008). Lifetime prediction of a blue PE100 water pipe. Polymer Degradation and Stability, 93(8), 1496–1503
7 Sanders, J. M. B., Shepherd, M. A., Belmonte, H. M. S., & Dear, J. P. (2009). Methods for determining the in-service life of polymer water pipes. Journal of Materials Science.
8 Dear, J.P. & Mason N.S., (2001). The Effects if Chlorine Depletion of Antioxidants in Polyethylene. Polymers & Polymer Composites 9, 1-13.
9 UKWIR. (2020). 20/WM/03/22 - Long term performance of plastic (PE) pipes.
 Figure 2: Illustration of the stages of PE pipe degradation
&
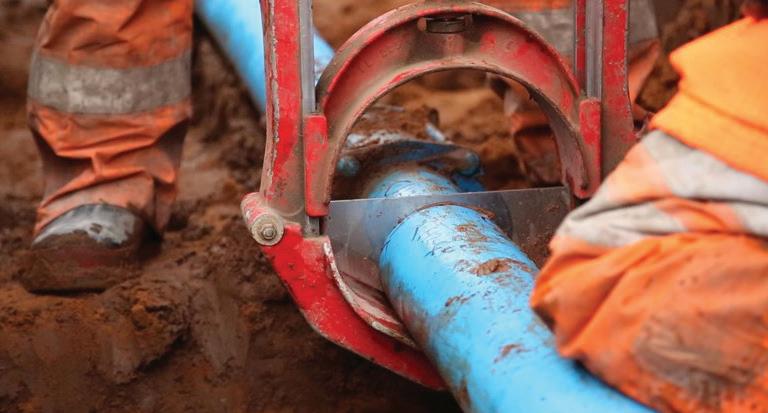
Cutting the pipe to be removed
Pipe samples exhumed from Coopers Green
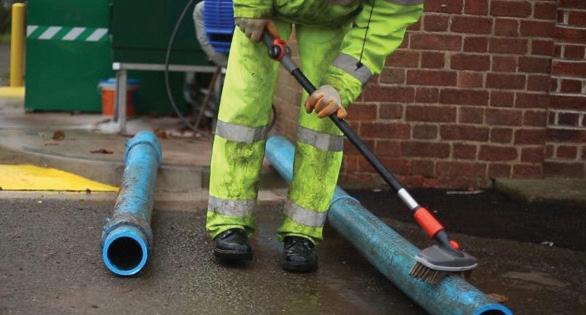
Cleaning the exhumed pipes
At this stage the pipe enters Stage 2 the rate of oxidation begins to acclerate and this is shown by the increase of the hydroperoxide (R-OOH) concentration, but also an increase in the presence of the other oxidation product, Carbonyls (C=O). As the Carbonyl levels increase the polyetylene begins to oxidise even more rapidly and enters Stage 3.
The risk of failure increases significantly as the pipe enters Stage 2, and so a water company asset manager would want to remove pipe before it gets to this stage to reduce the chances of catosrophic failure, though cracking and fragmentation, and interuptions to supply.
Based on the analysis of 4 of the polyethylene samples exhumed from the two test beds, and combining them with the data available in the UKWIR National Failure Database (NFD)10 an approximate assessment of the risk of the pipes currently in the UK water network can be made. The NFD is a UK wide repository of the pipe types, diameters, material and associated failure information.
Only the very oldest of pipes made of a prototype Medium Density Polyethylene (MDPE) (PE80) material were close to the Stage 1A / Stage 1B transition denoted by the antioxidant levels that were recorded, all the other MDPE pipes and the High Density Polyethylene (HDPE) (PE100) pipes were still in the middle of Stage 1A. Table 1 shows the predicted time for the pipes to reach the end of Stage 1A.
Material Years
Prototype
Percentage of UK PE water network (nearest equivalent)
Percentage of total UK water network
Predicted time to reach end of Stage 1A from pipe installation (Years)
MDPE (PE80) Pre 1984 3.4 2.1 23–47
MDPE (PE80) 1984–1994 9.0 5.4 47–85
MDPE (PE80) 1994 -> 43.8 26.5 –
HDPE (PE100) 1994 -> 43.8 26.5 62–113
Table 1 Predicted Time to Reach End of Stage 1A compared to presence in UK water network
The post 1984 PE80 sample had no data from when it was installed, meaning no lifetime prediction could be made, however the antioxidant levels seen were similar to that seen in the post 1994 PE100. PE100 pipes similar to those tested in this work were previously tested under accelerated conditions by Hoàng & Lowe6 , during this these acclerated tests the length of Stage 1B was determined to be approximately 80 years for this type of pipe, meaning that start of brittle failure could occur as much as 160 years after installation.
There is a need from the water companies to use the information gathered from this project to assist with determining the risks associated with their network and the asset management decisions that need to be made based on these risks.
The risk assessment proposed builds on the work previously done by Sanders11 and is based on a similar approach that is already used by the water industry to determine the risk of failure of ferrous mains1213 . The concept of end of useable life similar to the definition used in the ferrous mains study12 where the depth of the largest internal pit and the largest external pit measured from a pipe sample added together is equal to or greater than the thickness of the pipe. At this stage it is advisable to begin to make asset management decisions to replace or refurbish this main, as the potential for failure is high. The polyethylene equivalent of this point is the end of Stage 1B.

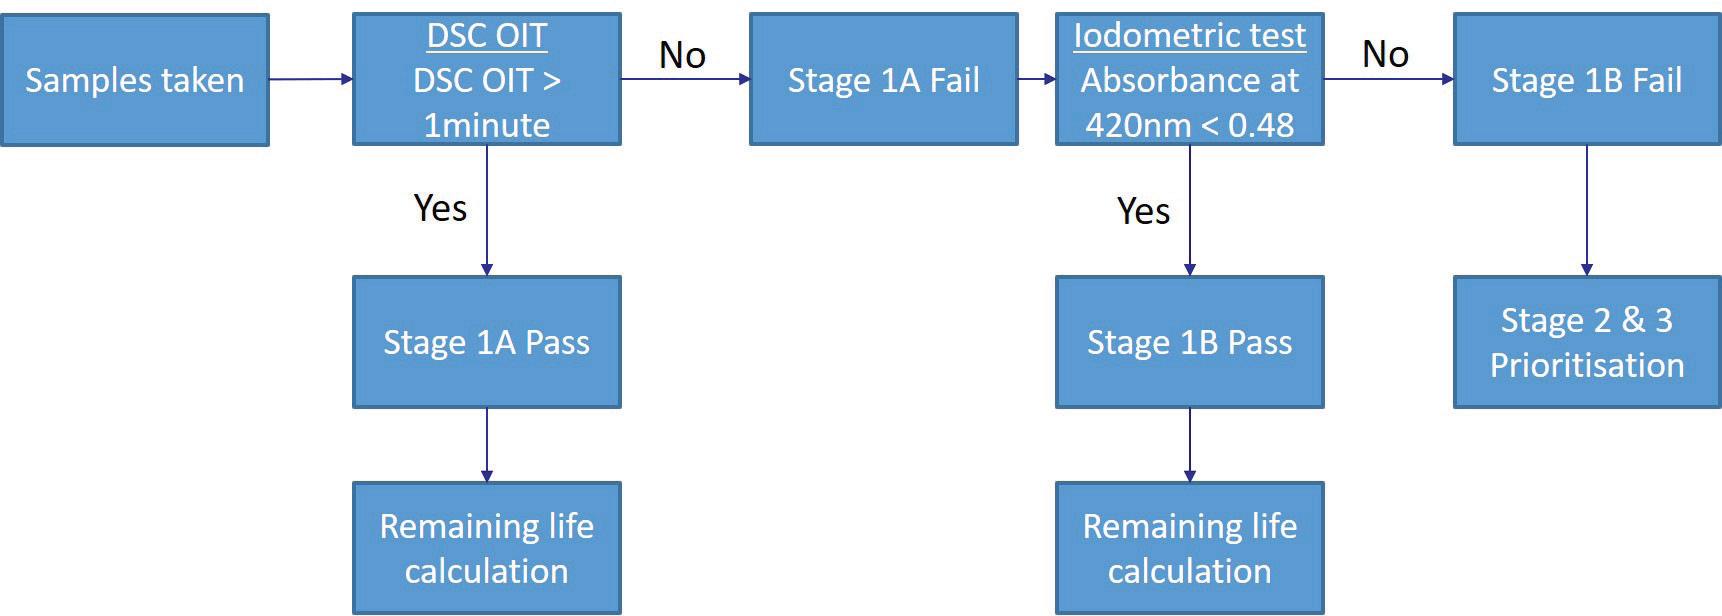
Figure 3 is an overview of the process that was outlined in the work.
11
12 WRc. (1986). Assessing the Condition of Cast Iron Pipes, Source Document No.9 for the Water Mains Rehabilitation Manual. 13 Randell-Smith, R. (1992). Guidance Manual for the Structural Condition Assessment of Trunk Mains.
Figure 3: Overview of the process for lifetime risk assessment for PE pipeThe correct number of samples should be taken from a given polyethylene pipe cohort to ensure that the insight from the risk assessment is robust and asset management decisions can be made on the data with a reasonable degree of confidence.
To calculate the number of 1 metre samples (n) the following formula should be used:


Pipe samples can be taken in one of two ways, and these have advantages and disadvantages that are stated below.
1. A 1 metre pipe sample taken from a full trial hole
Advantages – There is enough material to do all of the chemical tests as well as doing small scale mechanical tests.
Disadvantages – Requires a larger excavation, hydraulic isolation of the main and pipe replacement is also required.
Where: Z α/2 is the critical value of the Normal distribution at α/2 (e.g. for a confidence level of 90%, α is 0.1 and the critical value is 1.65 from the Z tables).
MOE is the margin of error.
σ2 is the population variance. Specifically, this is the variance of the variable of interest. For example, if antioxidant levels are the aim, this value is the variance of antioxidant levels seen in previous tests.
N is the population size, in this instance the length of the network of a particular cohort in metres.
The above calculation provides the recommended number of samples required to estimate the true population mean of all PE pipes of a given cohort with the required margin of error and confidence level. If the recommended sample size is used then, although it is not known whether the correct answer has been found, it is 90% confident that the correct answer is within the margin of error (using the recommended 90% confidence level). Where the specified amount of pipe cannot be exhumed, it is possible to calculate what the confidence level will be using the number of pipes to be removed. This is done by rearranging the equation above to solve for Z α/2
Advantages – Small excavation needed and can be done under pressure, so does not require customer isolation.
Disadvantages – Smaller amount of material recovered, that potentially would not be enough for all chemical tests to be performed. A coupon from a standard 32mm ferrule will have sufficient material to perform smaller chemical analysis. No mechanical tests could be done.
Three types of testing are suggested, with the expected Stage taken into consideration, i.e. if a pipe is thought to be well into Stage 1B, there is little reason to perform an antioxidant test. Some of these tests are complex and should be carried out in a laboratory environment by trained chemical analyst technicians.
· Antioxidants test. The level of antioxidants remaining in the polyethylene can be determined using a Differential Scanning Calorimetry Oxidation Induction Time (DSC OIT) analysis. In this a small amount of the pipe (approximately 15mg) is heated up to 200°C using a Differential Scanning Calorimeter and then exposed to oxygen. The time taken to see the exothermic oxidation reaction is recorded as the DSC OIT. The lower the DSC OIT the lower the antioxidant levels are and the closer to the end of Stage 1A.
· Hydroperoxide concentration. The iodometric test is used to determine the level of hydroperoxide, this test developed by Hoàng and Lowe6 separates the hydroperoxide ions into a solution, so they can be analysed using a Spectrometer. The absorbance recorded by the Spectrometer at 420nm is used as the measurement of the hydroperoxide concentration.
The higher the absorbance the more hydroperoxide present and the more oxidation that has occurred.
· Carbonyl index. A Fourier Transformed Infra-red (FTIR) Spectrometer produces a scan of the surface of the sample. Different frequencies of infra-red light are absorbed by the bonds of the chemical in the sample, so it allows the identification of these bonds and their abundancy in the sample. The value at 1715cm-1 (which is the ketonic bond) is used to represent the carbonyl product formed and this is normalised using the value at 2920cm-1 (this is the hydrocarbon bond). The higher the carbonyl index the more oxidation has occurred.
· Mechanical tests can also be done on the samples if a full pipe sample is taken, these could include a tensile test to examine the ductility, Charpy impact testing for resistance to fast fracture and/or a C-ring test to examine the slow crack growth resistance of the sample. Melt Flow Rate (MFR) testing may also be a useful tool to potentially correlate with the other tests.
Based on the work by Sanders11 and modified with the results of the project the decision tree in Figure 4 can be used to determine the correct action based on the results of the chemical analysis.
If the DSC OIT is greater than 1 minute then the sample is still in Stage 1A, and a remaining time in this stage can be calculated (see below). If the DSC OIT is less than 1 minute, then it is likely the sample has entered Stage 1B. If this is the case, then the results of the Iodometric test results should be examined, if the absorbance at 420nm is less than 0.48 then the sample is still in Stage 1B and the remaining time can be calculated until the end of useable life can be performed. If the absorbance at 420nm is greater than 0.48 then the same is likely to be in Stage 2 or 3 and should be prioritised for replacement. A value of 0.48 has been used as a threshold to allow for potential uncertainty around the results obtained and has been set so that a failure of test would occur approximately 5 years (i.e. one AMP cycle) before the pipe entered the brittle failure region, to allow for renewal to occur, Hoàng and Lowe6 found that this transition occurred with an absorbance of 0.5.
Once the Stage 1B criteria has failed, the pipe is deemed to be at the end of its useable life. This is likely to lead to multiple brittle failures, but also sections of pipe that are difficult to repair when they fail leading to large lengths having to be replaced and significant disruption to customer supplies. The hydroperoxide concentration test and the carbonyl product test should be used to rank all the pipes that have failed this criterion to assist water company asset managers to prioritise mains renewals.

The remaining time to the end of Stage 1A can be determined using the decay formulae, where the (DSC) OIT of a pipe after time t follows the relationship:


Where:
OIT0 is the DSC OIT of a brand-new pipe S t OIT is the decay rate of the antioxidants for the pipe being tested
This can be rearranged to give the remaining time in Stage 1A if a pipe has a DSC OIT value of OITa. S t can be determined using the information from previous tests on similar materials. To assist with the collection of this type of information it was recommended that a database of these tests is organised to assist with these calculations.
In conclusion based on a number of pipes that have been exhumed after having been fully analysed before installation, a risk assessment has been performed on the UK polyethylene water network. It shows that it is likely that the 50 year design life that is currently used for polyethylene pipes could be significantly higher. Based on the results only the earliest prototype polyethylene pipes have completed the Stage 1A degradation process.
Using these results and work previously published a methodology for water companies to assess their own network has been developed. This allows these companies to use the outputs from this work to assist them with asset management decisions now and into the future. This provides them with a similar tool to that already employed for ferrous mains to analysis polyethylene mains.
Similarly, the remaining time in Stage 1B can be calculated by using the growth formulae, where the hydroperoxide concentration (ROOH) of pipe after time t can be calculated, where t is the time from installation in years as Where:
ROOH 0 is the hydroperoxide concentration of a brand-new pipe S t ROOH is the growth rate of the hydroperoxide concentration for the pipe being tested

This can be rearranged to give the remaining time in Stage 1B for a pipe with a hydroperoxide concentration of ROOH b
The authors would like to thank Severn Trent Water for the supporting this project and their help in exhuming these pipes. The test beds at Great Gates and Coopers Green have a significant amount of information still to tell us and their forethought in the 1980s and 1990s has provided the industry with a valuable asset. We would also like to thank the UKWIR project manager Rebecca Haylock for her assistance on this project.
The authors would like to acknowledge the support of UK Water Industry Research (UKWIR) for funding this project on behalf of the UK water utilities.
It should be noted that the remaining time in Stage 1B should not be added to the remaining time in Stage 1A.
