5 minute read
CRYPTO TRADE OPPORTUNITIES
CRYPTONAIRE WEEKLY
CRYPTO investment journal
CRYPTO TRADE OPPORTUNITIES
BITCOIN - BTC/USD
As we had mentioned in the previous analysis, the bears attempt to fake almost every breakout. They did just that when they dragged Bitcoin back below the $12,134.29 support on August 18.
Although the bulls held the first dip to the 20-day EMA on August 19, they could not sustain the bounce, which suggests a lack of buyers at higher levels. On August 21, the BTC to USD pair hit our suggested stop-loss at $11,500.
The 20-day EMA has flattened out and the RSI has dropped close to the midpoint, which suggests a balance between supply and demand. This could result in a few days of range-bound action. On the downside, if the bears can sustain the price below the 20-day EMA, a drop to the $10,900- $11,100 support zone is possible. The bulls will defend this zone aggressively but if the bears break it, the decline can extend to $10,500.
The resistance of the range is $12,134.29 and above it $12,486.61. However, as the support of the possible range is still not established, traders should wait on the sidelines . There are two possible trading opportunities. If the pair bounces off $10,900 or $10,500, traders can buy a small position and expect the price to move up to $12,134.29.
Another opportunity will arise if the price soars from the current levels and closes above the overhead resistance. Such a move will suggest a pick up in momentum and can be traded with a close stop-loss.
CRYPTONAIRE WEEKLY
CRYPTO investment journal
ETHEREUM - ETH/USD

Ether plunged below the $415 support on August 19 and took support on the 20-day EMA as we had anticipated. However, the bulls could not sustain the rebound above $415, which suggests a lack of demand at higher levels. That resulted in a sharp fall on August 21 that hit the stop-loss at $390.
Currently, the price is stuck between $380 and $415. This tight range trading suggests a balance between supply and demand. The 20-day EMA has flattened out and the RSI is just above the 50 level, which points to a range-bound action in the near-term.
If this range resolves to the upside and the bulls push the price above $415, a retest of $447.50 is likely. If this level is scaled, the uptrend is likely to resume with the next target at $480.
Conversely, if the bears sink the price below $380, a drop to $364.49 is possible. This is an important support to watch out for. If this also cracks, the ETH to USD pair could sink to $334.
The traders can buy 50% of the desired position closer to the supports, but the long positions should be initiated after the price bounces off the support, instead of buying on the way down. The remaining positions can be added after the price sustains above $415.
If the $380 support cracks, traders can watch the price action at $364.49 and then buy with the stops placed just below this critical support.
RIPPLE - XRP/USD CRYPTONAIRE WEEKLY
CRYPTO investment journal

XRP turned down from $0.32750 on August 17 and has continued lower since then, which suggests that the bears are aggressively defending the higher levels.
The 20-day EMA has flattened out and the RSI is close to the midpoint, which suggests a balance between demand and supply.
Currently, the price is stuck between $0.32750 and $0.26756. In a range, the best time to buy is on a bounce off the support and the time to sell is closer to the resistance.
In this case, if the price rebounds off $0.26756, it could offer a buying opportunity as the bulls will try to propel the price to the resistance to $0.32750. However, trading in a range can be volatile, hence, traders should keep the position size only about 40-50% of usual.
Conversely, if the bears sink the price below $0.26756, long positions should be avoided because then, the decline can extend to the 50-day SMA.
CRYPTONAIRE WEEKLY
CRYPTO investment journal
BITCOIN CASH - BCH/USD

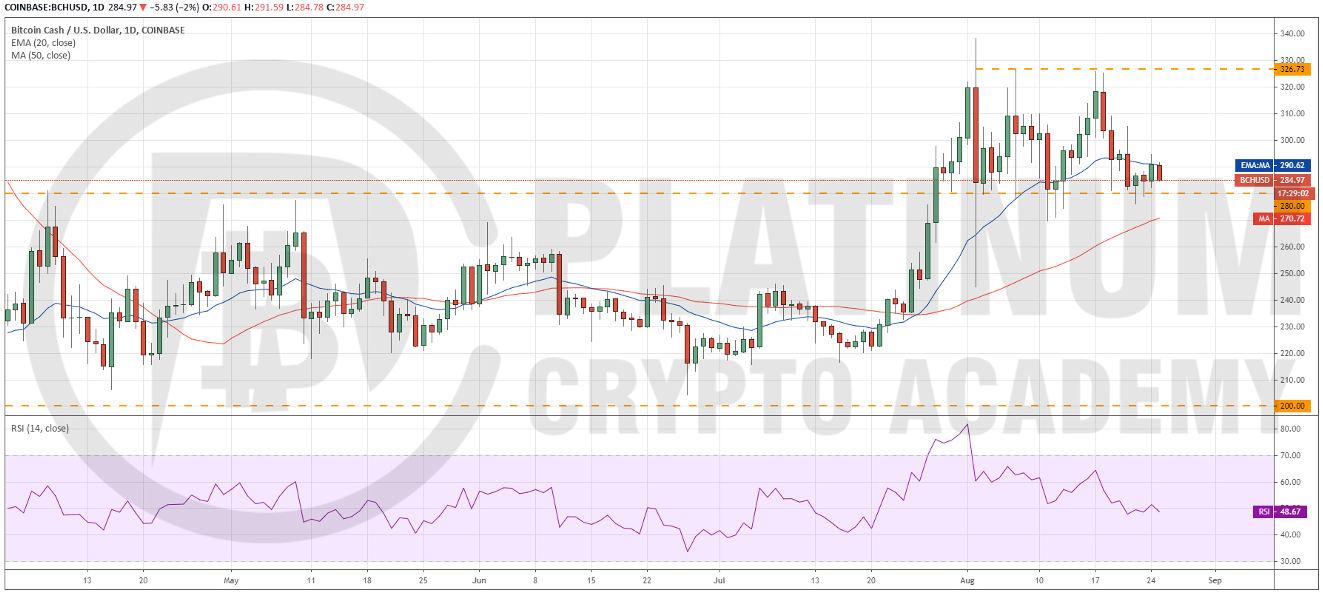
The bulls could not push Bitcoin Cash above the $326.73 resistance on August 17 and 18. That attracted profit booking from the short-term traders, which resulted in a decline to the $280 support.
Although the bulls have held the $280 support for the past few days, they have not been able to push and sustain the price above the 20-day EMA, which is a negative sign. This shows that the bears are aggressively defending this resistance.
If the bears can sink and sustain the price below $280, the BCH to USD pair is likely to drop to $245. Though the 50-day SMA might act as a minor support, it is unlikely to hold.
Contrary to this assumption, if the bulls can sustain the price above $295, a move to $326.73 will be underway.
CRYPTONAIRE WEEKLY
CRYPTO investment journal
LINK/USD - LINK/USD

We had warned traders in our earlier analysis that vertical rallies are unsustainable and that is what happened. Chainlink has entered a period of correction after topping out at $20 on August 16.
The altcoin plunged below the 20-day EMA on August 21 but the lack of follow up selling resulted in a sharp recovery on August 22. However, the bulls are struggling to sustain the price above $16, which is a negative sign.
If the bears can again sink the price below the 20-day EMA, a drop to $12.84 and then to the 61.8% Fibonacci retracement level of $11.66936 is likely. Such a move will be a huge negative.
Conversely, if the bulls can push the price above $16, a move to $17.72834 is possible. If this level is also scaled, a retest of $20 will be on the cards. We do not find a reliable buy setup; hence, we are not proposing a trade in it.


