
68 minute read
Attachment B – Long Term Financial Plan


Port Stephens Council has prepared this plan on behalf of the Port Stephens community and would like to thank the residents, community groups, business and government representatives who provided input into the plan
The Long Term Financial Plan has been prepared in accordance with Section 403 of the Local Government Act 1993.
Acknowledgement
We acknowledge the Worimi as the original Custodians and inhabitants of Port Stephens.
May we walk the road to tomorrow with mutual respect and admiration as we care for the beautiful land and waterways together.
© 2022 Port Stephens Council
Contents
Executive Summary .................................................................................................32 1. Introduction .......................................................................................................35 1.1 Purpose of the Long Term Financial Plan (LTFP).......................................35 1.2 Objectives and Preferred Outcomes ...........................................................37 1.3 Financial Challenges...................................................................................38 1.4 Sensitivity analysis......................................................................................39 1.5 Key Assumptions ........................................................................................39 2. Other Resourcing Strategies.............................................................................41 2.1 Workforce Management Strategy................................................................41 2.2 Strategic Asset Management Plan..............................................................42 3. Planning Assumptions.......................................................................................44 4. Financial Position..............................................................................................45 4.1 Cash and Investments ................................................................................46 4.2 Infrastructure, Property, Plant and Equipment ............................................47 4.3 Debt Management (Borrowings) .................................................................48 4.4 Provisions....................................................................................................50 5. Financial Performance......................................................................................51 5.1 Income ........................................................................................................52 5.2 Expenditure.................................................................................................55 5.3 Other factors ...............................................................................................57 6. Financial Performance Indicators......................................................................58 6.1 Fit For The Future.......................................................................................58 6.2 Additional Performance Monitoring .............................................................58 7. Financial Modelling Assumptions and Results..................................................62 8. Financial Statements – Standard Scenario.......................................................67 8.1 Standard Scenario – Income Statement .....................................................67 8.2 Standard Scenario – Statement of Financial Position (Balance Sheet).......68 8.3 Standard Scenario – Statement of Cash flows............................................69 8.4 Standard Scenario – Graphs.......................................................................70 Appendices ..............................................................................................................74 Appendix 1: Statement of Restricted Cash...........................................................74
Appendix 2: Scenario 1: Conservative..................................................................82 Appendix 3: Scenario 3: Strategic ........................................................................89 Controlled Document Information.............................................................................96 Version History.........................................................................................................96
Executive Summary
The Long Term Financial Plan 2022-2032 (LTFP) aligns the long term aspirations and goals of the Community Strategic Plan (CSP) with Council’s financial ability to deliver these ambitions.
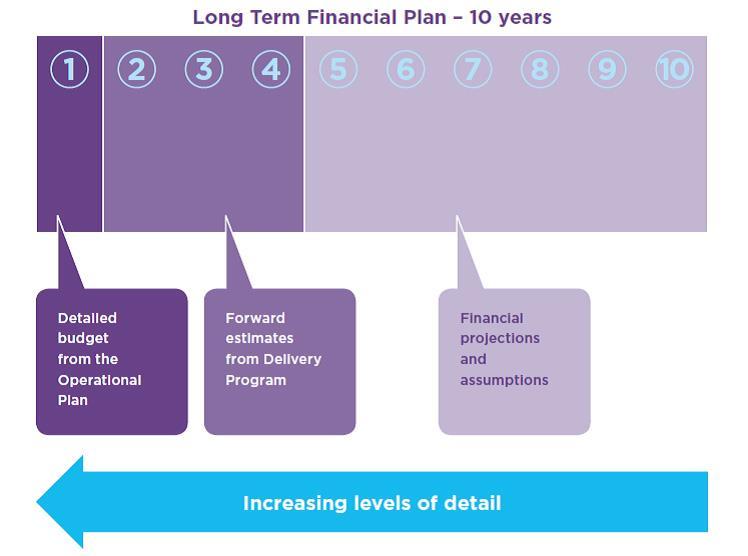
It provides a robust yet dynamic framework in which Council can review and assess its financial sustainability in conjunction with its core functions and responsibilities. The LTFP contains a set of long range financial projections based on a set of assumptions. It covers a 10 year period from 2022-2023 to 2031-2032.
The LTFP models 3 scenarios, each of which shows a specific financial outlook. The scenarios are cumulative, so that each scenario incorporates the assumptions and financial outcomes of the previous scenario(s). The scenarios can also be looked at in isolation. This iteration of the LTFP aims to model and inform residents on the outcomes of the various financial scenarios.
The Standard Scenario is the preferred option in setting the 2022-2023 operating and capital budget. Each of the scenarios presented highlight the continuing financial pressures that are being faced by the organisation. Each area of operations will need to be critically examined by the organisation with the recently formed Financial Sustainability Committee providing oversight and direction in this regard. The scenarios presented have assumed that current service levels have been maintained at the same level, but this to will be critically examined to ensure the longer term financial sustainability of the organisation.
Each scenario clearly shows that Council is predicting operating deficits for a number of years, coupled with a real shortage of cash to continue to fund operations should current service levels be maintained. While the Covid 19 pandemic, natural disasters and cost of providing services continue to place economic pressure on the organisation. Clearly this needs to be addressed and a program of work to address this will continue to be implemented.
Council continues to face further pressures being constrained by a rate capping regime imposed by State Government that does not adequately provide for the real increases in the cost of services.
Clearly Council will need to critically examine the rate burden placed on residents and ratepayers of the Local Government area and will need to examine all options that may be available including the potential to apply for a Special Rate Variation. While such a move may be undesirable, the option to consider an upscale of the rate burden must be examined. Naturally, an extensive period of community consultation will be required should such an option be explored for further consideration.
The main assumptions used for each scenario is as follows:
Income
Rates Rate Capping factor applied 2022 Ongoing peg factor beyond 2022 New annual rates assessment
Conservative Standard Strategic
1.3% 2.5% 2.5%
2.5% 2.5% 3.0%
150 150 150
User fees and charges *10% one off for non-statutory
Operating grants and Contributions Annual factor
Other Cash investment returns Other income Rental income Airport dividend
Expenses
Salaries and allowances Materials and contracts 3.5% beyond 2026 Other expenses Enhanced services levels 2.5% 2.5% 2.5%
1.0% 1.0% 1.0%
2.0% 2.5% 2.5% 2.0% 2.0% 2.5% 1.0% 1.0% 1.0% Nil Nil Nil
Conservative Standard Strategic
2.25% 2.25% 2.25% 5.1% 5.1% 5.1%
2.5% 2.5% 2.5% Additional $250k
Projected Result
2022-2023 2023-2024 2024-2025 2025-2026 2026-2027 2027-2028 2028-2029 2029-2030 2030-2031 2031-2032
Conservative Standard Strategic
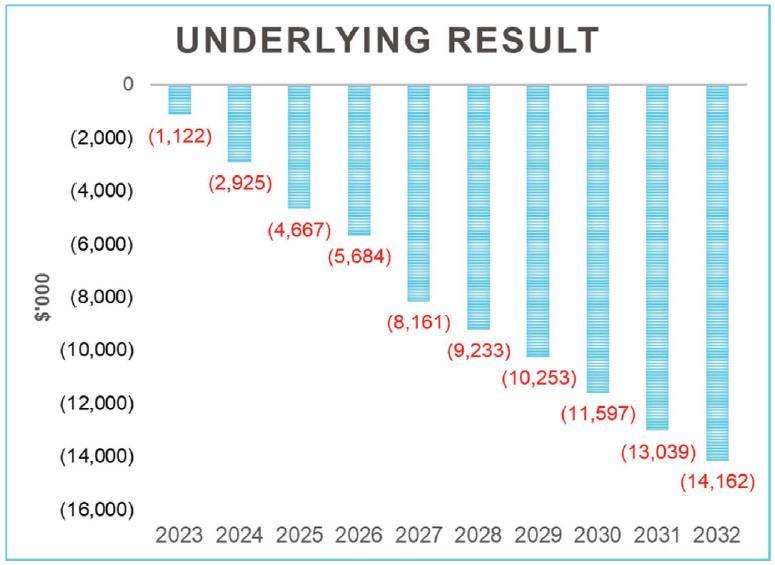
(1,676) (1,122) (1,360) (3,682) (2,925) (3,071) (5,449) (4,667) (4,767) (6,467) (5,684) (6,719) (8,918) (8,161) (10,230) (9,982) (9,233) (12,464) (10,988) (10,253) (14,768) (12,315) (11,597) (17,526) (13,735) (13,039) (20,523) (14,830) (14,162) (23,351)
Assumptions for each respective scenario are for financial modelling purposes only
and would require community consultation, Council endorsement and the necessary legislative approvals before implementation.
A summary of each scenario is as follows:
Scenario 1 – Conservative (Original rate cap 1.3%)
The future sustainability of Council is dependent upon generating sufficient funds to meet the costs of maintaining and renewing assets to deliver services.
In this scenario, budget parameters are set at conservative levels including a rate increase of 1.3% in line with IPART’s original determination. The outcome is that Council would not generate sufficient funds to continue providing current service levels or renew its assets when required.
Scenario 2 – Standard (Approved Additional Variation rate cap 2.5%)
Under this scenario (currently applied), financial sustainability continues to be challenging, due to a number of financial impacts brought about by the covid-19 pandemic that Council will need to review in the near future. The assumption of the approved additional special variation on the rate cap announcement of 2.5% for 2022-2023 and the estimated rate cap of 2.5% for the period of 2024 to 2032 has been used.
Scenario 3 – Strategic (authorised rate cap & increased service levels)
Under this scenario, budget parameters are set at levels designed to slightly increase service levels including a rate increase of 2.5%, an estimated rate cap of 3% for the period of 2024 to 2032 has been used and a more realistic capital works program and slightly enhanced service levels.
The outcomes from this scenario places financial sustainability under pressure due to increased service level costs without a compensating revenue source.
1. Introduction
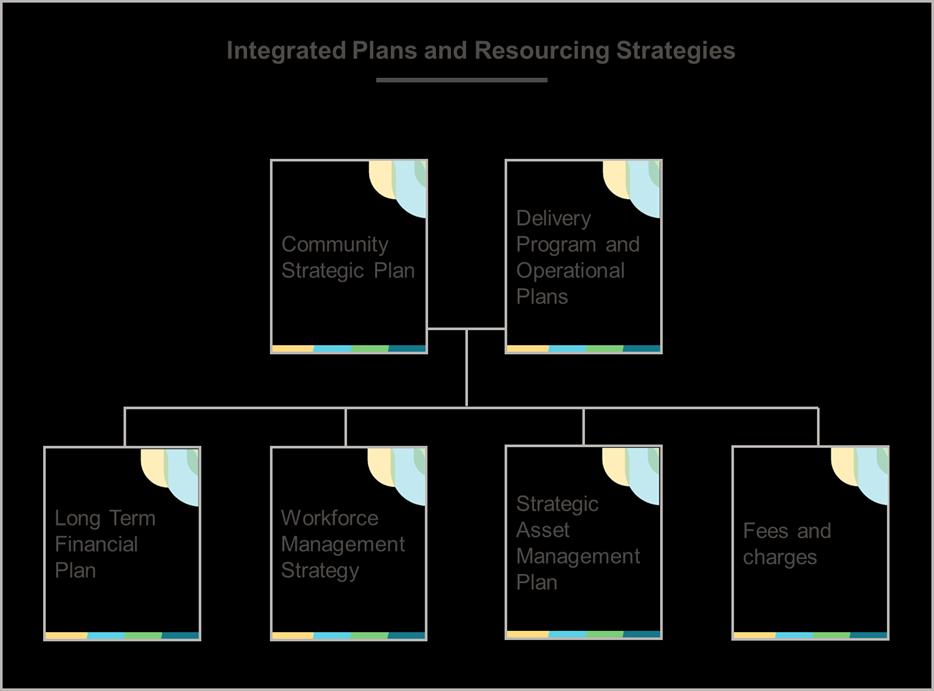
The LTFP is a critical document that forms part of the NSW Government's Integrated Planning and Reporting (IP&R) framework required for all of local government. It is one of a number of resourcing strategies that also includes the Strategic Asset Management Plan (SAMP) and the Workforce Management Strategy. These documents show how a council will deliver the community aspirations as outlined in the Community Strategic Plan (CSP) and spelt out in the Delivery Program and Operational Plans.
Council’s key objective when managing its financial resources is to remain financially sustainable and demonstrate our long term capacity to deliver the strategic objectives in the CSP, Delivery Program and Operational Plans.
The LTFP must:
project financial forecasts for the Council for at least ten years; inform Council's decision-making during the finalisation of the CSP, development of the Delivery Program, delivery of priorities outlined in the SAMP; and be updated annually as part of the development of the Operational Plan. Council’s LTFP needs to ensure financial sustainability for Council and demonstrate our long term capacity to deliver the strategic objectives in the Community Strategic Plan, Delivery Program and Operational Plans.
The LTFP must be structured to include the following:
projected income and expenditure, statement of financial position and cash flow statement; planning assumptions that were used in the Plan’s development; a sensitivity analysis which highlights the factors and assumptions most likely to impact on the Plan; financial modelling for at least three different scenarios, eg the planned scenario, an optimistic scenario and a conservative scenario; and methods of monitoring financial performance.
It is essential the LTFP adopted by Council provides a level of certainty to the community regarding Councils financially sustainable, but also demonstrates:
an acceptable balance of meeting community expectation; sound financial management; the achievement of strategic objectives within any rate increases;
outcomes that are clear and measurable; and have community and Council support.
In addition to acting as a resource plan, the LTFP further endeavours to:
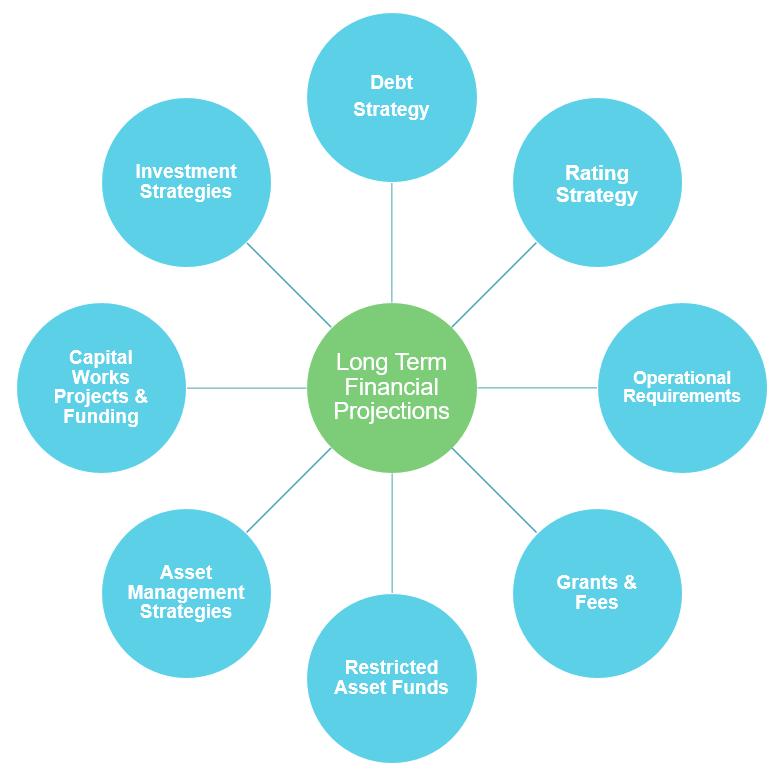
Establish a prudent and sound financial framework, combining and integrating financial strategies to achieve a planned outcome; Establish a financial framework against which Council’s strategies, policies, and financial performance can be measured; Ensure that Council complies with sound financial management principles and plans for the long term financial sustainability of Council; and Enable Council to carry out its functions in a way that facilitates local communities to be strong, healthy and prosperous (Section 8B of the Local Government Act 1993). This LTFP represents a comprehensive development of long term financial projections by documenting and integrating the various financial strategies of Council. When combined, it produces the financial direction of Council as shown in the following diagram:
1.2 Objectives and Preferred Outcomes
The objectives of this LTFP are:
An increased ability to fund asset renewal requirements; An enhanced funding level for capital works in general; Maintenance of Council's financial sustainability in the long term; Incorporation of rate and fee increases that are both manageable, sustainable and politically acceptable; Inclusion of investment and funding strategies which promote intergenerational equity; Demonstration of Council's ability to be Fit For The Future; Demonstration that external conditions are considered; eg changes in interest rates and population growth; and Thorough financial modelling to consider all financial alternatives.
In preparing the LTFP, each of the above objectives has been addressed to achieve the following outcomes.
aspirational financial sustainability goals that will see Council increase resilience to external shocks. reducing the infrastructure backlog to ensure Council infrastructure is maintained at a satisfactory level; achieving a financial structure where new assets or existing asset renewal needs are met from the base operating income of Council; and retention of service provision at present levels.
1.3 Financial Challenges
The challenge of financial sustainability is one faced by the majority of NSW councils and Port Stephens Council is not immune from this issue. Some of the financial challenges affecting Council over the last few years include:
significant increases in utility prices (phone, water and electricity); increase in the Construction Industry Output Price Indexes; state and Federal Government cuts to operating grants and subsidies state and Federal Government cost shifting and increased compliance tasks; reduced investment income as a result of continued low interest rates; successive rate caps below labour market increases. service restrictions due to COVID-19 are revenue streams are down and costs up. This has highlighted Council’s commercial risks. increasing impacts of natural disasters and weather events Despite these challenges Council has previously been successful in developing strategies to remain financially sustainable. These strategies include:
implementation of a Treasury model across each Group within Council; a rolling services review across all areas of Council; and ensuring adequate funding strategies are in place and adhered to growing non rate revenue streams rationalising of land assets and commercial development
Council is committed to being financially sustainable. This requires Council to take a holistic approach to balance its resources. Key steps taken by Council to address the unprecedented times it finds itself in include establishment Financial Sustainability Committee establishment of the Financial Sustainability & Prosperity Fund set aspirational financial sustainability goals sought independent advice confirming internal data analysis and forecasts of Council’s financial position
1.4 Sensitivity analysis
Long term financial plans are inherently uncertain given the lengthy period of time which they are required to cover and the assumptions that are required to be made. Some of these assumptions have a relatively limited impact if they are incorrect; others can have a major impact on future financial plans. The three scenarios within the LTFP allow Council to model the potential impact of various assumptions and is a critical management tool.
Quarterly Budget Reviews provide the ability to regularly monitor the LTFP forecasts against actual activity, update assumptions and make amendments that have a permanent impact on the Plan. Council also reviews and updates relevant sections and projections of the Long Term Financial Plan on an annual basis.
1.5 Key Assumptions
The LTFP and the financial models are based on a number of key assumptions.
Additional Special Variation 2022-2023
Council is subject to an annual rate capping regime to be determined by The Independent Pricing and Regulatory Tribunal (IPART) each year and as such IPART instructs Council to assume a rate cap increase of 2.5% when preparing their Long Term Financial Plan (LTFP) and upcoming financial year budgets.
In December 2021, IPART announced the 2022-2023 rate cap for local governments of 0.7%, with Port Stephens Council granted a new additional population growth factor of 0.6%. This was strikingly lower than the anticipated 2.5%.
In March 2022, IPART announced it will accept a one-off additional round of 2022-23 Special Variation Applications (ASV) for Council’s who demonstrate a financial need such that, in the absence of a special variation, Council would not have sufficient funds to meet its obligations as identified in its 2021-22 Long Term Financial Plan (LTFP) as and when they fall due in 2022-23.
Council submitted an application to IPART to lift the rate cap back to the assumed 2.5% increase to be retained in the rate base by the 29th of April 2022. On the 20th June 2022 IPART announced the approval of Council’s application. The additional forecasted income will be used to fund community services as exhibited in the 20212022 range of IP&R documents as well as assist in closing the financial sustainability gap driven by the implications of the COVID-19 pandemic on Council’s financial position. As a result of the approved application, Council will implement a rate cap factor of 2.5% in the LTFP and alongside the Statement of Revenue Policy.
Certainty of Revenue Streams
Projections of revenue streams over the next ten years are based on historic trends, planned pricing methodologies, known and recurrent grants, current statutory prices and the assumption of the continuation of annual rate capping. Pricing methodologies are aimed to provide services in a sustainable manner, with the community's capacity to pay taken into consideration.
Due to the level of support received from the Financial Assistance Grant (FAG) program, any reduction in the overall available funds for distribution is likely to result in a diminished allocation to Council. This will have a direct impact on the level of works able to be delivered by Council.
A major risk contained within the LTFP for the Standard and Strategic scenarios relates to the assumed 2.5% rate cap limit for years 2 to 10. A 0.5% reduction, will have an impact of approximately $300K in revenue. This in turn will have a significant impact on the services and asset management functions that can be delivered.
None of the modelling includes land sales or royalties. This is due to the uncertainty of market expectations. If these transactions do occur they are adjusted for via the QBR process or in the baseline year which the LTFP is projected from.
Accuracy of Expenditure Estimates
Projections of operating expenditure over the next ten years is based on a combination of CPI assumptions, specific increases and one-off expenditure where known. In the case of infrastructure maintenance costs, expenditure required to maintain service levels is based on asset management projections. Capital expenditure estimates mainly relate to infrastructure renewal, based on the service levels required and Council's current asset condition data.
With the ongoing impacts of COVID-19 there is increased uncertainty of expenditure estimates. If any of the assumptions in relation to the projected expenditure vary, then Council has the opportunity to modify service provision and asset management practices in order to recover any negative impacts.
2. Other Resourcing Strategies
2.1 Workforce Management Strategy
As employment costs are a large proportion of Council's operational expenditure, effective workforce planning and management is critical to long term financial sustainability.
The Workforce Management Strategy assists Council plan its human resource requirements for the next three years and to ensure the necessary staff resources are in place when and where they are needed. An appropriate workforce is a critical element to successfully delivering each of Council's plans.
The Workforce Management Strategy establishes Council's human resource hierarchy which informs the required level of employment remuneration in the LTFP. Council delivers a diverse range of more than 300 services which have been grouped into discrete service packages. They are delivered under the following organisation structure:
Corporate Services Group responsible for internal service provision; Development Services Group responsible for enabling balanced growth; Facilities and Services Group responsible for external service delivery; and General Manager's Office responsible for provision of strategic leadership and governance. In addition to outlining the resourcing requirements of the organisation, the Workforce Management Strategy outlines a number of strategies that Council has or will implement in order to meet the challenges of providing appropriately qualified staff for today and the future.
The financial modelling suggests that each scenario would affect the Workforce Management Strategy as follows:
Scenario 1 – Conservative
Under this scenario, there would be a need to review the human resource levels and strategies as outlined in the Workforce Management Strategy due to financial constraints.
Scenario 2 – Standard
Under this scenario, there would be no change to the current human resource levels and strategies as outlined in the Workforce Management Strategy.
Scenario 3 – Strategic
Under this scenario, additional funds are allocated to increasing service levels by a very modest amount each year, which would potentially require additional recruitment, or outsourcing.
2.2 Strategic Asset Management Plan
Council is responsible for a large and diverse asset base. These assets include roads, bridges, footpaths, drains, libraries, childcare centres, halls, parks, sporting facilities, fleet, land and information communication technology-related assets.
Council's Strategic Asset Management Plan (SAMP) is a comprehensive record of Council's asset maintenance, renewal and construction of new infrastructure. It aims to prioritise works according to key factors such as asset condition and safety, community priority and efficient service delivery. The LTFP is dependent on information provided in the SAMP to develop long term financial plans to deliver actions articulated in the SAMP.
The Local Government Act 1993 states:
The following principles of sound financial management apply to councils:
Council spending should be responsible and sustainable, aligning general revenue and expenses.
Councils should invest in responsible and sustainable infrastructure for the benefit of the local community.
Councils should have effective financial and asset management, including sound policies and processes for the following:
- performance management and reporting;
- asset maintenance and enhancement;
- funding decisions; and
- risk management practices.
Councils should have regard to achieving intergenerational equity, including ensuring the following:
- policy decisions are made after considering their financial effects on future generations;
- the current generation funds the cost of its services.
Over time, Council has greatly increased its assets, which has consequently increased its depreciation, operation and maintenance costs and contributed to the ageing asset base.
Infrastructure assets are a significant part of Council's operations with depreciation alone accounting for around 14-15% of Council’s annual operating budget.
In order to manage this asset base, strategies and plans have been developed and designed to address issues regarding asset life cycles and risk. These strategies and
plans ensure that priorities are aligned to organisational objectives. Finance and expenditure should also be planned and controlled in line with these priorities. Resources should be used as effectively and efficiently as possible and technical levels of service that relate to compliance requirements in legislation should be maintained.
The SAMP ensures Council’s infrastructure, buildings and other assets are managed to an appropriate standard. The SAMP highlights, based on condition ratings, when and what assets require replacement and forecasts how that can be achieved in a financially sustainable manner. Key issues within the SAMP affecting the LTFP include:
ensuring an appropriate amount of asset maintenance expenditure is allocated;
there is an appropriate mix between asset renewal and the construction of new assets in order to meet community needs; and
asset renewal programs are prioritised based on condition ratings.
The SAMP also estimates the levels of depreciation required for assets based on asset age, obsolescence and condition rating. Any change to the SAMP estimates would have a significant impact on Council’s operating result.
The financial modelling suggests that the SAMP would affect each scenario as follows:
Scenario 1 – Conservative
Under this scenario, there would be an increase in the asset backlog due to financial constraints affecting Council's ability to service and renew its asset base. As a result the capital works and maintenance schedules would have to be scaled back in order to maintain financial sustainability.
Scenario 2 – Standard
Under this scenario, there would be no change to the capital works program outlined in the SAMP. Securing grants or the ability to use developer contributions may bring forward some works within the schedule.
Scenario 3 – Strategic
Under this scenario, there would be no change to the capital works program outlined in the SAMP. Securing grants or the ability to use developer contributions may bring forward some works within the schedule.
3. Planning Assumptions
Council's LTFP, associated scenarios and resulting financial models have been based on a number of key planning assumptions.
Service Levels
For the conservative and standard scenarios, the LTFP is based on the assumption that the current levels relating to services is maintained in line with the CSP within the limits of available funding. The range of services is based on those identified as part of the community consultation process undertaken when developing the CSP, the Delivery Program and Operational plan as adopted by Council.
Infrastructure
For all 3 scenarios the LTFP is based on the assumption that no major new capital works are undertaken in the next ten years other than those funded by Contribution Plans, Voluntary Planning Agreements and/or Reserves. For new major works to be undertaken, existing planned asset renewal funding would need to be reallocated to those works or appropriate grant funding for the works being obtained.
Population Growth and Demographic changes
The LTFP is based on existing local government area (LGA) boundaries and the assumption that Council's projected population movement over the next ten years will not be significant. This may result in an increasingly older population placing increased pressure on existing infrastructure and services.
Economic Growth
The LTFP is based on moderate economic recovery for Council and the LGA as a result of COVID-19. However, as indicated in the CSP, Council will continue to focus on supporting business and local jobs through the tourism and economic strategies.
Interest Rates
The LTFP is based on stable interest rates and an investment portfolio reflecting projected income and expenditure. Interest rates during 2021/2022 were low due to reductions in the official cash rate. It is anticipated that rates will start to increase in the near future. Council has been proactive in locking in low interest rates where possible. Whilst it is recognised that interest rates will fluctuate over a ten year period, the financial modelling is based on an average constant interest rate over the LTFP timeframe.
COVID 19
All 3 scenarios assume that no services are closed as a result of COVID-19 infections with the level of economic recovery differing between the 3 scenarios.
4. Financial Position
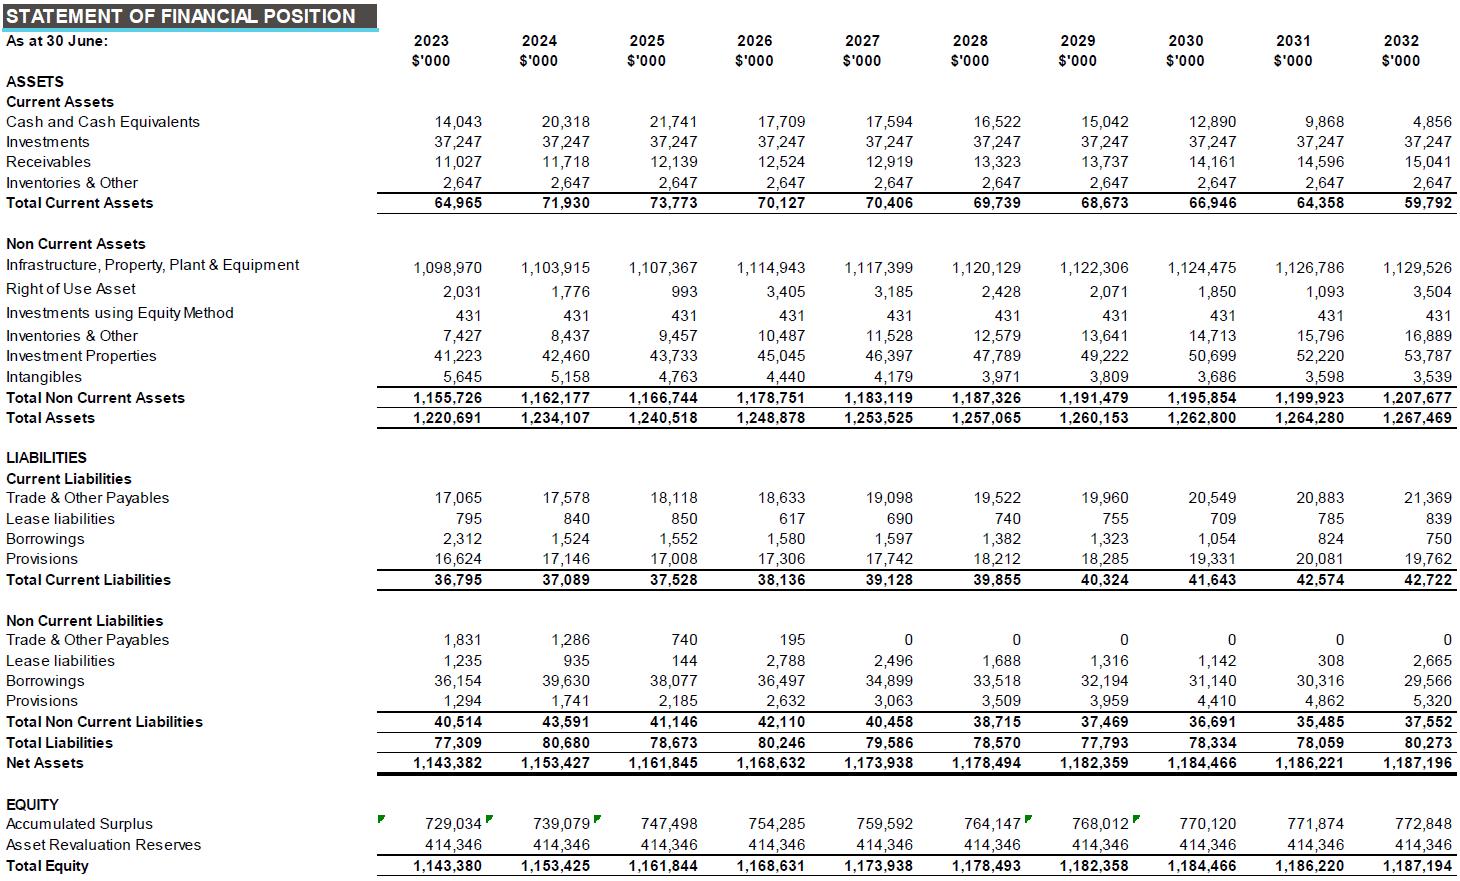
The Statement of Financial Position discloses the assets, liabilities and equity of Council. The table below displays Council's reported Balance Sheet as at 30 June 2021.
Statement of Financial Position (Balance Sheet) Actual 2021 $'000 Current Assets
Cash & Investments Receivables Inventories & Other Assets
Total Current Assets
57,687 9,673 2,647
70,007
Non-Current Assets
Investments Receivables Inventories & Other Assets Infrastructure, Property, Plant, Equipment, Intangibles & ROU Assets Investments using the equity method
Total Non-Current Assets Total Assets
1,102 160 52,929 1,040,969 431
1,095,591 1,165,598
Current Liabilities
Payables & Contract liabilities Provisions Borrowings & Lease liabilities
Total Current Liabilities
21,627 16,268 3,797
41,692
Non-Current Liabilities
Payables & Contract liabilities Provisions Borrowings & Lease liabilities
Total Non-Current Liabilities Total Liabilities
Net Assets
Equity
2,922 776 32,803
36,501 78,193
1,087,405
1,087,405
As shown, Councils main assets and liabilities are: Cash & Investment Infrastructure, Property, Plant, Equipment, Intangibles & ROU Assets Borrowings & Lease Liabilities Provisions Payables The following discusses strategies, assumptions and risks in ensuring Council's statement of financial position remains in a financially sustainable state.
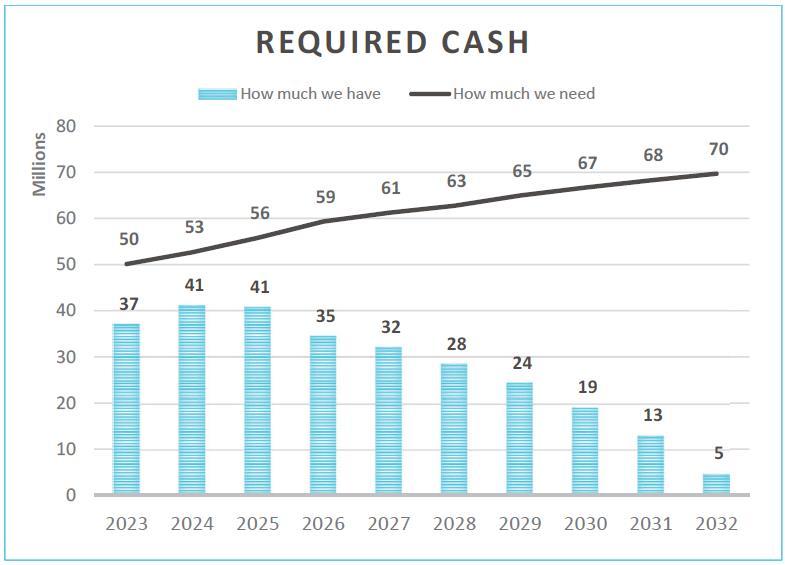
4.1 Cash and Investments
Maintaining adequate cash levels and cash flow is vital in ensuring Council can deliver service to the community. Council has policies in place to ensure its portfolio is managed appropriately however there are challenges with such restrictions. Council is required by statute or other external conditions to restrict assets (predominately cash and investments) for specific purposes in future periods. These restrictions are called Externally Restricted Assets. In addition to external restrictions Council, like other councils in NSW, has also resolved to hold assets in the same way to fund works or expenses in future periods.
Where the decision to restrict assets is made by Council and is not required by legally enforceable external conditions, it is referred to as an Internally Restricted Asset. Internally Restricted Assets held by Council currently fall into five groups (a listing and overview of each restricted asset is attached):
Net revenue streams held for specific purpose Provisions held as cash to meet possible or probable future expense Allocations for future projects Allocations for asset maintenance Investment
In relation to externally restricted reserves, the LTFP reflects projected reserve movements and balances as determined by the programs' respective ten year plans. Internally restricted reserves over the next ten years are projected in line with the expected timing of the specific expenditure the reserves are aimed at funding.
A large part of Council's cash restrictions is to fund future capital work projects. A listing and policy statement on Councils cash reserves can be found at Appendix 1.
It is apparent that future cash flows will not be sufficient to cover projected levels of cash restrictions and as such urgent remedial action is required. The Financial Sustainability Committee is tasked with reviewing all financial aspects of the organisation with a view to increasing cash flows. While additional cash has been forecast for fees and charges and source additional revenue has been identified it is apparent that this will not be adequate to fund cash restrictions. Expenditure commitments will need to be further reviewed, over and above austerity measures recently employed to assist with a positive cash flow.
4.2 Infrastructure, Property, Plant and Equipment
The Local Government Code of Accounting Practice and Financial Reporting states that comprehensive revaluations are to be undertaken on all assets at a minimum of every five years. Although historically the Office of Local Government (OLG) provided a fixed revaluation schedule, the OLG no longer mandates when each class of asset is subject to a comprehensive revaluation.
The financial modelling presented does not factor in any revaluation increases in any of the asset categories because of the difficulty in quantifying. Revaluations generally reflect the changes in market conditions or construction costs. As a result, revaluation increases can negatively impact on the rate of annual depreciation incurred, affecting Council's performance indicators.
A revaluation decrement can also indicate the decline in asset values, which can occur for a number of reasons. Decrements may indicate permanent impairment in the asset value and thus require a write down in its value. Such write downs have not been factored into any scenario.
Council also becomes liable for maintenance of assets and spaces provided and paid for by the developers of residential estates one year after they are created. There are a number of areas that have potential for future growth and potential for new residential estates to be built. Council may become liable for maintenance of assets and spaces provided by the developers of these residential estates.
At this stage these maintenance costs have not been quantified. When the costs are quantified, they will be included in future updates of the LTFP.
Future increases in the number of rate assessments has been estimated conservatively taking into consideration the environmental and conservation constraints placed on large scale residential and commercial developments in the Port Stephens LGA.
4.2.1 Fleet Management
Council is committed to ensuring that the current fleet of vehicles and machinery is appropriately maintained and replaced when economically feasible to do so. In line with the ten year fleet purchasing program, an annual sum of $2m, in addition to any operating surplus achieved out of the fleet business unit, is recommended to be set aside from general revenue, to the Fleet Fund.
5.2.2 Business technology
As part of Council's ongoing service delivery, an annual sum of $1m is made available from general revenue to the Business Technology Fund to provide an ongoing source of funds to ensure that Council's business technology is maintained at an appropriate level.
4.3 Debt Management (Borrowings)
5.3.1 Borrowing Strategies
Many NSW councils are debt averse and view the achievement of a low level of debt or even debt free status as a primary goal. Others see the use of loan funding as being a critical component of the funding mix to deliver much needed infrastructure to the community.
Council recognises that loan borrowings for capital works are an important funding source for local government and that the full cost of infrastructure should not be borne entirely by present day ratepayers but be contributed to by future ratepayers who will also benefit. This concept is frequently referred to as 'intergenerational equity'.
In combination, the financial sustainability ratios measure a council's ability to generate sufficient revenue to enable it to maintain asset renewal and maintenance at an optimum level and to use debt funding to spread the burden of the cost of long lived assets and its infrastructure backlog over a period of time to achieve intergenerational equity.
In this context, intergenerational equity means the consideration of the financial effects of Council decisions on future generations. Council’s financial management strategies are aimed at achieving equity between generations of ratepayers whereby the mechanisms to fund specific capital expenditure and operations take into account the ratepayers who benefit from the expenditure and therefore on a user pays basis who should pay for the costs associated with such expenditure. Funding long lived infrastructure assets works through a program of borrowings over a number of years achieves intergenerational equity.
Council will utilise loan funds to undertake capital works only when the asset is of a long term nature. The term of the loan will not exceed the useful life of the asset. A key performance measure of Council's debt strategy is the Debt Service Ratio.
5.3.2 Current Debt Portfolio
Historically, Council’s policy regarding the use of loan funding was that loan funding is only available where the proposed expenditure will result in a future revenue stream that will fund the loan repayments. That is, its commercially focused activities such as the holiday parks, Newcastle Airport and the commercial property portfolio.
Council regularly reviews the loan portfolio for refinancing options where favourable outcomes are possible. During the 2020 financial year Council borrowed $12.5 million to construct a mixture of public infrastructure and commercially focused assets. This saw Councils debt reach its highest ever-unconsolidated level. During 2022 no new loans have been introduced as Council has focused on reducing debt levels.
A critical review of the current debt portfolio has been carried out and a number of loans have been fixed in for a number of years. In an increasing interest rate market this is seen as a prudent management strategy to ensure that debt repayment levels are maintained.
The table below outlines Council’s position in respect of all interest bearing liabilities and the break down between loan borrowings and other long term debt during the past eight financial years.
Debt type
30 June 2014 $'000
30 June 2015 $'000
30 June 2016 $'000
30 June 2017 $'000
30 June 2018 $'000
30 June 2019 $'000
30 June 2020 $'000
30 June 2021 $'000
30 June 2022 $'000*
Loan borrowings 20,497 16,768 13,422 15,308 17,581 13,278 20,997 17,710 14,744
Other long term debt 6,548 6,365 6,290 6,250 6,250 6,250 11,850 14,850 14,850
Total 27,045 23,133 19,712 21,558 23,831 19,528 32,847 32,560 29,594
* Estimated figure
5.3.3 Future loan strategies
No new loans have been included in the Long Term Financial Plan. Council currently has a commitment to borrow $3million for the Raymond Terrace Depot upgrade and $5million for public domain improvements in Nelson Bay. These loans have already been considered by Council and approved, with the timing of the draw down of the loans to now coincide with the works as scheduled.
Council’s loan portfolio includes its consolidated portion of Newcastle Airport Partnership (NAP) and Greater Newcastle Aerotropolis Partnership (GNAP). Newcastle Airport is currently expanding which may require either entity to borrow funds in their own right to deliver infrastructure related projects. Any new debt would then be consolidated and displayed in Councils annual financial report.
4.4 Provisions
Council's main form of provision relates to that of accrued employee leave entitlements. The growth of leave provisions are expensed as they are earned by the employee however the cash outflow may not happen for a period of time. This can expose Council to large sum payments upon employees leaving the organisation. As part of the Workforce Management Strategy, Council has policies in place to ensure employees cannot accrue excessive amounts of leave however there are certain entitlements where employees cannot be directed to reduce. These provisions include:
5.4.1 Vested sick leave
Staff employed by Council prior to or on 26 September 2000, who have not previously waived their right to this provision, continue to have an entitlement for the payment of unused sick leave arising out of the termination of employment. A provision for vested sick leave continues to be included as a liability in the balance sheets of each scenario in this Plan and this liability is slowly decreasing as our workforce ages. For the purpose of the forecast, payments from the provision have been estimated when the eligible employee reaches the age of 65.
5.4.2 Long Service Leave liability
Long service leave entitlements are governed primarily by the Long Service Leave Act 1955 and by conditions in the Port Stephens Council Enterprise Agreement 2018. Council has not actively required employees to take long service leave as it falls due however if the amount of liability becomes excessive it is likely that employees will be encouraged to keep balances within reasonable limits. A provision has been included as a liability in the balance sheets of each scenario in this plan. For the purpose of the forecast, payments from the provision have been estimated when the eligible employee reaches the age of 65.
5.4.3 Local Government Superannuation fund deficiency
Council is party to an Industry Defined Benefit Plan under the Local Government Superannuation Scheme, named The Local Government Superannuation Scheme –Pool B (the Scheme) which is a defined benefit plan that has been deemed to be a ‘multi-employer fund’ for purposes of AASB119 Employee Benefits.
Each sponsoring employer is exposed to the actuarial risks associated with current and former employees of other sponsoring employers, and hence shares in the associated gains and losses (to the extent that they are not borne by members).
Due to a fund deficiency, Council has been required to contribute additional funds to cover the deficiency between assets and accrued liabilities until it is rectified.
5. Financial Performance
Council generates revenue through the levying of general rates and annual charges, user fees, investment income, grants and other income sources.
The revenue generated from the various sources is used to deliver operational programs in line with the adopted CSP. Council's operating budgets are expended in maintaining the infrastructure in Port Stephens such as parks, recreational facilities, roads, bridges, community buildings and community facilities, and in delivering services in line with Council's adopted plans.
These funds are also required to deliver essential services to the community, including waste management services, and community and cultural services. Other services provided include city planning and support services. Apart from direct service delivery, Council also supports other bodies, including emergency services and recreational services by way of contributions and donations. Some expenditure items include employee costs, materials, contractors, legal expenses, utilities, contributions and insurance.
The tables below show Council's audited financial results for the 2020/2021 financial year.
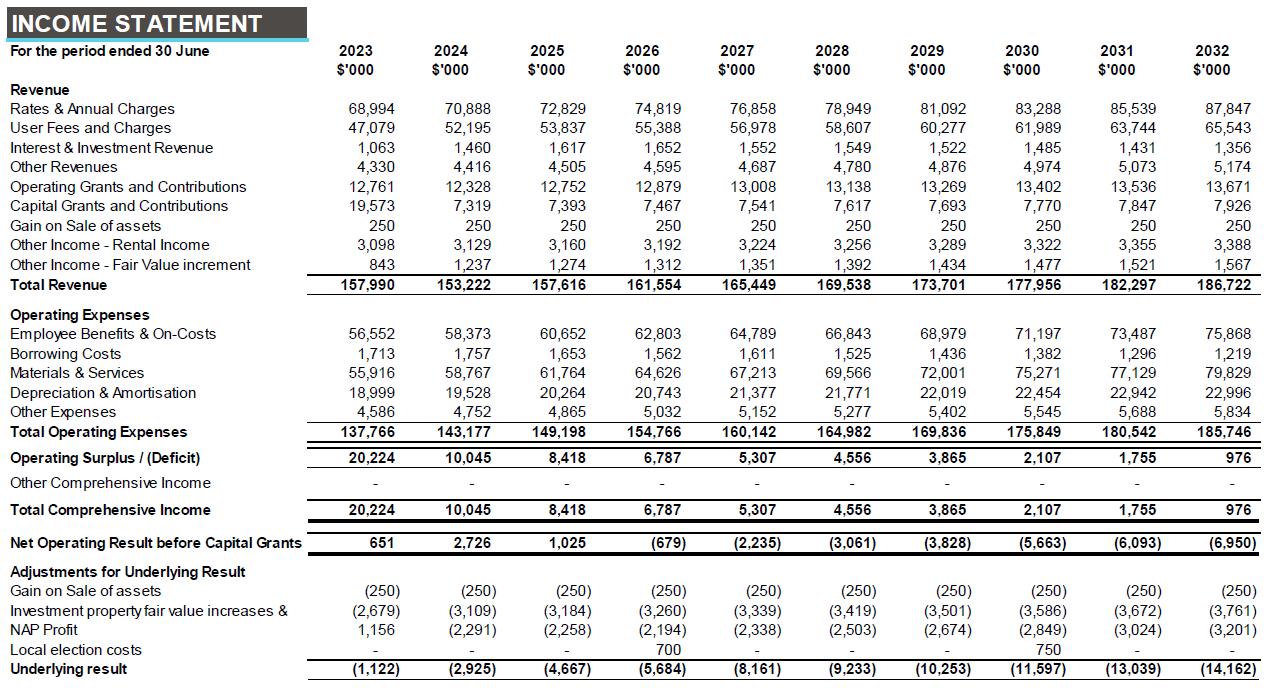
Statement of Financial Performance (Income Statement)
Income from continuing operations
Rates and annual charges User charges and fees Other revenue Grants and contributions Interest and investment revenue Other income Net gains from the disposal of assets
Total income from continuing operations Expenses from continuing operations
Employee benefits and on-costs Materials and services Borrowing costs Depreciation and amortisation Other expenses Net loss from the disposal of assets
Total expenses from continuing operations Operating result from continuing operations Net operating result for the year before grants and contributions provided for capital purposes Actual 2021 $'000
63,396 39,886 4,516 45,024 1,042 4,197 2,349
160,410
51,662 50,601 854 18,331 6,153 -
127,601 32,809 2,817
Potential Impacts on Income and Expenditure
The projected income and expenditure could be impacted by the following:
variations in underlying planning assumptions; changes to legislation and/or relevant regulations; future Council resolutions; major unplanned projects; and service level reviews arising from a community consultation process. service shutdown and increased cost pressures due to COVID-19 Should any of the above situations arise resulting in an impact on the LTFP, it is envisaged that those impacts are taken into account in future annual reviews of the LTFP.
The following analysis provides additional information on each class of income and expenditure shown in the income statement as well as highlighting past trends. A clear statement on future trends and economic assumptions is provided to assist the user of this plan in interpreting the projected outcomes.
5.1 Income
6.1.1 Rates and charges
Ordinary Rates
Approximately 30-40% of Council's annual operating income (not including capital) is derived from the levying of rates and charges. The following table shows the historical trend of rate increases (cap) over the past few years.
Financial Year Rate Cap No. Assessments† Ordinary Rate Yield 2012-2013 3.68% 32,037 $34,915,940 2013-2014 3.47% 32,128 $36,263,573 2014-2015 2.34% 32,324 $37,307,437 2015-2016 2.44% 32,671 $38,490,462 2016-2017 1.83% 33,199 $39,685,207 2017-2018 1.53% 33,608 $40,767,105 2018-2019 2.32% 33,748 $41,806,000 2019-2020 2.70% 34,290 $43,572,563 2020-2021 2.60% 34,500 $44,969,842 2021-2022 2.00% 34,844 $46,296,646 2022-2023* 2.5%* 34,994 $47,454,062
Council's rating strategy and structure is reviewed every year as part of the annual Operational Plan process. Council's proposed rating structure provides for three different categories of ordinary rates: residential, farmland and business. The rate type applicable to a particular property is determined on the basis of the property's rating categorisation. All properties are categorised in accordance with the provisions set out in the Local Government Act 1993.
6.1.2 Comparison of rates with other councils
Comparison of rating between councils is affected by the rating and charging strategies they have each adopted. Some councils rely solely on the ordinary rate for rate income while others levy special rates and annual charges for specific purposes that supplement ordinary rate income.
Income from ordinary rates, special rates and drainage services are subject to State government rate capping while domestic waste management service annual charges are limited to recovering the reasonable cost of providing those services.
Councils may choose a mix of ordinary and special rates and vary those from year to year, however the annual increase in total rate income from all rates is not to exceed the percentage specified by IPART each year. Council currently has no special rates.
The Office of Local Government (OLG) publishes annual comparative information on council rating, financial indicators, service costs and service performance. The information is separated into 11 groups of similar councils based on size and character. Port Stephens Council is placed within OLG's Group 5. The data published by the OLG indicates Councils ordinary rates are low compared with other Hunter Councils and other Group 5 Councils.
Rating assumptions
Scenario 1 and 2 of the LTFP are based on the assumption that Council's rating structure remains unchanged over the next ten years. Any changes in the rating structure would not impact on the total revenue but merely redistribute the income amongst the different categories and sub-categories thereof. Council's rating income or notional yield may be increased from one year to the next up to the rate-capping limit as well as future assumptions of 2.5% determined by the IPART. Apart from grants and contributions, the next largest funding source of the capital works programs is rates. Due to rate capping, Council's ability to increase the scale of the capital works program or introduce new and enhanced services is restricted.
Domestic Waste Charges
Council's Domestic Waste Management Program is self-funded by way of an externally restricted reserve. The Local Government Act 1993 limits annual domestic waste management charges to an amount sufficient to recover the costs of providing the service. As such, revenue from Council's annual domestic waste charges included in this LTFP is based on the projected full cost to provide the waste service over the next ten years. For the 2023 and 2024 financial years the projected charge per household is as follows:
Financial Year Section 406 charge
Section 501 charge
2022-2023 $500.00 $110.00 2023-2024 $512.50 $113.00
It is to be noted that the projected increases in the domestic waste charges reflect increasing cost pressures within the waste services industry as well as projected increases in the Section 88 Waste and Environment Levy imposed on Council by NSW Government.
6.1.2 User charges and fees
For scenarios 2 and 3, user charges and fees have been modelled to increase by 10.0% for non-statutory fees for the first year of the plan and then by 2.5% per year for the life of this plan.
6.1.3 Other income
Other income has been modelled to increase by between 2% and 3% per year for the life of this plan depending on the revenue stream. This income stream is less reliant on inflation therefore a more conservative increase has been used in comparison to the user charges and fees.
6.1.4 Grants and contributions
For scenarios 2 and 3, all operating grants and contributions with the exception of the Roads to Recovery Program grant have been modelled to increase by 1.0% per year for the life of this plan.
The NSW Government's Financial Assistance Grant program was paid in advance (50%) prior to the start of the 2018 financial year. It is expected that the payment schedule will revert back to being paid within the financial year that it relates. The Federal Government's Roads to Recovery Program reverted back to 2013-2014 levels of funding from 2021 and beyond.
Operating grants are quite unpredictable and if a grant has been received in one year there is no guarantee that it will be received again in the following year. Even though the modelling of future operating grants is contained in this plan if a significant number of operating grants are no longer received then the levels of service provided may need to be decreased.
The only capital grants or contributions that have been modelled in the LTFP are those grants confirmed for the immediate financial year, Section 7.11 Developer Contributions and dedicated subdivisions. Any un-forecasted capital grants or contributions that are received would be applied to the Capital Works Plus Program attached to the SAMP.
Council has set an aspirational goal to establish a Grants Co-Contribution Reserve that will be utilised to apply for external grant funding in which a co-contribution is required. This will enhance Council’s ability to apply and fund projects that the community desires and are otherwise unfunded.
6.1.5 Interest income
The level of interest income is dependent on the forecasted cash levels in conjunction with an estimated rate of return. The rate of return has been linked to the expected rate of inflation set for each scenario.
5.2 Expenditure
6.2.1 Employee benefits
6.2.1.1 Port Stephens Council Enterprise Agreement
The Port Stephens Council Enterprise Agreement (EA) applies to all employees of Port Stephens Council. A new agreement is under negotiation with a starting date of 1 July 2021. An increase factor has been assumed for the life of the plan tied to the rate cap that has been applied for that scenario. The projected expenditure is based on the current staff establishment.
6.2.1.2 Compulsory Superannuation Guarantee rates increase
The Federal government has changed the phasing of the increases in the Superannuation Guarantee rate as per the table below. The impact of this change has been factored into all three scenarios of the LTFP.
Year 2022-2023 2023-2024 2024-2025 2025-2026
Rate 10.50% 11.00% 11.50% 12.00%
An increase of 0.5% in in the superannuation guarantee rates equates to approximately $250,000 each year.
6.2.1.3 Learning and development
Council's Workforce Management Strategy identifies future skill and workforce requirements.
Council provides extensive learning and development opportunities and there are education and training opportunities for people of all ages. A yearly learning and development expenditure has been included in the other expenses in the income statement of each scenario in this Plan.
6.2.1.4 Workers compensation
Council places a high priority on workplace safety, commitment to performing safety observations, reporting near misses and implementing many safe workplace policies, Workers Compensation premiums have been increasing in recent years due to significant one off claims. Whilst Council will maintain a strong commitment to worker safety and wellbeing, premiums have been modelled off known levels increasing with inflation. Increases in the premium beyond inflation will require a review of insurance strategies and service levels to ensure financial sustainability is maintained. Any reductions in the premium that does occur due to claims history will benefit Councils operating budget.
6.2.2 Borrowing costs
Council has taken advantage of a declining cash rate over the past two years by installing the majority of its loan portfolio at fixed interest rates. This allows for borrowing costs to be forecasted accurately using existing loan schedules, which remains the same across all three scenarios as well as providing security against impending cash rate increases. Council benchmarks the performance of its loans portfolio against the Reserve Bank of Australia's national average lending rate for large business.
6.2.3 Materials and contracts
Within the draft LTFP a consumer price index of 3.5% has been assumed over the life of the Long Term Financial Plan been based on current economic factors at the time of drafting. It was noted that the assumption may well be insufficient and additional modelling will be required should that be the case. During the exhibition phase the ABS released a new CPI figure of 5.1%. The LTFP has been updated to reflect this change. Clearly this will place additional financial pressures on the organisation that will require further management. It is noted that there is, in all likelihood, a flow on effect to wages and salaries, which at this point have not been adequately modelled.
6.2.4 Depreciation
Council's major non-cash operating expense is depreciation. Council infrastructure, property, plant, and equipment are depreciated using various methods which are
specific to the asset category. These methods include, condition based, consumption based, straight line and diminishing value.
Condition based depreciation methods rely upon a known correlation between the physical characteristics of the asset (for example, cracking, rutting, roughness, and oxidisation) and the relevant remaining useful life.
Consumption-based depreciation is based on measuring the level of the asset’s remaining service potential after taking into account both holistic and component specific factors. It relies upon the determination of a pattern of consumption consistent with the asset’s residual value and path of transition through the various stages of an asset’s lifecycle.
The straight line method of depreciation ensures that there will be no major peaks or troughs in depreciation expense from year to year as this method ensures a uniform rate of depreciation of infrastructure, property, plant and equipment.
The diminishing value method provides for a higher depreciation charge in the first year of an asset’s life and gradually decreasing charges in subsequent years. It is based on the assumption that the asset loses most of its value as soon as it is put into use and the rate of depreciation then reduces over time.
For each scenario the growth in depreciation expense is linked to the annual investment in infrastructure, property, plant and equipment. The depreciation expense ignores the effect of any asset revaluation that is mandatory.
5.3 Other factors
6.3.1 Newcastle Airport Partnership & Greater Newcastle Aerotropolis Partnership
Under the Australian Accounting Standards, Council is required to consolidate and report on its 50% proportionate ownership of Newcastle Airport Partnership (NAP) & Greater Newcastle Aerotropolis Partnership (GNAP). The consolidation process requires the net profit to be included in the income statement and any related transactions eliminated; e.g. the annual dividend. To calculate Council's underlying result the NAP & GNAP profit is deducted and the dividend received from NAP is added back.
Covid-19 has required NAP and GNAP to use a significant proportion of cash reserves.
Council is currently undertaking a financial restructure and as part of that any future dividends will be held in the prosperity fund. The overall aim of the Prosperity Fund is to ensure that the use of excess non-rate revenue is directed towards significant projects, investments or initiatives to achieve the strategies of Council.
6. Financial Performance Indicators
6.1 Fit For The Future
The NSW Government's Fit For The Future (FFTF) Program aims to improve the strength and effectiveness of local government in providing services and infrastructure for the community. It is intended to ensure that councils will be financially sustainable into the future and more capable of being strategic partners with other levels of government. The FFTF Program requires councils to demonstrate that they have the capacity to generate sufficient income to fund the expenditure needed to deliver core services and maintain community assets to a satisfactory standard.
The table below shows Council's current performance against the NSW State Government's FFTF Program and have been taken from the 2020/2021 audited financial results.
Ratio Benchmark Actual 2021 Benchmark Met
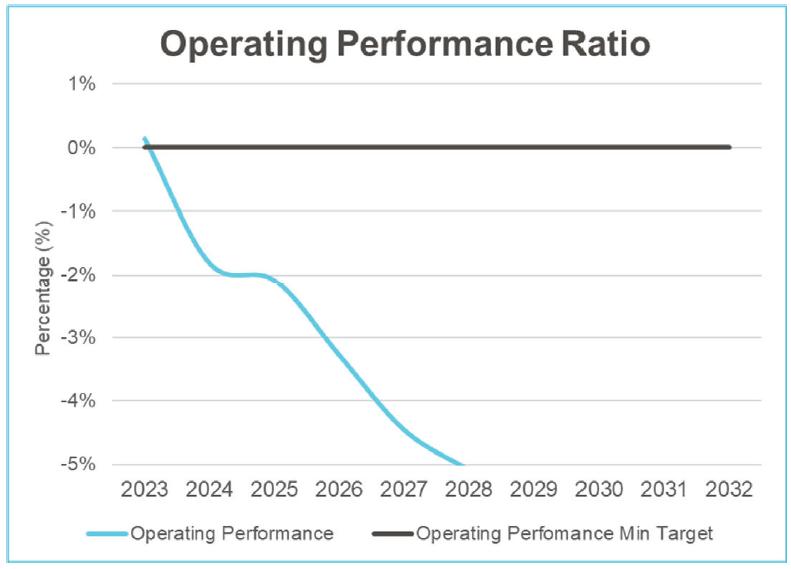
Operating Performance Ratio (OPR) >0%
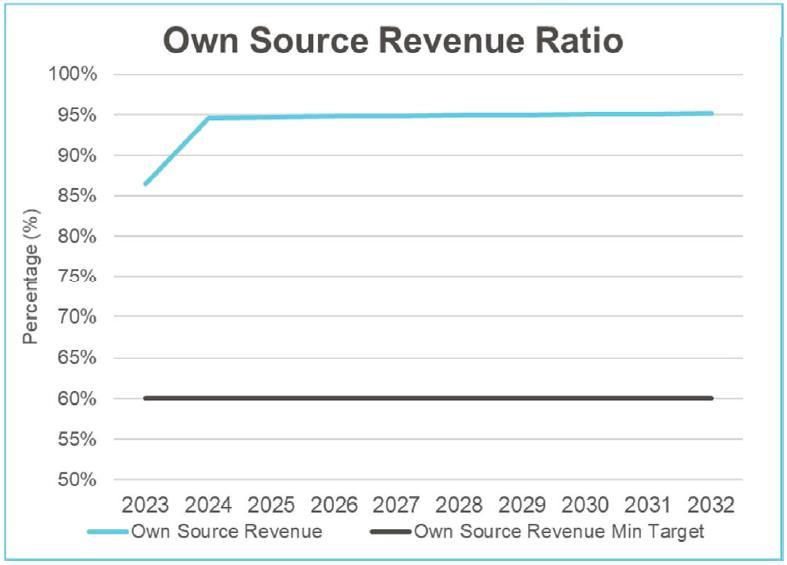
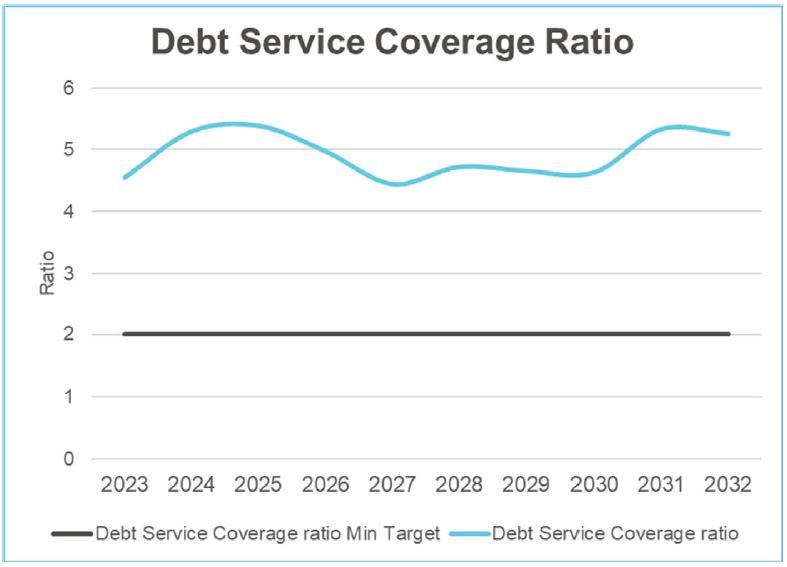
Own Source Revenue Ratio >60% Debt Service Cover Ratio >2x (0.22)% No
71.63% Yes 3.83x Yes Asset Renewal Ratio >=100% 137.78% Yes Infrastructure Backlog Ratio <2% 1.72% Yes Asset Maintenance Ratio >100% 97.09% No
6.2 Additional Performance Monitoring
In addition to the annual FFTF Framework, Council also uses other financial performance indicators on a monthly and quarterly basis. These indicators are intended to be indicative of the financial health and good business management practices at Council.
The endorsed annual budgets aim to achieve identified financial indicator benchmarks. Consequently, budget control and monitoring is paramount for Council achieving the outcomes of the LTFP. Budgets are monitored internally on an on-going basis. Monthly financial reports are reported to senior management and Quarterly Budget Reviews are reported to Council every 3 months to inform on the progress against the adopted budgets.
Each of the following indicators is used in reviewing the reasonableness and financial sustainability of each scenario modelled.
Operating performance ratio
Definition This ratio measures a council’s achievement of containing operating expenditure within operating revenue.
Ratio = Operating revenue excluding capital grants and contributions – operating expenses / operating revenue excluding capital grants and contributions. Analysis The Code of Accounting Practice and Financial Reporting uses a benchmark for the operating performance ratio of greater than 0%.
Own source operating revenue ratio
Definition It is the degree of reliance on external funding sources such as operating grants and contributions. A council’s financial flexibility improves the higher the level of its own source revenue.
Ratio = rates, utilities and charges / total operating revenue (inclusive of capital grants and contributions). Analysis NSW Treasury Corporation uses a benchmark for the Own Source Revenue Ratio of greater than 60%.
Debt service cover ratio
Definition This ratio measures the availability of cash to service debt including interest, principal and lease payments. Ratio = operating results before interest and depreciation (EBITDA) / principal repayments (from the Statement of Cash Flows) + borrowing interest costs (from the Income Statement). Analysis Council uses a benchmark for the Debt Service Cover Ratio of greater than zero.
Asset Renewal Ratio
Definition The building and infrastructure renewals ratio represents the replacement or refurbishment of existing assets to an equivalent capacity or performance, as opposed to the acquisition of new assets or the refurbishment of old assets that increase capacity or performance. The ratio compares the proportion spent on infrastructure asset renewals and the asset's deterioration. Analysis Performance of less than 100% indicates that a Council's existing assets are deteriorating faster than they are being renewed and that potentially council's infrastructure backlog is worsening. Councils with consistent asset renewals deficits will face degradation of building and infrastructure assets over time.
Infrastructure Backlog
Definition The infrastructure backlog ratio indicates the proportion of backlog against the total value of the Council's infrastructure assets. It is a measure of the extent to which asset renewal is required to maintain or improve service delivery in a sustainable way. This measures how councils are managing their infrastructure which is so critical to effective community sustainability Analysis TCorp adopted a benchmark of less than 2% to be consistently applied across councils. The application of this benchmark reflects the State Government's focus on reducing infrastructure backlogs.
Asset Maintenance Ratio
Definition The asset maintenance ratio reflects the actual asset maintenance expenditure relative to the required asset maintenance as measured by an individual council. The ratio provides a measure of the rate of asset degradation (or renewal) and therefore has a role in informing asset renewal and capital works planning. Analysis Performance of less than 100% indicates that a Council's existing assets are deteriorating faster than they are being renewed and that potentially council's infrastructure backlog is worsening. Councils with consistent asset renewals deficits will face degradation of building and infrastructure assets over time.
Underlying Surplus
Definition The underlying surplus is a key measure of Council's true operating result. The calculation involves subtracting income and expenditure transactions that are abnormal in nature (eg disaster recovery efforts) and or as a result of a timing difference (eg capital grants). Analysis Performance of less than 100% indicates that a Council's existing assets are deteriorating faster than they are being renewed and that potentially council's infrastructure backlog is worsening. Councils with consistent asset renewals deficits will face degradation of building and infrastructure assets over time.
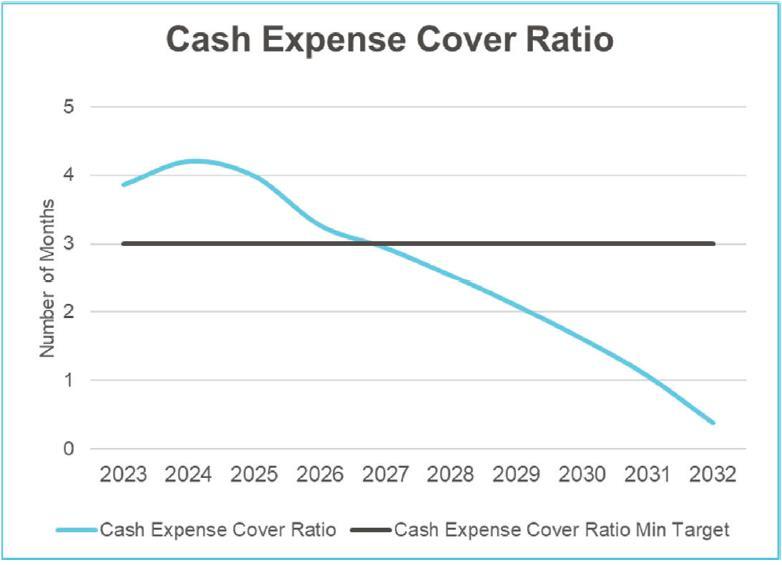
Cash expense cover ratio
Definition This liquidity ratio indicates the number of months a council can continue paying for its immediate expenses without additional cash inflow. Ratio = current year's cash and cash equivalents / total expenses –depreciation – interest costs. Analysis NSW Treasury Corporation uses a benchmark for the cash expense ratio of greater than three.
Rates and annual charges outstanding
Definition Used to assess the impact of uncollected rates and annual charges on Council's liquidity and the adequacy of recovery efforts.
Analysis: The Office of Local Government states a maximum of 5% for metropolitan councils and 10% for all other councils. The performance indicators for each scenario are projected in conjunction with the primary financial statements as appendices to the LTFP.
7. Financial Modelling Assumptions and Results
The LTFP is structured as a series of 'scenarios', each of which shows a specific financial outlook. Each of the scenarios relates to particular Council plans or policies. The scenarios are cumulative so that each scenario incorporates the assumptions and financial outcomes of the previous scenarios. The scenarios can also be looked at in isolation.
This iteration of the LTFP presents financial forecasts associated with the following scenarios:
Income
Rates Rate Capping factor applied 2022 Ongoing cap factor beyond 2022 New annual rates assessment
User fees and charges Annual factor
Operating grants and Contributions Annual factor
Other Cash investment returns Other income Rental income Airport dividend
Expenses
Salaries and allowances Materials and contracts 3.5% beyond 2026 Other expenses Enhanced services levels
Conservative Standard Strategic
1.3% 2.5% 2.5%
2.5% 2.5% 3.0%
150 150 150
2.5% 2.5% 2.5%
1.0% 1.0% 1.0%
2.0% 2.5% 2.5% 2.0% 2.0% 2.5% 1.0% 1.0% 1.0% Nil Nil Nil
Conservative Standard Strategic
2.25% 2.25% 2.25% 5.1% 5.1% 5.1%
2.5% 2.5% 2.5% Additional $250k
Projected Result
2022-2023 2023-2024 2024-2025 2025-2026 2026-2027 2027-2028 2028-2029 2029-2030 2030-2031 2031-2032
Conservative Standard Strategic
(1,676) (1,122) (1,360) (3,682) (2,925) (3,071) (5,449) (4,667) (4,767) (6,467) (5,684) (6,719) (8,918) (8,161) (10,230) (9,982) (9,233) (12,464) (10,988) (10,253) (14,768) (12,315) (11,597) (17,526) (13,735) (13,039) (20,523) (14,830) (14,162) (23,351)
There are many factors that can affect Councils ability to meet all benchmarks which are outside of its control. Some of these factors include:
Changes to State and Federal government policies; Natural disasters; Economic downturn; Cost shifting; and Low level rate capping. If any of these factors were to occur it would affect Councils forecasting and benchmarks. In turn this would require a of service levels to ensure Council remains financially sustainable. The base point used for modelling is the December Quarterly Budget Review for the financial year ended 30 June 2022.
The following information provide more detail on each financially model scenario.
Scenario 1 – Conservative
The Conservative Model represented in Scenario 1 reflects Council's financial position over a ten year period. The basis for the scenario is adopting an assumed 1.3% rate cap. This is the original rate cap for Port Stephens Council as announced by IPART in December 2022. The financial modelling indicates that the performance indicators of Council will not be met which would require a reduction in expenditure on infrastructure assets, or reducing services delivered to the community.
Based on Council's projected income and expenditure over a ten year period, based on existing services and existing service levels, this will mean that Council has a funding gap in regard to its infrastructure funding. Council will therefore need to restrict the level of asset maintenance and renewal in line with funding available. This would be at the cost of rapidly deteriorating assets, therefore pushing the cost to the community potentially resulting in compromised safety and increased residents' dissatisfaction.
The main assumptions underpinning the Conservative model are as follows:
rating income indexed by 1.3% from 2022/2023 onwards; fees and charges indexed by 2.5%; current service levels maintained (non-infrastructure asset services); materials and contracts expenditures indexed by 5.1% (3.5% beyond 2026); employee costs indexed by 2.25%; infrastructure asset maintenance costs based on asset planning models; and infrastructure asset renewal costs based on funding available after all other service levels have been maintained.
Under this Model, Council will not to generate sufficient revenue to renew infrastructure assets at the rate they are deteriorating. This Model demonstrates that based on current budget settings, Council may face an on-going sustainability challenge. Service rationalisation, such as closing down community facilities to obtain cost reductions, is highly likely to be required to ensure ongoing financial sustainability. In addition, the ongoing funding shortfall will result in continuing deterioration of the condition of the community infrastructure and therefore reduce service levels. For example, roads currently in a fair condition would slip into a poor condition if the optimal asset management intervention is not funded.
This Model places the Port Stephens Council financial sustainability in its current form at risk, and is therefore not the optimal long term model to pursue.
See Appendix 2: Conservative Model for a projected Income Statement, Capital Budget Statement, Balance Sheet and Cash Flow Statement and the resulting Sustainability Measures.
Scenario 2 – Standard
The Standard Model represented in Scenario 2 reflects Council's financial position over a ten year period based on all the FFTF indicators attempting to be met. The basis for the scenario is adopting an assumed full 2.5% rate cap. This is the rate cap under an approved additional special variation along with other normal economic factors.
Under this scenario Council will attempt to reduce its infrastructure backlog and continue to renew infrastructure assets at the rate they are deteriorating provided sufficient funding levels are maintained.
Under this scenario Council fails to maintain its financial sustainability in its current form. This Model identifies that there is minimal room to offer additional or enhanced service levels. Doing so without a compensating revenue increase or expenditure decrease would create financial stress on Council resources. This model would not be able to address any residents' expectations on increased service levels or fast tracking of asset renewal.
The main assumptions underpinning the Standard Model are as follows:
rating income indexed by estimated rate capping of 2.5% from 2022/2023 onwards; fees and charges indexed by 2.5%; current service levels maintained (non-infrastructure asset services); materials and contracts expenditures indexed by 5.1% (3.5% beyond 2026); employee costs indexed by 2.25%; infrastructure asset maintenance costs based on asset planning models; and infrastructure asset renewal costs based on funding available after all other service levels have been maintained.
Under this scenario Council will attempt to reduce its infrastructure backlog and continue to renew infrastructure assets at the rate they are deteriorating provided sufficient funding levels are maintained.
This Model also attempts to meet all the benchmarks over the set timeframe with a view that continued improvement program strategies will be delivered.
See page 40 for a projected Income Statement, Capital Budget Statement, Balance Sheet and Cash Flow Statement and the resulting Sustainability Measures.
Scenario 3 – Strategic
The Strategic Model represented in Scenario 3 reflects Council's financial position over a ten year period based on all the FFTF indicators attempting to be met. The basis for the scenario is adopting an assumed 2.5% rate cap.
Under this scenario Council will attempt to reduce its infrastructure backlog and continue to renew infrastructure assets at the rate they are deteriorating provided sufficient funding levels are maintained. An additional $250,000 increase each year to enhancing service level of assets has been provided in this scenario.
This model does address residents' expectations on increased service levels, however under this scenario Council cannot maintain its financial sustainability in its current form. This Model identifies that providing enhanced levels of service without a compensating revenue increase or expenditure decrease would create financial stress on Council resources.
The main assumptions underpinning the Strategic Model are as follows:
rating income indexed by estimated rate capping of 2.5% from 2022/2023 and 3% onwards; fees and charges indexed by 2.5%; service levels increased by $250,000 per year (non-infrastructure asset services);
materials and contracts expenditures indexed by 5.1% (3.5% beyond 2026); employee costs indexed by 2.25%; infrastructure asset maintenance costs based on asset planning models; and infrastructure asset renewal costs based on funding available after all other service levels have been maintained.
This Model also attempts to meet all the benchmarks over the set timeframe with a view that continued improvement program strategies will be delivered.
See Appendix 3: Strategic Model for a projected Income Statement, Capital Budget Statement, Balance Sheet and Cash Flow Statement and the resulting Sustainability Measures.
8. Financial Statements – Standard Scenario
8.1 Standard Scenario – Income Statement
8.2 Standard Scenario – Statement of Financial Position (Balance Sheet)
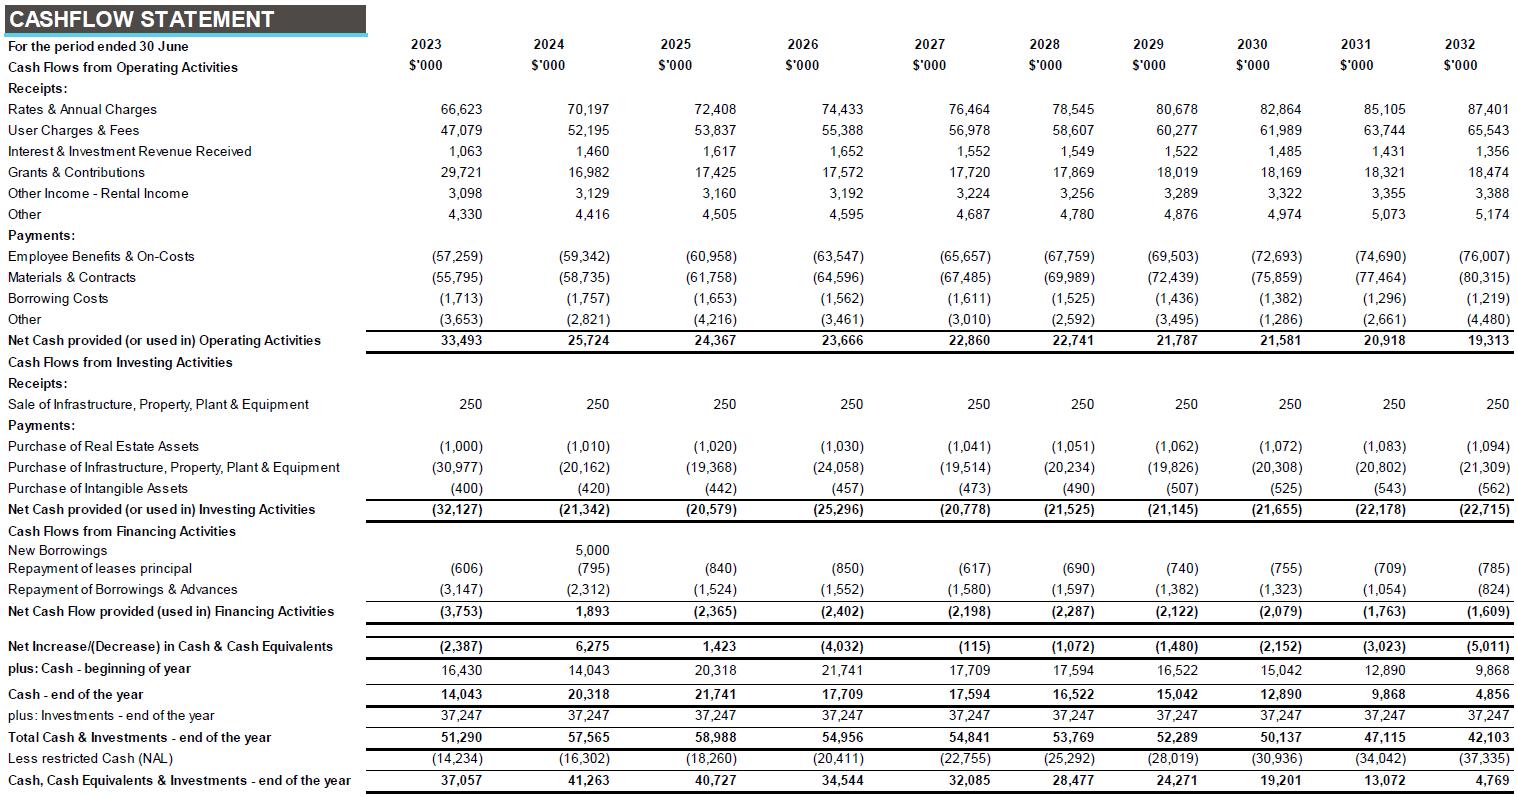
8.3 Standard Scenario – Statement of Cash flows
8.4 Standard Scenario – Graphs
Standard Scenario Graph – Underlying Result
Standard Scenario Graph – Required Cash Levels
Standard Scenario Graph - Operating Performance Ratio
Standard Scenario Graph – Own Source Revenue Ratio
Standard Scenario Graph – Debt Service Coverage Ratio
Standard Scenario Graph - Cash Expense Cover Ratio
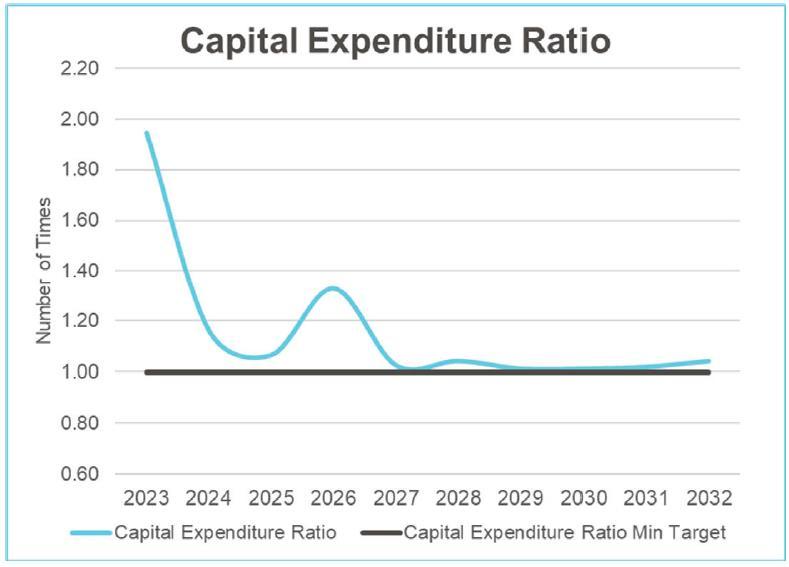
Standard Scenario Graph - Capital Expenditure Ratio
Appendices
Appendix 1: Statement of Restricted Cash
Councils in NSW have traditionally operated with Restricted Asset funds that are amounts of money set aside for specific purposes in later years. In general, these funds do not have bank accounts of their own but are a theoretical split up of the accumulated cash surplus that a council has on hand.
Background
Local government will continue into the foreseeable future to be challenged by a tightening cash position through increasing demands for cash for daily operations, restricted rate income levels, increasing demands for expenditure on new infrastructure and the maintenance and rehabilitation of existing infrastructure. Port Stephens Council is certainly subject to these same pressures, exacerbated by high growth in population and development activity, significant environmental responsibilities and an added responsibility as a quality tourist destination.
A strategic financial response to these pressures is necessary for Port Stephens Council to remain a sustainable community leader.
Objective
Council will from time to time decide, or be required by legislation, to set aside funds for specific purposes for which clear guidelines are set to ensure Council’s cash position and investment portfolio are adequate and managed responsibly.
Principles
Council is the custodian of financial and built assets on behalf of the Port
Stephens community; Council provides works, services and facilities to the community through limited financial means; Council is required to operate within the framework and supporting guidelines of:
- Local Government Act 1993; - Local Government Code of Accounting Practice and Financial Reporting; - Local Government Asset Accounting Manual; - Australian Accounting Standards. A strategic financial plan and associated policies are required to support Council’s service delivery and asset management strategies, ensuring long term financial viability.
Statement
Council will set aside funds as required by specific legislation. These funds will be managed and accounted for so as to comply with the relevant legislation;
Council will also from time to time set aside additional funds for Council's specific purposes;
Restricted funds will be reported in the Annual Financial Statements and reviewed annually against the specified requirements of each fund;
Restricted funds will be reviewed quarterly against the annual budget by the
Section Manager accountable for that fund;
Each specific fund shall be approved by Council and must be supported by a statement which outlines the following: - Purpose of Restricted Funds; - Source of funds; - The apportionment of interest earned on cash held for that fund; - A specific statement including targets, sinking funds, timeframes for accumulation and expenditure of funds; - Accountability for the collection, management and expenditure of that fund; - Relevant legislation or Council Minute supporting the creation of the fund;
Creation of all restricted funds shall be in accordance with this policy;
Expenditure of Restricted Funds shall be in strict accordance with the approved budget, and expenditure shall not exceed funds available without specific
Council Resolution;
Budgeting for the expenditure of profits from land development activities will only occur after the physical receipt of sale proceeds by Council; and
All Restricted Funds are to be 100% cash backed.
Related Council policies
Cash Investment Policy Property Investment Policy Community Groups Loans Policy Land Acquisition and Divestment Policy
Review date
Review of this policy will be undertaken 12 months after the date of its adoption by Council. Should amendments to the relevant legislation occur within that 12 month period, review will take place as near as possible to the commencement of such amendments.
Relevant legislative provisions
Local Government Act (NSW) 1993 Code of Accounting Practice and Financial Reporting Environmental Planning and Assessment Act (NSW) 1979 Crown Lands Act (NSW) 1989 Department of Lands – Crown Lands Caravan Park Policy (April 1990)
Implementation responsibility
Financial Services Section
Definitions
Externally Restricted Funds refers to those funds which have an external restriction, whether by statute or otherwise, which governs the management of money held within the fund.
Internally Restricted Funds refers to those funds which Council has resolved to set up, to hold monies for specific purposes. The operation of such funds is solely governed by Council.
Internal Pooling refers to those monies transferred within Council to cover identified projects, where the money is to be repaid to the restricted fund from a specified source. Internal pooling is subject to specific Council approval and must demonstrate that the pooling of monies for the project will not be unreasonably, over a period of time, prejudice to other future projects.
The following section outlines what restricted assets Council currently holds, their purpose and recommendations for their future.
Nature and purpose of current restricted assets
The more material current restricted asset funds held by Port Stephens Council are:
Deposits, retentions and bonds; Bonds held for developers' works; Section 7.11 & 7.12 developer contributions; Specific purpose unexpended grants; Domestic waste management; Crown Reserves; Employee leave entitlements; Capital asset restricted asset/asset rehabilitation; Drainage restricted assets; Election restricted assets; Business technology fund; Newcastle Airport Partnership; Fleet; Section 355c committees; Unexpended loan funds; Community loans;
Parking meters; Commercial properties; Other waste; Sustainable energy and water; Roads/environmental special rate; Administration building; Ward funds.
Deposits, retentions and bonds
Purpose An external restriction is placed on deposits, retentions and bonds held by Council. Source of Funds Any person or company that has paid a deposit, retention monies or bond to Council.
Bonds held for developers' works
Purpose An external restriction is placed on bonds held by Council.
Source of Funds Any developer that has paid a bond to Council.
Section 7.11 & 7.12 developer contributions
Purpose Section 7.11 & 7.12 of the Environmental Planning & Assessment Act 1979 enables Council to levy contributions because of development. These contributions are essential in providing quality facilities and services to an expanding local population. The Act requires Council to set these funds aside to be used specifically for the provision of these facilities and services. Source of Funds Developer contributions as levied in accordance with Council’s adopted Section 7.11 Plan.
Specific purpose unexpended grants
Purpose An external restriction is placed on grant funding that has been received for a specific purpose that has not been spent by the end of the financial year. Source of Funds Grant funding that is for a specific purpose is provided to Council from various sources.
Domestic waste management
Purpose By virtue of Section 496 of the Local Government Act 1993 (as amended), Council must levy a separate charge for domestic waste management services, which include garbage and recycling services. Under the legislation Council cannot finance these services from ordinary rates so the charge must be sufficient to recover reasonable costs of providing these services. Council is obliged to set these funds aside and use them for their specific purpose. Source of Funds Domestic Waste Services & Management Levy.
Crown Reserves
Purpose Net profits from Holiday Parks and parking meters on Crown Land are retained for reinvestment back into Holiday Parks or other assets on Crown Land. Source of Funds Surplus from the Holiday Parks on Crown Land.
Employee leave entitlements
Purpose To provide funds for employee leave entitlements which have been accrued but not yet paid. Source of Funds General revenue.
Capital restricted assets/asset rehabilitation
Purpose This restricted asset is to set aside monies for major capital works projects. Source of Funds Various sources.
Drainage restricted assets
Purpose This restricted asset is to set aside funds to fund drainage works. Source of Funds Various sources.
Election restricted assets
Purpose To provide funds for the Local Government Elections which are conducted every four years. Source of Funds Funds provided annually from general revenue.
Business technology fund
Purpose This restricted asset is to fund the information technology needs of Council. Source of Funds General revenue.
Newcastle Airport Partnership
Purpose To set aside Council's share of Newcastle Airport Partnership's cash, cash equivalents and investments. Source of Funds Newcastle Airport Partnership.
Fleet
Purpose To provide funds for the purchase of fleet assets. Source of Funds General revenue.
Section 355c committees
Purpose Section 355(c) of the Local Government Act, 1993 allows Council to delegate certain functions. A section 355(c) Committee is an entity of Port Stephens Council and as such is subject to the same legislation, accountability and probity requirements as Council. Funds are set aside for Section 355(c) purposes. Source of Funds Various sources.
Unexpended loan funds
Purpose To restrict the use of cash which has been borrowed externally for a specific purpose but not yet spent. Source of Funds Funds borrowed from banks.
Community loans
Purpose To provide loan funds for community recreational groups to assist with major asset upgrades on Council owned property. Source of Funds General revenue.
Parking meters
Purpose This restricted asset is to set aside funds that are collected from parking meters on Council land to fund future works. Source of Funds General revenue.
Commercial properties
Purpose To set aside net proceeds received from commercial investment property and property development to fund future commercial investments. Source of Funds Surplus from investment property portfolio
Other waste
Purpose To set aside the net proceeds from the Salamander Waste Transfer Station to fund future works. Source of Funds General revenue.
Sustainable energy and water
Purpose To provide a pool of funds that could be used to attract further funding for sustainable developments on Council owned properties. Source of Funds General revenue.
Roads/environmental special rate
Purpose: To set aside revenue received from the roads and environmental special rate for those specific purposes. Source of Funds: General revenue.
Administration Building
Purpose To provide funds for future upgrade and improvement works to the Administration Building. Source of Funds General revenue.
Ward funds
Purpose To provide an annual allocation of funds to assist Councillors to provide facilities in each ward under section 356 of the local government Act. Source of Funds General revenue allocation and an allocation of net proceeds from the sale of commercially developed property.
Purpose To set aside funds in the event of a Natural Disaster to assist with cash flow and unexpected expenditure that is not recoverable. Source of Funds General revenue.
Grants Co-Contribution
Purpose To provide a pool of funds that could be used to secure further grants funding. Source of Funds General revenue.
Financial Sustainability & Prosperity Fund
Purpose To set aside funds from excess non-rate revenue for significant projects, investments or initiatives to achieve the strategies of Council Source of Funds General revenue.
Appendix 2: Scenario 1: Conservative
2.1 Introduction
Scenario 1 of the LTFP shows the financial results of applying the following assumptions:
Income
Rates Rate Capping factor applied 2022 Ongoing cap factor beyond 2022 New annual rates assessment
Conservative
1.3%
2.5%
150
User fees and charges Annual factor
Operating grants and Contributions Annual factor
Other Cash investment returns Other income Rental income Airport dividend
Expenses
Salaries and allowances Materials and contracts 3.5% beyond 2026 Other expenses Enhanced services levels 2.5%
1.0%
2.0% 2.0% 1.0% Nil
Conservative
2.25% 5.1%
2.5% -
2.2 Financial Results
In Scenario 1 the forecast underlying result is regularly in deficit resulting in a substantial loss over the 10 years. The financial modelling suggests this Scenario is not financially sustainable due to the cumulative deficit which would require a review of service levels and infrastructure investment.
2.3 Financial Statements
Scenario 1: Conservative – Income Statement
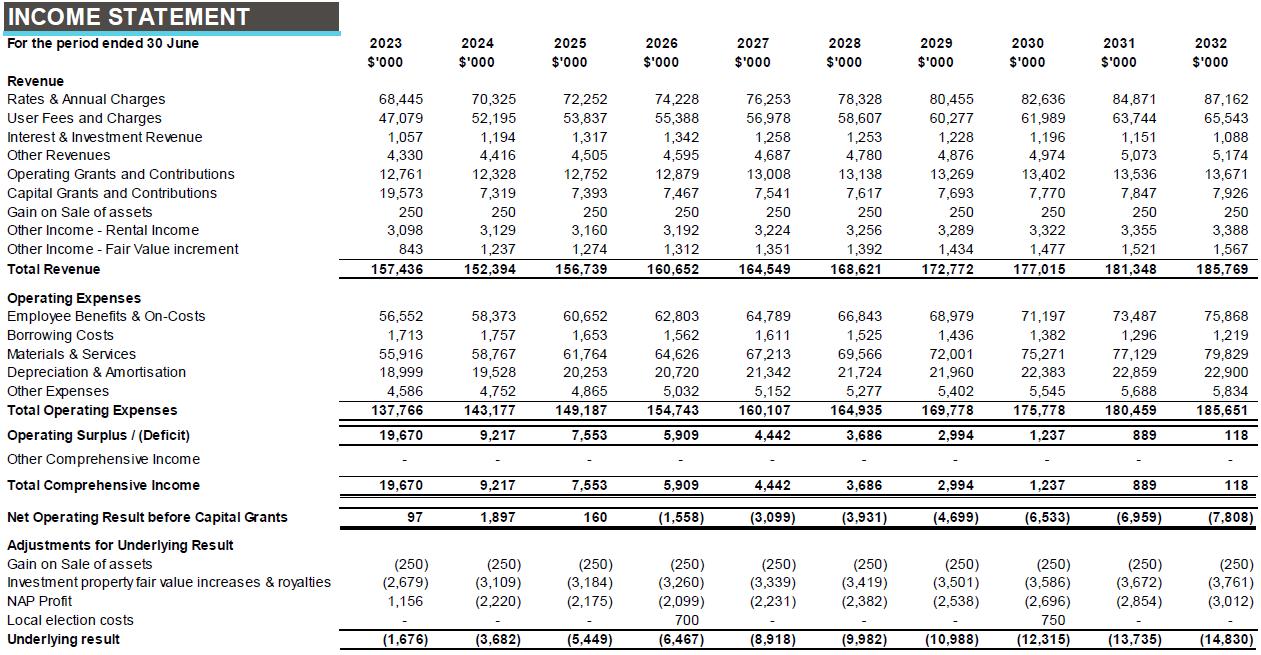
Scenario 1: Conservative – Statement of Financial Position (Balance Sheet)
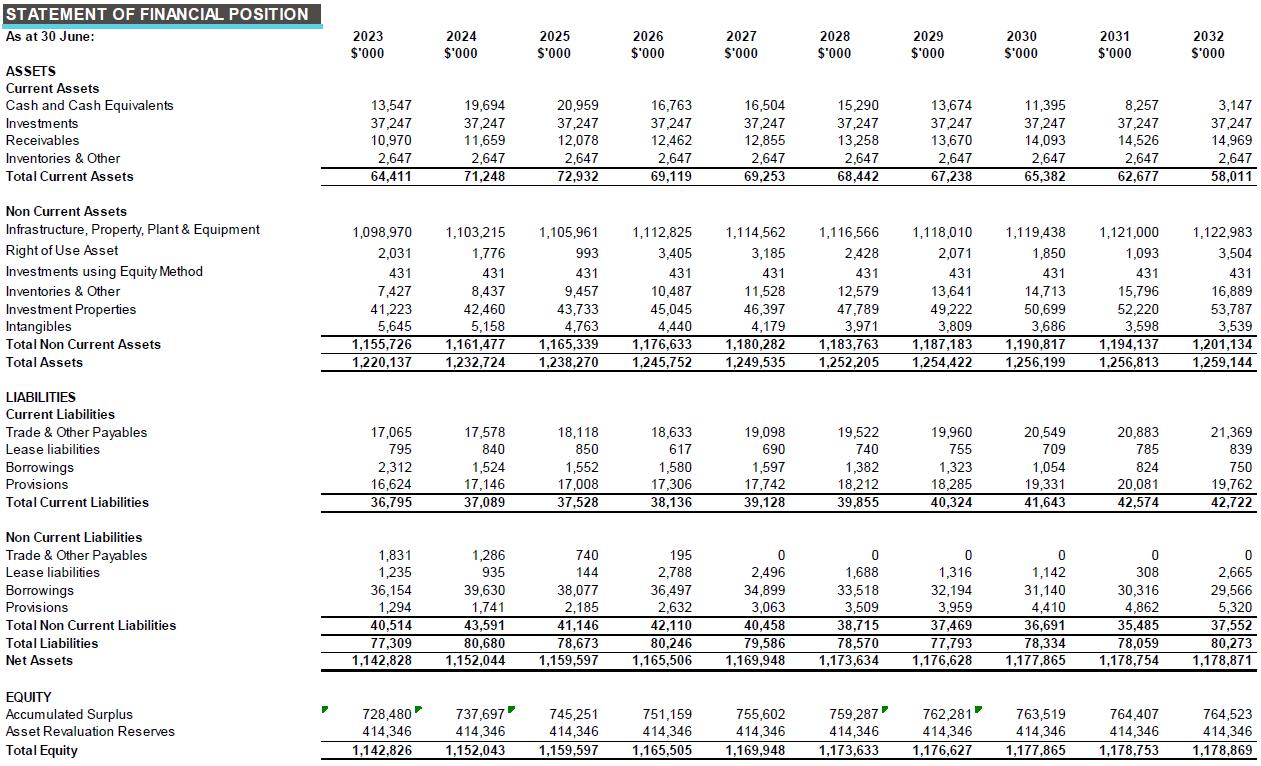
Scenario 1: Conservative – Statement of Cash Flows
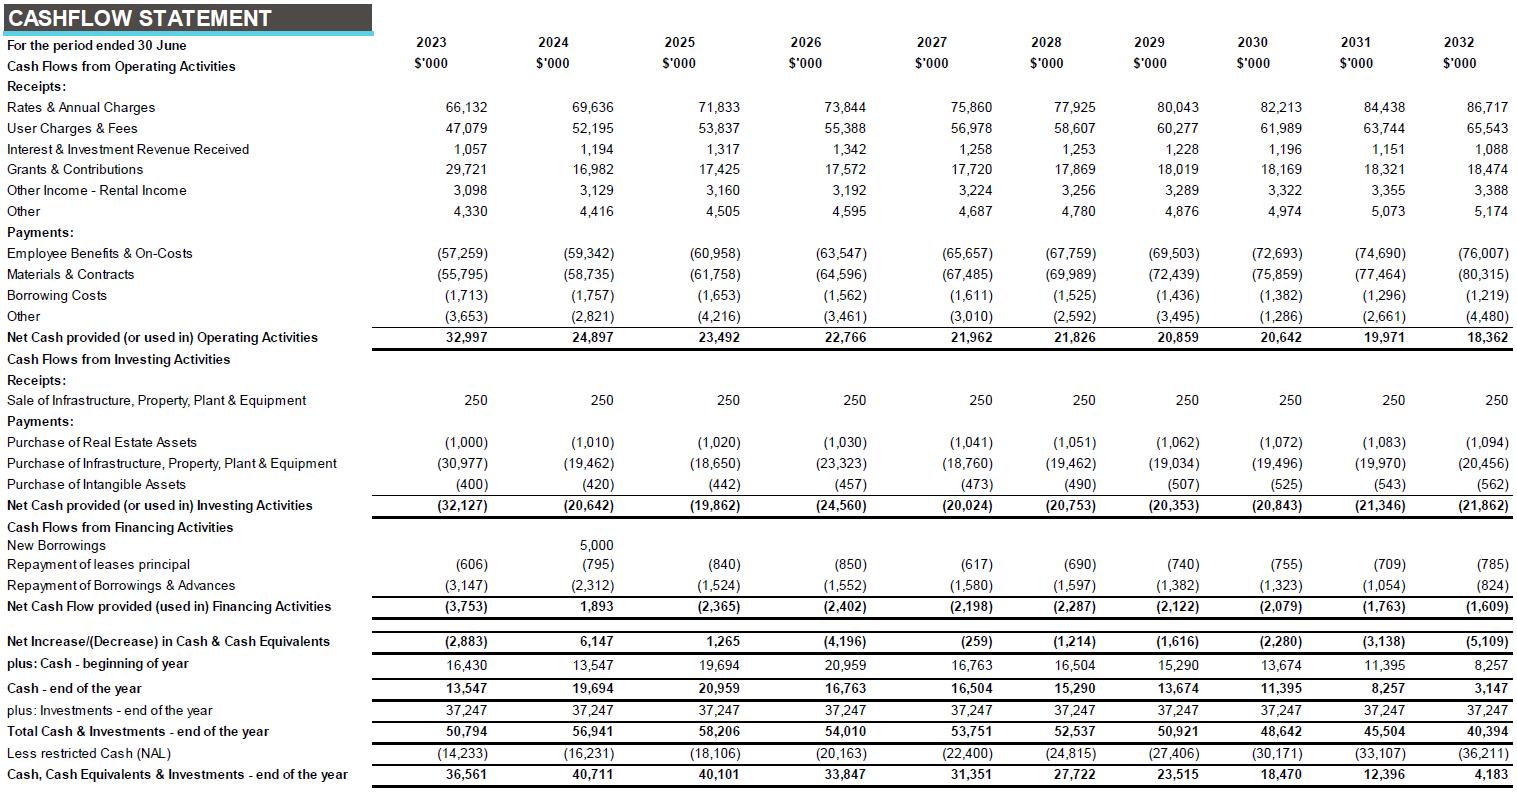
Scenario 1: Conservative Graph - Operating Performance Ratio
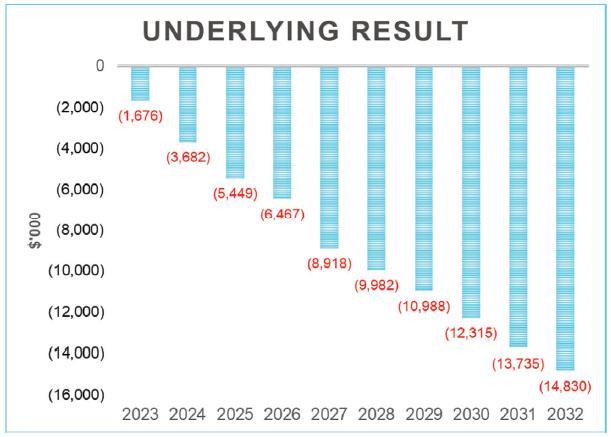
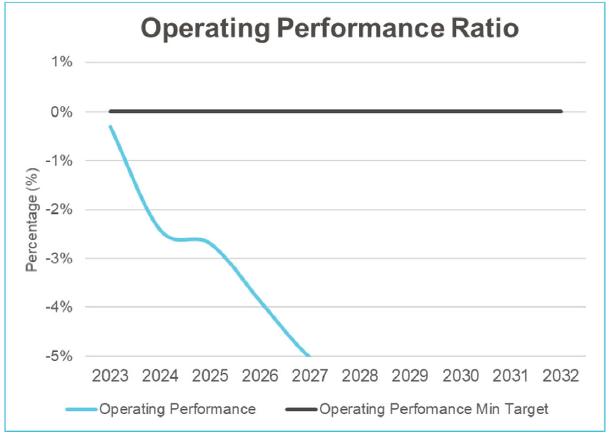
Scenario 1: Conservative Graph - Debt Service Coverage Ratio
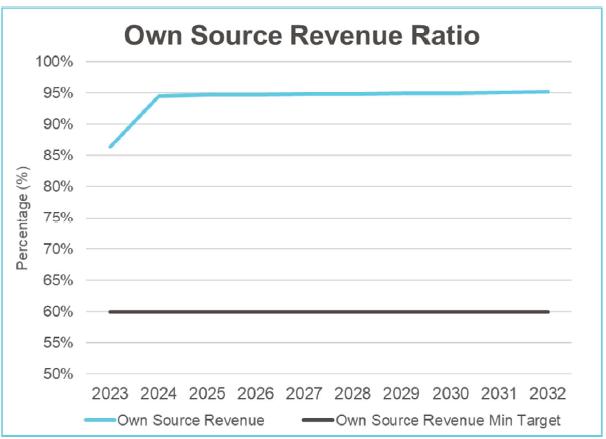
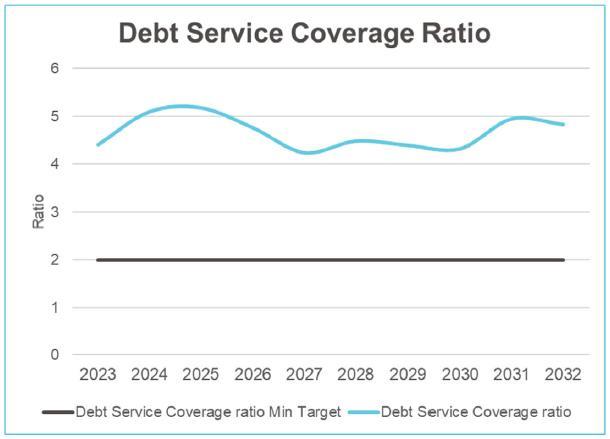
Scenario 1: Conservative Graph - Cash Expense Cover Ratio
Scenario 1: Conservative Graph - Capital Expenditure Ratio
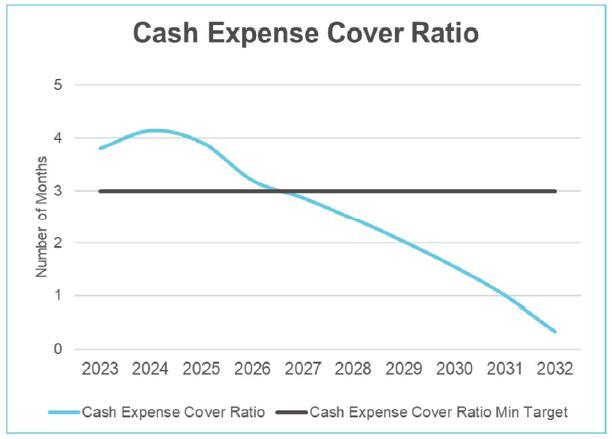
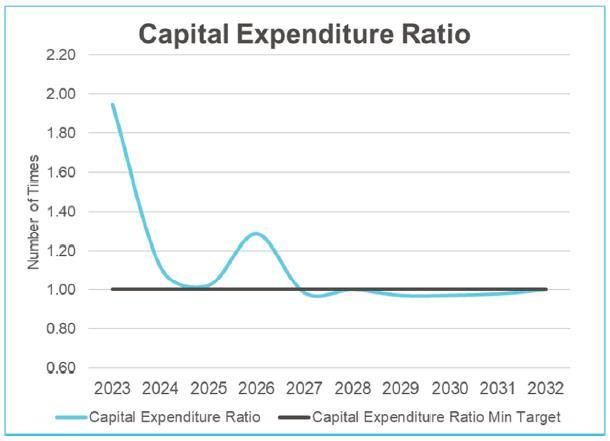
3.1 Introduction
The Standard Scenario of the LTFP shows the financial results of applying the following assumptions:
Income
Rates Rate Capping factor applied 2022 Ongoing cap factor beyond 2022
Strategic
2.5%
3.0%
New annual rates assessment 150
User fees and charges Annual factor 2.5%
Operating grants and Contributions Annual factor 1.0%
Other Cash investment returns Other income Rental income Airport dividend 2.5% 2.5% 1.0% Nil
Expenses
Salaries and allowances
Strategic
2.25%
Materials and contracts 3.5% beyond 2026 5.1%
Other expenses 2.5% Enhanced services levels Additional $250k
3.2 Financial Results
In Scenario 3 the forecast underlying result is in deficit for six out of the ten years. The financial modelling suggests this Scenario is not financially sustainable due to the cumulative deficit which would require a review of service levels and infrastructure investment. The enhanced service levels of an increase of $250,000 per year is not financially sustainable.
3.3 Financial Statements Scenario 3: Strategic – Income Statement
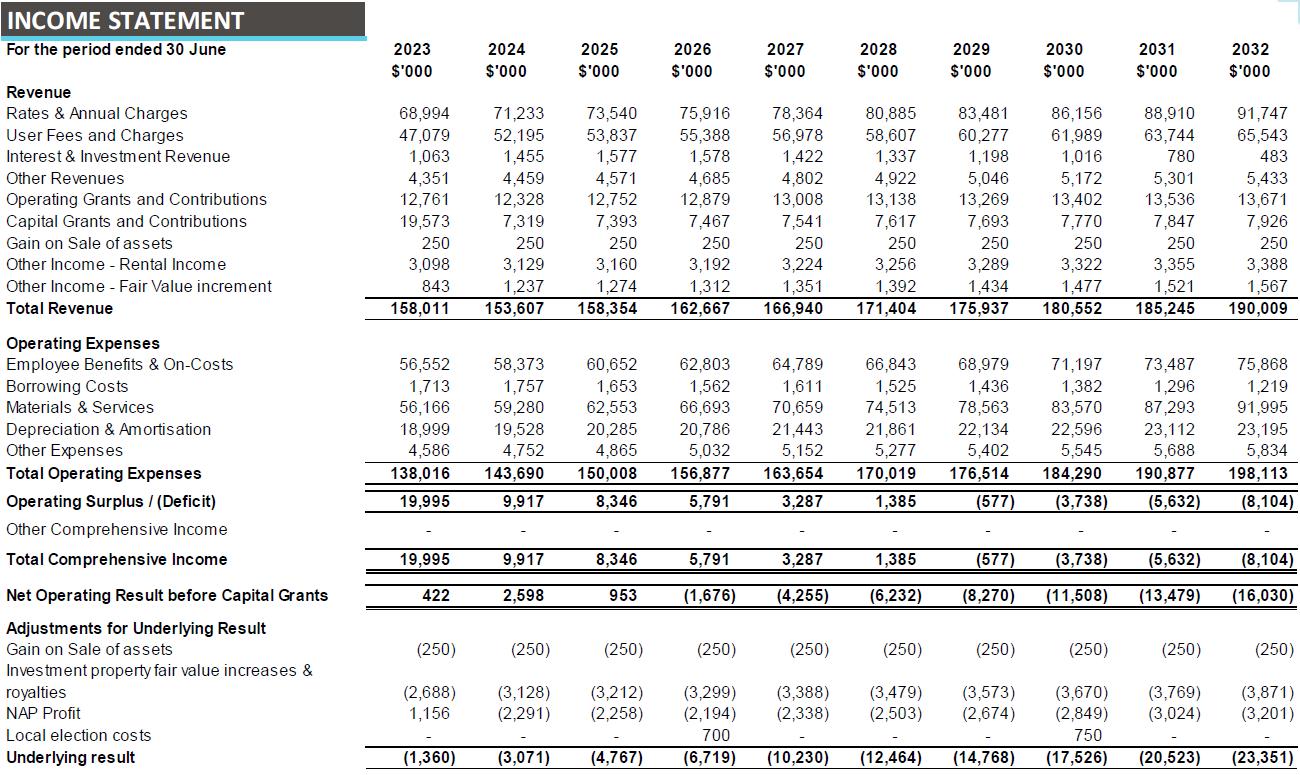
Scenario 3: Strategic – Statement of Financial Position (Balance Sheet)
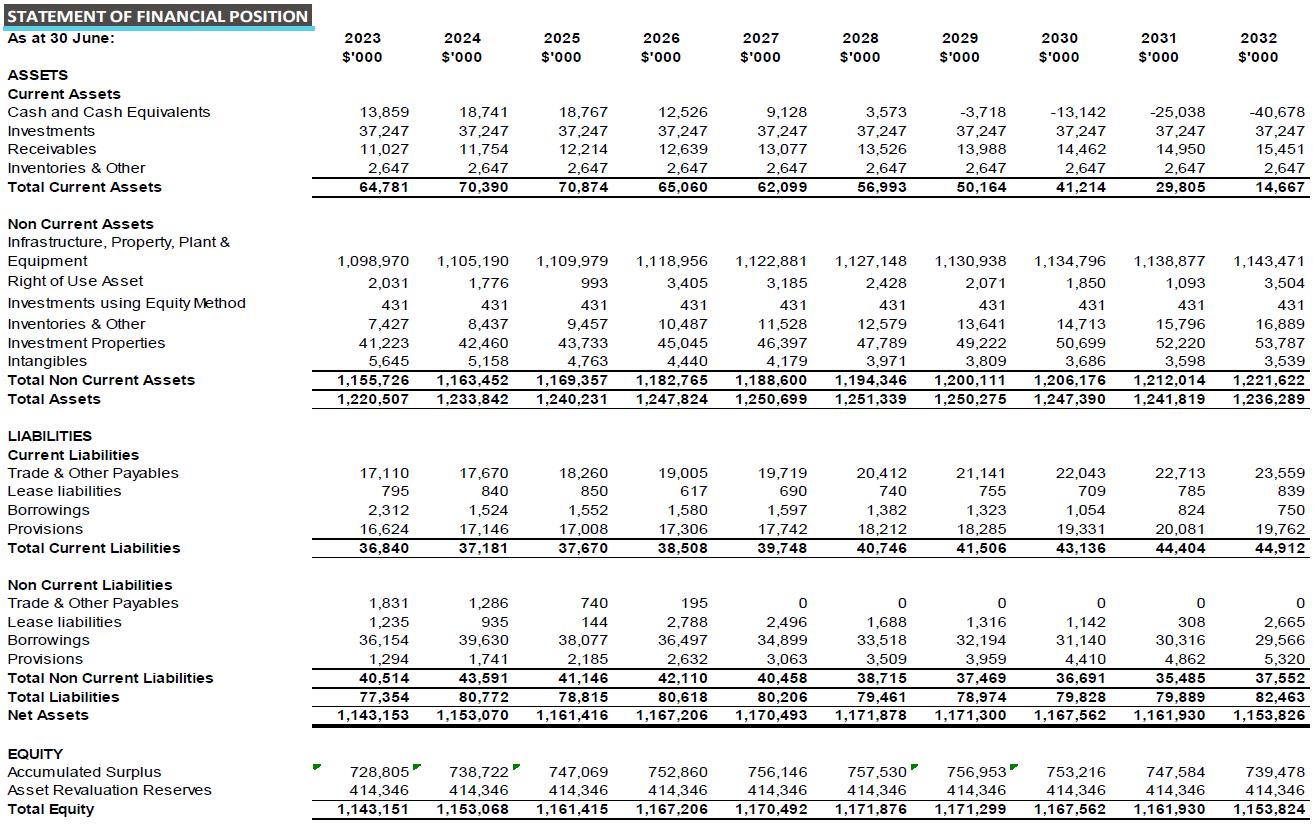
Scenario 3: Strategic – Statement of Cash Flows
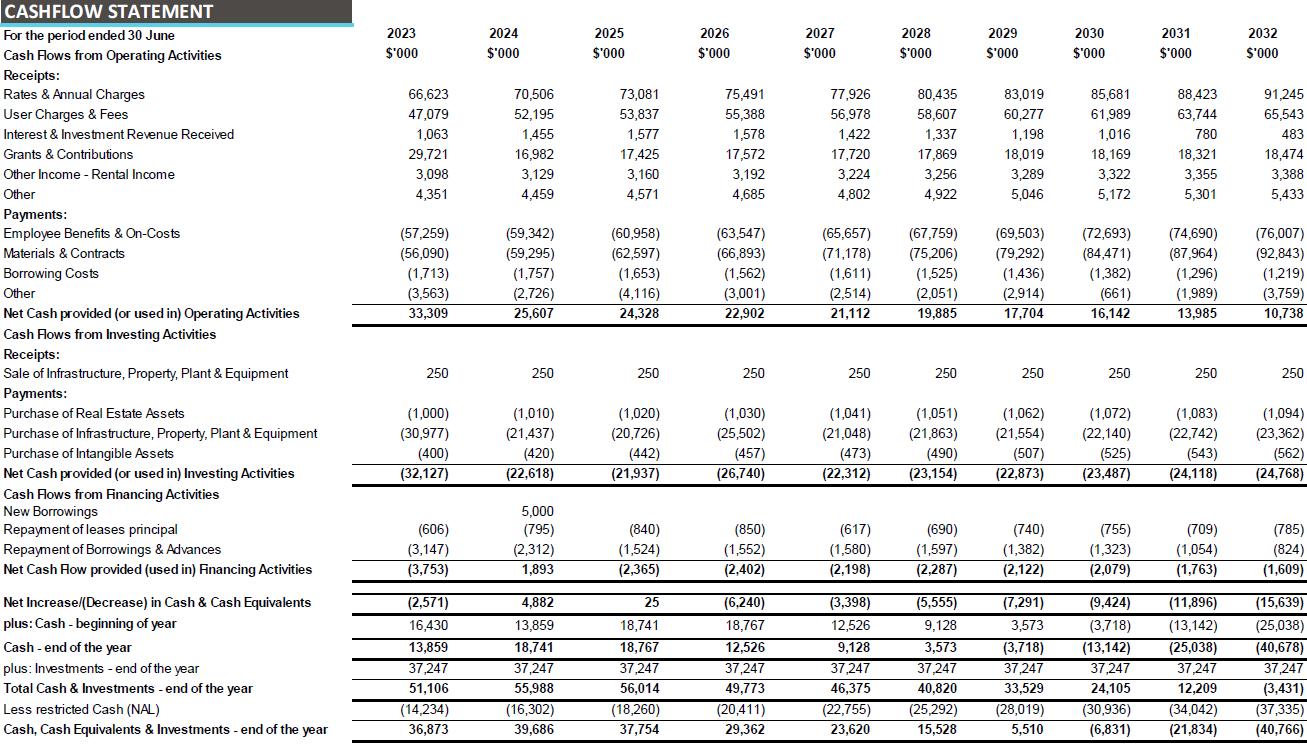
Scenario 3: Strategic Graph - Underlying Surplus
Scenario 3: Strategic Graph - Operating Performance Ratio
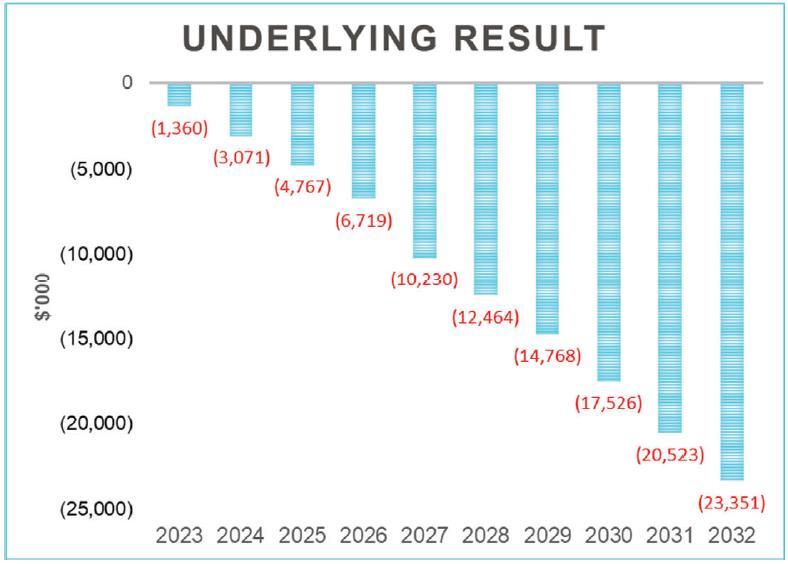
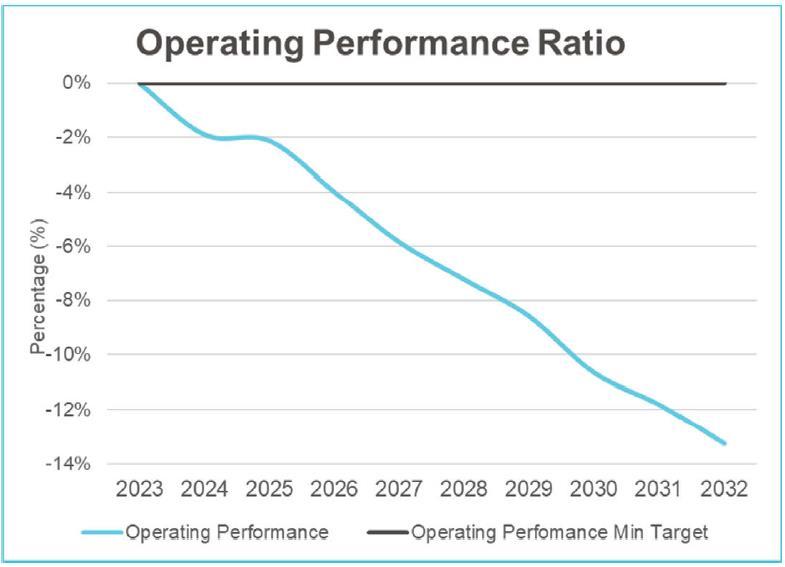
Scenario 3: Strategic Graph - Own Source Revenue Ratio
Scenario 3: Strategic Graph - Debt Service Coverage Ratio
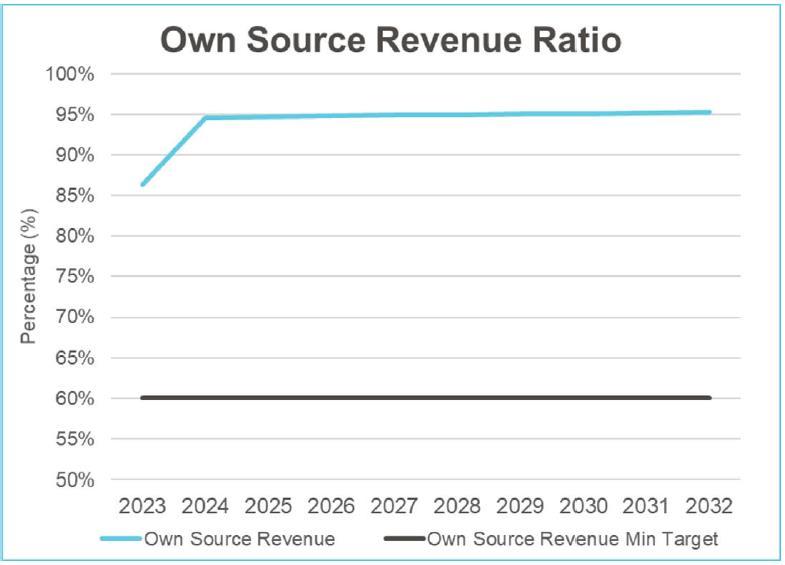
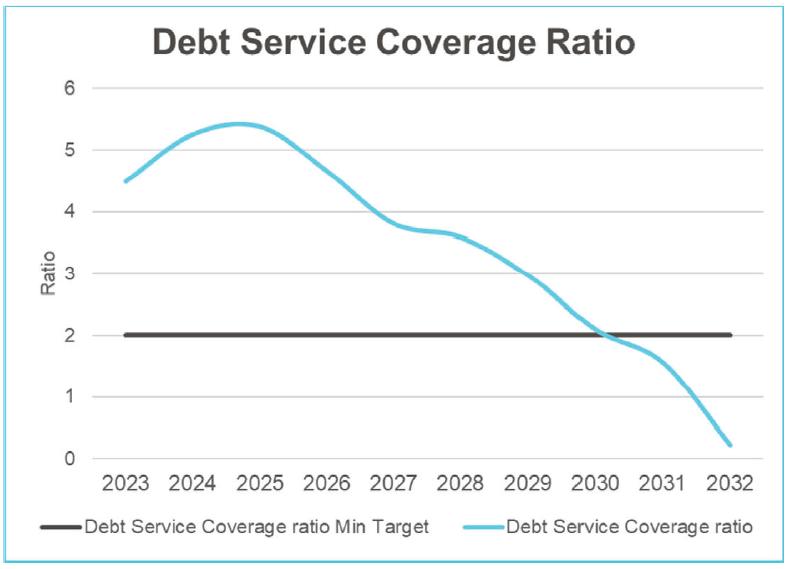
Scenario 3: Strategic Graph - Capital Expenditure Ratio
Scenario 3: Strategic Graph - Cash Expense Cover Ratio
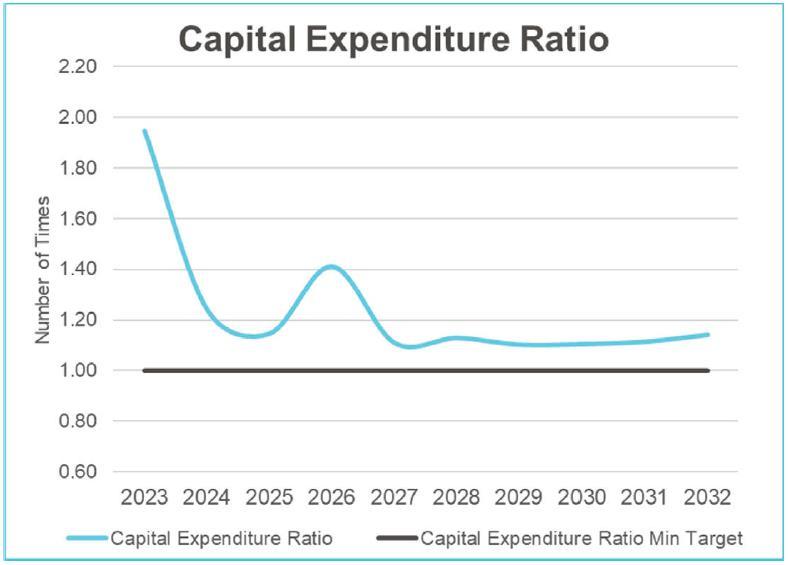
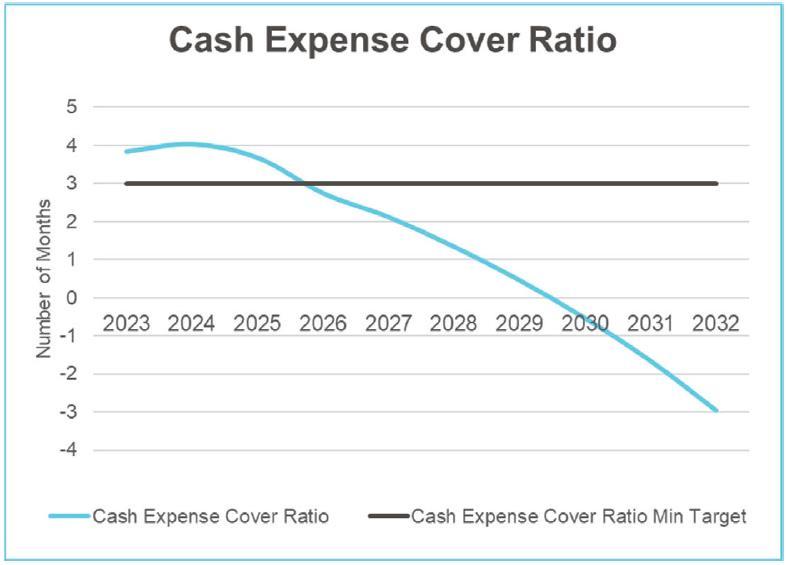
Controlled Document Information
This is a controlled document. Hardcopies of this document may not be the latest version. Before using this document, check it is the latest version; refer to Council's intranet, MyPort.
EDRMS container No.
PSC2021-00626 RM8 record No. Audience General community
Process owner
Financial Services Section Manager Author Financial Services Section Manager
Review timeframe
Annually Next review date 2023
Adoption date
Version History
Version Date Author Details
1.0 21/1/2020 Financial Services Section Manager First draft.
2.0 21/2/2020 Financial Services Section Manager 3.0 12/1/2021 Financial Services Section Manager Final draft.
Minor amendments relating to dates applied.
4.0 14/04/2022 Financial Services Section Manager Minor amendments relating to dates.
Scenarios statements updated to reflect ongoing financial challenges faced by Council as result of COVID19 Pandemic.
Additional reserves, Financial Sustainability & Prosperity Reserve, Natural Disaster Reserve and Grants Co-Contribution Reserve.


